Combined Experimental and Theoretical Investigation on Formation of Size-Controlled Silver Nanoclusters under Gas Phase


Abstract
:1. Introduction
2. Materials and Methods
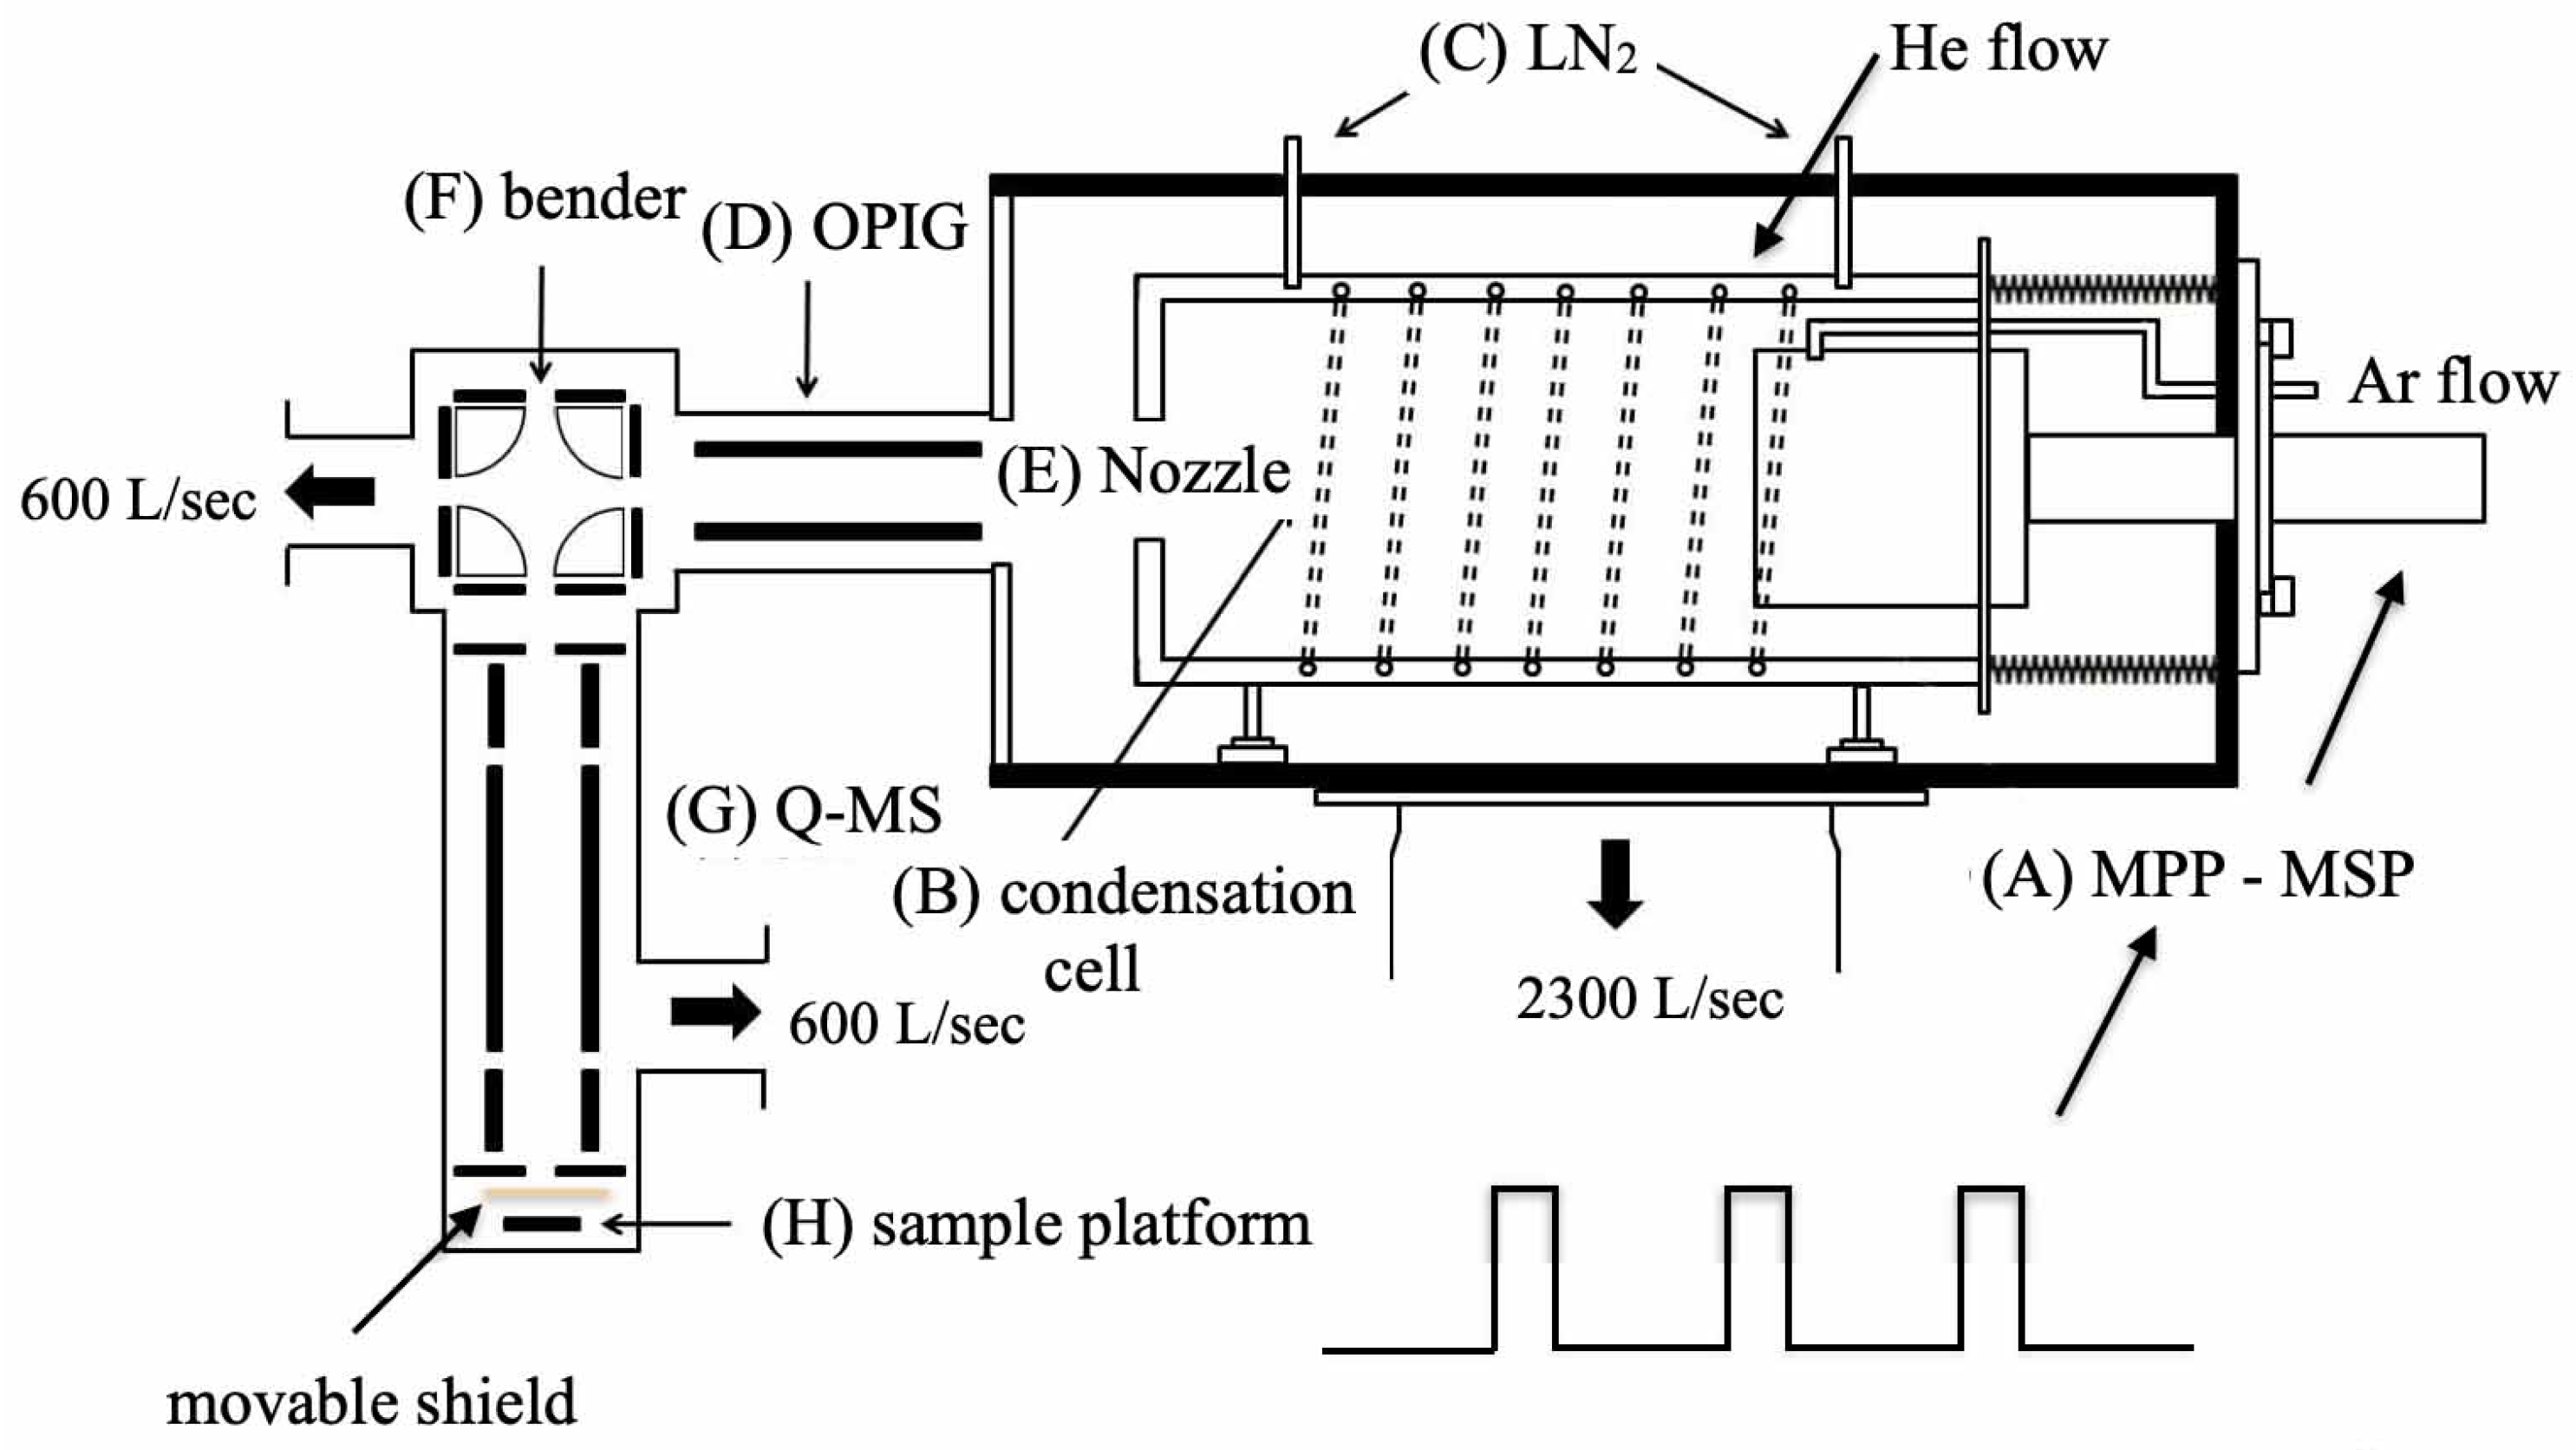
2.1. Experiment
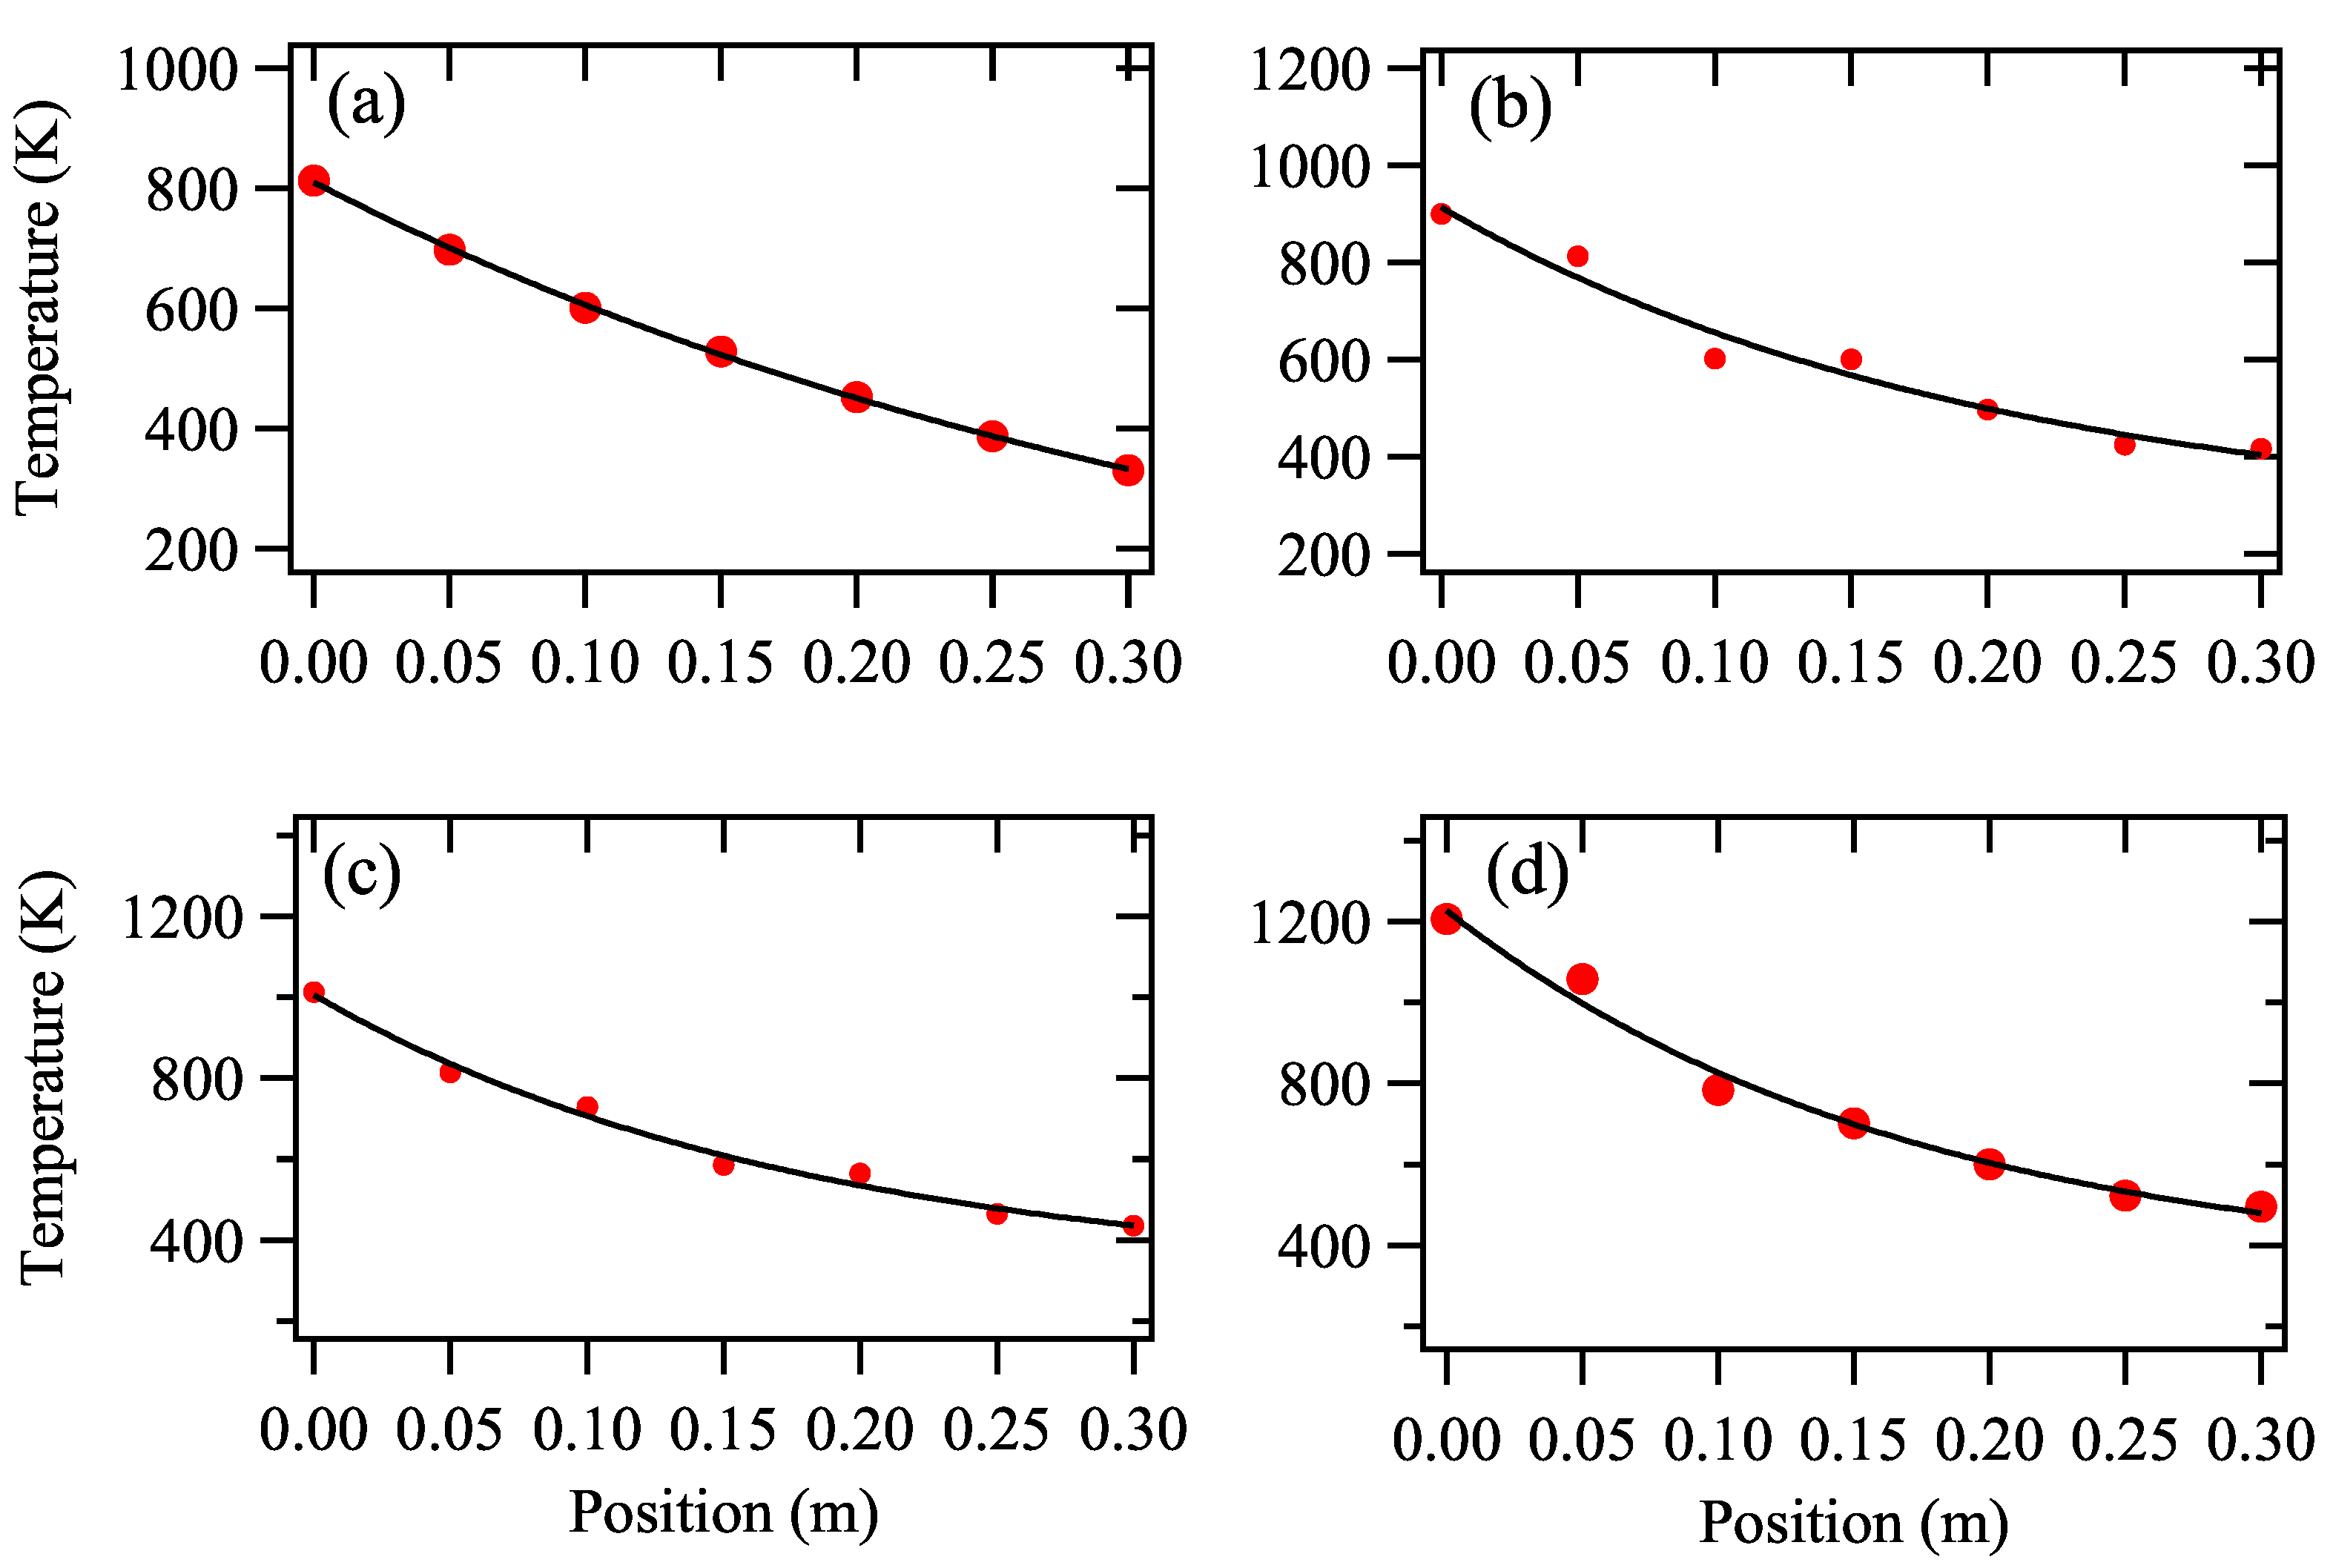
2.2. Simulation
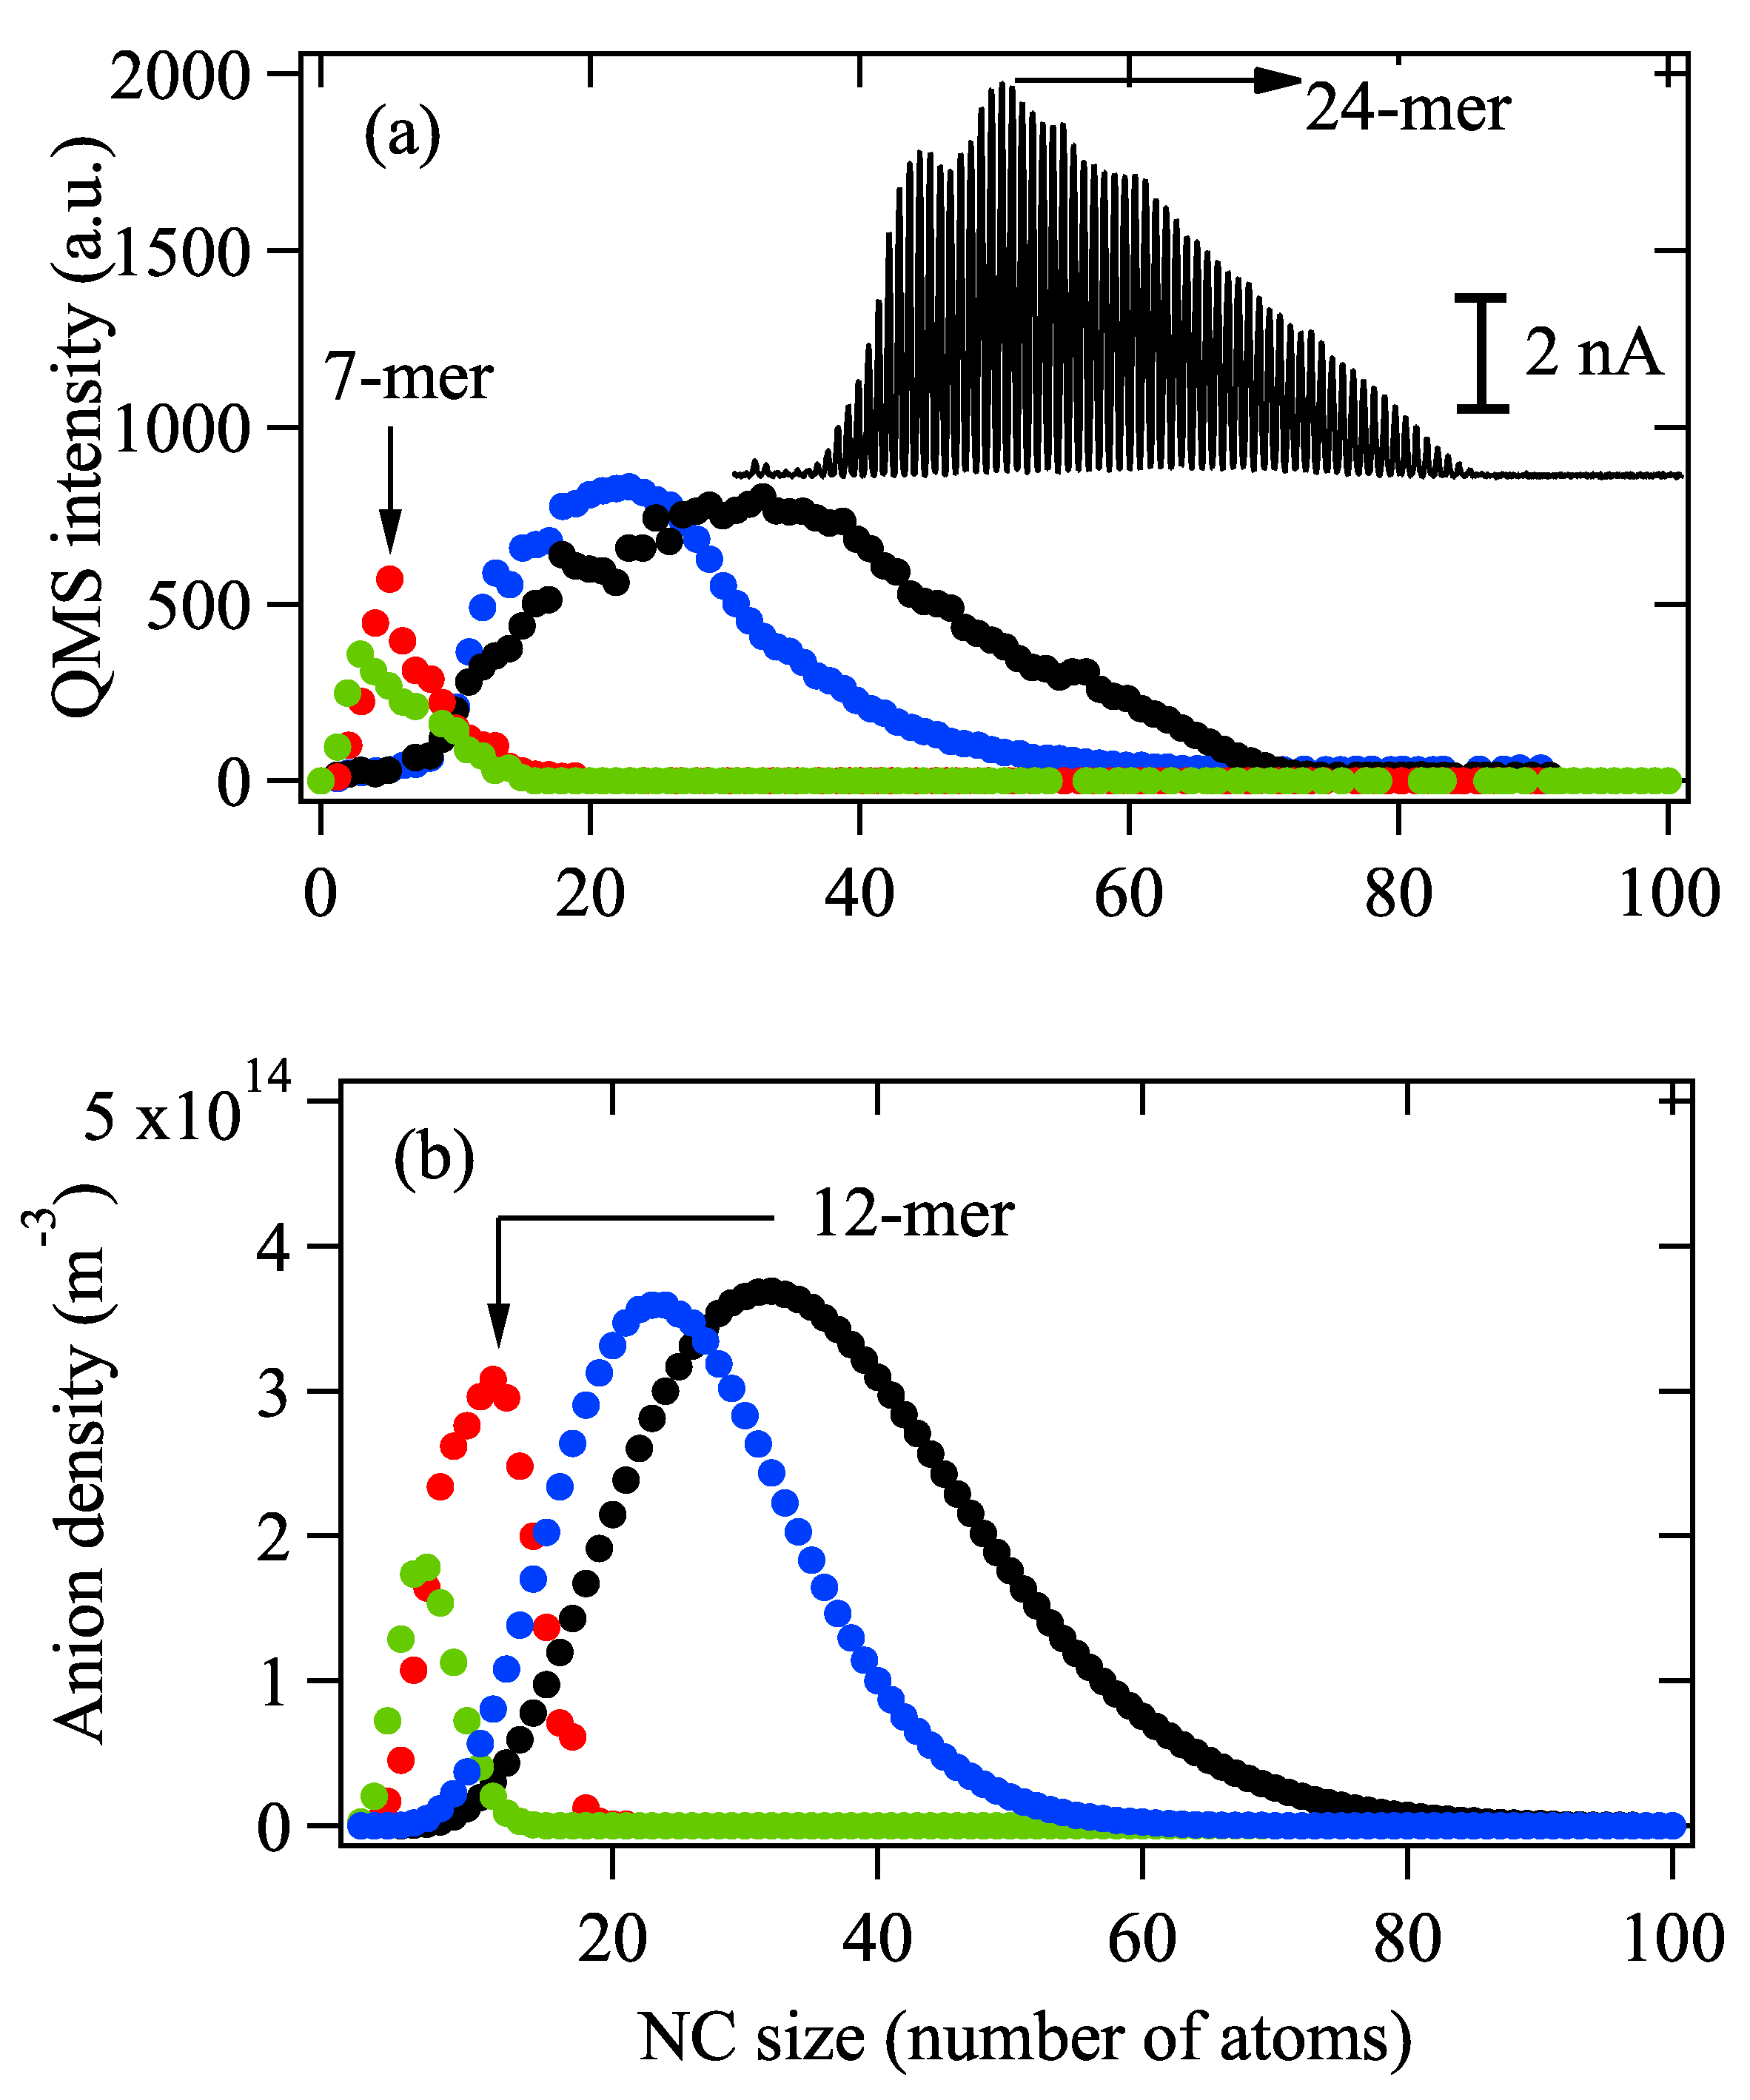
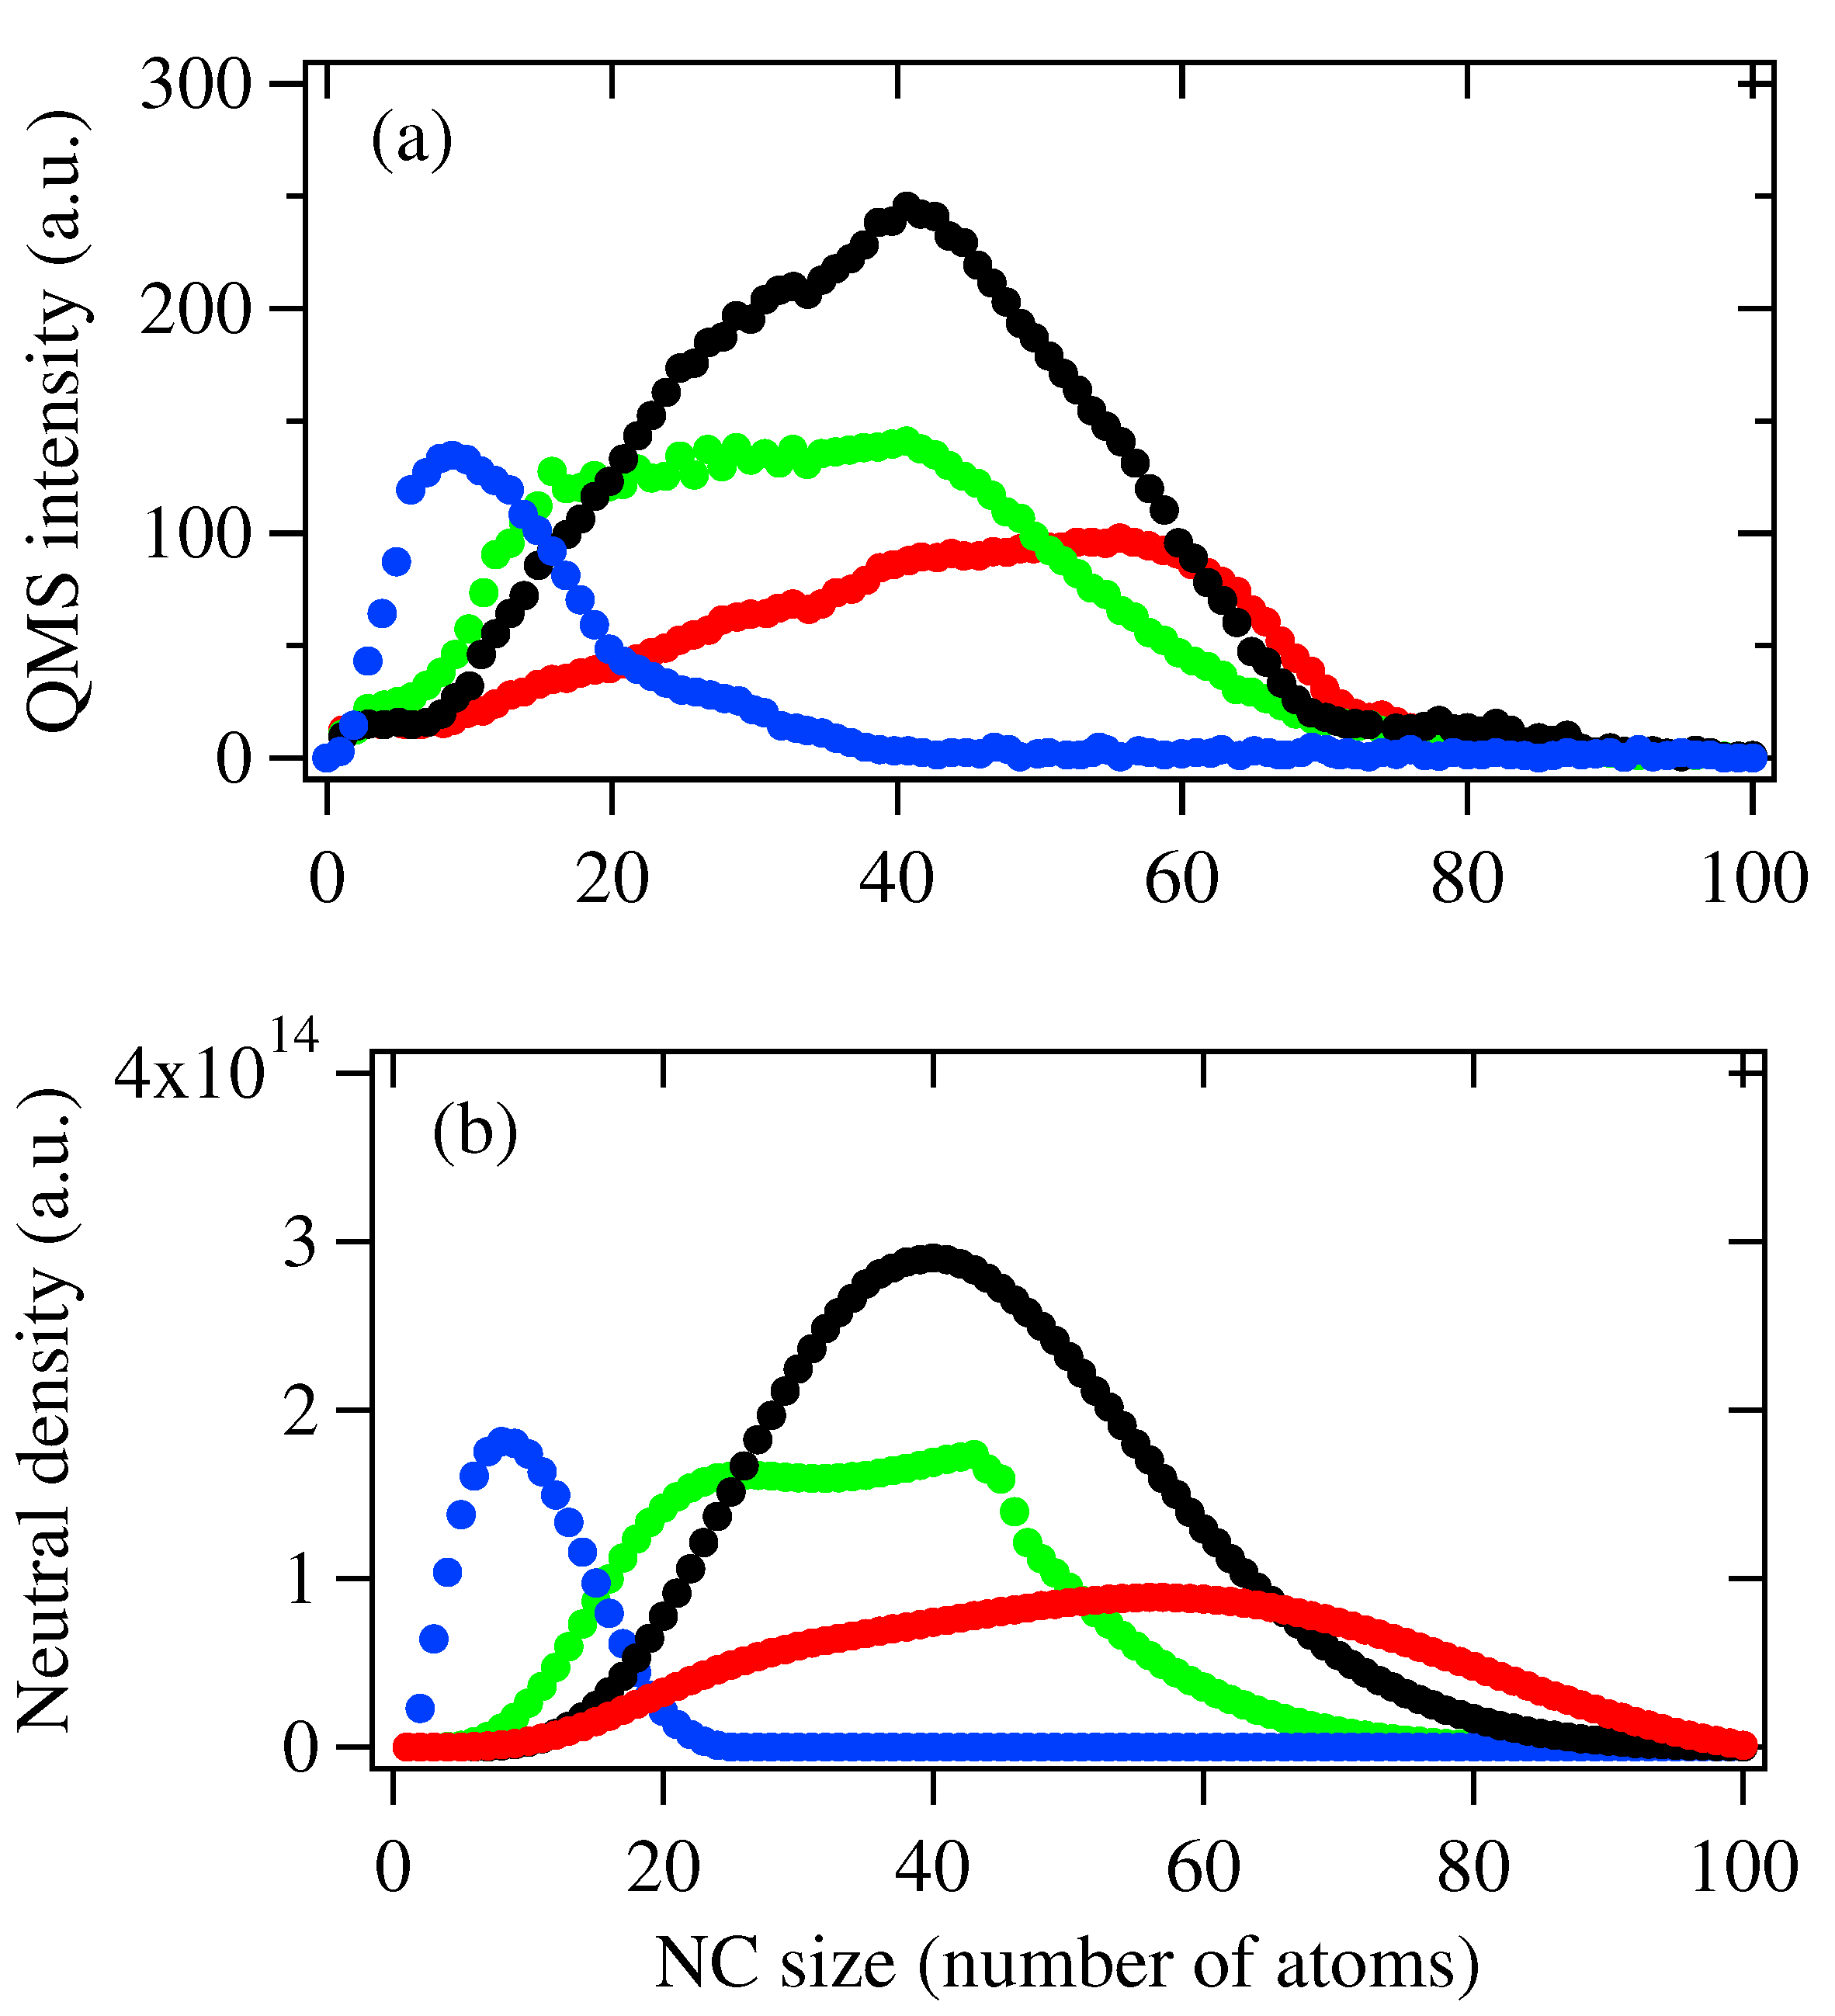
3. Results and Discssion
4. Conclusions
Funding
Data Availability Statement
Acknowledgments
Conflicts of Interest
References
- Burda, C.; Chen, X.; Narayanan, R. Chemistry and Properties of Nanocrystals of Different Shapes. Chem. Rev. 2005, 105, 1025–1102. [Google Scholar] [CrossRef] [PubMed]
- Kunz, S.; Schweinberger, F.; Habibpour, V.; Röttgen, M.; Harding, C.; Arenz, M.; Heiz, U. Temperature Dependent CO Oxidation Mechanisms on Size-Selected Clusters. J. Phys. Chem. C 2010, 114, 1651–1654. [Google Scholar] [CrossRef]
- Wender, H.; Migovski, P.; Feil, A.; Teixeira, S.; Dupont, J. Sputtering Deposition of Nanoparticles onto Liquid Substrates: Recent Advances and Future Trends. Coordin. Chem. Rev. 2013, 257, 2468–2483. [Google Scholar] [CrossRef]
- Marzun, G.; Nakamura, J.; Zhang, X.; Barcikowski, S.; Wagener, P. Size Control and Supporting of Palladium Nanoparticles Made by Laser Ablation in Saline Solution as A Facile Route to Heterogeneous Catalysts. Appl. Surf. Sci. 2015, 348, 75–84. [Google Scholar] [CrossRef]
- Zhang, C.; Feng, Y. Self-Assembled Gold Nanoparticles on Strontium Titanate for Efficient Photocatalytic Water Oxidization and Visible Light Response. Mater. Res. Express 2015, 2, 095021. [Google Scholar] [CrossRef]
- Johnson, G.; Colby, R.; Laskin, J. Soft Landing of Bare Nanoparticles with Controlled Size, Composition, and Morphology. Nanoscale 2015, 7, 3491–3503. [Google Scholar] [CrossRef]
- Ding, Q.; Kang, Y.; Li, W.; Sun, G.; Liu, H.; Li, M.; Ye, Z.; Zhou, M.; Zhou, J.; Yang, S. Bioinspired Brochosomes as Broadband and Omnidirectional Surface-Enhanced Raman Scattering Substrates. J. Phys. Chem. Lett. 2019, 10, 6484–6491. [Google Scholar] [CrossRef]
- Fang, M.; Tan, X.; Li, W.; Liu, Z.; Hu, B.; Wang, X. Recent Progress on Metal-Enhanced Photocatalysis: A Review on the Mechanism. Research 2021, 2021, 9794329. [Google Scholar] [CrossRef]
- Weng, B.; Jiang, Y.; Liao, H.; Roeffaers, B.J.; Lai, F.; Huang, H.; Tang, Z. Visualizing Light-Induced Dynamic Structural Transformations of Au Clusters-Based Photocatalyst via in Situ TEM. Nano Res. 2021, 14, 2805–2809. [Google Scholar] [CrossRef]
- Shrivastav, A.; Cvelbar, U.; Abdulhalim, I. A Comprehensive Review on Plasmonic-Based Biosensors Used in Viral Diagnostics. Commun. Biol. 2021, 4, 70. [Google Scholar] [CrossRef]
- Lai, S.; Grady, N.; Kundu, J.; Levin, C.; Lassiter, J.; Halas, N. Tailoring Plasmonic Substrates for Surface Enhanced Spectroscopies. Chem. Soc. Rev. 2008, 37, 898–911. [Google Scholar]
- Li, S.; Miao, P.; Zhang, Y.; Wu, J.; Zhang, B.; Du, Y.; Han, J.; Sun, J.; Xu, P. Recent Advances in Plasmonic Nanostructures for Enhanced Photocatalysis and Electrocatalysis. Adv. Mater. 2021, 33, 2000086. [Google Scholar] [CrossRef] [PubMed]
- Wang, X.; Huang, S.; Hu, S.; Yan, S.; Ren, B. Fundamental Understanding and Applications of Plasmon-Enhanced Raman Spectroscopy. Nat. Rev. Phys. 2020, 2, 253–271. [Google Scholar] [CrossRef]
- Langer, J.; de Aberasturi, D.; Aizpurua, J.; Alvarez-Puebla, R.; Auguie, B.; Baumberg, J.; Bazan, G.; Bell, S.; Boisen, A.; Brolo, A.; et al. Present and Future of Surface-Enhanced Raman Scattering. ACS Nano 2020, 14, 28–117. [Google Scholar] [CrossRef] [Green Version]
- Romo-Herrera, J.; Alvarez-Puebla, R.; Liz-Marzan, L. Controlled Assembly of Plasmonic Colloidal Nanoparticle Clusters. Nanoscale 2011, 3, 1304–1315. [Google Scholar] [CrossRef]
- Piella, J.; Bastus, N.; Puntes, V. Size-Controlled Synthesis of Sub-10-nanometer Citrate-Stabilized Gold Nanoparticles and Related Optical Properties. Chem. Mater. 2016, 28, 1066–1075. [Google Scholar] [CrossRef]
- Campos, A.; Troc, N.; Cottancin, E.; Pellarin, M.; Weissker, H.; Lerme, J.; Kociak, M.; Hillenkamp, M. Plasmonic Quantum Size Effects in Silver Nanoparticles Are Dominated by Interfaces and Local Environments. Nat. Phys. 2019, 15, 275–280. [Google Scholar] [CrossRef]
- Loiseau, A.; Asila, V.; Boitel-Aullen, G.; Lam, M.; Salmain, M.; Boujday, S. Silver-Based Plasmonic Nanoparticles for and Their Use in Biosensing. Biosensors 2019, 9, 78. [Google Scholar] [CrossRef] [Green Version]
- Ye, Z.; Sun, G.; Sui, C.; Yan, B.; Gao, F.; Cai, P.; Lv, B.; Li, Y.; Chen, N.; Xu, F.; et al. Surface Enhanced Raman Scattering Substrates Prepared by Thermal Evaporation on Liquid Surfaces. Nanotechnology 2018, 29, 375502. [Google Scholar] [CrossRef]
- Zhang, C.; Tsunoyama, H.; Akatsuka, H.; Sekiya, H.; Nagase, T.; Nakajima, A. Advanced Nanocluster Ion Source Based on High-Power Impulse Magnetron Sputtering and Time-Resolved Measurements of Nanocluster Formation. J. Phys. Chem. A 2013, 117, 10211–10217. [Google Scholar] [CrossRef]
- Huang, R.; Zhang, Q.; Chen, H.; Zheng, L. Application of the Smoluchowski Equation to the Formation Kinetics of Cluster Ions. Eur. Phys. J. D 1999, 9, 253–256. [Google Scholar] [CrossRef] [Green Version]
- Zhang, C.; Tsunoyama, H.; Feng, Y.; Nakajima, A. Extended Smoluchowski Model for the Formation of Size-Selected Silver Nanoclusters Generated via Modulated Pulsed Power Magnetron Sputtering. J. Phys. Chem. C 2016, 120, 5667–5672. [Google Scholar] [CrossRef]
- Taylor, K.J.; Pettiettehall, C.L.; Cheshnovsky, O.; Smalley, R.E. Ultraviolet Photoelectron-Spectra of Coinage Metal-Clusters. J. Chem. Phys. 1992, 96, 3319–3329. [Google Scholar] [CrossRef]
- Zhang, W.; Yan, S.Y.; Zhao, Z.X.; Zhang, H.X. Stabilities and Fragmentation Behaviors of Agn (n = 2–34). J. Theor. Comput. Chem. 2012, 11, 953–964. [Google Scholar] [CrossRef]
- Fournier, R. Theoretical Study of the Structure of Silver Clusters. J. Chem. Phys. 2001, 115, 2165–2177. [Google Scholar] [CrossRef] [Green Version]


Publisher’s Note: MDPI stays neutral with regard to jurisdictional claims in published maps and institutional affiliations. |
© 2022 by the author. Licensee MDPI, Basel, Switzerland. This article is an open access article distributed under the terms and conditions of the Creative Commons Attribution (CC BY) license (https://creativecommons.org/licenses/by/4.0/).
Share and Cite
Zhang, C. Combined Experimental and Theoretical Investigation on Formation of Size-Controlled Silver Nanoclusters under Gas Phase. Biosensors 2022, 12, 282. https://doi.org/10.3390/bios12050282
Zhang C. Combined Experimental and Theoretical Investigation on Formation of Size-Controlled Silver Nanoclusters under Gas Phase. Biosensors. 2022; 12(5):282. https://doi.org/10.3390/bios12050282
Chicago/Turabian StyleZhang, Chuhang. 2022. "Combined Experimental and Theoretical Investigation on Formation of Size-Controlled Silver Nanoclusters under Gas Phase" Biosensors 12, no. 5: 282. https://doi.org/10.3390/bios12050282
APA StyleZhang, C. (2022). Combined Experimental and Theoretical Investigation on Formation of Size-Controlled Silver Nanoclusters under Gas Phase. Biosensors, 12(5), 282. https://doi.org/10.3390/bios12050282