Abstract
In this study, we report on a novel aptasensor based on an electrochemical paper-based analytical device (ePAD) that employs a tungsten disulfide (WS2)/aptamer hybrid for the detection of Listeria monocytogenes. Listeria is a well-known causative pathogen for foodborne diseases. The proposed aptasensor signifies many lucrative features which include simple, cost-effective, reliable, and disposable. Furthermore, the use of an aptamer added more advantageous features in the biosensor. The morphological, optical, elemental composition, and phase properties of the synthesized tungsten disulfide (WS2) nanostructures were characterized by field-emission scanning electron microscopy (FESEM), RAMAN spectroscopy, photoluminescence (PL), and X-ray diffraction (XRD), while electrochemical impedance spectroscopy was performed to corroborate the immobilization of aptamer and to assess the L. monocytogenes sensing performance. The limit of detection (LoD) and limit of quantification (LoQ) of the aptasensor was found to be 10 and 4.5 CFU/mL, respectively, within a linear range of 101–108 CFU/mL. The proposed sensor was found to be selective solely towards Listeria monocytogenes in the presence of various bacterial species such as Escherichia coli and Bacillus subtilis. Validation of the aptasensor operation was also evaluated in real samples by spiking them with fixed concentrations (101, 103, and 105) of Listeria monocytogenes, thereby, paving the way for its potential in a point-of-care scenario.
1. Introduction
Foodborne pathogens have proven to be a severe threat to the food industries that deal with important public health crises across the world [1]. According to the World Health Organization (WHO), foodborne diseases affect approximately one-third of the population in developed countries annually, while this ratio is even higher in developing nations [2]. Bacteria such as Listeria monocytogenes, a harmful organism (e.g., human listeriosis), is a considerable concern for pregnant women, infants, and adults who are suffering from a weak immune system [3]. L. monocytogenes is associated with the consumption of raw and undercooked meat, poultry food, unpasteurized milk, cheese, and other dairy products. Furthermore, reports have suggested that death rates due to L. monocytogenes surged between 2001 and 2009 [4,5]. Therefore, the consequences associated with this bacterium are the foremost concern in food industry treatments.
Detection of pathogenic bacteria can be done through conventional techniques that involve a culture-based approach or a combination of a culture-based approach with numerous biochemical assays [6]. In spite of being highly precise and possessing the ability to distinguish between live and dead cells, such assays are bulky, non-specific, less sensitive, time-consuming, lengthy experimental procedures, lack quantitative results, and are unfeasible for point-of-care applications [7]. Due to these limitations, there is an extensive requirement to develop a suitable approach that can address the wide gaps in the existing detection methods.
Electrochemical biosensors have been incorporated as an alternative approach to overcome the drawbacks of traditional methods for foodborne pathogen monitoring, with the focus on being faster, cheaper, and real-time detection [8]. In the present era, an electrochemical biosensor matrix plays an essential role in improving a highly selective, reliable, sensitive and cost-effective analysis for clinical diagnosis [9]. Metallic nanostructures can be incorporated as electrode surface modifiers because they offer high electric conductivity due to quantum confinement effects [10]. Such a property is desirable for enhancing interfacial electron transfer kinetics.
In the present approach, we emphasize the fabrication of a label-free impedimetric aptasensor to detect Listeria monocytogenes. Construction of an electrochemical aptasensor involves using a paper-based device with advantageous features such as a low volume of analytes, mass-producible, lightweight, flexible, affordability, disposable, and rapidity, along with the feasibility of liquid flow without any external perturbation. The abovementioned advantages of electrochemical paper analytical devices (ePADs) make them a cheap platform for use in a resource-limited environment [11]. Specifically, the working electrode of anePAD was modified with tungsten disulfide (WS2) due to its biocompatibility and higher electron transfer to enhance the electrochemical signals. Furthermore, the aptamer modified with amine groups was immobilized on the surface-modified working electrode of the ePAD and an electrochemical analysis was performed to confirm the respective hybridization. In our current study, the aptamer was selected based on the work done by Sidhu et al. [11] and was exploited to fabricate a biosensor [12].
In this research, we report on the analytical performance of a WS2/aptamer hybrid-based aptasensor towards the selective detection of Listeria monocytogenes in an experimentally synthesized electrolyte as well as spiked dairy products, thereby, validating the developed sensor as a potential candidate for specific and sensitive bacterial detection.
2. Materials and Methods
2.1. Reagents
Sodium tungstate (Na2WO4), thiourea (CH4N2S), and methylene blue (MB) were purchased from Fisher Scientific, Pvt. Ltd., New Delhi, India. Hydroxylamine hydrochloride (HONH2·HCl), polyethylene glycol (C2nH4n+2On+1), potassium chloride (KCl), sodium monobasic (NaH2PO4), and dibasic salts (Na2HPO4) were purchased from Central Drug House (CDH), Pvt. Ltd., New Delhi, India. NaH2PO4 and Na2HPO4 were used in the preparation of phosphate buffer saline (PBS, 0.1 M and pH 7.4). Tris HCl-EDTA (TE buffer) was used to prepare the aliquot of the oligonucleotides and, afterwards, stored at 4 °C. All the chemicals used were prepared in double distilled water (DDW).
Aliquots of bacterial strains used, in this study, were acquired from the Culture Collection (Listeria monocytogenes strains), Microbial Type Culture Collection, and Gene Bank CSIR-IMTECH, Chandigarh (1143-L. monocytogenes). E. coli and B. subtilis were cultured in sterilized conditions at the Amity University, Amity Institute of Biotechnology, Noida.
The amine-modified sequence of L. monocytogenes was synthesized by GCC Biotech (Pvt. Ltd., Delhi, India). The 47-mer aptamer sequence of Listeria was obtained from Sidhu, R. et al. [11], i.e., -5′-NH2-ATC CAT GGG GCG GAGATG AGG GGG AGG AGG GCG GGT ACC CGG TTGAT-3′.
2.2. Apparatus
Electrochemical impedance spectroscopy was performed using a Wayne Kerr 6500-B Precision Impedance Analyzer for sensing of L. monocytogenes on WS2/aptamer modified electrodes. The ePAD involved a two-electrode system that was fabricated by screen printing conductive carbon ink on 210 GSM sheets. The working region of the ePAD was incorporated with WS2 nanostructures (WS2NS) as a biocompatible and enhanced electron conductivity matrix to detect L. monocytogenes.
The morphology of the synthesized WS2 nanostructure was characterized by FE-SEM (Zeiss 18448), while the molecular fingerprints of the WS2 nanostructures were analyzed by RAMAN spectroscopy (Shimadzu 8700), in the region of 500–4500 cm−1. The X-ray diffraction patterns (RigakuXRD, Smart Lab) were recorded in the range of 10° to 80° using CuKα radiation (40 kV, 30 mA) to investigate the crystal structure of WS2. The photoluminescence (PL) spectroscopy was performed using a RF5301-PC SHIMAZZU spectrofluorometer to analyze the defect structure of the synthesized nanomaterial. The PL spectra were recorded at the excitation wavelength of 650 nm with 300 to 800 nm of scanning through a 1.0 nm step length.
2.3. Bacteria Culture
The cultivation of pathogenic strains was performed in Luria broth (LB) medium at 37 °C by stirring for 16 h at 170 rpm. Bacterial cultures were centrifuged at 5800 r/min for 10 min (25 °C) and washed thrice by PBS (0.1 M, pH 7.4). The resulting precipitate was mixed in 15 mL of PBS as the initial stock solution of L. monocytogenes. The bacteria concentrations were prepared by serial dilution in PBS, while the corresponding absorbance was measured at 600 nm. Then, the original bacterial aliquot was further diluted to prepare concentrations from 101 to 108 CFU/mL
2.4. Synthesis of Tungsten Disulfide (WS2) Nanoflakes
Sodium tungstate (4.74 g), thiourea (4.5 g), hydroxylamine hydrochloride (2.06 g), and PEG (0.54 g) were added to 90 mL of deionized (DI) water under constant stirring in a beaker for 1h.The prepared solutions were transferred to a 150 mL Teflon-lined autoclave and kept at 180 °C for 24 h. After 24 h, the autoclave was allowed to cool down at room temperature. The obtained sample was subjected to vacuum filtration using Whatman filter paper. The filtrate was washed several times with ethanol and DI water, followed by drying at 40 °C for 4h. The obtained sample was ground to form a fine powder.
2.5. Development of Paper-Based Sensor Drop Cast with Tungsten Disulfide Nanoflakes (WS2NFs)
The electrochemical paper-based micro-analytical device (ePAD)was fabricated via screen printing technology using carbon conductive ink, as reported in the literature [13,14]. After drying the ink for 20 min, a wax coating was applied around the electrodes to create a hydrophobic barrier and to define the working area over the ePAD. Further, the working electrodes were modified with WS2nanostructure (10 μL) drop cast on the ePAD and were dried at 25 °C, followed by immobilization of 5μL aptamer (20 µM), and allowed to stabilize for overnight at 4 °C.
2.6. Fabrication of Listeria Aptamer ssDNA/WS2NF/ePAD
In order to fabricate the Listeria aptamer single-stranded DNA/WS2NF/ePAD modified electrode, various concentrations (20, 40, 60, 80, and 100 μM) of specific aptamer sequences of L. monocytogenes were optimized. The dilution made different concentrations of the initial 100 μM ssDNA solution with Tris-EDTA (TE) buffer.
The ssDNA aptamer (5′-NH2-ATC CAT GGG GCG GAGATG AGG GGG AGG AGG GCG GGT ACC CGG TTGAT-3′) of L. monocytogenes (5 μL) was immobilized on the WS2NF-coatedePAD, at 4 °C for 1 h. The electrochemical impedance spectroscopy studies were recorded using 0.1 M KCl electrolyte with 0.1 mM MB. The performance of the aptasensor was analyzed by exposing it to solutions consisting of various concentrations of the bacteria. The overall process is summarized in Scheme 1.
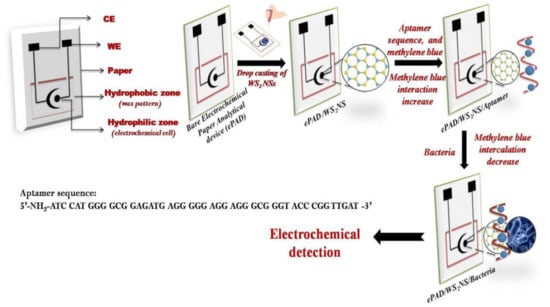
Scheme 1.
Schematic representation of the fabrication of the screen-printed paper-based aptasensor for the detection of Listeria monocytogenes.
2.7. Bacteria Detection
First, the sensor was incubated using Listeria concentration (108 CFU/mL) at 37 °C until the bacteria bound completely (30 min) with corresponding aminated aptamer. Then, the EIS analysis was performed in 0.1 M KCl containing 0.1 mM MB.
Control bacteria such as E. coli and B. subtilis were employed for the specificity and standard experiments. The fabrication was the same for L. monocytogenes (target) detection as procedure followed in aptamer fabrication. Then, each bacterium, apart from Listeria to detect specificity and along with bacteria to detect selectivity, was used for the electrochemical detection at the same concentration (108 CFU/mL).
2.8. Repeatability and Storage Stability
The repeatability of the aptasensor was checked three times on the same day (intra-day) and duplicate measurements were performed under the same conditions after three days (inter-day) and employed for the detection of the same target bacteria concentration. The fabricated ePAD incorporated with nanomaterial was checked for 20 days at regular intervals of five days, after storage at 4 °C for the analysis of long-term stability.
2.9. Application of ssDNA/WS2NS/ePAD in Food Samples
The developed aptasensor was also exposed to food sources of L. monocytogenes, such as unpasteurized milk and soft cheese made from unpasteurized milk. In the current process, dilutions of dairy products were done with 5 mL PBS (pH 7.4). The prepared samples were further centrifuged for 10 min at 10,000 rpm. Bacteria were spiked in dairy samples to assess the performance of the aptasensor. Afterward, the EIS study was performed to detect L. monocytogenes in the presence of E. coli and B. subtilis in the respective dairy sample on the aptamer-modified ePAD electrode surface.
3. Results and Discussion
3.1. Surface Characterization of WS2 Nanostructures
The morphological and structural properties of synthesized WS2 were performed by FESEM, XRD, RAMAN, and PL. The SEM micrograph shown in Figure 1a indicates the randomly distributed, densely packed flaky morphology of WS2 nanostructures. The length and width of the flakes were measured to be ~400 and 200 nm, respectively. Figure 1b shows the Raman spectrum of as-synthesized WS2 nanostructures. The Raman spectrum depicted E2g1 and A1g which are two active modes. The E2g1 mode arises from in-phase vibrations of W atoms in the opposite direction with respect to S atoms, while the A1g mode is assigned to the S atoms which are moving in-phase and in out-of-plane directions. We observed the E2g1 mode at 351 cm−1 and the A1g mode at 420 cm−1; the difference between these two modes, i.e., Δω was 69 cm−1, which confirmed the formation of WS2 [13].
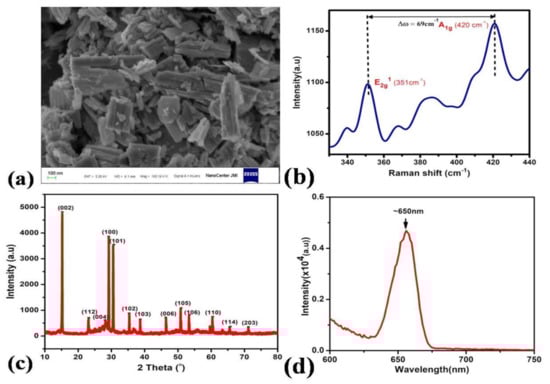
Figure 1.
(a) SEM images; (b) Raman spectrum; (c) XRD; (d) magnified image of PL spectrumWS2NS.
The diffraction peaks of WS2with their respective (hkl) planes were obtained at 15.09° (002), 23.4° (112), 28.2° (004), 29.2° (100), 30.5° (101), 35.3° (102), 38.64° (103), 46.4° (006), 50.82° (105), 53.22° (106), 59.55° (110), 65.51° (114), and 71.22° (203), which confirmed the formation of WS2 with hexagonal structure (JCPDS No.84-1398, 08-0237) (Figure 1c). A sharp peak (002) indicated the highly crystalline nature of synthesized WS2 [13,15], while the small one at 23.41° was due to the organic moiety of polyethylene glycol (PEG), which was used as a surfactant.
Figure 1d shows the PL spectra of WS2 nanostructures for the evaluation of band gap and structural defects. The peak around 650 nm is attributed to the direct band-edge transition from conduction band minima to valence band maxima and the corresponding bandgap is 1.9 eV [16].
3.2. Electrochemical Characterization of ePADs
An EIS analysis was performed to characterize the stepwise assembly of the ePADs obtained after modification with WS2NS, aptamer ssDNA, or bacteria in 0.1 M KCl with MB(0.1 mM).The Nyquist spectra (shown in Figure 2a–c) indicate a semicircular feature with a halfarc arising at the high-frequency region at the left side of each spectrum. The high-frequency region essentially gives the bulk electrode/electrolyte signature, in which case, the halfarc indicates a low capacitance (C), as corroborated by high-capacitive impedance Z″ (since Z″ α C−1) [17].
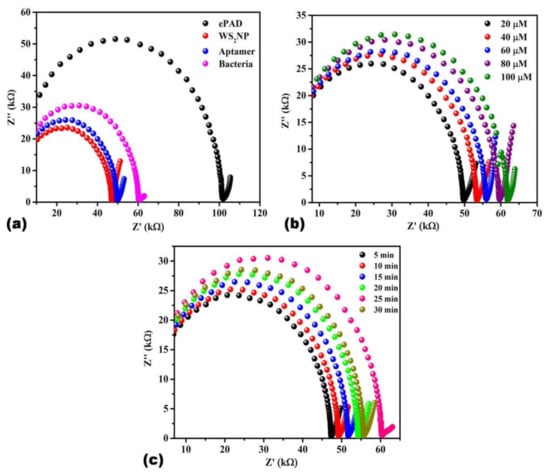
Figure 2.
(a) Nyquist plot of a range of electrochemical paper analytical devices (ePADs) consists of ePAD, WS2NS/ePAD, aptamer/WS2NS/ePAD, and bacteria/aptamer/WS2NS/ePAD; (b) Nyquist plot of aptamer/WS2NS/ePAD at different concentrations of probe aptamer ranging from 20 µM to 100 µM; (c) Nyquist plot at different incubation times in 0.1 M KCl containing 0.1 mM methylene blue (frequency range of 100 Hz–10 MHz).
It is possible to speculate that the initial low capacitance could be a signature of the screen-printed paper electrode, whereby, the poor dielectric constant (C α ε) of the base cellulose sheet appears to contribute towards poor charge storage ability at higher frequencies [18]. Moreover, the Nyquist spectrum seems to be shifted to the right along the Z’ axis which indicates the presence of bulk resistance of base electrode and electrolyte, the latter consisting of 0.1 mM methylene blue probe in 0.1 M KCl [19]. The spectrum can be modeled by a series of resistance Rs (see Randel’s circuit of Figure 3a). Furthermore, the mid-frequency region gives a measure of heterogeneous electron transfer kinetics, which is the redox process of methylene blue probe (0.1 mM in 0.1 M KCl). The electrode/electrolyte interface can be modeled using a parallel combination of resistor (indicating charge transfer resistance, Rct) and double-layer capacitance (Cdl), as corroborated by the presence of a typical semicircular feature in the mid-frequency spectra. This situation denotes a turnover of electron traversal from capacitive to resistive paths since the latter is effectively dominant at low frequencies. Therefore, the parallel arrangement ensures two possible pathways for electron flow, which occur via the capacitive approach at higher frequencies (Z″ α f−1) and through the resistor at low frequencies [20]. Finally, the low-frequency region indicates the occurrence of diffusion-mediated transport of methylene blue probe towards the electrode surface for undergoing its signature redox process, thereby, generating electrons at the electrode/electrolyte interface.
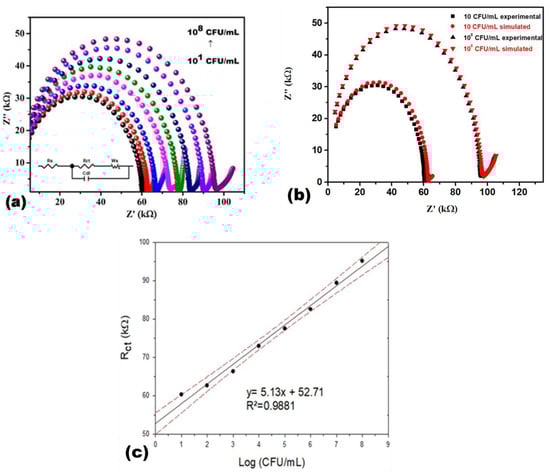
Figure 3.
(a) Nyquist plot of bacteria/Aptamer/WS2NS/ePADat various bacteria concentrations (101 to 108). The Randel’s equivalent circuit is shown in the inset; (b) curve fitting of Nyquist spectra using circuit simulation of Randel’s equivalent model; (c) sensor calibration line with confidence intervals (95%) for calculation of LOD and LOQ with the graphical method by Meier and Zund, indicating direct dependence of the Rct on bacteria concentrations, in 0.1 M KCl containing 0.1 mM methylene blue (frequency range of 100 Hz–10 MHz).
Now, Figure 2a depicts the Nyquist plot at different stages of electrode fabrication which shows a huge Rct of ~101.91 kΩ for the bare ePAD but a similar semi-circle with lower Rct value (~46.441 kΩ) for the WS2NS/ePAD. After immobilization of aptamers onto WS2NS, the Rct value increased due to the non-conductive nature of aptamers, along with the repulsion between negatively charged sequence and ions present in the electrolyte. After incubation with bacteria, the resistance increased due to the non-conductive nature of bacteria bonded to the aptamer. The EIS results endorse the successful fabrication of the aptasensor.
Figure 2b shows the impedance response of modified electrodes against different aptamer concentrations. During this experiment, it was observed that the Rct was the least at 20 µM concentration and increased further with increasing concentration of aptamer. The intensification in Rct value with increasing aptamer concentration ascribed to the deposition of a more insulating layer of DNA aptamer onto the working surface of ePAD. Therefore, further studies were performed at a lower aptamer concentration (20 µM).
A time-dependent study for the sensor fabrication of ePAD was also performed. The effects are shown in Figure 2c at different immobilization times (5, 10, 15, 20, 25, and 30 min) by incubating the bacteria/aptamer/WS2NS/ePAD. The impedimetric response obtained after incubating for 25 and 30 min differed insignificantly due to the enhanced binding between the aptamer and bacteria. Therefore, the optimum time was chosen to be 25 min, as sufficient interaction of bacteria with the aptamer.
3.3. Electrochemical Impedance Spectroscopic Analysis of Listeria monocytogenes
Different concentrations (101, 102, 103, 104, 105, 106, 107, and 108 CFU/mL) of bacteria were incubated on the modified ePAD and the results are shown in Figure 3a. It is interesting to note that the Nyquist profile at various L. monocytogenes target concentrations retain the features shown in Figure 2a–c. Specifically, the low capacitance due to the poor dielectric constant of paper substrate and bulk electrode/electrolyte resistance at high frequencies, the mid-frequency interface kinetics, and low frequency methylene blue diffusion appear to be preserved in the concentration scan, which essentially indicates the stability of the fabricated aptamer/WS2 bio-nano hybrid-coated ePAD.
During the apta-recognition process, as the bacterial concentration is increased, more of the bacteria becomes bonded to the probe-aptamer sites and passivates the electrode surface due to the insulating nature of bacteria [21], and the interfacial charge transfer is drastically reduced. This is indicated in Figure 3a by an increase in Rct from ~58 to 96 kΩ upon elevating the L. monocytogenes concentration from 101 to 108 CFU/mL. This situation has immediate consequences on the double layer capacitance Cdl. It can also be observed, in Figure 3a, that Cdl appears to decrease with an increase in bacterial concentration, which can be attributed to poor double layer charging at higher concentrations facilitated by reduced electron transfer (high Rct) at the electrode/electrolyte interface. The Randel’s circuit, shown in the inset in Figure 3a, was employed to obtain approximate estimates of the interfacial parameters involved in the L. monocytogenes sensing scenario by curve fitting of the Nyquist spectra of Figure 3a using Zview software. The latter is highlighted in Figure 3b, while the values of various interfacial parameters are listed in Table 1.

Table 1.
A chart highlighting the approximate values of various interfacial parameters modeled by Randel’s circuit using Zview software.
It can be observed from the above table that an increase in Rct from 58 to 96 kΩ has a drastic impact on Cdl, as indicated in by the three-fold increase from 2 µF to 5 nF, as the L. monocytogenes concentration is scaled up from 101 to 108 CFU/mL. As mentioned above, this is primarily due to poor double layer charging, since fewer electrons traverse the interface region due to the increased binding of the target and probe aptamer on the electrode surface. While the high-frequency bulk resistance remains constant at 5 kΩ, the diffusion impedance Ws increases from 0.1 to 0.6 kΩ due to steric hindrance between methylene blue and target aptamers at higher concentrations.
The calibration plot, obtained at a frequency of 120.45 kHz (Figure 3c) showed that Rct increased linearly as the bacteria concentration was increased from 101 to 108 CFU/mL. These values also corresponded to the diameter of the semi-circle. The calibration plot (Figure 3b) verified the direct proportionality of Rct and bacteria concentration, as it increased along with the concentration range from 101 to 108 CFU/mL. The limit of detection (LOD) and limit of quantification (LOQ) were graphically determined by the Meier and Zund method [22], i.e., 10.0 CFU/mL and 4.5 CFU/mL, respectively.
3.4. Selectivity of the Aptasensor
In order to validate the selectivity of the developed sensor, a sensing analysis was performed with various analytes. An interfering study with two different bacterial species, i.e., E. coli and B. subtilis, was conducted to validate the selectivity of the developed sensor. Figure 4 shows that each bacterium generates its own unique charge transfer response (Rct) with significant and specific deviations. Furthermore, a fixed concentration of E. coli and B. subtilis (108 CFU/mL) was individually mixed with L. monocytogenes (108 CFU/mL) and the Rct values of these mixtures were recorded at a calibration frequency of 120.45 kHz. As shown in Figure 4, the Rct value for L. monocytogenes alone and the mixtures with E. coli and B. subtilis were ~95.1 ± 3.8, 97.2 ± 3.5, and 93.8 ± 3.9 kΩ, respectively. These results indicate that irrespective of the presence of different bacteria in the sample, the developed sensor can accurately detect the presence of L. monocytogenes, which is attributed to its selective binding with the aptamer sequence. Therefore, from the result, it is concluded that the aptasensor responds selectively to L. monocytogenes.
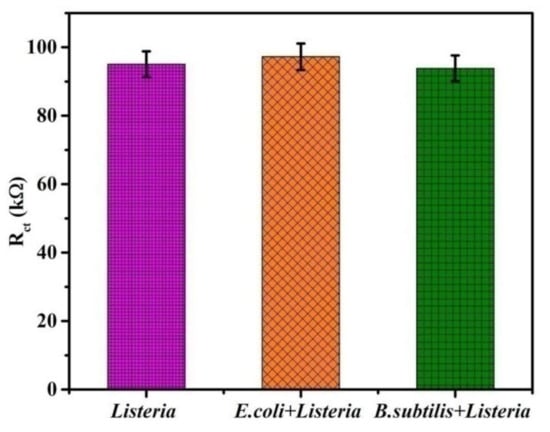
Figure 4.
Impedance response of various bacteria indicating the selective nature of the developed sensor (L = L. monocytogenes, E. coli + L. monocytogenes, B. subtilis + L. monocytogenes), at 120.45 kHz.
3.5. Reproducibility and Storage Stability
Reproducibility of the ePAD was also studied and the coefficients of variation of four electrodes were tested and determined to be 52.503 kΩ ±1.18% (mean of Rct ± COV, within the batch) and 58.365 kΩ ± 5.54% (mean of Rct ± COV, between the batch). The developed sensor was also tested for its stability and shelf-life. The impedance response of the sensor was recorded at a concentration of 101 CFU/mL for 20 days (Figure 5) at a regular interval of 5 days. The observed average value of impedance was found to be ~64.4 ± 6.4 kΩ; and further, it indicated that the impedance changed insignificantly for 15 days, suggesting that the sensor gives stable impedance response over a period of 15 days.
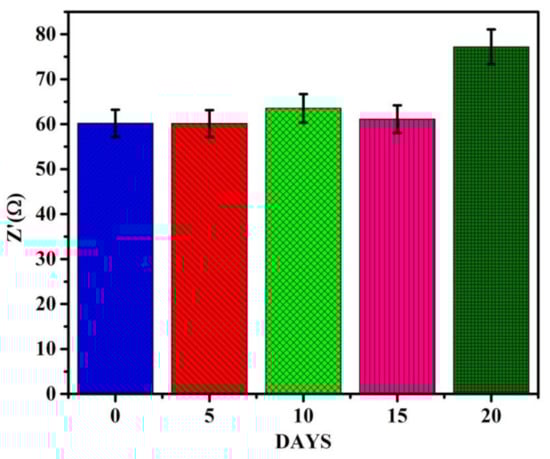
Figure 5.
Stability and shelf-life study indicating a stable lifetime of 15 days.
3.6. Application of the Aptasensor in Real Sample Analysis
The validation of our aptasensor was analyzed by spiking milk and cheese with bacteria concentrations of 101, 103, and 105 CFU/mL. The bar graph below (Figure 6) indicates that interfacial charge transfer resistance in spiked milk and cheese samples differs insignificantly as compared with that observed for the target. The minor increment in impedance observed for spiked cheese and milk for the target may be attributed to the former being insulating in nature, contrary to what is observed for the latter, which is suspended in a conducting electrolyte (MB/KCl). Furthermore, Table 2 shows the percentage recovery of bacteria in cheese and milk. Such high recovery proves the validation of the developed aptasensor.
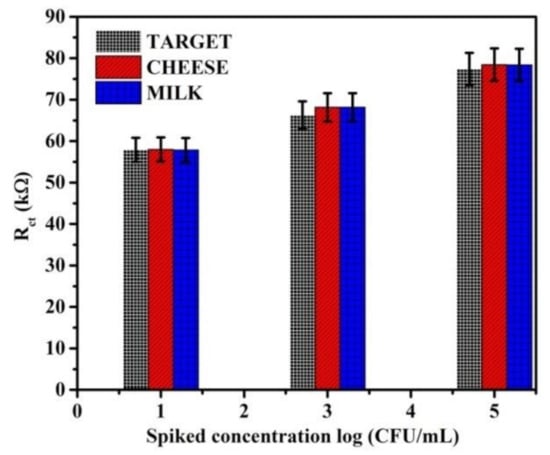
Figure 6.
Charge transfer resistance observed for spiked cheese and milk. The response to bacteria is also shown for reference in 0.1 M KCl containing 0.1 mM methylene blue (frequency range of 100 Hz–10 MHz).
Table 2.
Percentage recovery of bacteria concentrations in cheese and milk.
4. Conclusions
In the present work, we demonstrated the feasibility of a paper-based platform utilizing WS2 for the detection of foodborne pathogens. An electrochemical sensor based on a WS2/aptamer hybrid was successfully fabricated to detect Listeria. Impedance spectroscopy was performed using a two-electrode system. The use of the paper-based platform reduced the cost of the sensor fabrication and the volume of the analyte required. The linear range for the detection of Listeria was 101–108 CFU/mL with a detection limit of 10.0 CFU/mL. The constructed aptasensor demonstrated high selectivity, reproducibility, and sensitivity toward L. monocytogenes. Due to the impressive detection limits and linear range, the developed sensor can be implemented in real-time field applications.
Author Contributions
Conceptualization, J.N. and S.J.; methodology, A.M. (Annu Mishra); software, A.M. (Ashish Mathur); validation, R.P. and J.N. and M.K.; formal analysis, S.R.; investigation, J.N.; resources, M.K.; data curation, A.M. (Annu Mishra); writing—A.M. (Annu Mishra); original draft Conceptualization, J.N. and S.J.; methodology, A.M. (Annu Mishra); software, A.M. (Ashish Mathur); validation, R.P. and J.N. and M.K.; formal analysis, S.R.; investigation, J.N.; resources, M.K.; data curation, A.M. (Annu Mishra); writing—A.M. (Annu Mishra); original draft preparation, A.M. (Annu Mishra) and S.R.; writing—review and editing, S.R. and A.M. (Annu Mishra); visualization, J.N.; supervision, R.P.; project administration, A.M. (Annu Mishra); funding acquisition, M.K. All authors have read and agreed to the published version of the manuscript.
Funding
This research received no external funding.
Institutional Review Board Statement
Not applicable.
Informed Consent Statement
Not applicable.
Data Availability Statement
We have not reported any data where supporting reported results can be found.
Acknowledgments
The present work received support to M.K. from the Science and Engineering Research Board (SERB) No. ECR/2017/001222 and the University Grant Commission (UGC) No.F.4–5(201 FRP)/2015(BSR).
Conflicts of Interest
The authors declare no conflict of interest.
References
- World Health Organization, Food Safety. 2019. Available online: https://www.who.int/news-room/fact-sheets/detail/food-safety (accessed on 4 June 2019).
- Chiu, C.H.; Wu, T.L.; Su, L.H.; Chu, C.; Chia, J.H.; Kuo, A.J.; Chien, M.S.; Lin, T.Y. The emergence in Taiwan of fluoroquinolone resistance in Salmonella enterica Serotype Choleraesuis. N. Engl. J. Med. 2002, 346, 413–419. [Google Scholar] [CrossRef] [PubMed]
- Centers for Disease Control and Prevention. Available online: https://www.cdc.gov/listeria/faq.html (accessed on 12 December 2016).
- Bagheryan, Z.; Raoof, J.B.; Golabi, M.; Turner, A.P.F.; Beni, V. Diazonium-based impedimetric aptasensor for the rapid label-free detection of Salmonella typhimurium in food sample. Biosens. Bioelectron. 2016, 80, 566–573. [Google Scholar] [CrossRef] [PubMed] [Green Version]
- Heredia, N.; Garcia, S. Animals as sources of food-borne pathogens: A review. Anim. Nutr. 2018, 4, 250–255. [Google Scholar] [CrossRef] [PubMed]
- Law, J.W.-F.; Ab Mutalib, N.S.; Chan, K.G.; Lee, L.H. Rapid methods for the detection of foodborne bacterial pathogens: Principles, applications, advantages and limitations. Front. Microbiol. 2014, 5, 770. [Google Scholar] [CrossRef] [PubMed] [Green Version]
- Cho, I.H.; Ku, S. Current technical approaches for the early detection of foodborne pathogens: Challenges and opportunities. Int. J. Mol. Sci. 2017, 18, 2078. [Google Scholar] [CrossRef] [PubMed]
- Grieshaber, D.; MacKenzie, R.; Vörös, J.; Reimhult, E. Electrochemical biosensors—Sensor principles and architectures. Sensors 2008, 8, 1400–1458. [Google Scholar] [CrossRef] [PubMed]
- Singh, K.; Chauhan, R.; Solanki, P.R.; Basu, T. Development of impedimetric biosensor for total cholesterol estimation based on polypyrrole and platinum nanoparticle multi layer nanocomposite. Int. J. Org. Chem. 2013, 3, 262–274. [Google Scholar] [CrossRef] [Green Version]
- Mathur, A.; Gupta, R.; Kondal, S.; Wadhwa, S.; Pudake, R.N.; Shivani Kansal, R.; Pundir, C.S.; Narang, J. A new tactics for the detection of S. aureus via paper based geno-interface incorporated with graphene nano dots and zeolites. Int. J. Biol. Macromol. 2018, 112, 364–370. [Google Scholar] [CrossRef] [PubMed]
- Sidhu, R.J.; Claussen, J.; Rong, Y.; Mclamore, E. Smart Biomedical and Physiological Sensor Technology XII. In Proceedings of the SPIE Sensing Technology + Applications, Baltimore, MD, USA, 20–24 April 2015. [Google Scholar]
- Singhal, C.; Dubey, A.; Mathur, A.; Pundir, C.S.; Narang, J. Paper based DNA biosensor for detection of chikungunya virus using gold shells coated magnetic nanocubes. Process Biochem. 2018, 74, 35–42. [Google Scholar] [CrossRef]
- Ashraf, W.; Fatima, T.; Srivastava, K.; Khanuja, M. Superior photocatalytic activity of tungsten disulfide nanostructures: Role of morphology and defects. Appl. Nanosci. 2019, 9, 1–15. [Google Scholar] [CrossRef]
- Narang, J.; Singhal, C.; Khanuja, M.; Mathur, A.; Jain, A.; Pundir, C.S. Hydrothermally synthesized zinc oxide nanorods incorporated on lab-on-paper device for electrochemical detection of recreational drug. Artif. Cells Nanomed. Biotechnol. 2018, 46, 1586–1593. [Google Scholar] [CrossRef] [PubMed]
- Cao, S.; Liu, T.; Hussain, S.; Zeng, W.; Peng, X.; Pan, F. Synthesis and characterization of novel chrysanthemum-like tungsten disulfide (WS2) nanostructure: Structure, growth and optical absorption property. Mater. Lett. 2014, 129, 205–208. [Google Scholar] [CrossRef]
- Ghorai, A.; Bayan, S.; Gogurla, N.; Midya, A.; Ray, S.K. Highly luminescent WS2 quantum Dots/ZnO heterojunctions for light emitting devices. ACS Appl. Mater. Interfaces 2016, 9, 558–565. [Google Scholar] [CrossRef] [PubMed]
- Lvovich, V.F. Fundamentals of electrochemical impedance spectroscopy. In Impedance Spectroscopy; Wiley: New York, NY, USA, 2012; pp. 1–21. [Google Scholar]
- Mathur, A.; Nayak, H.C.; Rajput, S.; Roy, S.; Nagabooshanam, S.; Wadhwa, S.; Kumar, R. An enzymatic multiplexed impedimetric sensor based on α-MnO2/GQD nano-composite for the detection of diabetes and diabetic foot ulcer using micro-fluidic platform. Chemosensors 2021, 9, 339. [Google Scholar] [CrossRef]
- Khanna, M.; Roy, S.; Kumar, R.; Wadhwa, S.; Mathur, A.; Dubey, A.K. MnO2 based bisphenol—A electrochemical sensor using micro-fluidic platform. IEEE Sens. J. 2018, 18, 2206–2209. [Google Scholar] [CrossRef]
- Roy, S.; John, A.; Nagabooshanam, S.; Mishra, A.; Wadhwa, S.; Mathur, A.; Narang, J.; Singh, J.; Dilawar, N.; Davis, J. Self-aligned TiO2—Photo reduced graphene oxide hybrid surface for smart bandage application. Appl. Surf. Sci. 2019, 488, 261–268. [Google Scholar] [CrossRef]
- Ma, X.; Jiang, Y.; Jia, F.; Yu, Y.; Chen, J.; Wang, Z.J. An aptamer-based electrochemical biosensor for the detection of Salmonella. Microbiol. Methods 2014, 98, 94–98. [Google Scholar] [CrossRef] [PubMed]
- Meier, P.C.; Zünd, R.E. SMAC-Statistical Methods in Analytical Chemistry; Wiley Analytical Science, Wiley: New York, NY, USA, 2000; p. 153. ISBN 978-0-471-72611-1. [Google Scholar]
Publisher’s Note: MDPI stays neutral with regard to jurisdictional claims in published maps and institutional affiliations. |
© 2022 by the authors. Licensee MDPI, Basel, Switzerland. This article is an open access article distributed under the terms and conditions of the Creative Commons Attribution (CC BY) license (https://creativecommons.org/licenses/by/4.0/).