Development of Ic-ELISA and Colloidal Gold Lateral Flow Immunoassay for the Determination of Cypermethrin in Agricultural Samples

 and
and
Abstract
:1. Introduction
2. Materials and Methods
2.1. Reagents
2.2. Preparation of Antigens
2.3. Preparation of mAbs
2.4. Ic-ELISA Procedure
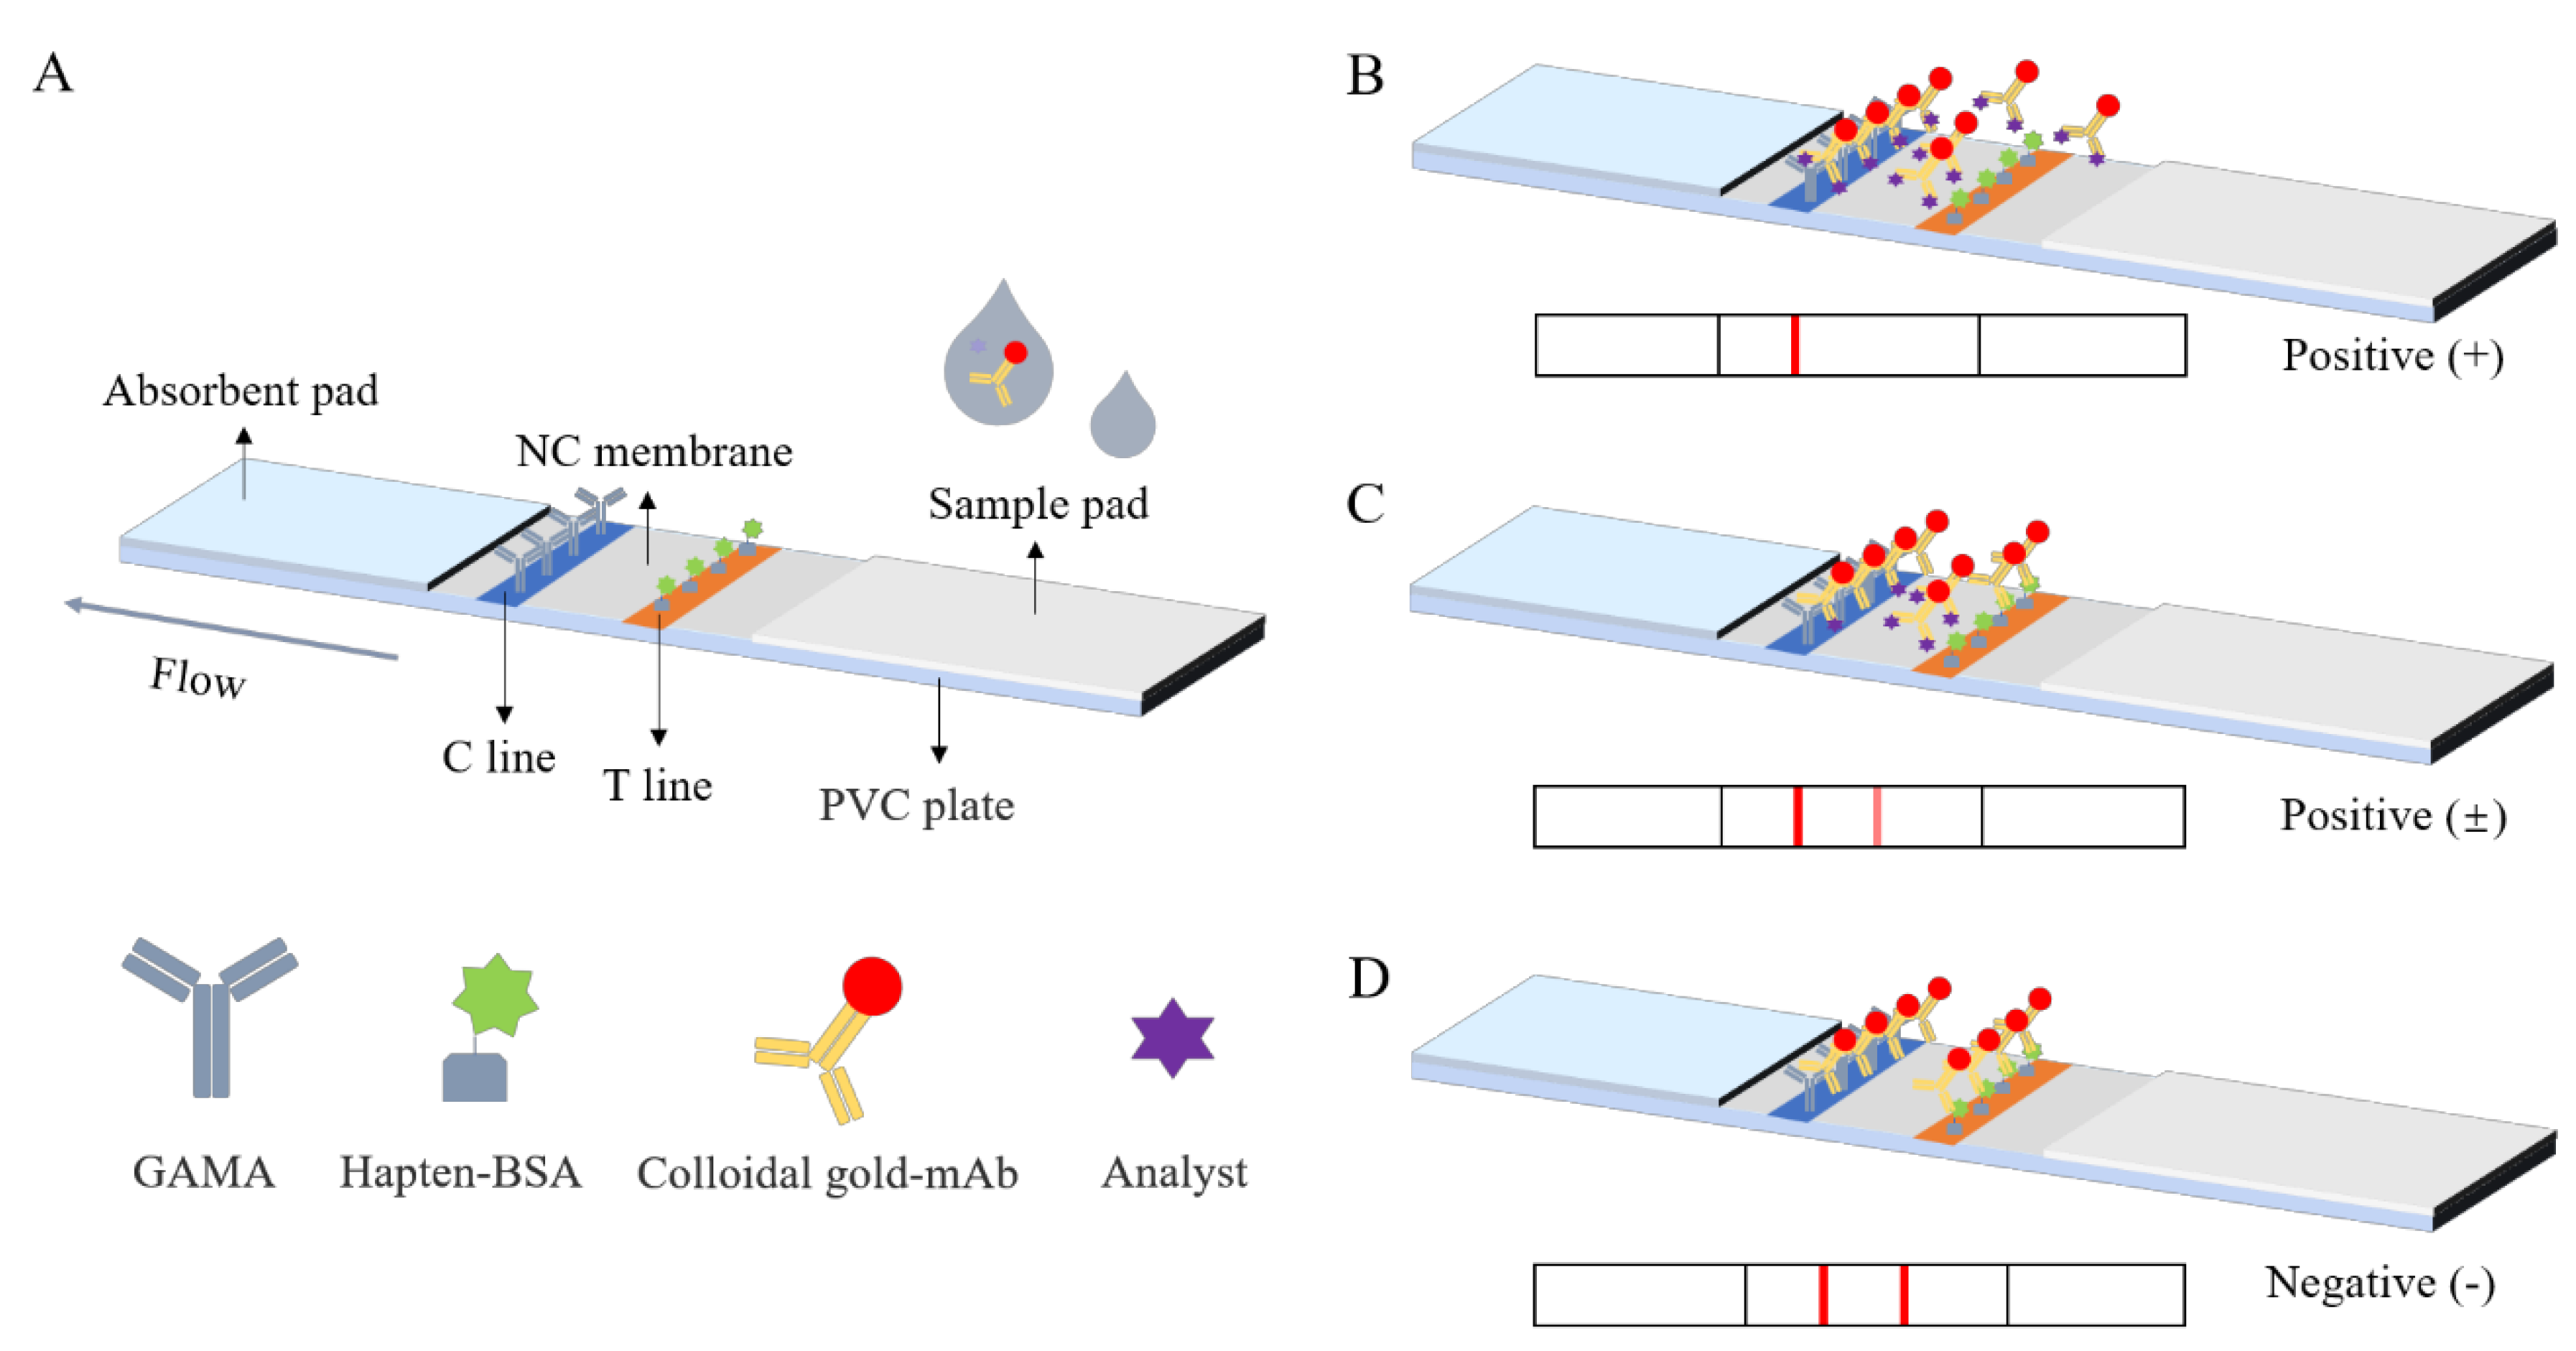
2.5. Preparation of LFIA Strips
2.6. Principle of LFIA Strip
2.7. Optimization of Ic-ELISA and LFIA
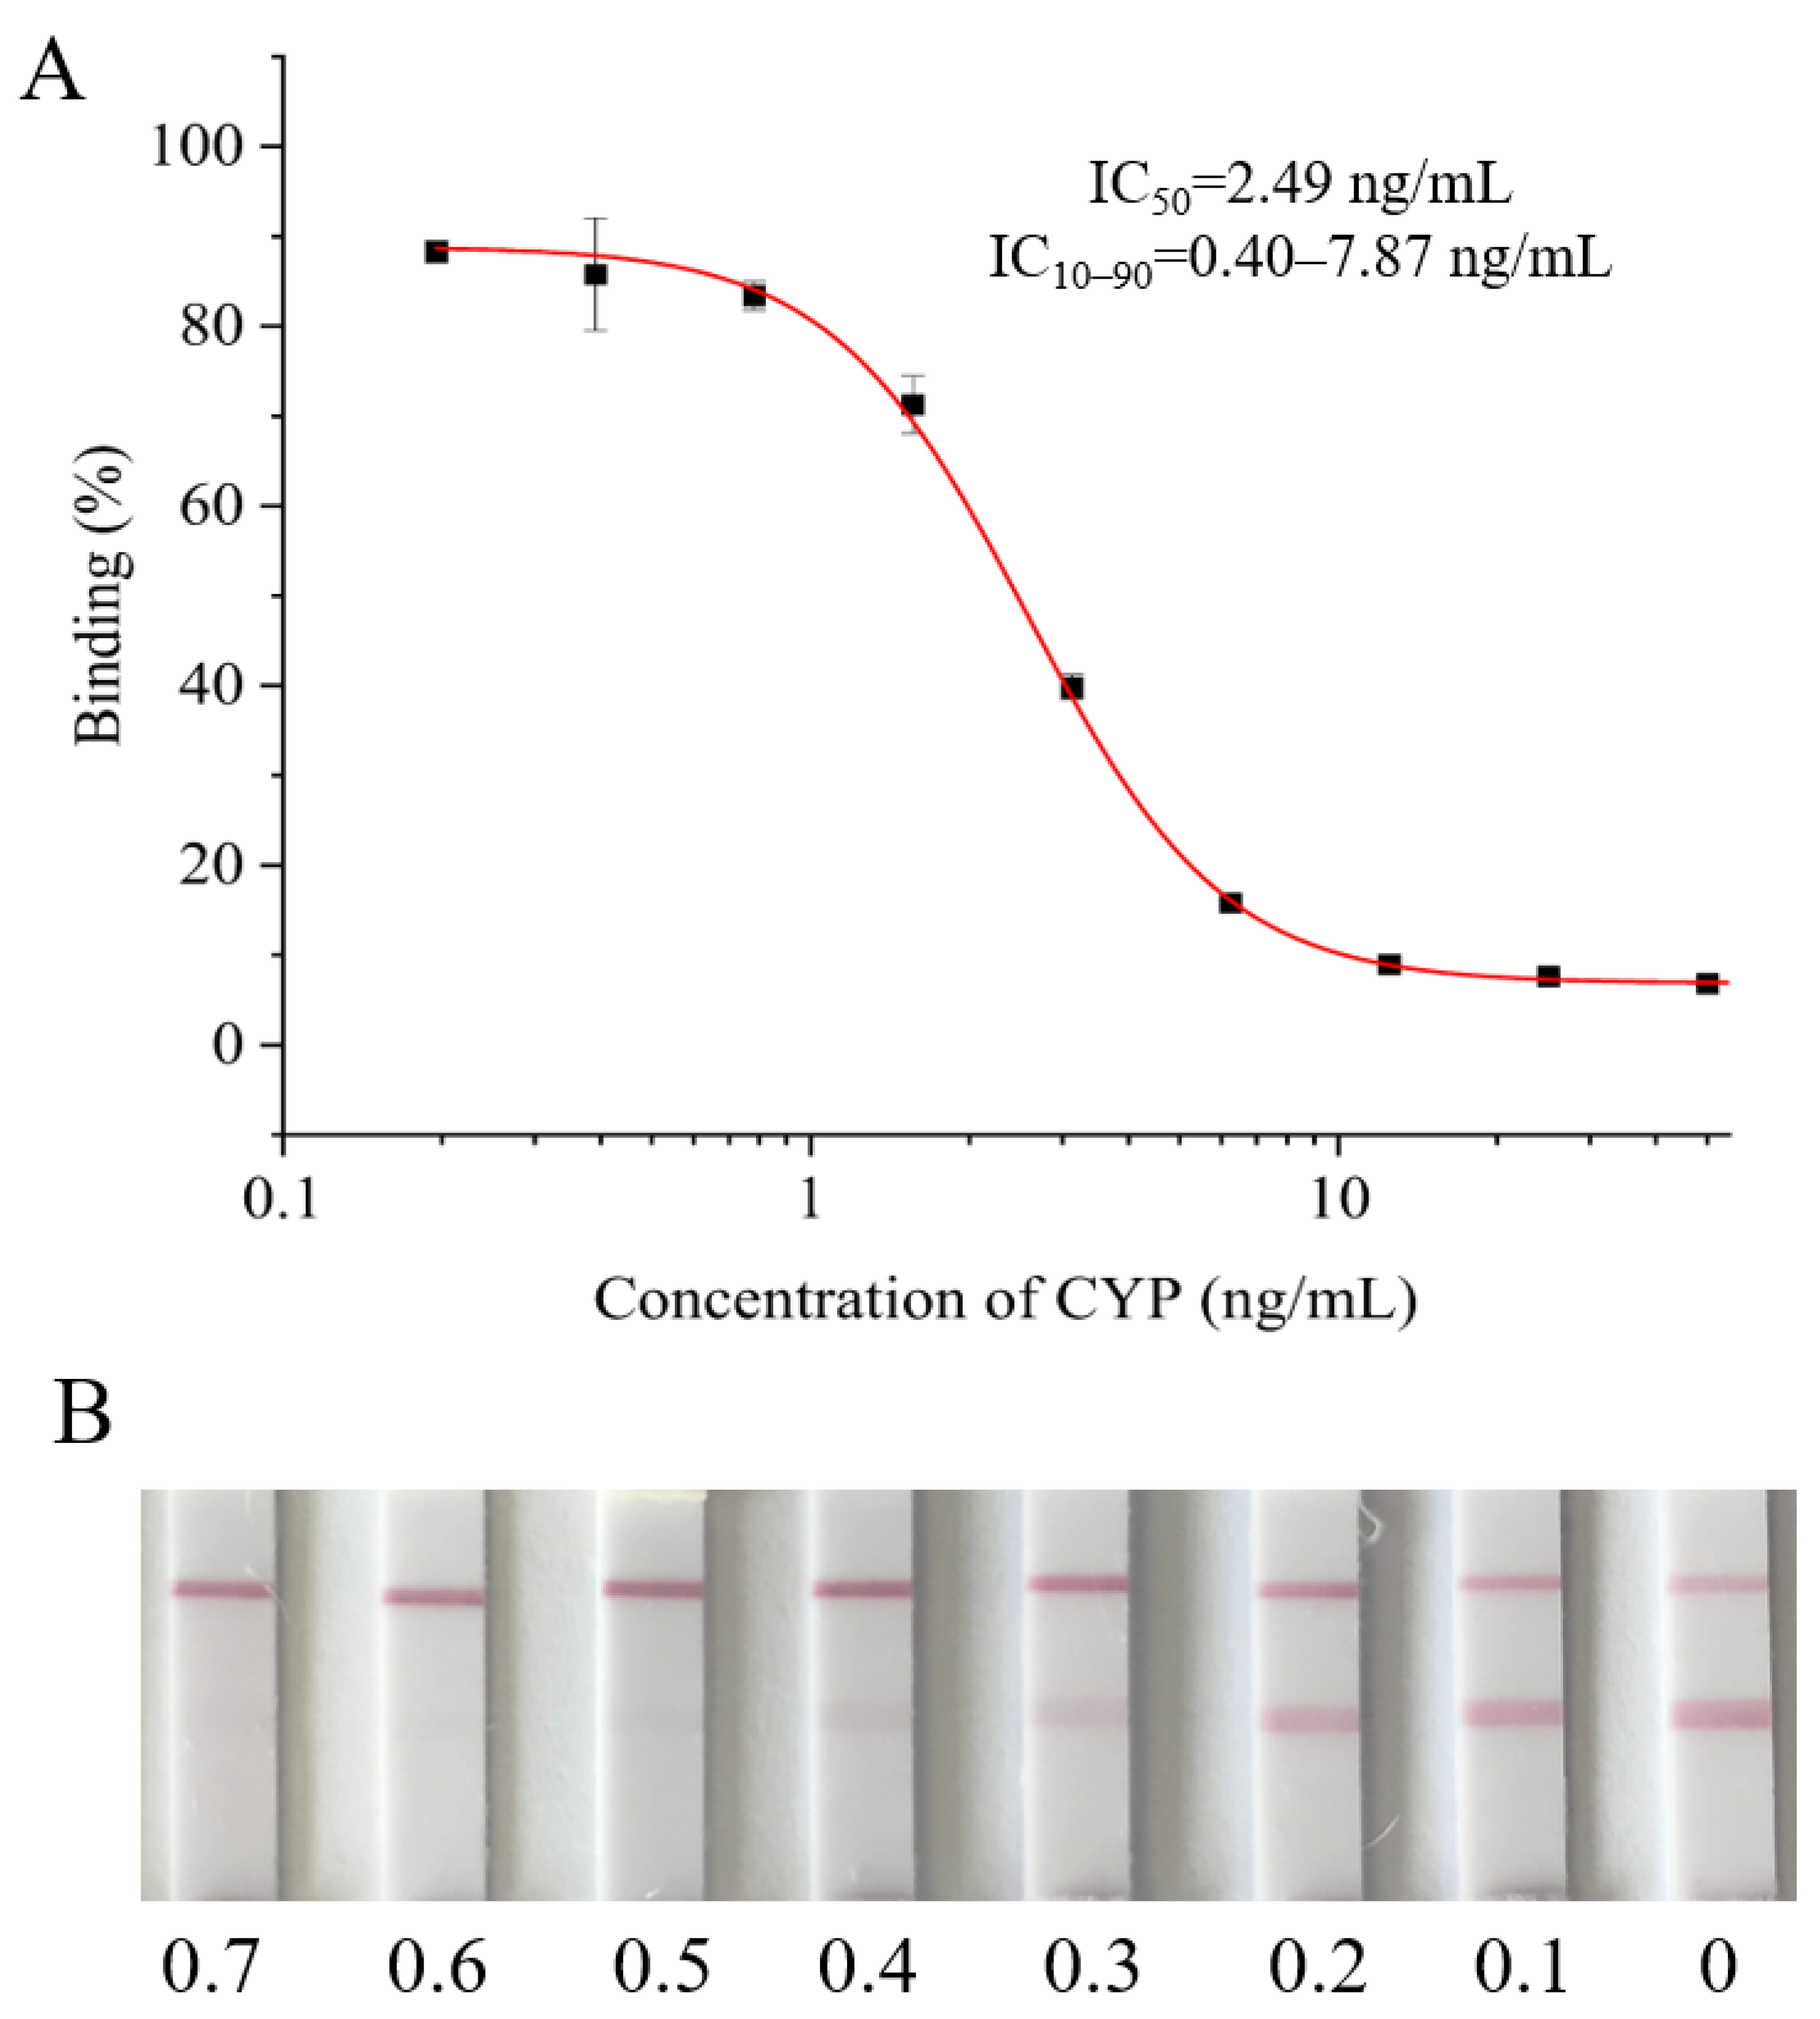
2.8. Sensitivity of Ic-ELISA and LFIA
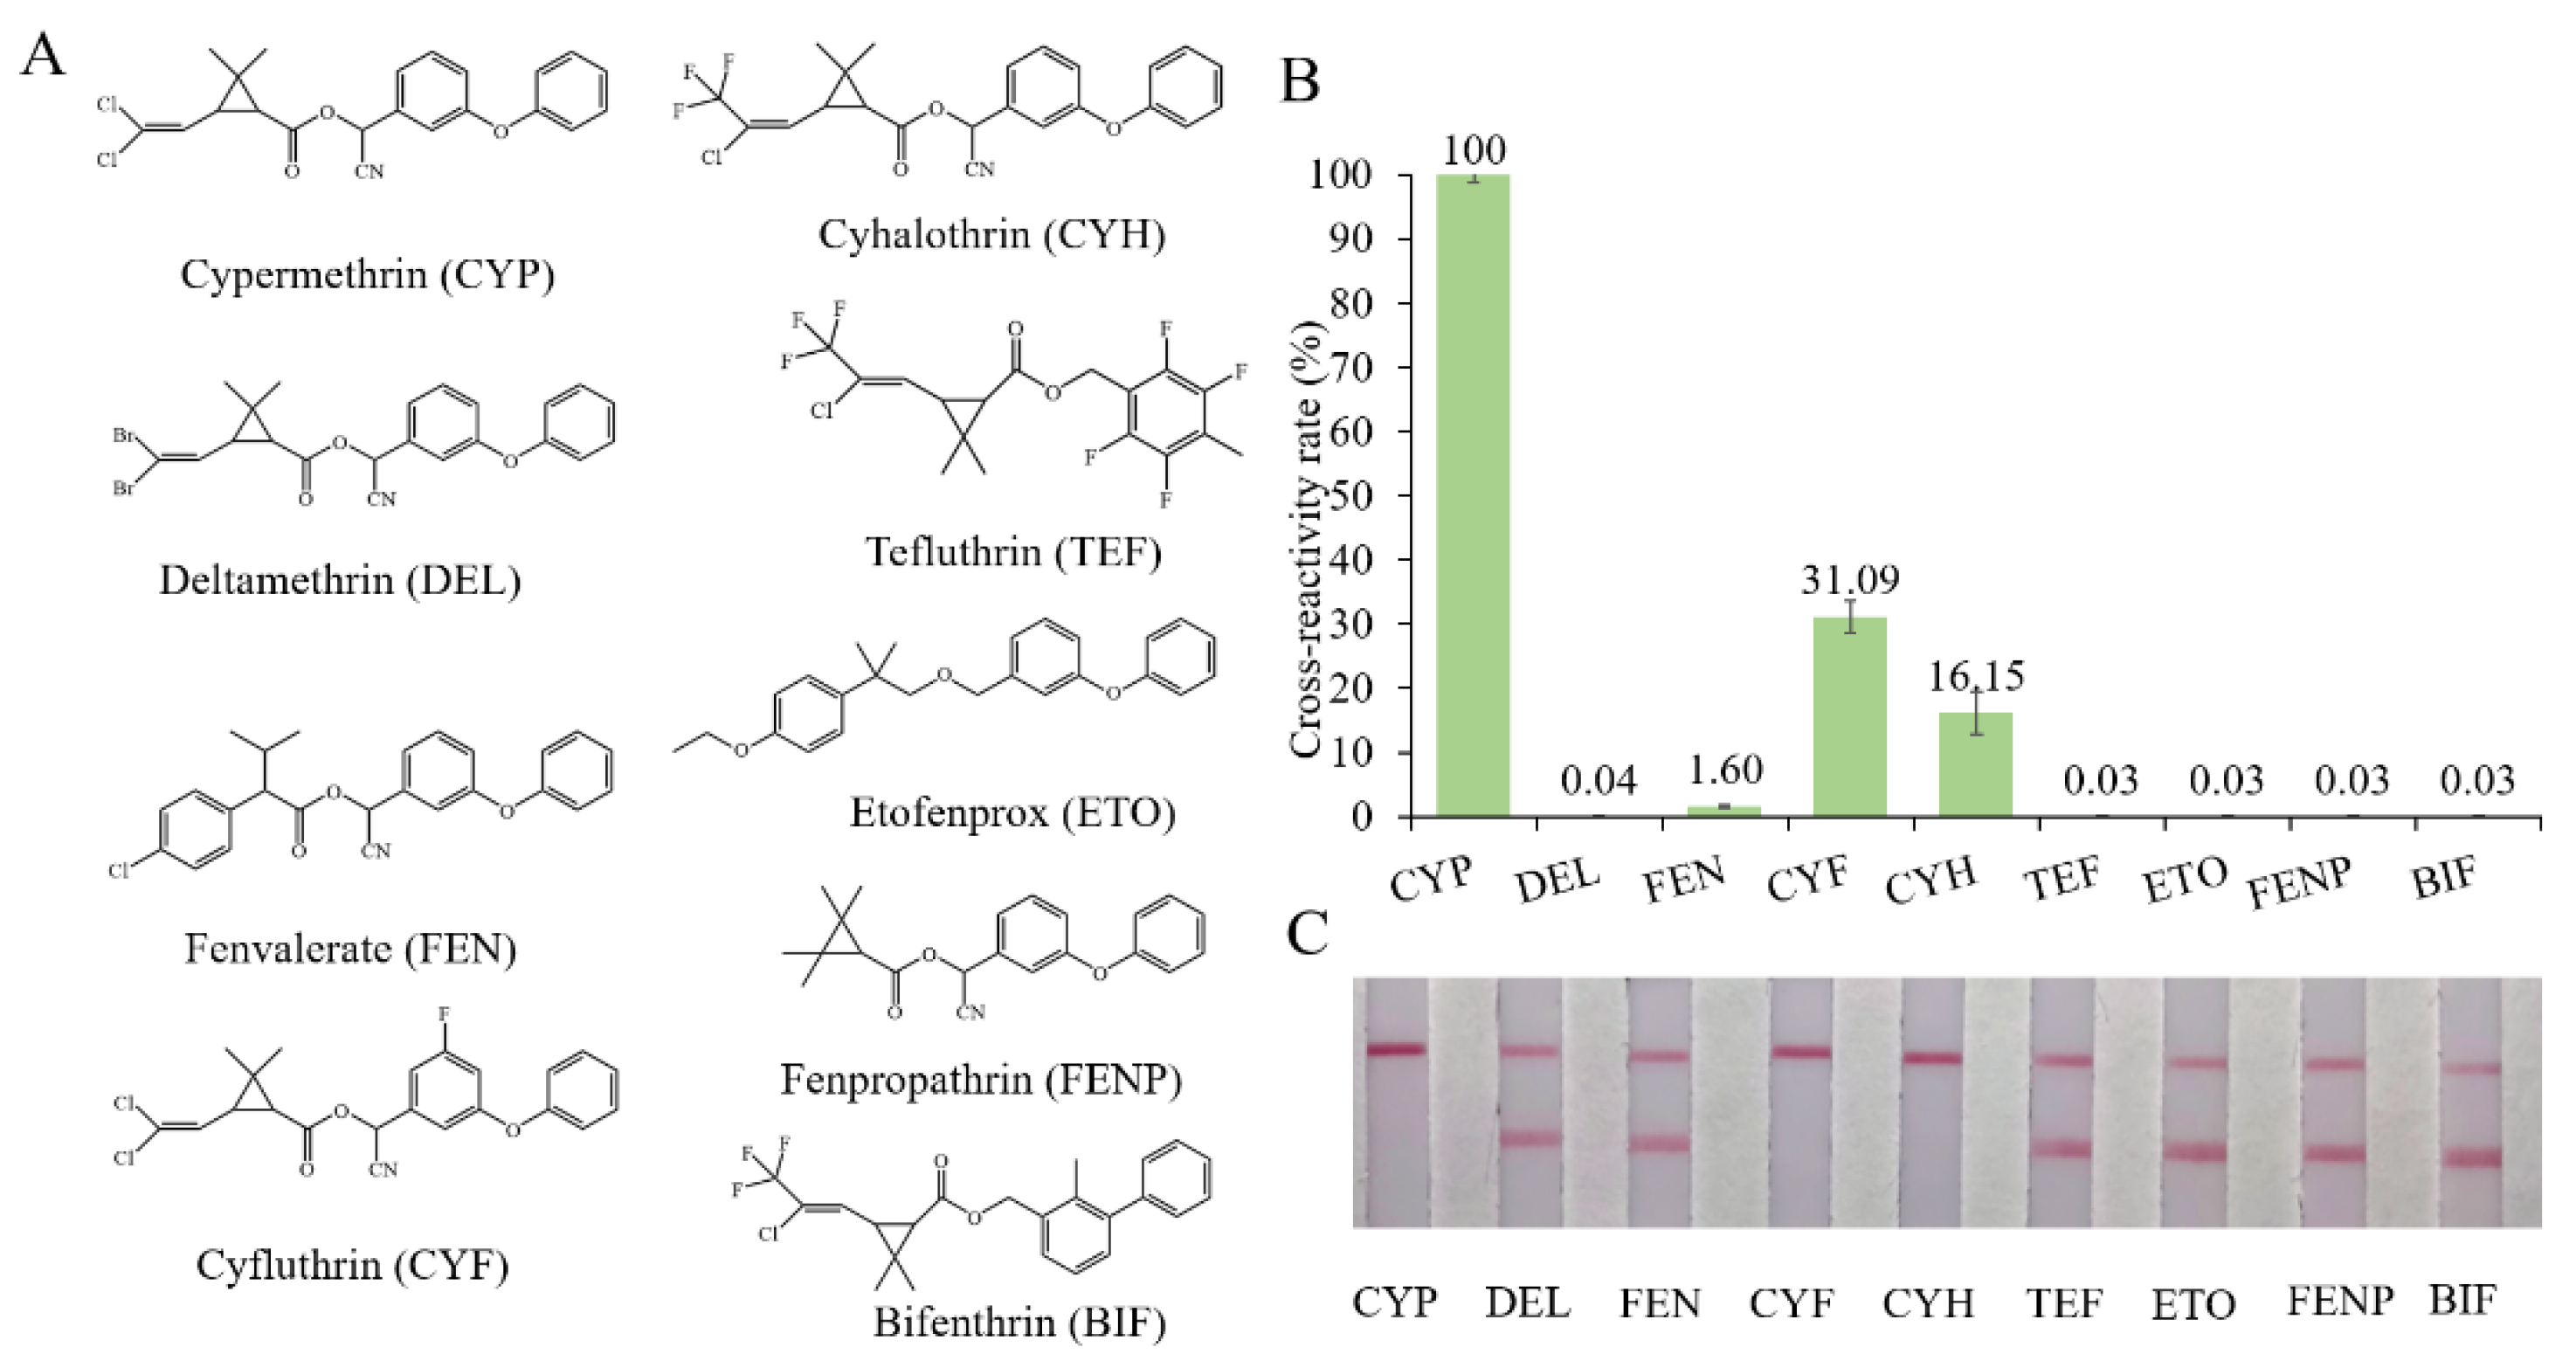
2.9. Specificity of Ic-ELISA and LFIA
2.10. Analysis of Spiked Samples
3. Results
3.1. Identification of Antigens
3.2. Characterization of mAb
3.3. Identification of Colloidal Gold Labeled mAb
3.4. Optimization of Ic-ELISA and LFIA
3.5. Sensitivity of Ic-ELISA and LFIA
3.6. Specificity of Ic-ELISA and LFIA
3.7. Eliminated of Matrix Effects
3.8. Recovery
3.9. Instrument Validation
4. Conclusions
Supplementary Materials
Author Contributions
Funding
Institutional Review Board Statement
Data Availability Statement
Acknowledgments
Conflicts of Interest
References
- Zhao, H.; Wang, Y.; Liu, Y.; Yin, K.; Wang, D.; Li, B.; Yu, H.; Xing, M. ROS-induced hepatotoxicity under cypermethrin: Involvement of the crosstalk between nrf2/keap1 and nf-kappa b/i kappa b-alpha pathways regulated by proteasome. Environ. Sci. Technol. 2021, 55, 6171–6183. [Google Scholar] [CrossRef] [PubMed]
- Singh, S.; Mukherjee, A.; Jaiswal, D.K.; de Araujo Pereira, A.P.; Prasad, R.; Sharma, M.; Kuhad, R.C.; Shukla, A.C.; Verma, J.P. Advances and future prospects of pyrethroids: Toxicity and microbial degradation. Sci. Total Environ. 2022, 829, 154561. [Google Scholar] [CrossRef] [PubMed]
- Wang, H.; Wang, Q.; Zhao, X.-F.; Liu, P.; Meng, X.-H.; Yu, T.; Ji, Y.-L.; Zhang, H.; Zhang, C.; Zhang, Y.; et al. Cypermethrin exposure during puberty disrupts testosterone synthesis via downregulating StAR in mouse testes. Arch. Toxicol. 2010, 84, 53–61. [Google Scholar] [CrossRef]
- Institoris, L.; Undeger, U.; Siroki, O.; Nehez, M.; Desi, I. Comparison of detection sensitivity of immuno- and genotoxicological effects of subacute cypermethrin and permethrin exposure in rats. Toxicology 1999, 137, 47–55. [Google Scholar] [CrossRef]
- Macedo, M.B.; Cunha, E.O.; Reis, A.D.; Machado, M.S.; de Campos, D.; Malysz, T.; Dallegrave, E. Morphometric evaluation of the recurrent laryngeal nerve of wistar rats exposed to pesticides. J. Voice Off. J. Voice Found. 2021. [Google Scholar] [CrossRef]
- Sharma, K.K.; Tripathy, V.; Sharma, K.; Gupta, R.; Yadav, R.; Devi, S.; Walia, S. Long-term monitoring of 155 multi-class pesticide residues in Indian vegetables and their risk assessment for consumer safety. Food Chem. 2022, 373, 131518. [Google Scholar] [CrossRef] [PubMed]
- Paiga, P.; Sousa, S.; Vera, J.; Bitencourt, L.; Vieira, J.; Jorge, S.; Silva, J.G.; Correia, M.; Domingues, V.F.; Delerue-Matos, C. Multi-residue analysis of fifty pesticides in river waters and in wastewaters. Environ. Sci. Pollut. Res. 2021, 28, 66787–66803. [Google Scholar] [CrossRef] [PubMed]
- Yuan, Y.; Chen, C.; Zheng, C.; Wang, X.; Yang, G.; Wang, Q.; Zhang, Z. Residue of chlorpyrifos and cypermethrin in vegetables and probabilistic exposure assessment for consumers in zhejiang province, China. Food Control. 2014, 36, 63–68. [Google Scholar] [CrossRef]
- Hu, Y.; Ji, L.; Zhang, Y.; Shi, R.; Han, W.; Tse, L.A.; Pan, R.; Wang, Y.; Ding, G.; Xu, J.; et al. Organophosphate and pyrethroid pesticide exposures measured before conception and associations with time to pregnancy in chinese couples enrolled in the shanghai birth cohort. Environ. Health Perspect. 2018, 126, 077001. [Google Scholar] [CrossRef] [PubMed]
- Vanacker, M.; Quindroit, P.; Angeli, K.; Mandin, C.; Glorennec, P.; Brochot, C.; Crepet, A. Aggregate and cumulative chronic risk assessment for pyrethroids in the French adult population. Food Chem. Toxicol. 2020, 143, 111519. [Google Scholar] [CrossRef]
- Prata, R.; Lopez-Ruiz, R.; Petrarca, M.H.; Godoy, H.T.; Frenich, A.G.; Romero-Gonzalez, R. Targeted and non-targeted analysis of pesticides and aflatoxins in baby foods by liquid chromatography coupled to quadrupole Orbitrap mass spectrometry. Food Control. 2022, 139, 109072. [Google Scholar] [CrossRef]
- Lin, H.M.; Gerrard, J.A.; Shaw, I.C. Stability of the insecticide cypermethrin during tomato processing and implications for endocrine activity. Food Addit. Contam. Part. A-Chem. Anal. Control. Expo. Risk Assess. 2005, 22, 15–22. [Google Scholar] [CrossRef] [PubMed]
- Lee, H.J.; Shan, G.M.; Ahn, K.C.; Park, E.K.; Watanabe, T.; Gee, S.J.; Hammock, B.D. Development of an enzyme-linked Immunosorbent assay for the pyrethroid cypermethrin. J. Agric. Food Chem. 2004, 52, 1039–1043. [Google Scholar] [CrossRef]
- Taheri, N.; Lan, M.J.; Wei, P.; Liu, R.; Gui, W.J.; Guo, Y.R.; Zhu, G.N. Chemiluminescent enzyme immunoassay for rapid detection of three alpha-cyano pyrethroid residues in agricultural products. Food Anal. Methods 2016, 9, 2896–2905. [Google Scholar] [CrossRef]
- Zhang, C.; Wu, X.; Li, D.; Hu, J.; Wan, D.; Zhang, Z.; Hammock, B.D. Development of nanobody-based flow-through dot ELISA and lateral-flow immunoassay for rapid detection of 3-phenoxybenzoic acid. Anal. Methods 2021, 13, 1757–1765. [Google Scholar] [CrossRef]
- Huang, L.; Chen, H.; Cui, P.; Ding, Y.; Wang, M.; Hua, X. Development of immunoassay based on rational hapten design for sensitive detection of pendimethalin in environment. Sci. Total Environ. 2022, 830, 154690. [Google Scholar] [CrossRef]
- Chen, X.; Xu, L.; Ma, W.; Liu, L.; Kuang, H.; Wang, L.; Xu, C. General immunoassay for pyrethroids based on a monoclonal antibody. Food Agric. Immunol. 2014, 25, 341–349. [Google Scholar] [CrossRef]
- Zhao, Y.; Liang, Y.; Liu, Y.; Zhang, X.; Hu, X.; Tu, S.; Wu, A.; Zhang, C.; Zhong, J.; Zhao, S.; et al. Isolation of broad-specificity domain antibody from phage library for development of pyrethroid immunoassay. Anal. Biochem. 2016, 502, 1–7. [Google Scholar] [CrossRef] [PubMed]
- Kranthi, K.R.; Davis, M.; Mayee, C.D.; Russell, D.A.; Shukla, R.M.; Satija, U.; Kshirsagar, M.; Shiware, D.; Kranthi, S. Development of a colloidal-gold based lateral-flow immunoassay kit for ‘quality-control’ assessment of pyrethroid and endosulfan formulations in a novel single strip format. Crop. Prot. 2009, 28, 428–434. [Google Scholar] [CrossRef]
- Hu, J.; Guo, Y.R.; Liang, X.; Liu, X.J.; Zhu, G.N.; Liu, F.Q.; Wang, M.H.; Wang, L.M.; Hua, X.D.; Zhang, C.Z. Lateral flow immunoassay for simultaneous determination of four kinds of pyrethroid pesticides in vegetables and fruits. Chin. J. Anal. Chem. 2016, 44, 1900–1906. [Google Scholar] [CrossRef]
- Wengatz, I.; Stoutamire, D.W.; Gee, S.J.; Hammock, B.D. Development of an enzyme-linked immunosorbent assay for the detection of the pyrethroid insecticide fenpropathrin. J. Agric. Food Chem. 1998, 46, 2211–2221. [Google Scholar] [CrossRef]
- Queffelec, A.L.; Nodet, P.; Haelters, J.P.; Thouvenot, D.; Corbel, B. Hapten synthesis for a monoclonal antibody based ELISA for deltamethrin. J. Agric. Food Chem. 1998, 46, 1670–1676. [Google Scholar] [CrossRef]
- Li, J.; Ding, Y.; Chen, H.; Sun, L.; Huang, Y.; Liu, F.; Wang, M.; Hua, X. Development of an indirect competitive enzyme-linked immunosorbent assay for propiconazole based on monoclonal antibody. Food Control. 2022, 134, 108751. [Google Scholar] [CrossRef]
- Fang, S.; Zhang, B.; Ren, K.W.; Cao, M.M.; Shi, H.Y.; Wang, M.H. Development of a sensitive indirect competitive enzyme-linked immunosorbent assay (ic-ELISA) based on the monoclonal antibody for the detection of the imidaclothiz residue. J. Agric. Food Chem. 2011, 59, 1594–1597. [Google Scholar] [CrossRef]
- Chronopoulou, E.; Uribe-Benninghoff, A.; Corbett, C.R.; Berry, J.D. Hybridoma Technology for the generation of rodent mabs via classical fusion. In Monoclonal Antibodies: Methods and Protocols, 2nd ed.; Ossipow, V., Fischer, N., Eds.; Methods in Molecular Biology; Humana Press: Totowa, NJ, USA, 2014; Volume 1131, pp. 47–70. [Google Scholar]
- Sepehr, K.S.; Baradaran, B.; Majidi, J.; Abdolalizadeh, J.; Aghebati, L.; Shahneh, F.Z. Development and characterization of monoclonal antibodies against human CD20 in Balb/c mice. Hum. Antibodies 2012, 21, 57–64. [Google Scholar] [CrossRef]
- Hua, X.; Wang, L.; Li, G.; Fang, Q.; Wang, M.; Liu, F. Multi-analyte enzyme-linked immunosorbent assay for organophosphorus pesticides and neonicotinoid insecticides using a bispecific monoclonal antibody. Anal. Methods 2013, 5, 1556–1563. [Google Scholar] [CrossRef]
- Chen, H.; Ding, Y.; Li, J.; Huang, L.; Gonzalez-Sapienza, G.; Hammock, B.D.; Wang, M.; Hua, X. New approach to generate ratiometric signals on immunochromatographic strips for small molecules. Anal. Chem. 2022, 94, 7358–7367. [Google Scholar] [CrossRef]
- Liu, J.; Xu, X.; Wu, A.; Wang, Z.; Song, S.; Kuang, H.; Liu, L.; Xu, C. Preparing monoclonal antibodies and developing immunochromatographic assay strips for the determination of propamocarb levels. Food Chem. 2022, 370, 131284. [Google Scholar] [CrossRef]
- Lew, A.M. The effect of epitope density and antibody affinity on the ELISA as analysed by monoclonal antibodies. J. Immunol. Methods 1984, 72, 171–176. [Google Scholar] [CrossRef]
- You, T.; Ding, Y.; Chen, H.; Song, G.; Huang, L.; Wang, M.; Hua, X. Development of competitive and noncompetitive immunoassays for clothianidin with high sensitivity and specificity using phage-displayed peptides. J. Hazard. Mater. 2022, 425, 128011. [Google Scholar] [CrossRef]


| Hapten | Chemical Structure | Reference |
|---|---|---|
| CYP | 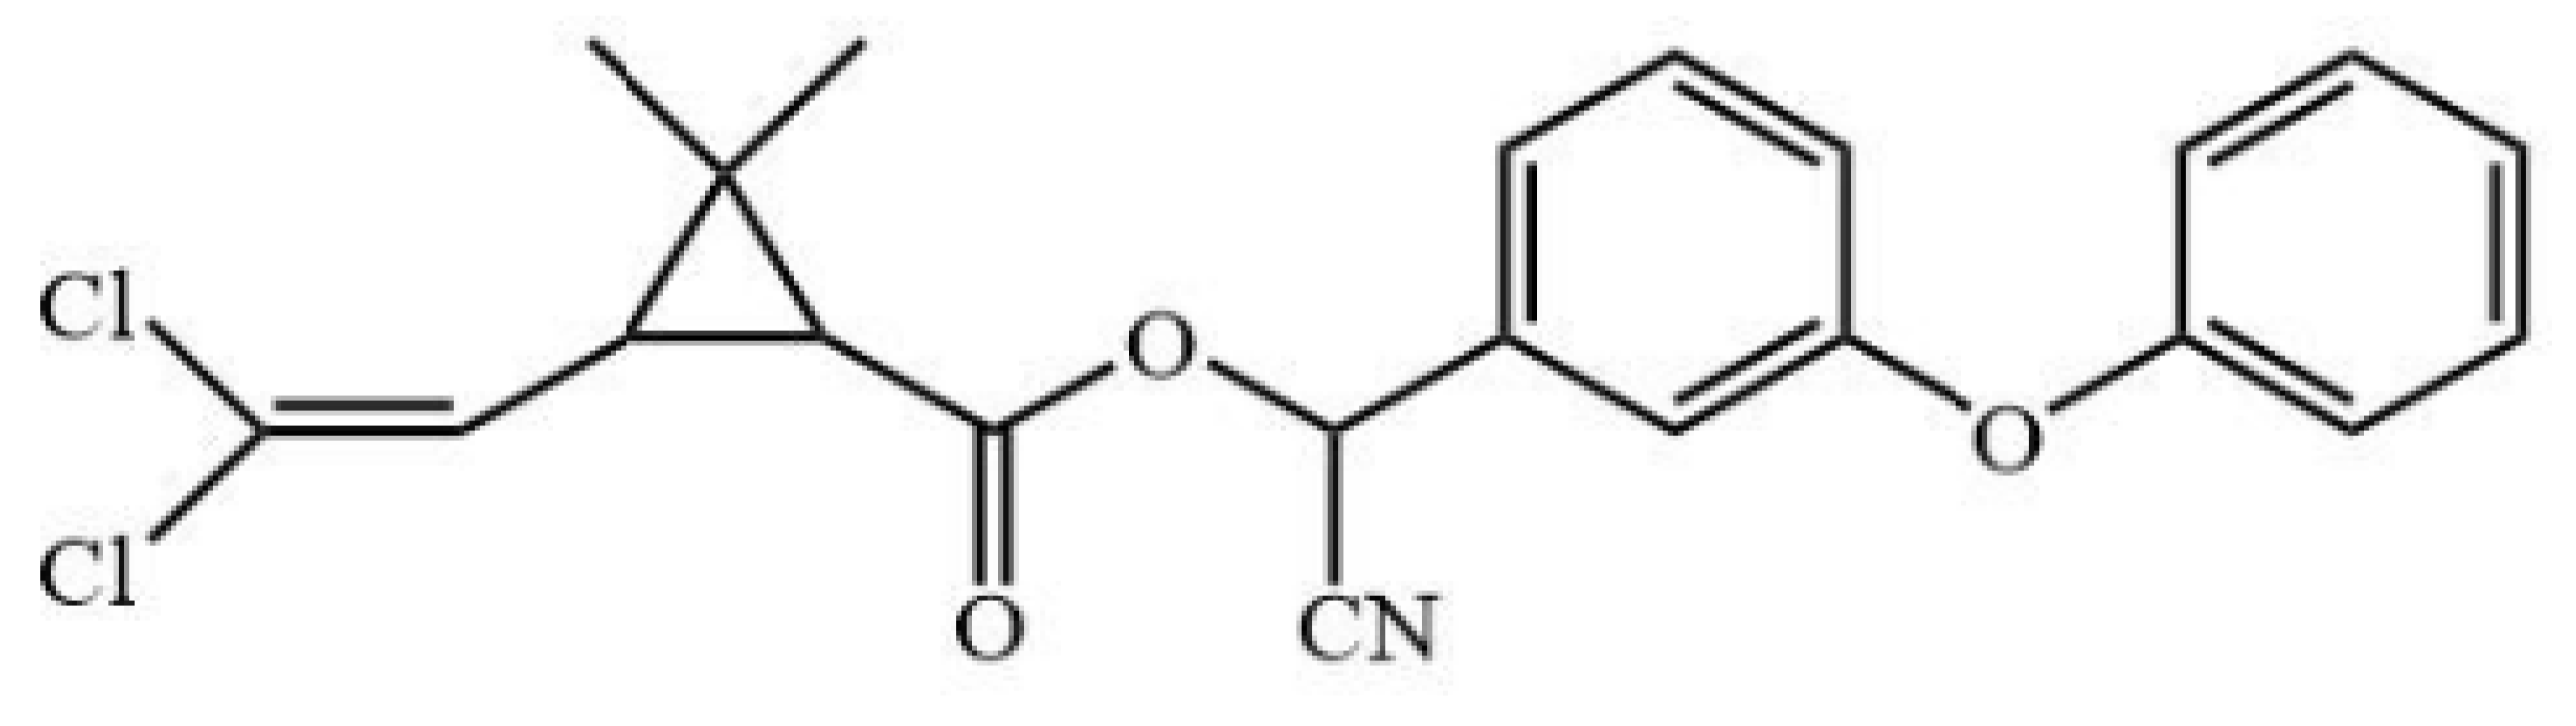 | / |
| Hapten 1 | 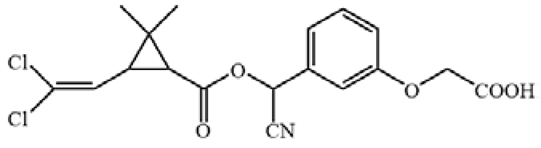 | [13] |
| Hapten 2 | 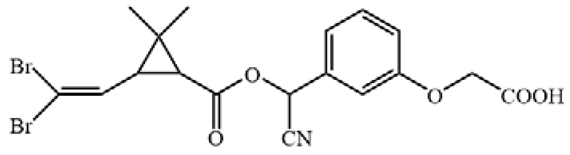 | [13] |
| Hapten 3 | 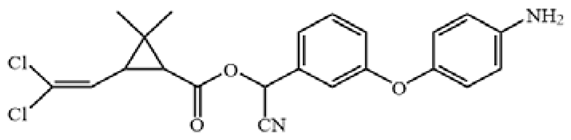 | [13] |
| Hapten 4 | 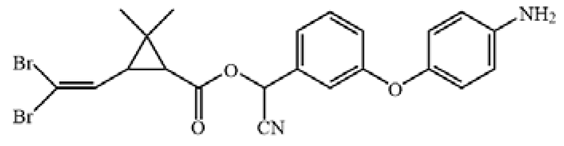 | [13] |
| Hapten 5 | 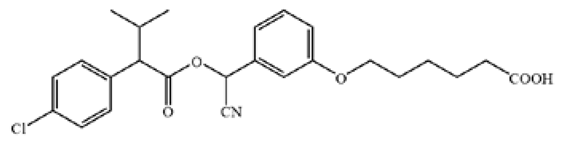 | [21] |
| Hapten 6 |  | [21] |
| Hapten 7 | 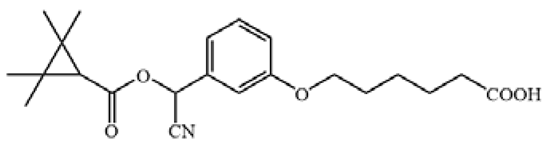 | [21] |
| Sample | ic-ELISA | LFIA | ||||||
|---|---|---|---|---|---|---|---|---|
| Spiked (μg/g) | Test Value ±SD (ng/g) | Recovery (%) | RSD (%) | Spiked (μg/g) | Result | |||
| Tomato | 0.1 | 81.4 ± 1.8 | 81.4 | 1.5 | 0.75 | - a | - | - |
| 0.2 | 161.8 ± 4.9 | 80.9 | 2.0 | 1.5 | ± b | ± | ± | |
| 0.4 | 330.4 ± 12.1 | 82.6 | 2.5 | 3 | + c | + | + | |
| Cabbage | 0.1 | 78.8 ± 1.0 | 78.8 | 0.8 | 0.75 | - | - | - |
| 0.2 | 160.6 ± 5.2 | 80.3 | 2.1 | 1.5 | ± | ± | ± | |
| 0.4 | 349.2 ± 1.4 | 87.3 | 0.3 | 3 | + | + | + | |
| Romaine Lettuce | 0.1 | 81.5 ± 3.8 | 81.5 | 3.1 | 1.5 | - | - | - |
| 0.2 | 170.4 ± 3.8 | 85.2 | 1.6 | 3 | ± | ± | ± | |
| 0.4 | 350.4 ± 13.2 | 87.6 | 2.9 | 6 | + | + | + | |
| Method | Sample (ng/g) | |||||||||
|---|---|---|---|---|---|---|---|---|---|---|
| 1 | 2 | 3 | 4 | 5 | 6 | 7 | 8 | 9 | 10 | |
| HPLC | 191.1 | 318.5 | 337.9 | 485.3 | 527.4 | 652.4 | 813.5 | 1353 | 3212 | 3511 |
| ic-ELISA | 204.8 | 300.1 | 352.6 | 450.4 | 545.3 | 615.2 | 821.3 | 1344 | 3222 | 3503 |
| LFIA | - a | - | - | - | - | - | - | - | ± b | ± |
Publisher’s Note: MDPI stays neutral with regard to jurisdictional claims in published maps and institutional affiliations. |
© 2022 by the authors. Licensee MDPI, Basel, Switzerland. This article is an open access article distributed under the terms and conditions of the Creative Commons Attribution (CC BY) license (https://creativecommons.org/licenses/by/4.0/).
Share and Cite
Huang, L.; Zhang, F.; Li, F.; Jia, Y.; Wang, M.; Hua, X.; Wang, L. Development of Ic-ELISA and Colloidal Gold Lateral Flow Immunoassay for the Determination of Cypermethrin in Agricultural Samples. Biosensors 2022, 12, 1058. https://doi.org/10.3390/bios12111058
Huang L, Zhang F, Li F, Jia Y, Wang M, Hua X, Wang L. Development of Ic-ELISA and Colloidal Gold Lateral Flow Immunoassay for the Determination of Cypermethrin in Agricultural Samples. Biosensors. 2022; 12(11):1058. https://doi.org/10.3390/bios12111058
Chicago/Turabian StyleHuang, Lianrun, Fuxuan Zhang, Fangxuan Li, Yin Jia, Minghua Wang, Xiude Hua, and Limin Wang. 2022. "Development of Ic-ELISA and Colloidal Gold Lateral Flow Immunoassay for the Determination of Cypermethrin in Agricultural Samples" Biosensors 12, no. 11: 1058. https://doi.org/10.3390/bios12111058
APA StyleHuang, L., Zhang, F., Li, F., Jia, Y., Wang, M., Hua, X., & Wang, L. (2022). Development of Ic-ELISA and Colloidal Gold Lateral Flow Immunoassay for the Determination of Cypermethrin in Agricultural Samples. Biosensors, 12(11), 1058. https://doi.org/10.3390/bios12111058