Comparison between Chest-Worn Accelerometer and Gyroscope Performance for Heart Rate and Respiratory Rate Monitoring


Abstract
1. Introduction
2. Materials and Methods
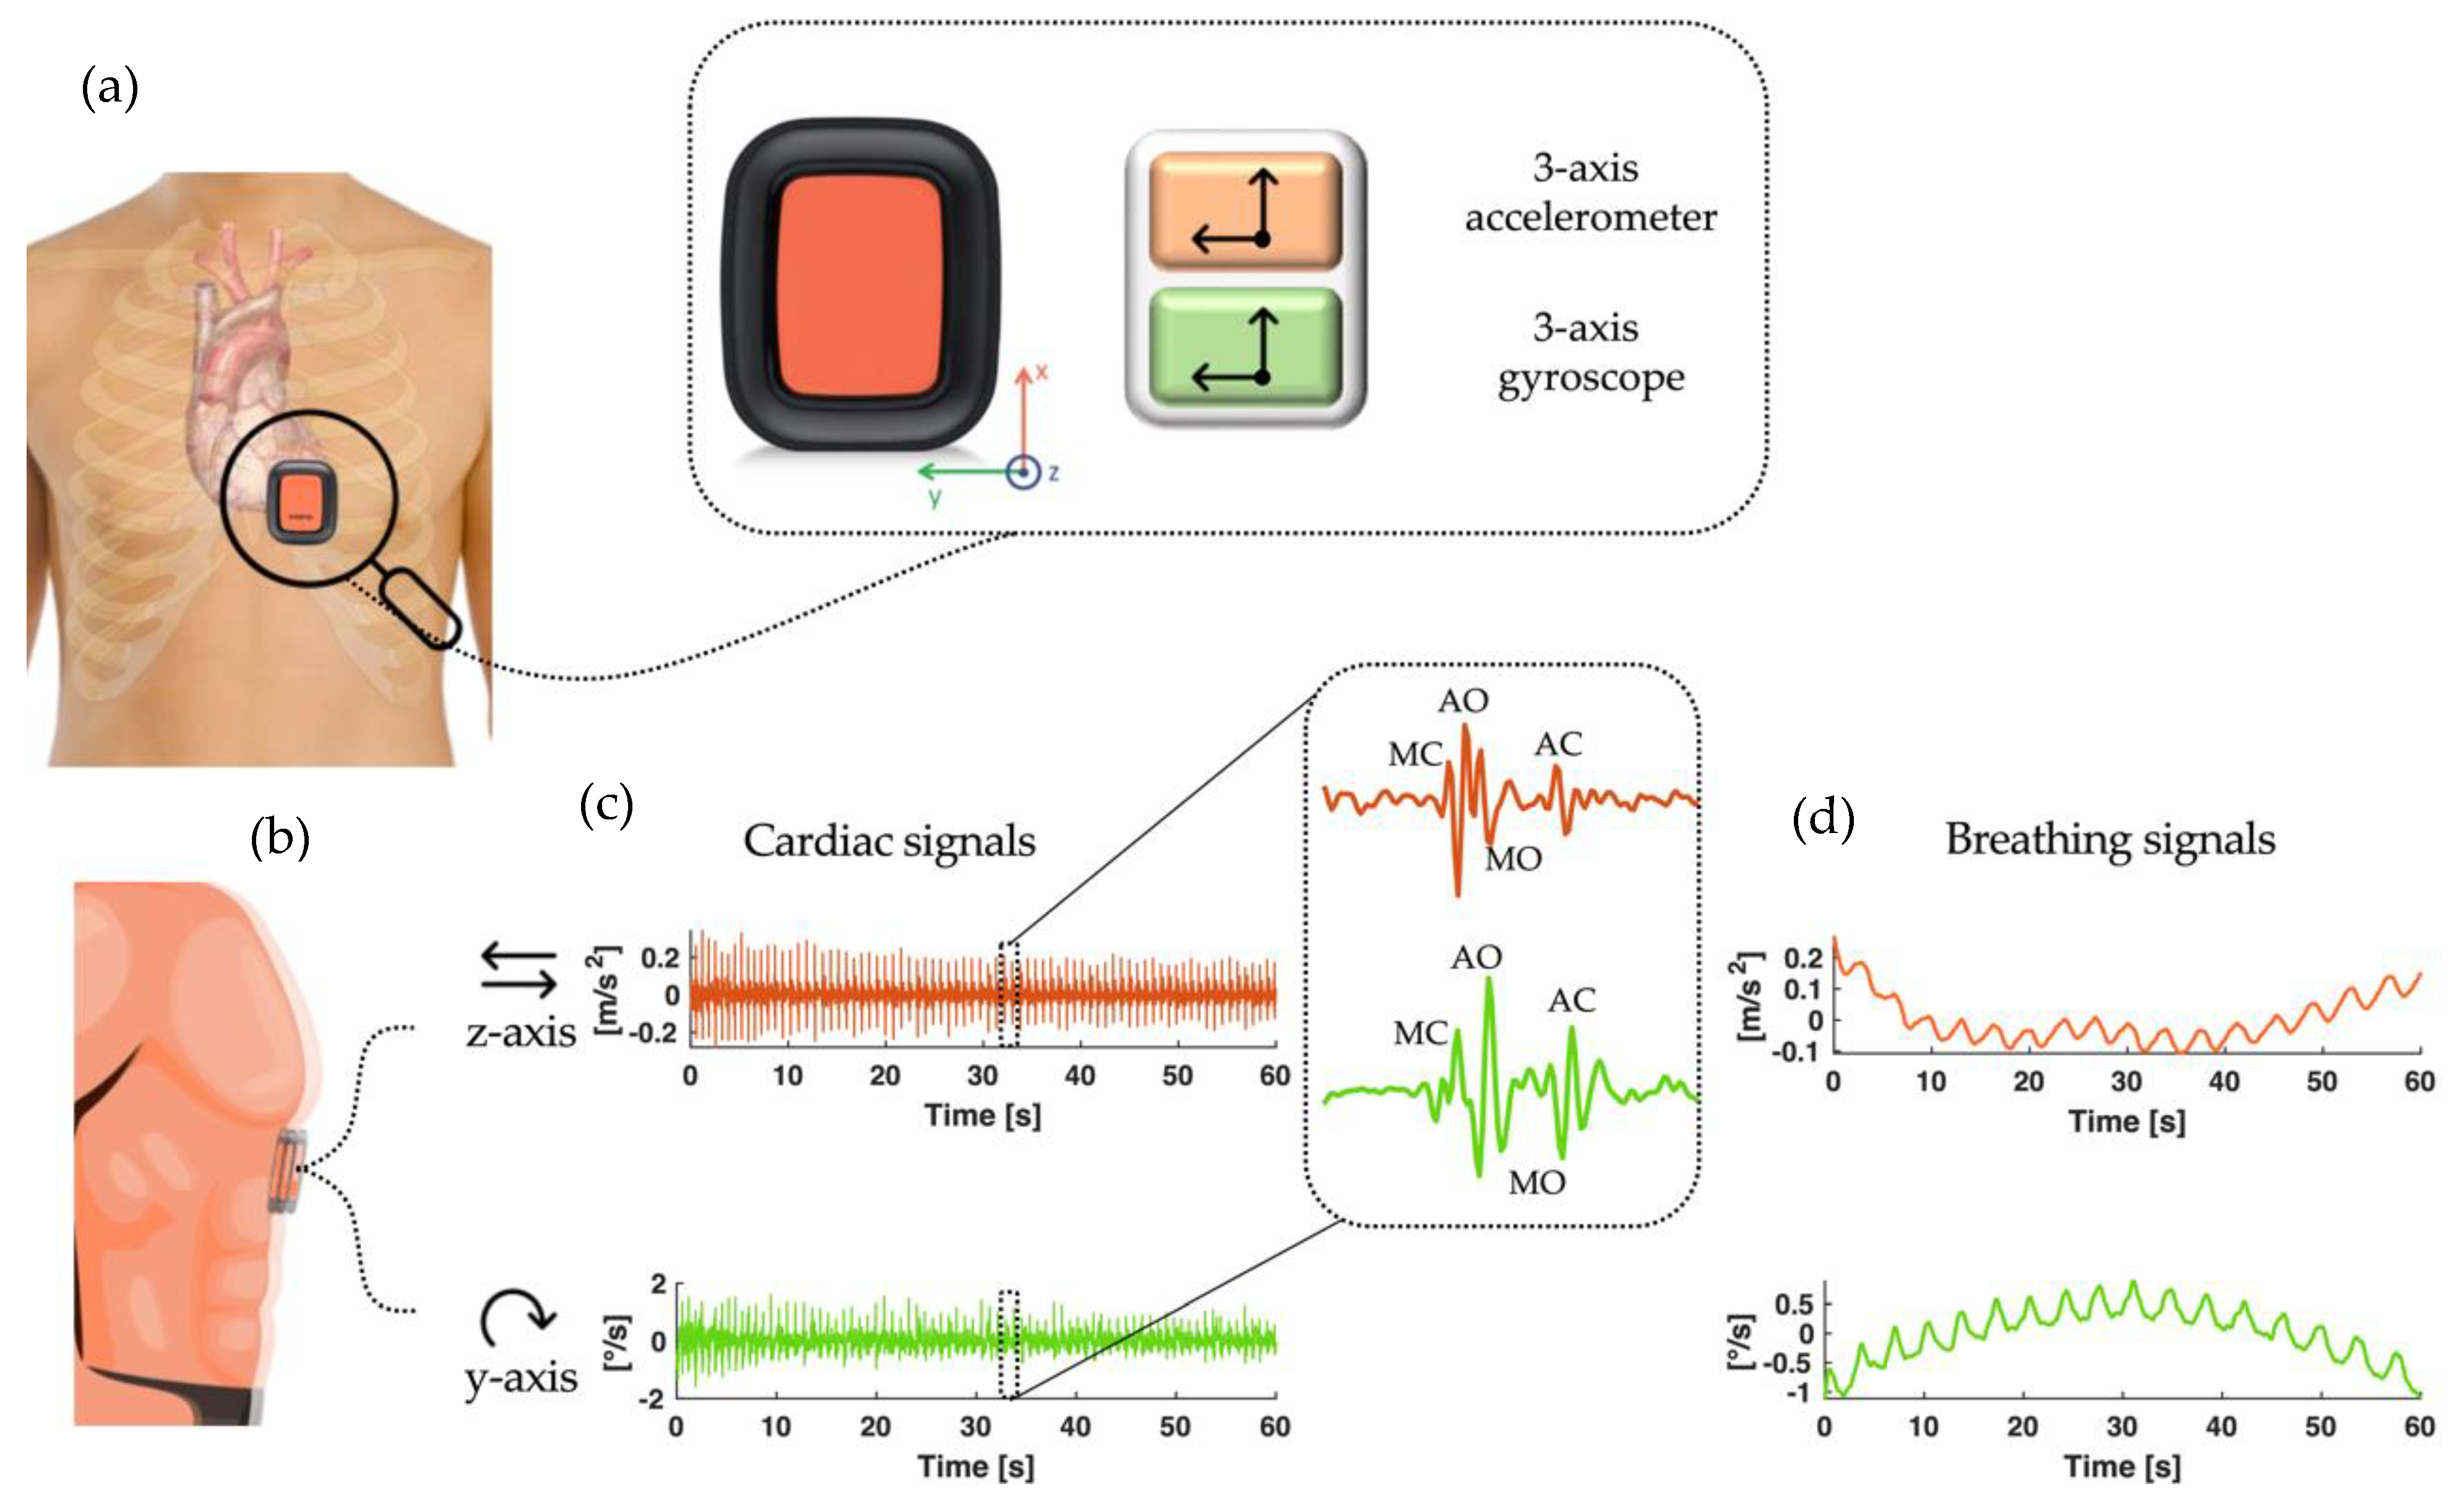
2.1. Cardiorespiratory Monitoring by IMU Sensors
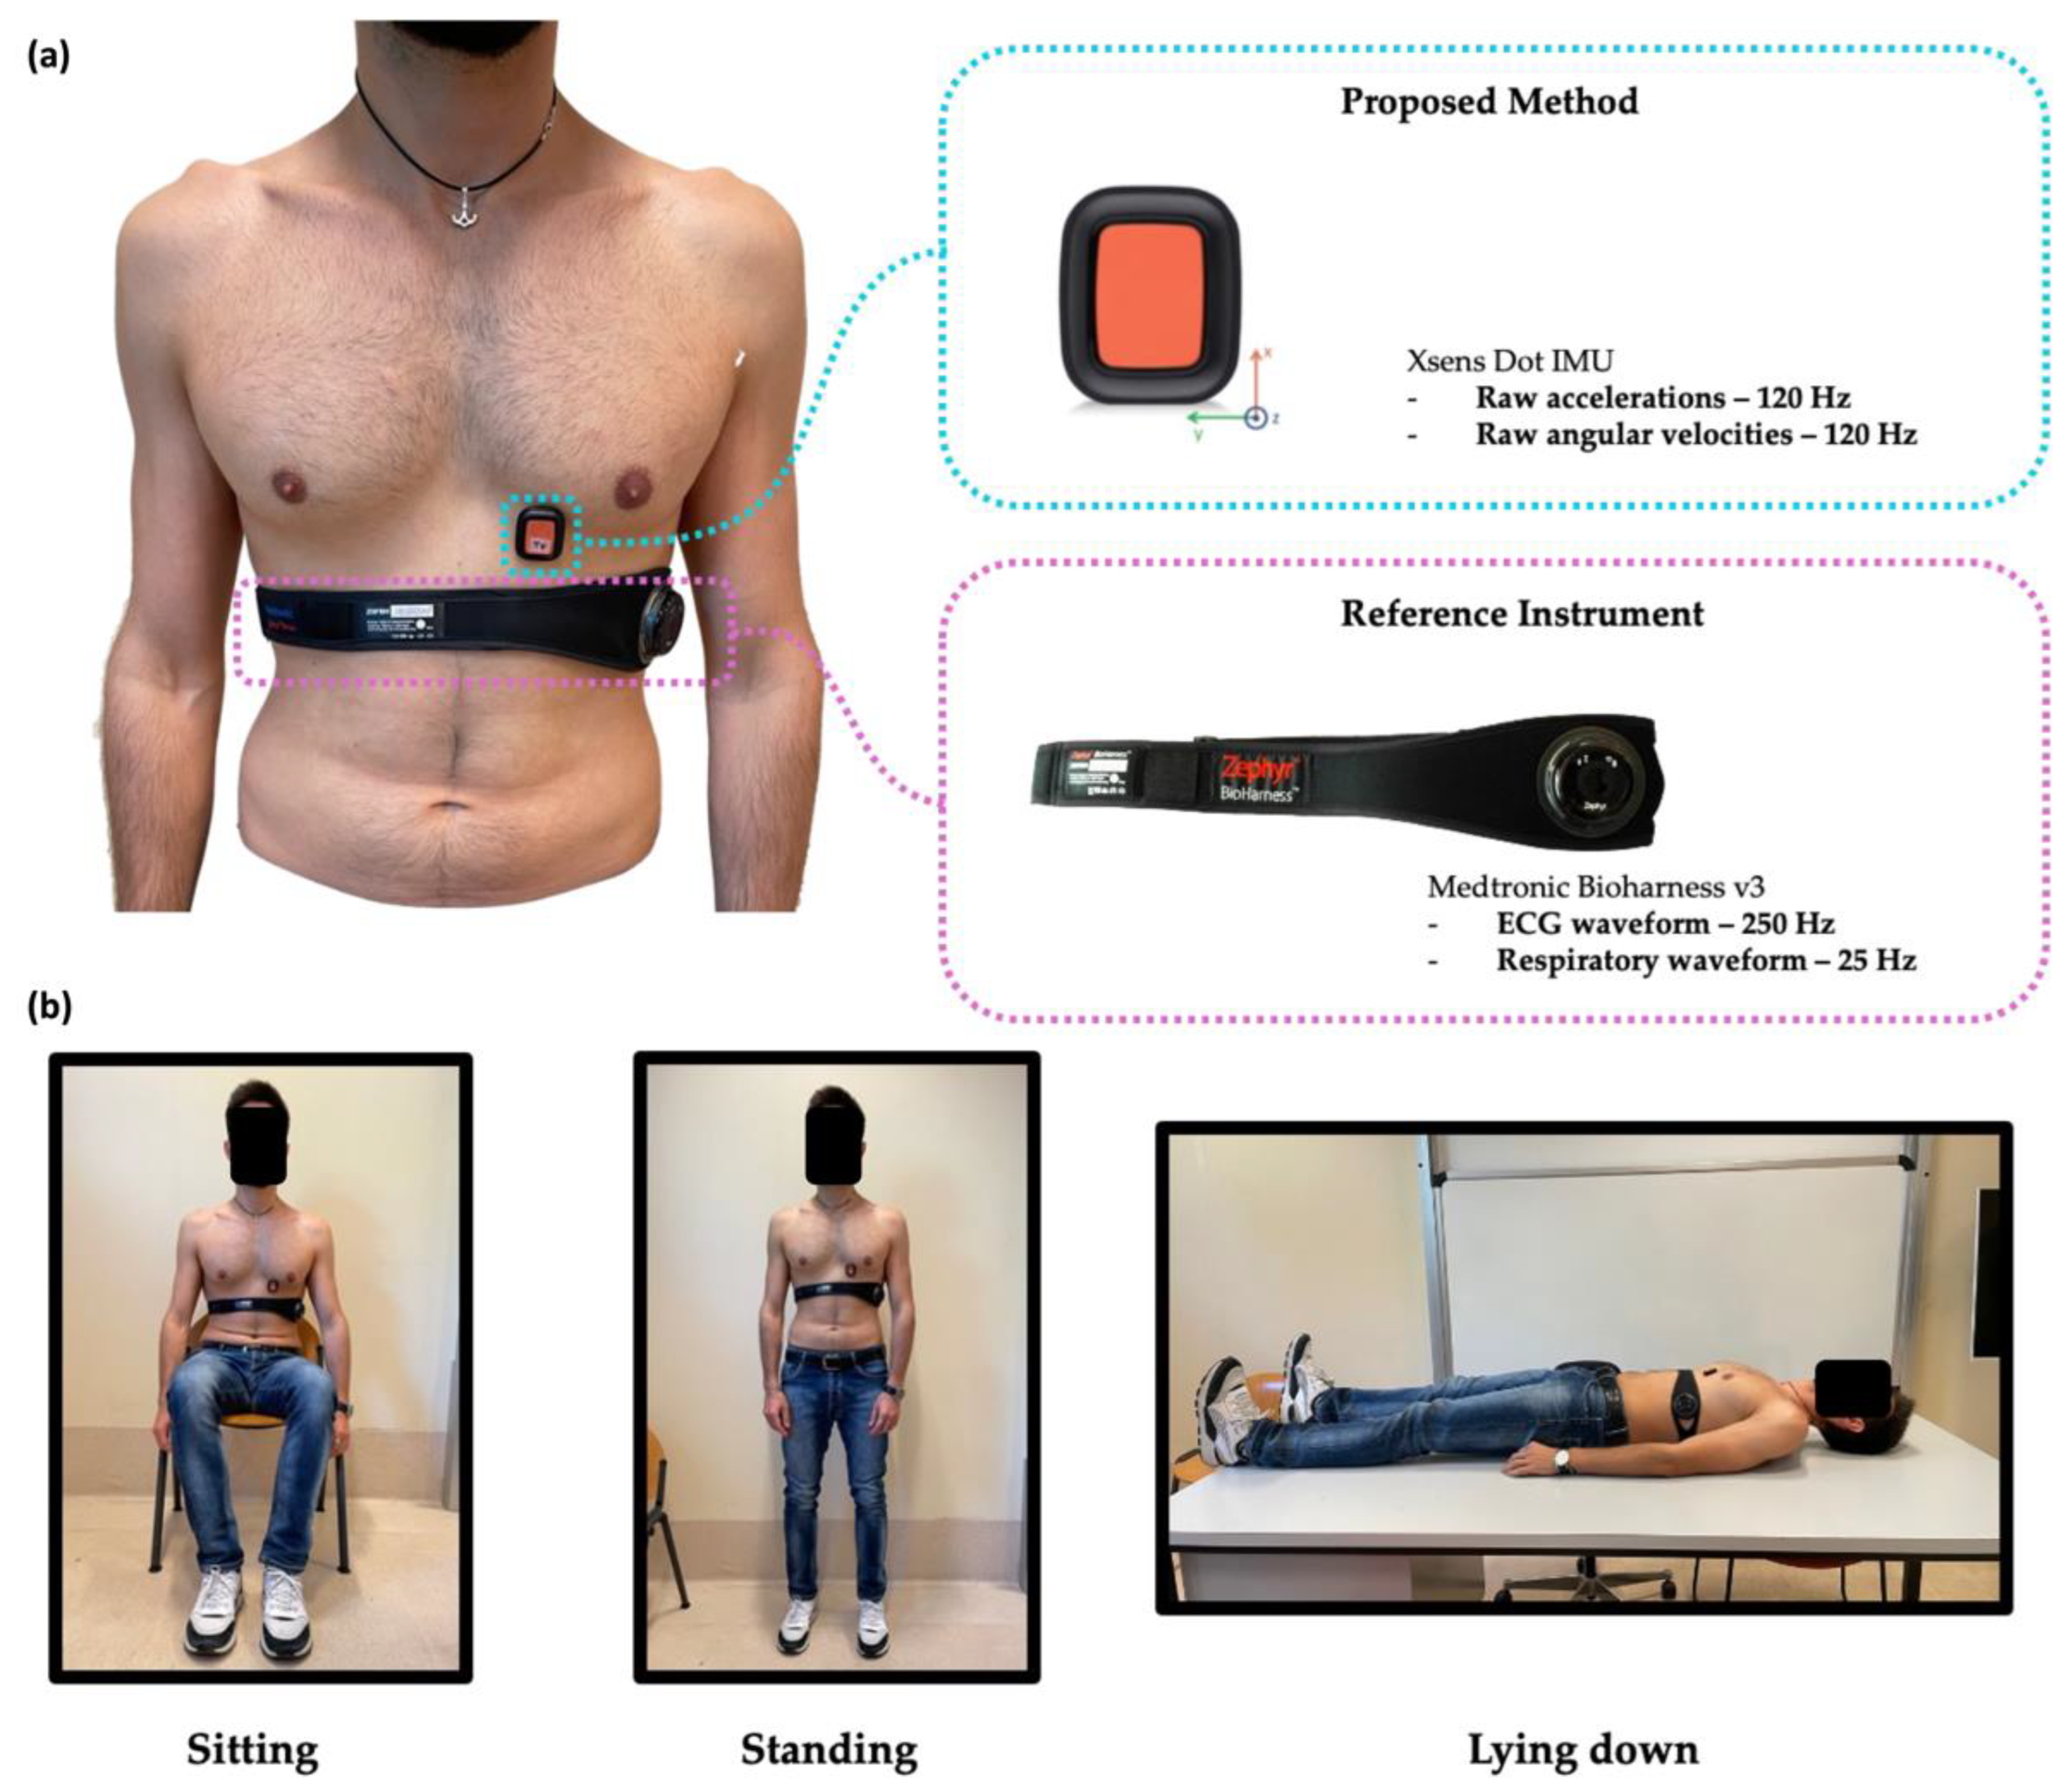
2.2. Study Design
2.3. Signal Pre-Processing
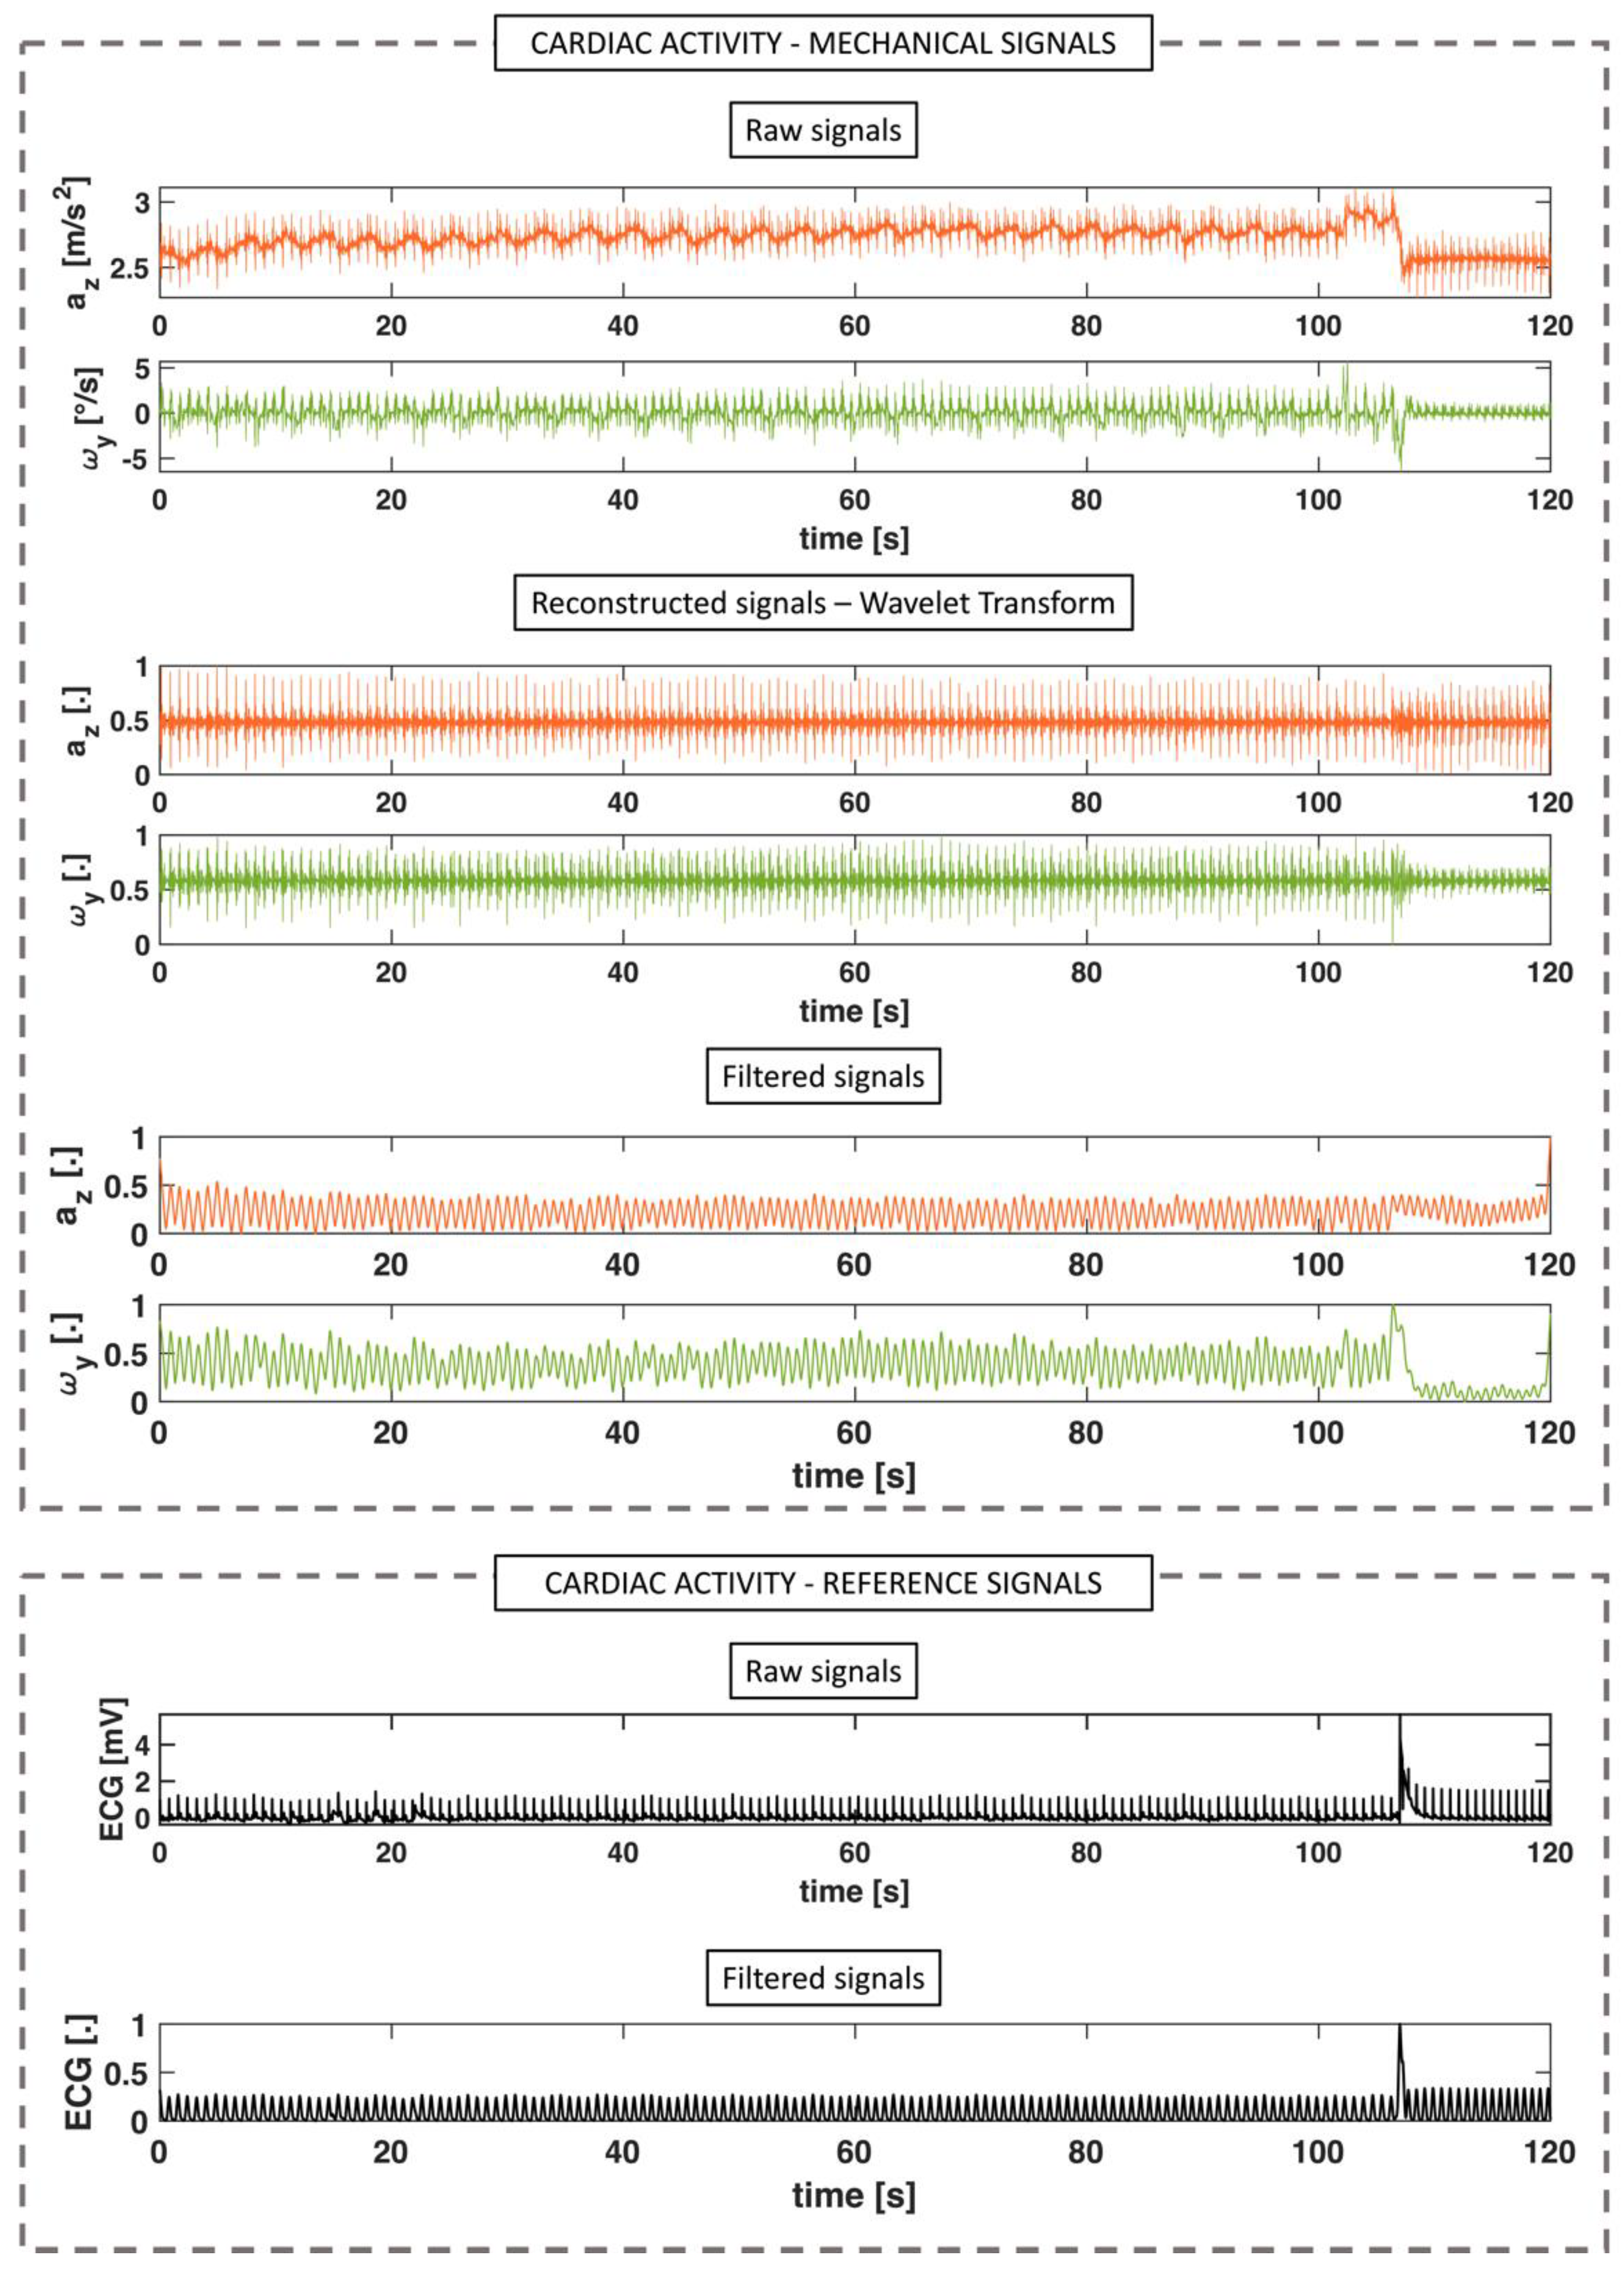
2.3.1. Cardiac Activity
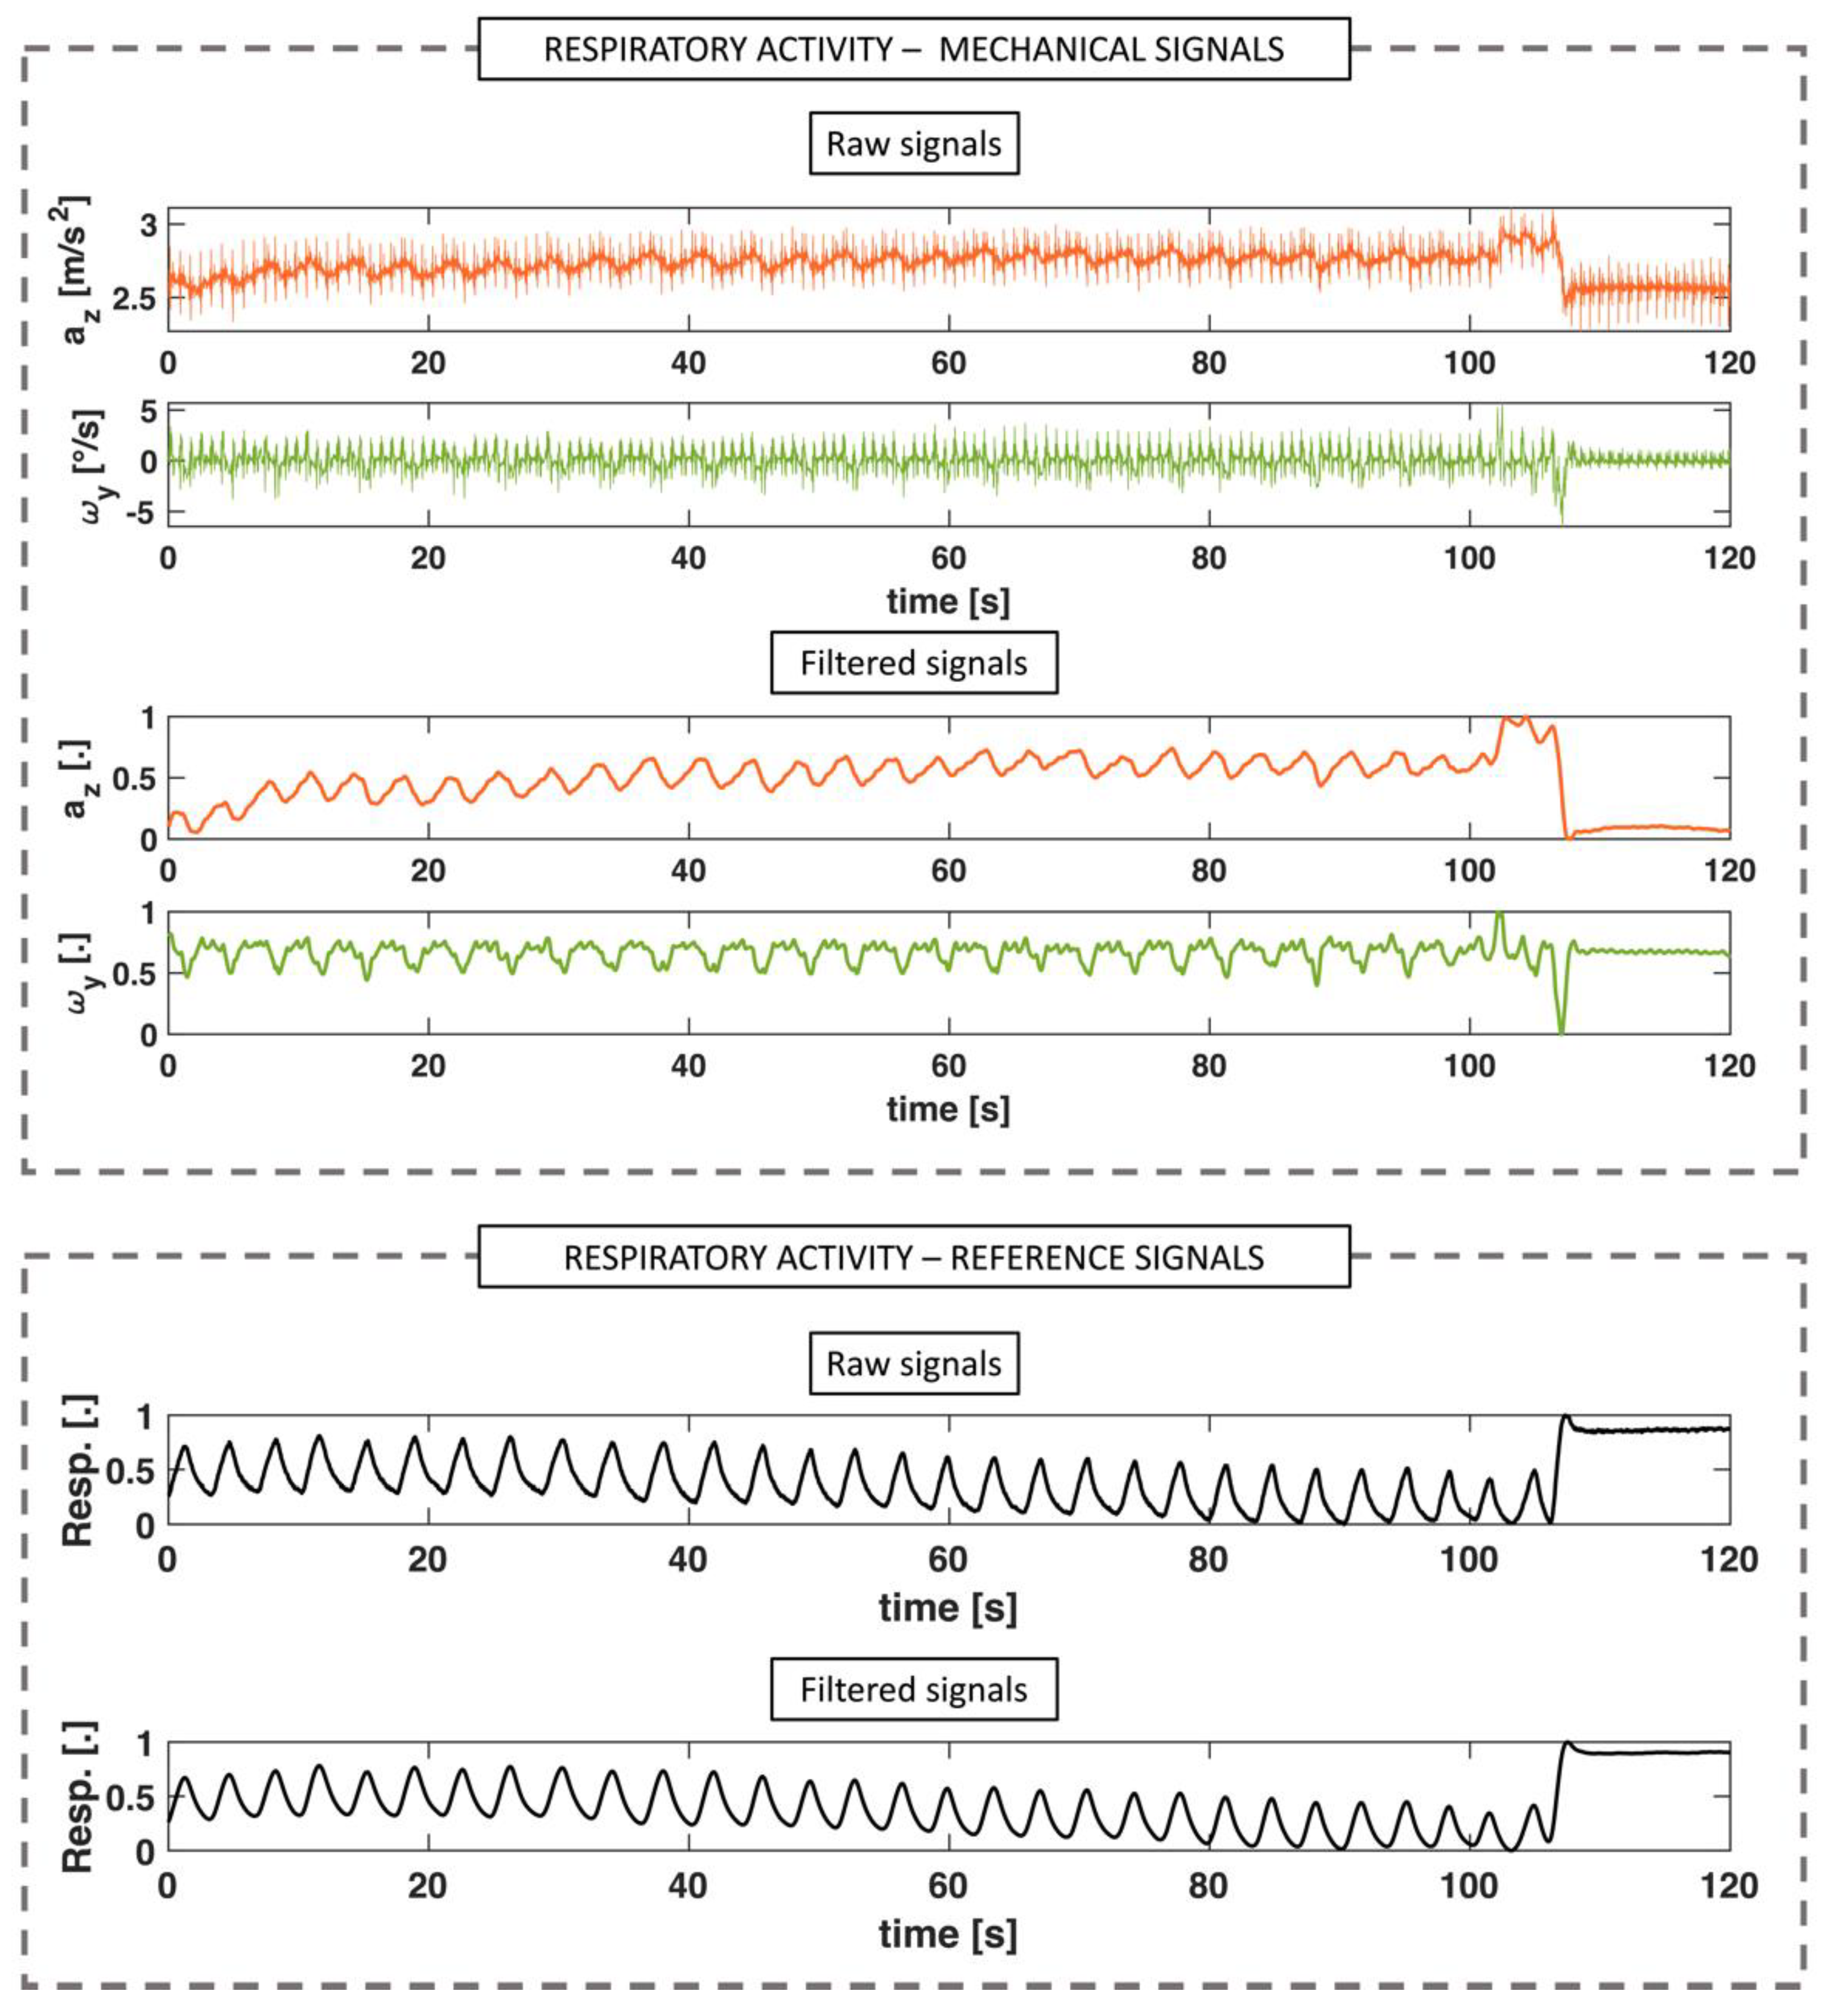
2.3.2. Respiratory Activity
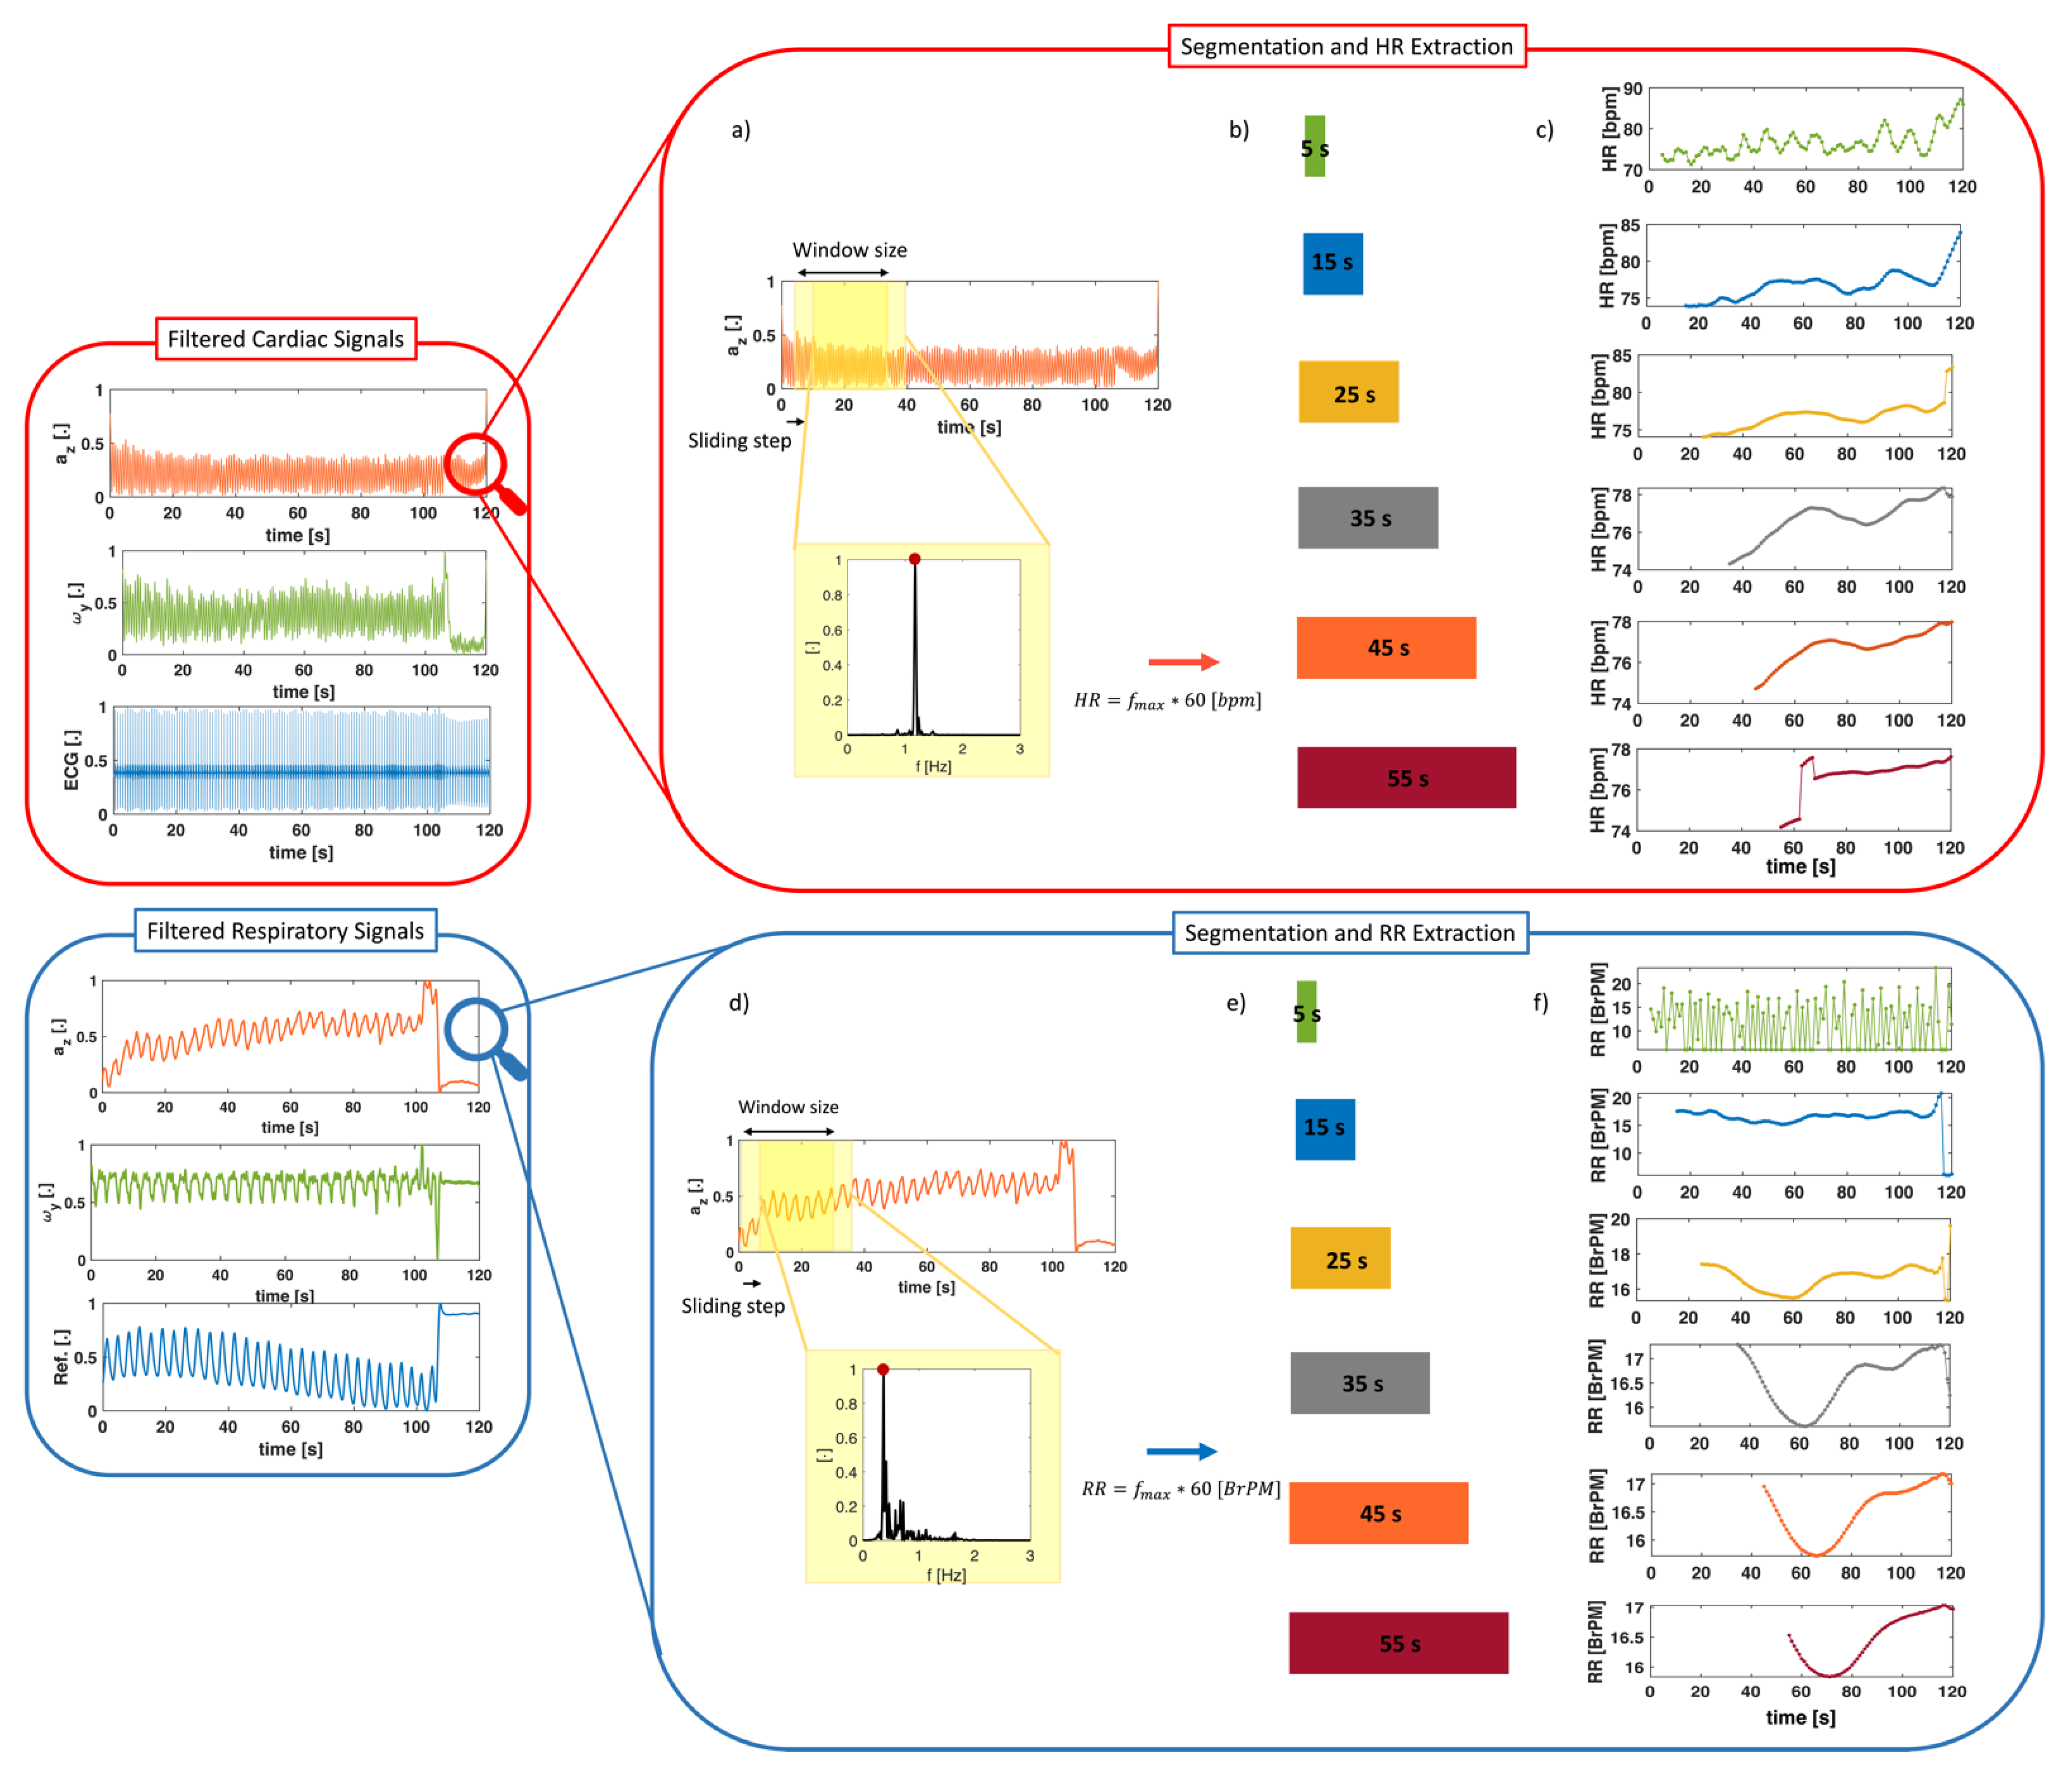
2.3.3. Signal Windowing for HR and RR Extraction
3. Results
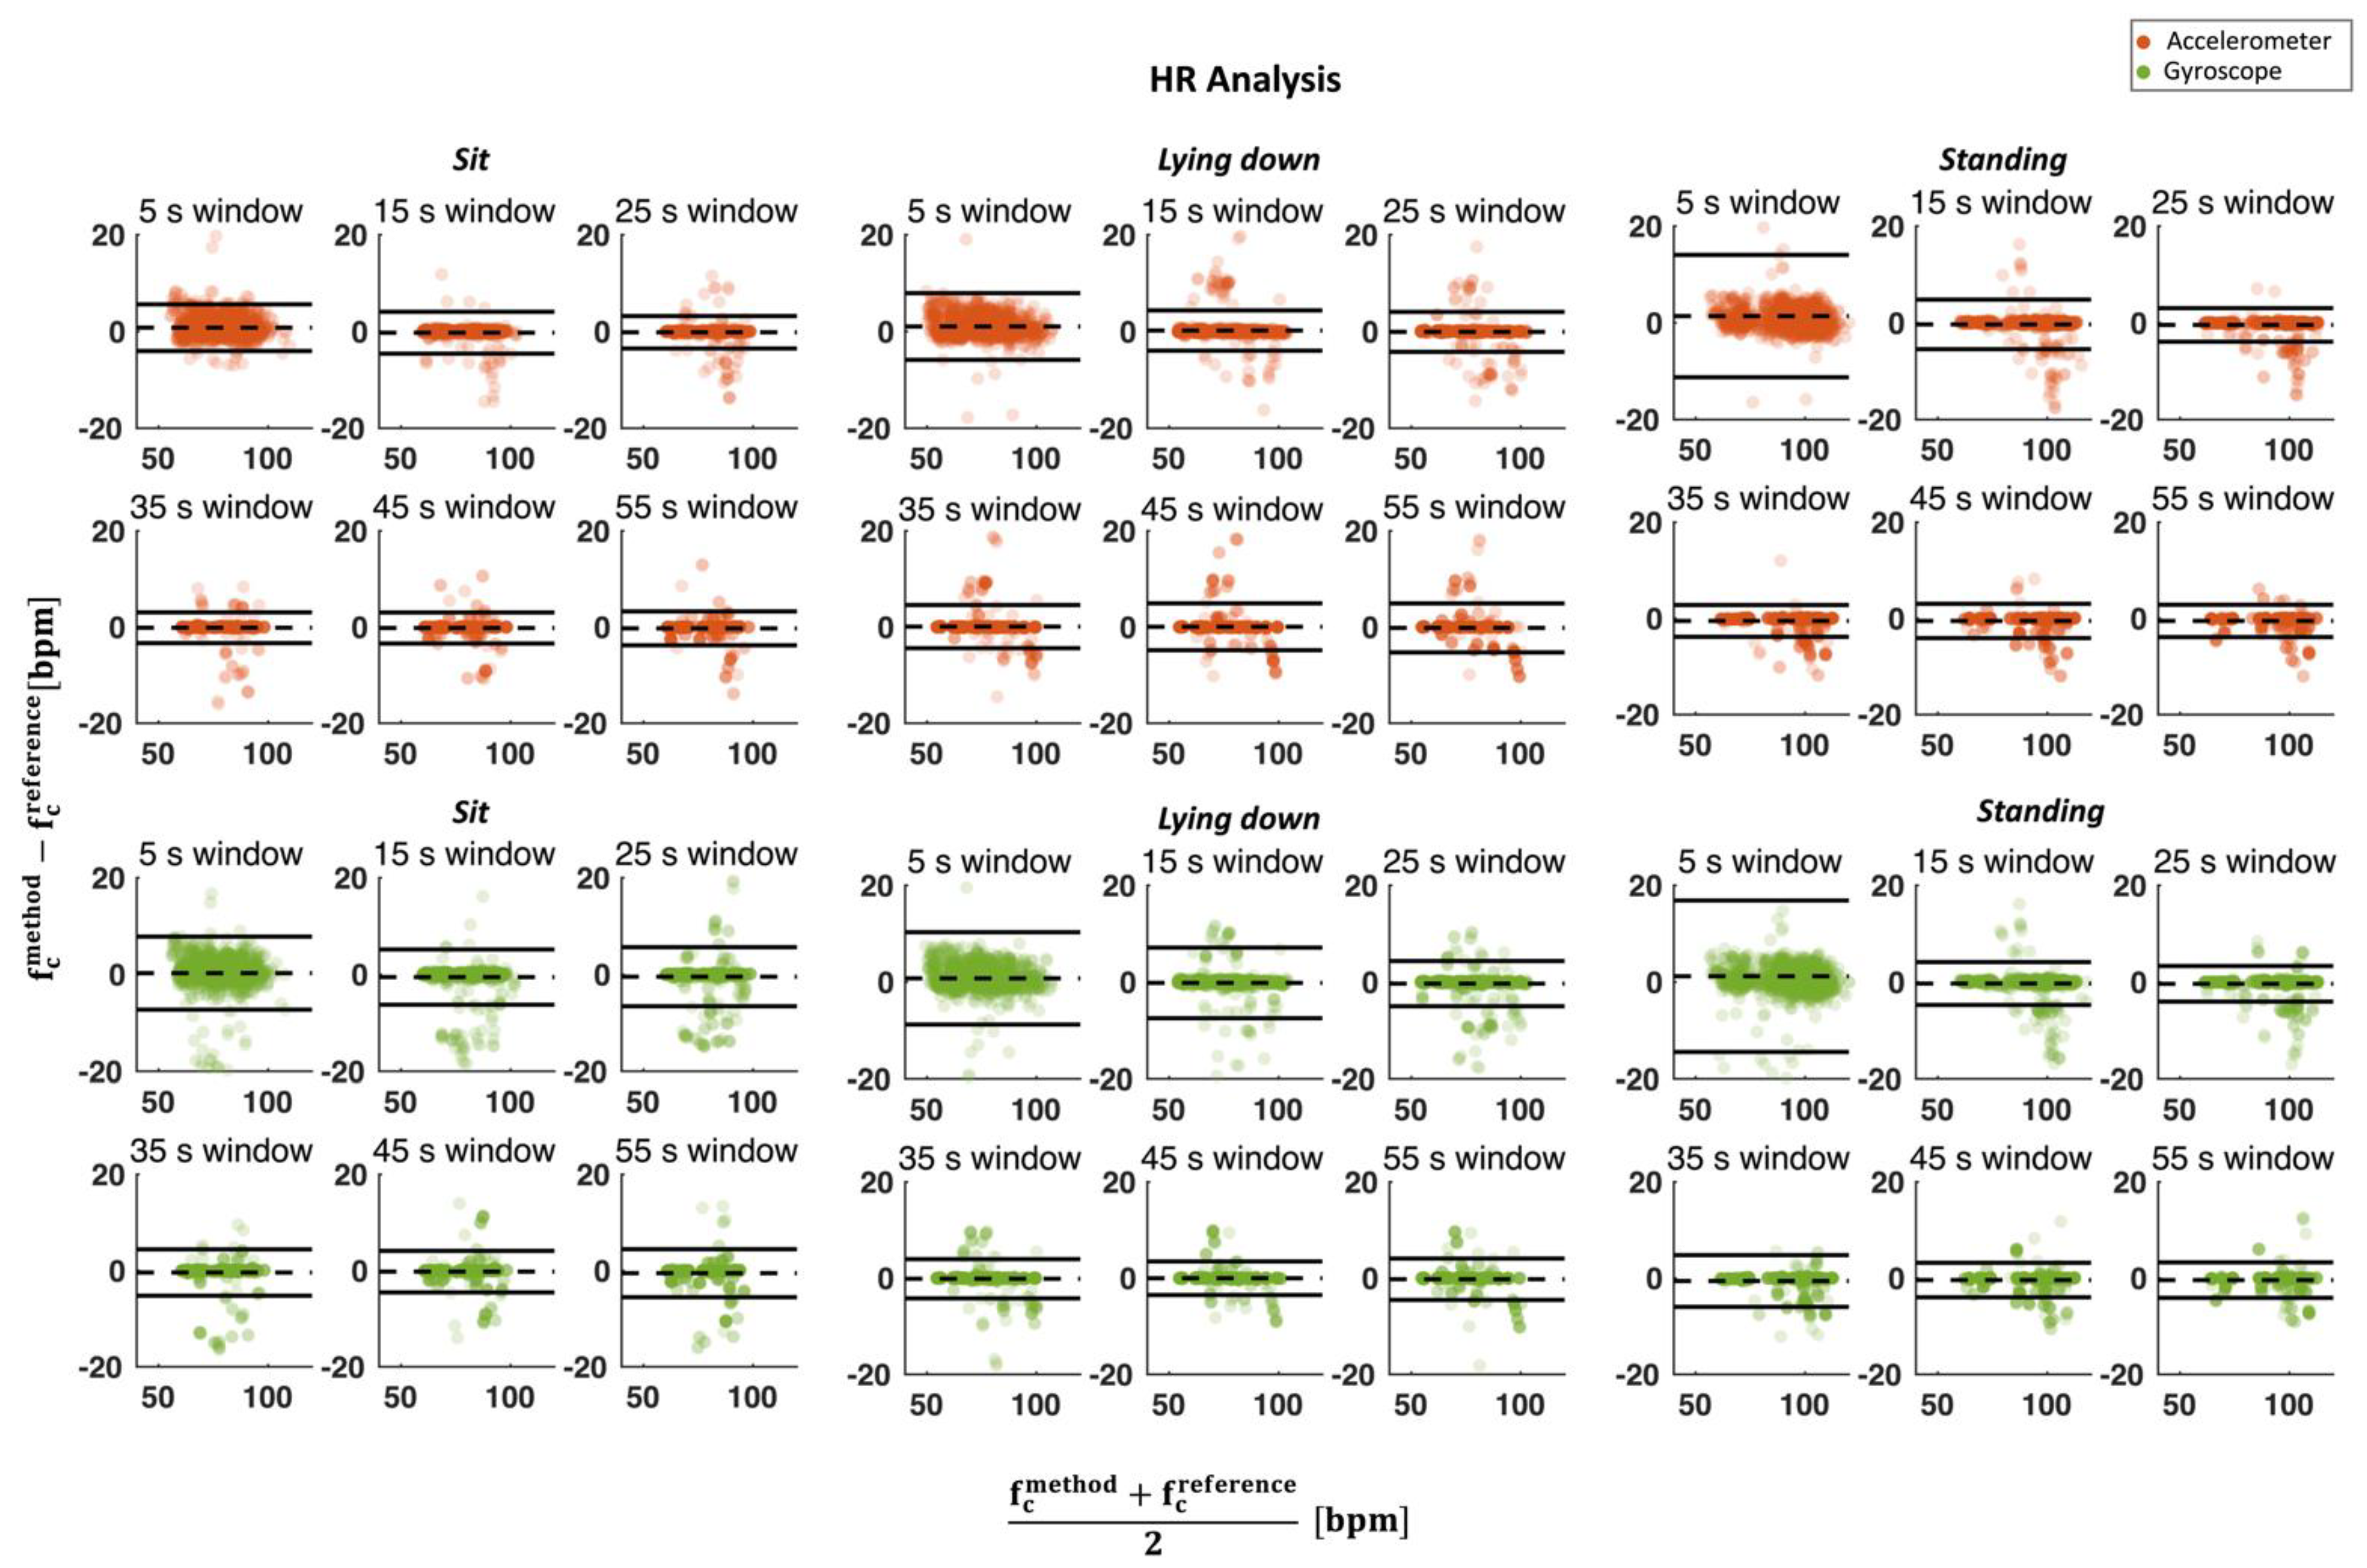
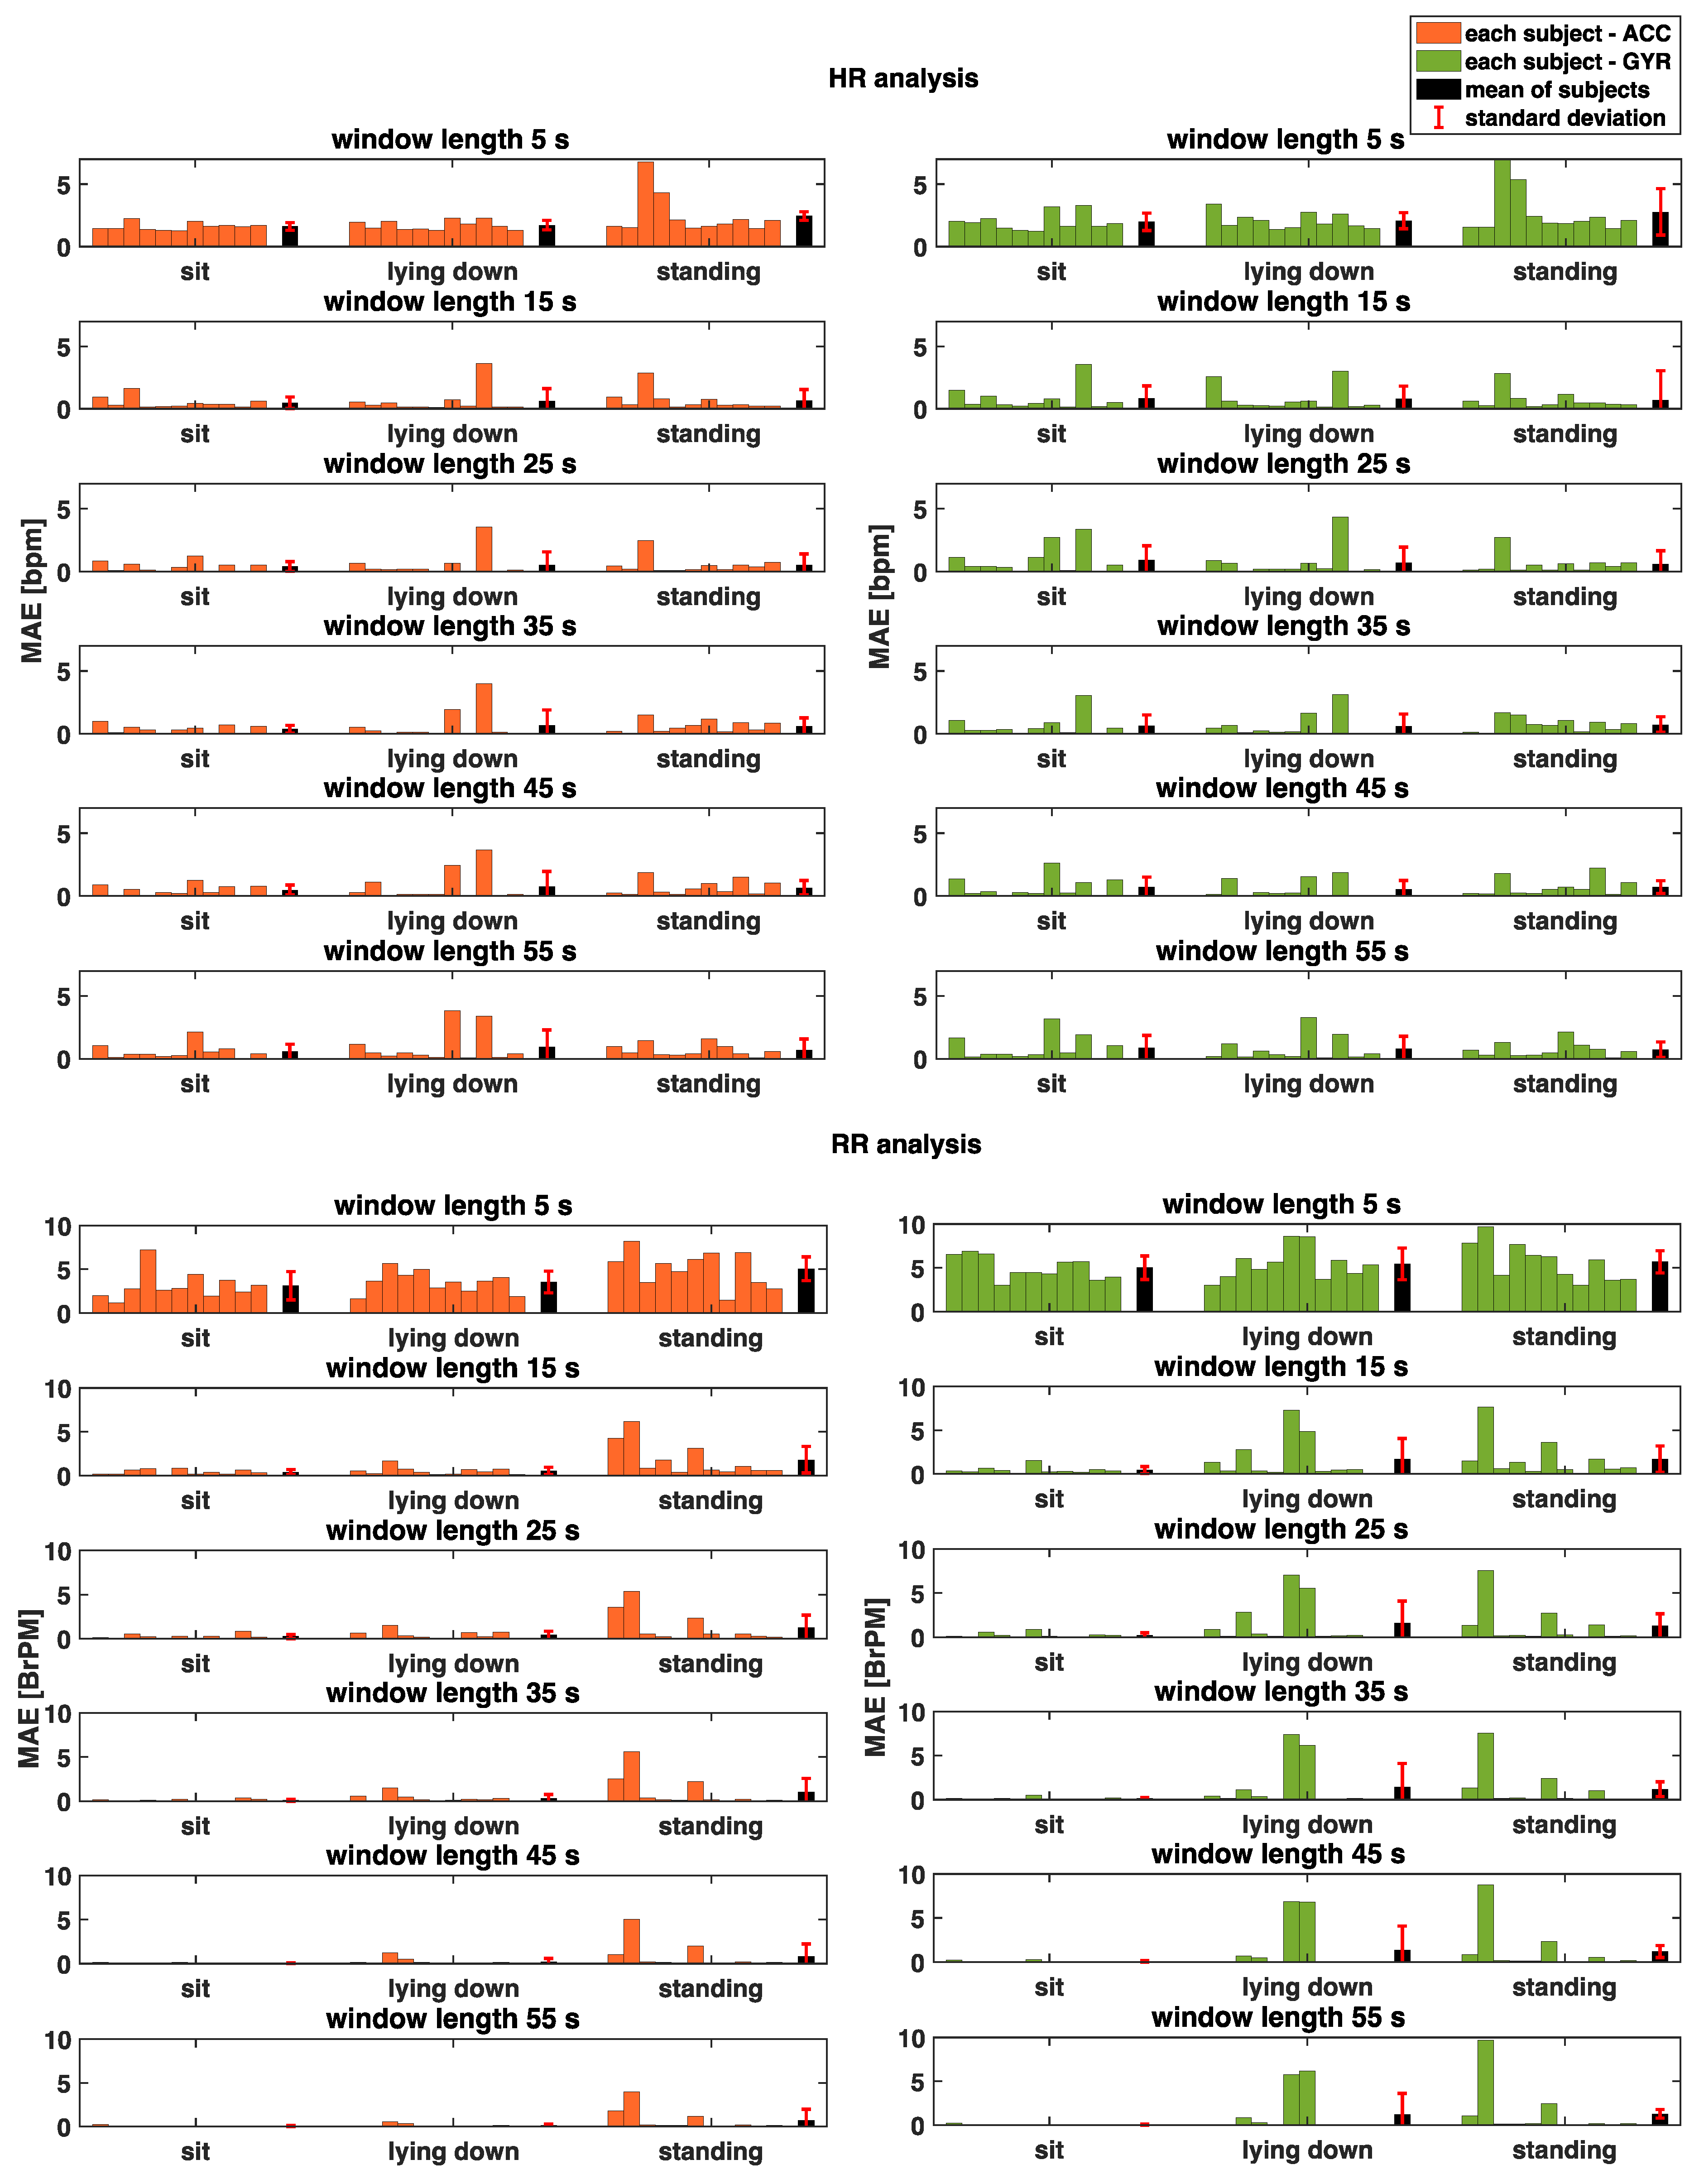
3.1. Cardiac Activity
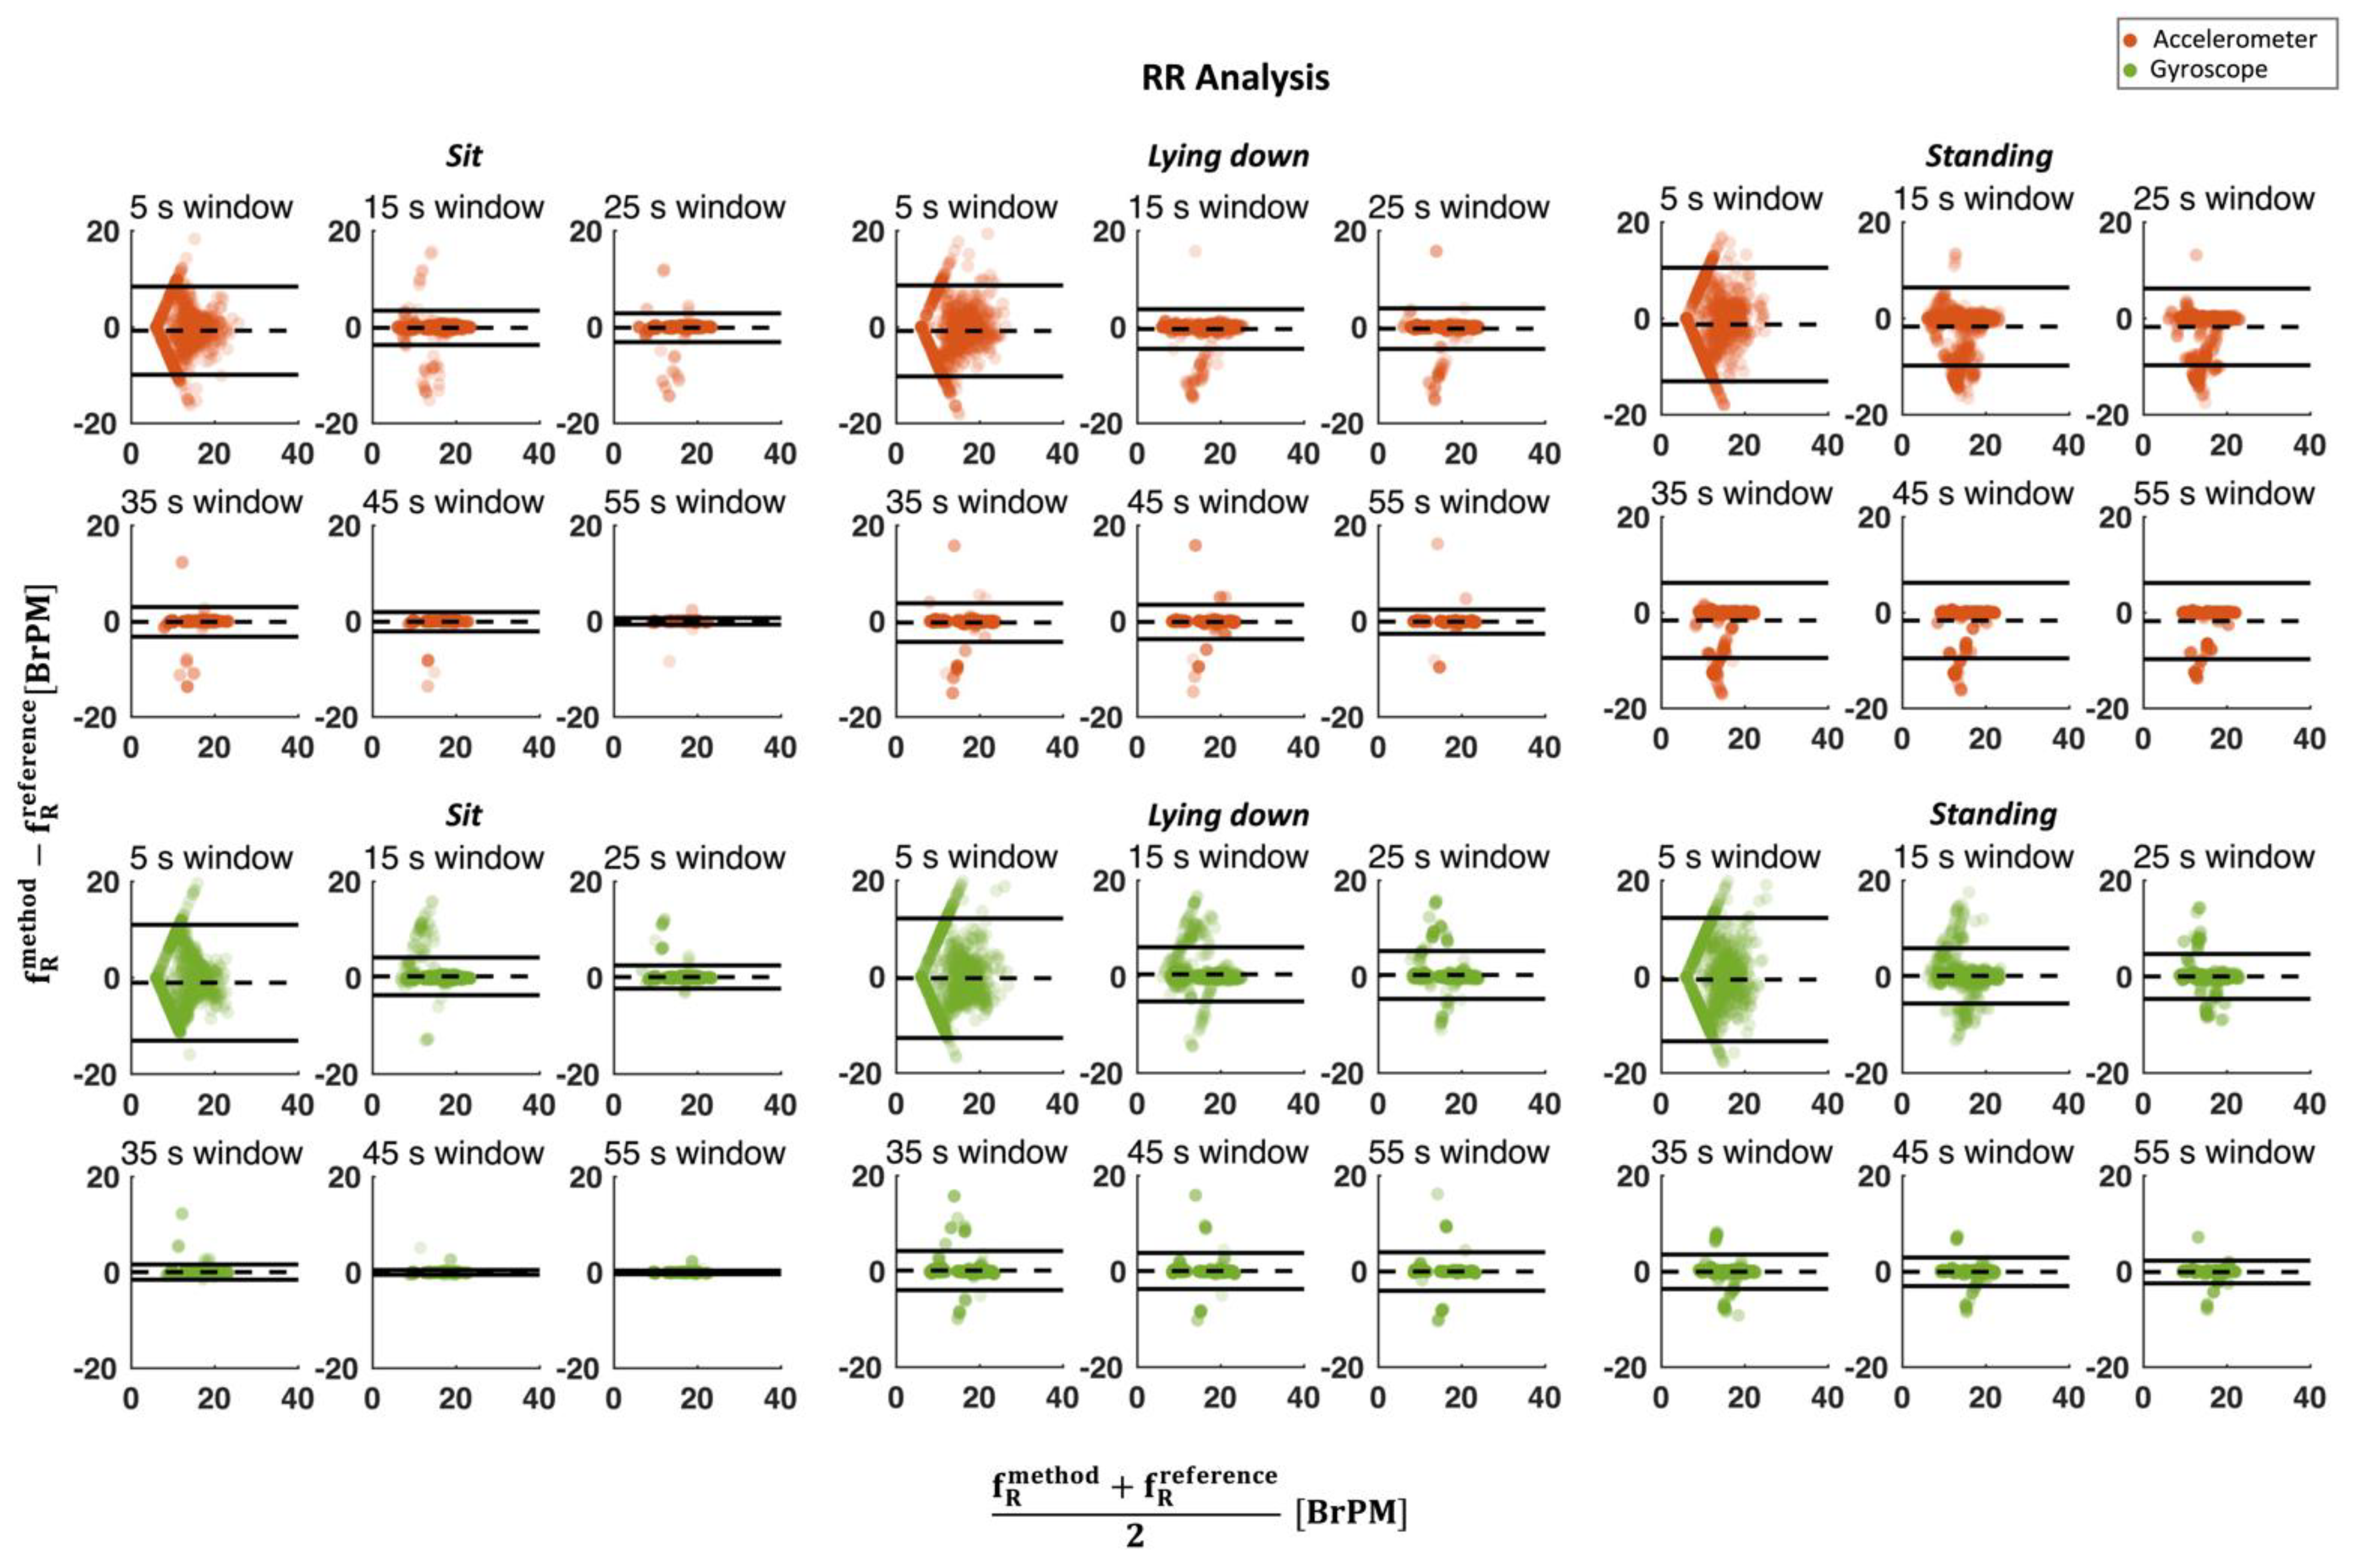
3.2. Respiratory Activity
4. Discussion and Conclusions
Author Contributions
Funding
Institutional Review Board Statement
Informed Consent Statement
Data Availability Statement
Conflicts of Interest
References
- Brüser, C.; Antink, C.H.; Wartzek, T.; Walter, M.; Leonhardt, S. Ambient and Unobtrusive Cardiorespiratory Monitoring Techniques. IEEE Rev. Biomed. Eng. 2015, 8, 30–43. [Google Scholar] [CrossRef] [PubMed]
- Markova, V.; Ganchev, T.; Kalinkov, K.; Markov, M. Detection of Acute Stress Caused by Cognitive Tasks Based on Physiological Signals. Bull. Electr. Eng. Inform. 2021, 10, 2539–2547. [Google Scholar] [CrossRef]
- Tipton, M.J.; Harper, A.; Paton, J.F.R.; Costello, J.T. The Human Ventilatory Response to Stress: Rate or Depth? J. Physiol. 2017, 595, 5729–5752. [Google Scholar] [CrossRef] [PubMed]
- Järvelin-Pasanen, S.; Sinikallio, S.; Tarvainen, M.P. Heart Rate Variability and Occupational Stress—Systematic Review. Ind. Health 2018, 56, 500–511. [Google Scholar] [CrossRef] [PubMed]
- Nicolò, A.; Massaroni, C.; Schena, E.; Sacchetti, M. The Importance of Respiratory Rate Monitoring: From Healthcare to Sport and Exercise. Sensors 2020, 20, 6396. [Google Scholar] [CrossRef] [PubMed]
- Inan, O.T.; Migeotte, P.F.; Park, K.S.; Etemadi, M.; Tavakolian, K.; Casanella, R.; Zanetti, J.; Tank, J.; Funtova, I.; Prisk, G.K.; et al. Ballistocardiography and Seismocardiography: A Review of Recent Advances. IEEE J. Biomed. Health Inform. 2015, 19, 1414–1427. [Google Scholar] [CrossRef]
- Sana, F.; Isselbacher, E.M.; Singh, J.P.; Heist, E.K.; Pathik, B.; Armoundas, A.A. Wearable Devices for Ambulatory Cardiac Monitoring: JACC State-of-the-Art Review. J. Am. Coll. Cardiol. 2020, 75, 1582–1592. [Google Scholar] [CrossRef] [PubMed]
- Massaroni, C.; Di Tocco, J.; Presti, D.L.; Longo, U.G.; Miccinilli, S.; Sterzi, S.; Formica, D.; Saccomandi, P.; Schena, E. Smart Textile Based on Piezoresistive Sensing Elements for Respiratory Monitoring. IEEE Sens. J. 2019, 19, 7718–7725. [Google Scholar] [CrossRef]
- Orphanidou, C.; Fleming, S.; Shah, S.A.; Tarassenko, L. Data Fusion for Estimating Respiratory Rate from a Single-Lead ECG. Biomed. Signal Process. Control 2013, 8, 98–105. [Google Scholar] [CrossRef]
- Rahmani, M.H.; Berkvens, R.; Weyn, M. Chest-worn inertial sensors: A survey of applications and methods. Sensors 2021, 21, 2875. [Google Scholar] [CrossRef]
- Massaroni, C.; Nicolò, A.; Presti, D.L.; Sacchetti, M.; Silvestri, S.; Schena, E. Contact-Based Methods for Measuring Respiratory Rate. Sensors 2019, 19, 908. [Google Scholar] [CrossRef] [PubMed]
- Rai, D.; Thakkar, H.K.; Rajput, S.S.; Santamaria, J.; Bhatt, C.; Roca, F. A Comprehensive Review on Seismocardiogram: Current Advancements on Acquisition, Annotation, and Applications. Mathematics 2021, 9, 2243. [Google Scholar] [CrossRef]
- Sieciński, S.; Kostka, P.S.; Tkacz, E.J. Gyrocardiography: A Review of the Definition, History, Waveform Description, and Applications. Sensors 2020, 20, 6675. [Google Scholar] [CrossRef]
- Zanetti, J. Seismocardiography: A New Technique for Recording Cardiac Vibrations. Concept, Method, and Initial Observations. J. Cardiovasc. Technol. 1990, 9, 111–118. [Google Scholar]
- Salerno, D.M.; Zanetti, J. Seismocardiography for Monitoring Changes in Left Ventricular Function during Ischemia. Chest 1991, 100, 991–993. [Google Scholar] [CrossRef]
- Jafari Tadi, M.; Lehtonen, E.; Saraste, A.; Tuominen, J.; Koskinen, J.; Teräs, M.; Airaksinen, J.; Pänkäälä, M.; Koivisto, T. Gyrocardiography: A New Non-Invasive Monitoring Method for the Assessment of Cardiac Mechanics and the Estimation of Hemodynamic Variables. Sci. Rep. 2017, 7, 6823. [Google Scholar] [CrossRef]
- Migeotte, P.-F.; Mucci, V.; Delière, Q.; Lejeune, L.; van de Borne, P. Multi-dimensional kineticardiography a new approach for wearable cardiac monitoring through body acceleration recordings. In Proceedings of the XIV Mediterranean Conference on Medical and Biological Engineering and Computing, Paphos, Cyprus, 31 March–2 April 2016; Springer: Cham, Switzerland, 2016; pp. 1125–1130. [Google Scholar]
- Yang, C.; Tavassolian, N. Combined Seismo-and Gyro-Cardiography: A More Comprehensive Evaluation of Heart-Induced Chest Vibrations. IEEE J. Biomed. Health Inform. 2018, 22, 1466–1475. [Google Scholar] [CrossRef]
- Yoon, J.W.; Noh, Y.S.; Kwon, Y.S.; Kim, W.K.; Yoon, H.R. Improvement of Dynamic Respiration Monitoring through Sensor Fusion of Accelerometer and Gyro-Sensor. J. Electr. Eng. Technol. 2014, 9, 334–343. [Google Scholar] [CrossRef]
- D’Mello, Y.; Skoric, J.; Xu, S.; Roche, P.J.R.; Lortie, M.; Gagnon, S.; Plant, D.V. Real-time cardiac beat detection and heart rate monitoring from combined seismocardiography and gyrocardiography. Sensors 2019, 19, 3472. [Google Scholar] [CrossRef]
- Kaisti, M.; Tadi, M.J.; Lahdenoja, O.; Hurnanen, T.; Saraste, A.; Pankaala, M.; Koivisto, T. Stand-Alone Heartbeat Detection in Multidimensional Mechanocardiograms. IEEE Sens. J. 2019, 19, 234–242. [Google Scholar] [CrossRef]
- Lee, H.; Lee, H.; Whang, M. An Enhanced Method to Estimate Heart Rate from Seismocardiography via Ensemble Averaging of Body Movements at Six Degrees of Freedom. Sensors 2018, 18, 238. [Google Scholar] [CrossRef] [PubMed]
- Lin, Y.D.; Jhou, Y.F. Estimation of heart rate and respiratory rate from the seismocardiogram under resting state. Biomed. Signal Process. Control 2020, 57, 101779. [Google Scholar] [CrossRef]
- Phan, D.H.; Bonnet, S.; Guillemaud, R.; Castelli, E.; Thi, N.Y.P. Estimation of respiratory waveform and heart rate using an accelerometer. In Proceedings of the 2008 30th Annual International Conference of the IEEE Engineering in Medicine and Biology Society, IEEE, Vancouver, BC, Canada, 20–25 August 2008; pp. 4916–4919. [Google Scholar]
- Taebi, A.; Solar, B.E.; Bomar, A.J.; Sandler, R.H.; Mansy, H.A. Recent Advances in Seismocardiography. Vibration 2019, 2, 64–86. [Google Scholar] [CrossRef] [PubMed]
- Khosrow-Khavar, F.; Tavakolian, K.; Blaber, A.P.; Zanetti, J.M.; Fazel-Rezai, R.; Menon, C. Automatic Annotation of Seismocardiogram with High-Frequency Precordial Accelerations. IEEE J. Biomed. Heal. inform. 2014, 19, 1428–1434. [Google Scholar] [CrossRef] [PubMed]
- Chen, C.-H.; Lin, W.-Y.; Lee, M.-Y. Computer-Aided Detection of Fiducial Points in Seismocardiography through Dynamic Time Warping. Biosensors 2022, 12, 374. [Google Scholar] [CrossRef] [PubMed]
- ZephyrTM. BioHarness 3 Log Data Descriptions; Zephyr Technology Corp.: Annapolis, MD, USA, 2016. [Google Scholar]
- Tadi, M.J.; Lahdenoja, O.; Humanen, T.; Koskinen, J.; Pankaala, M.; Koivisto, T. Automatic identification of signal quality for heart beat detection in cardiac MEMS signals. In Proceedings of the 2017 IEEE EMBS International Conference on Biomedical and Health Informatics, BHI 2017, Orlando, FL, USA, 16–19 February 2017; pp. 137–140. [Google Scholar] [CrossRef]
- Hernandez, J.E.; Cretu, E. Simple Heart Rate Monitoring System with a MEMS Gyroscope for Sleep Studies. In Proceedings of the 2018 IEEE 9th Annual Information Technology, Electronics and Mobile Communication Conference, IEMCON 2018, Vancouver, BC, Canada, 1–3 November 2018; pp. 61–67. [Google Scholar] [CrossRef]
- Ferdinando, H.; Seppälä, E.; Myllylä, T. Discrete wavelet transforms-based analysis of accelerometer signals for continuous human cardiac monitoring. Appl. Sci. 2021, 11, 12072. [Google Scholar] [CrossRef]
- Tosi, J.; Summa, S.; Taffoni, F.; Di Biase, L.; Marano, M.; Rizzo, A.C.; Tombini, M.; Schena, E.; Formica, D.; Di Pino, G. Feature Extraction in Sit-to-Stand Task Using M-IMU Sensors and Evaluatiton in Parkinson’s Disease. In Proceedings of the MeMeA 2018—2018 IEEE International Symposium on Medical Measurements and Applications, Rome, Italy, 11–13 June 2018; pp. 2–7. [Google Scholar] [CrossRef]
- February, L. Chapter 1 Overview. Dev. Pet. Sci. 2000, 49, 1–11. [Google Scholar] [CrossRef]
- Karacocuk, G.; Hoflinger, F.; Zhang, R.; Reindl, L.M.; Laufer, B.; Moller, K.; Roell, M.; Zdzieblik, D. Inertial Sensor-Based Respiration Analysis. IEEE Trans. Instrum. Meas. 2019, 68, 4268–4275. [Google Scholar] [CrossRef]
- Molinaro, N.; Schena, E.; Silvestri, S.; Massaroni, C. Multi-ROI Spectral Approach for the Continuous Remote Cardio-Respiratory Monitoring from Mobile Device Built-In Cameras. Sensors 2022, 22, 2539. [Google Scholar] [CrossRef]
- Di Tocco, J.; Raiano, L.; Sabbadini, R.; Massaroni, C.; Formica, D.; Schena, E. A wearable system with embedded conductive textiles and an imu for unobtrusive cardio-respiratory monitoring. Sensors 2021, 21, 3018. [Google Scholar] [CrossRef]
- Bland, J.M.; Altman, D. Statistical Methods for Assessing Agreement between Two Methods of Clinical Measurement. Lancet 1986, 327, 307–310. [Google Scholar] [CrossRef]
- ANSI/AAMI EC13-2002; Cardiac Monitors, Heart Rate Meters, and Alarms. Association for the Advancement of Medical Instrumentation: Arlington, VA, USA, 2002; p. 21.
- Sieciński, S.; Kostka, P.S.; Tkacz, E.J. Heart rate variability analysis on electrocardiograms, seismocardiograms and gyrocardiograms on healthy volunteers. Sensors 2020, 20, 4522. [Google Scholar] [CrossRef] [PubMed]


Publisher’s Note: MDPI stays neutral with regard to jurisdictional claims in published maps and institutional affiliations. |
© 2022 by the authors. Licensee MDPI, Basel, Switzerland. This article is an open access article distributed under the terms and conditions of the Creative Commons Attribution (CC BY) license (https://creativecommons.org/licenses/by/4.0/).
Share and Cite
Romano, C.; Schena, E.; Formica, D.; Massaroni, C. Comparison between Chest-Worn Accelerometer and Gyroscope Performance for Heart Rate and Respiratory Rate Monitoring. Biosensors 2022, 12, 834. https://doi.org/10.3390/bios12100834
Romano C, Schena E, Formica D, Massaroni C. Comparison between Chest-Worn Accelerometer and Gyroscope Performance for Heart Rate and Respiratory Rate Monitoring. Biosensors. 2022; 12(10):834. https://doi.org/10.3390/bios12100834
Chicago/Turabian StyleRomano, Chiara, Emiliano Schena, Domenico Formica, and Carlo Massaroni. 2022. "Comparison between Chest-Worn Accelerometer and Gyroscope Performance for Heart Rate and Respiratory Rate Monitoring" Biosensors 12, no. 10: 834. https://doi.org/10.3390/bios12100834
APA StyleRomano, C., Schena, E., Formica, D., & Massaroni, C. (2022). Comparison between Chest-Worn Accelerometer and Gyroscope Performance for Heart Rate and Respiratory Rate Monitoring. Biosensors, 12(10), 834. https://doi.org/10.3390/bios12100834