5.1. Experimental Setup
To ensure the accuracy of CCA classification in real-time system for every user, an experiment analyzed the acquired EEG signals for twelve subjects. During the data-acquisition phase, each subject performed 20 trials using each scenario that was displayed on the monitor and MR goggles. The total length of each recorded data sequence was 3 s.
This study acquired EEG signals using an OpenBCI Cyton board with OpenBCI software from Brooklyn, New York, USA and collected the EEG signals from a 21-channel EEG cap that has a sampling rate of 250 Hz. The scenarios were displayed on a monitor and MR goggles. An ASUS XG279Q, which is a high-level stimulating monitor with a 144 Hz refresh rate, and a Microsoft HoloLens 2 with a 60 Hz refresh rate were used to create stimuli for the BCI experiment. A red square overlapping on the flicker was used to specify the picture at which the participant looks.
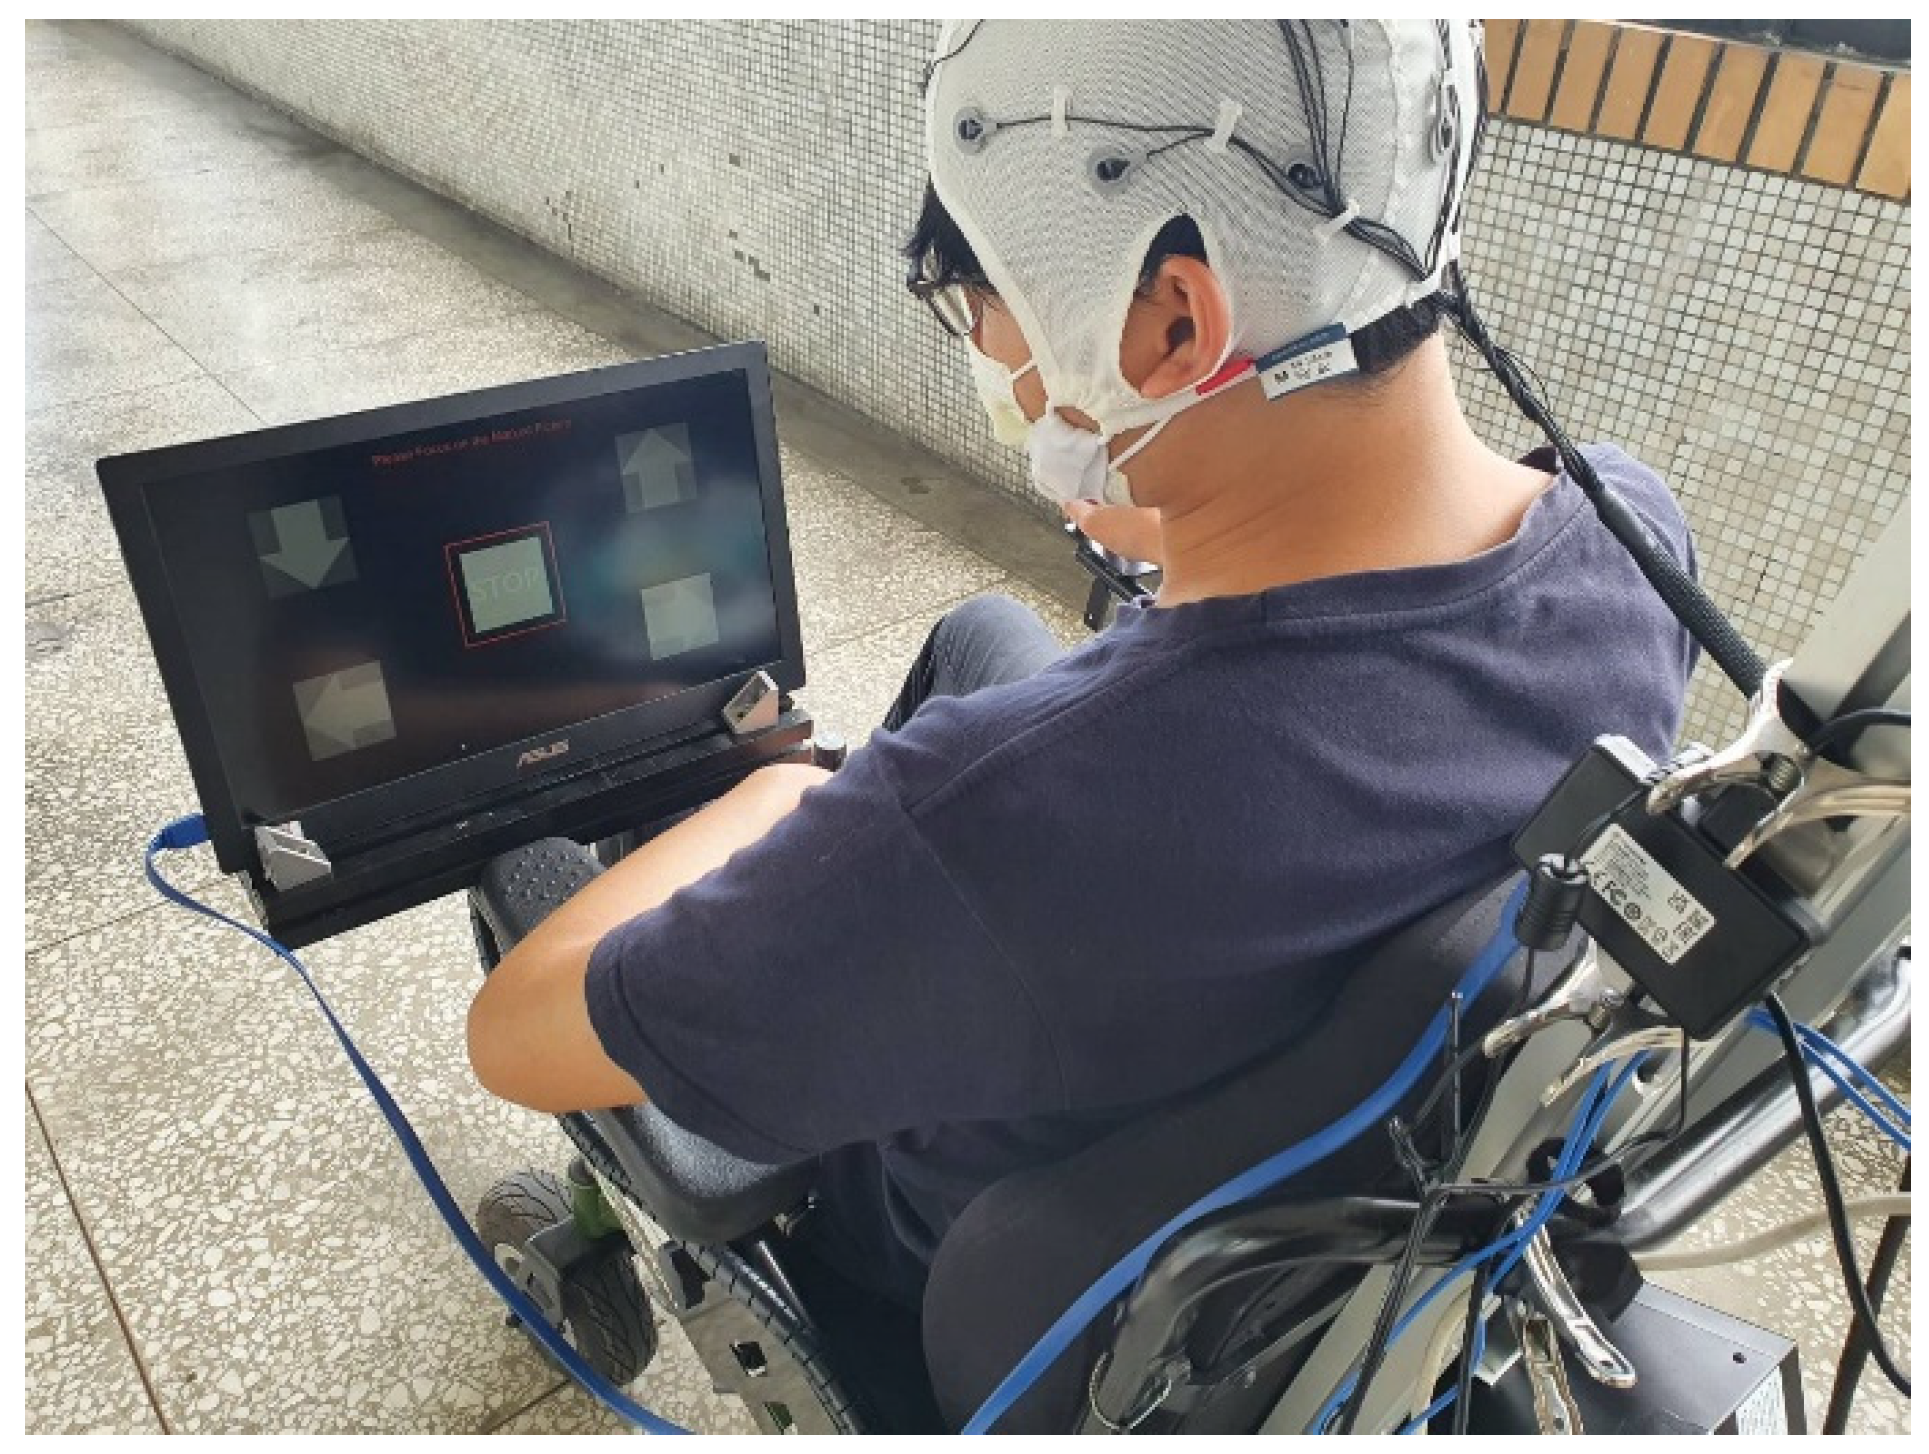
The subject focused on the marked object and followed the instructions that were displayed on the screen or MR goggles to collect the data for frequencies of 7, 8, 9, 11 and 13 Hz. During the experiment using a screen, the participants sat 30 cm away from the screen and observed the flickers. The configuration for the experiment using a screen is shown in
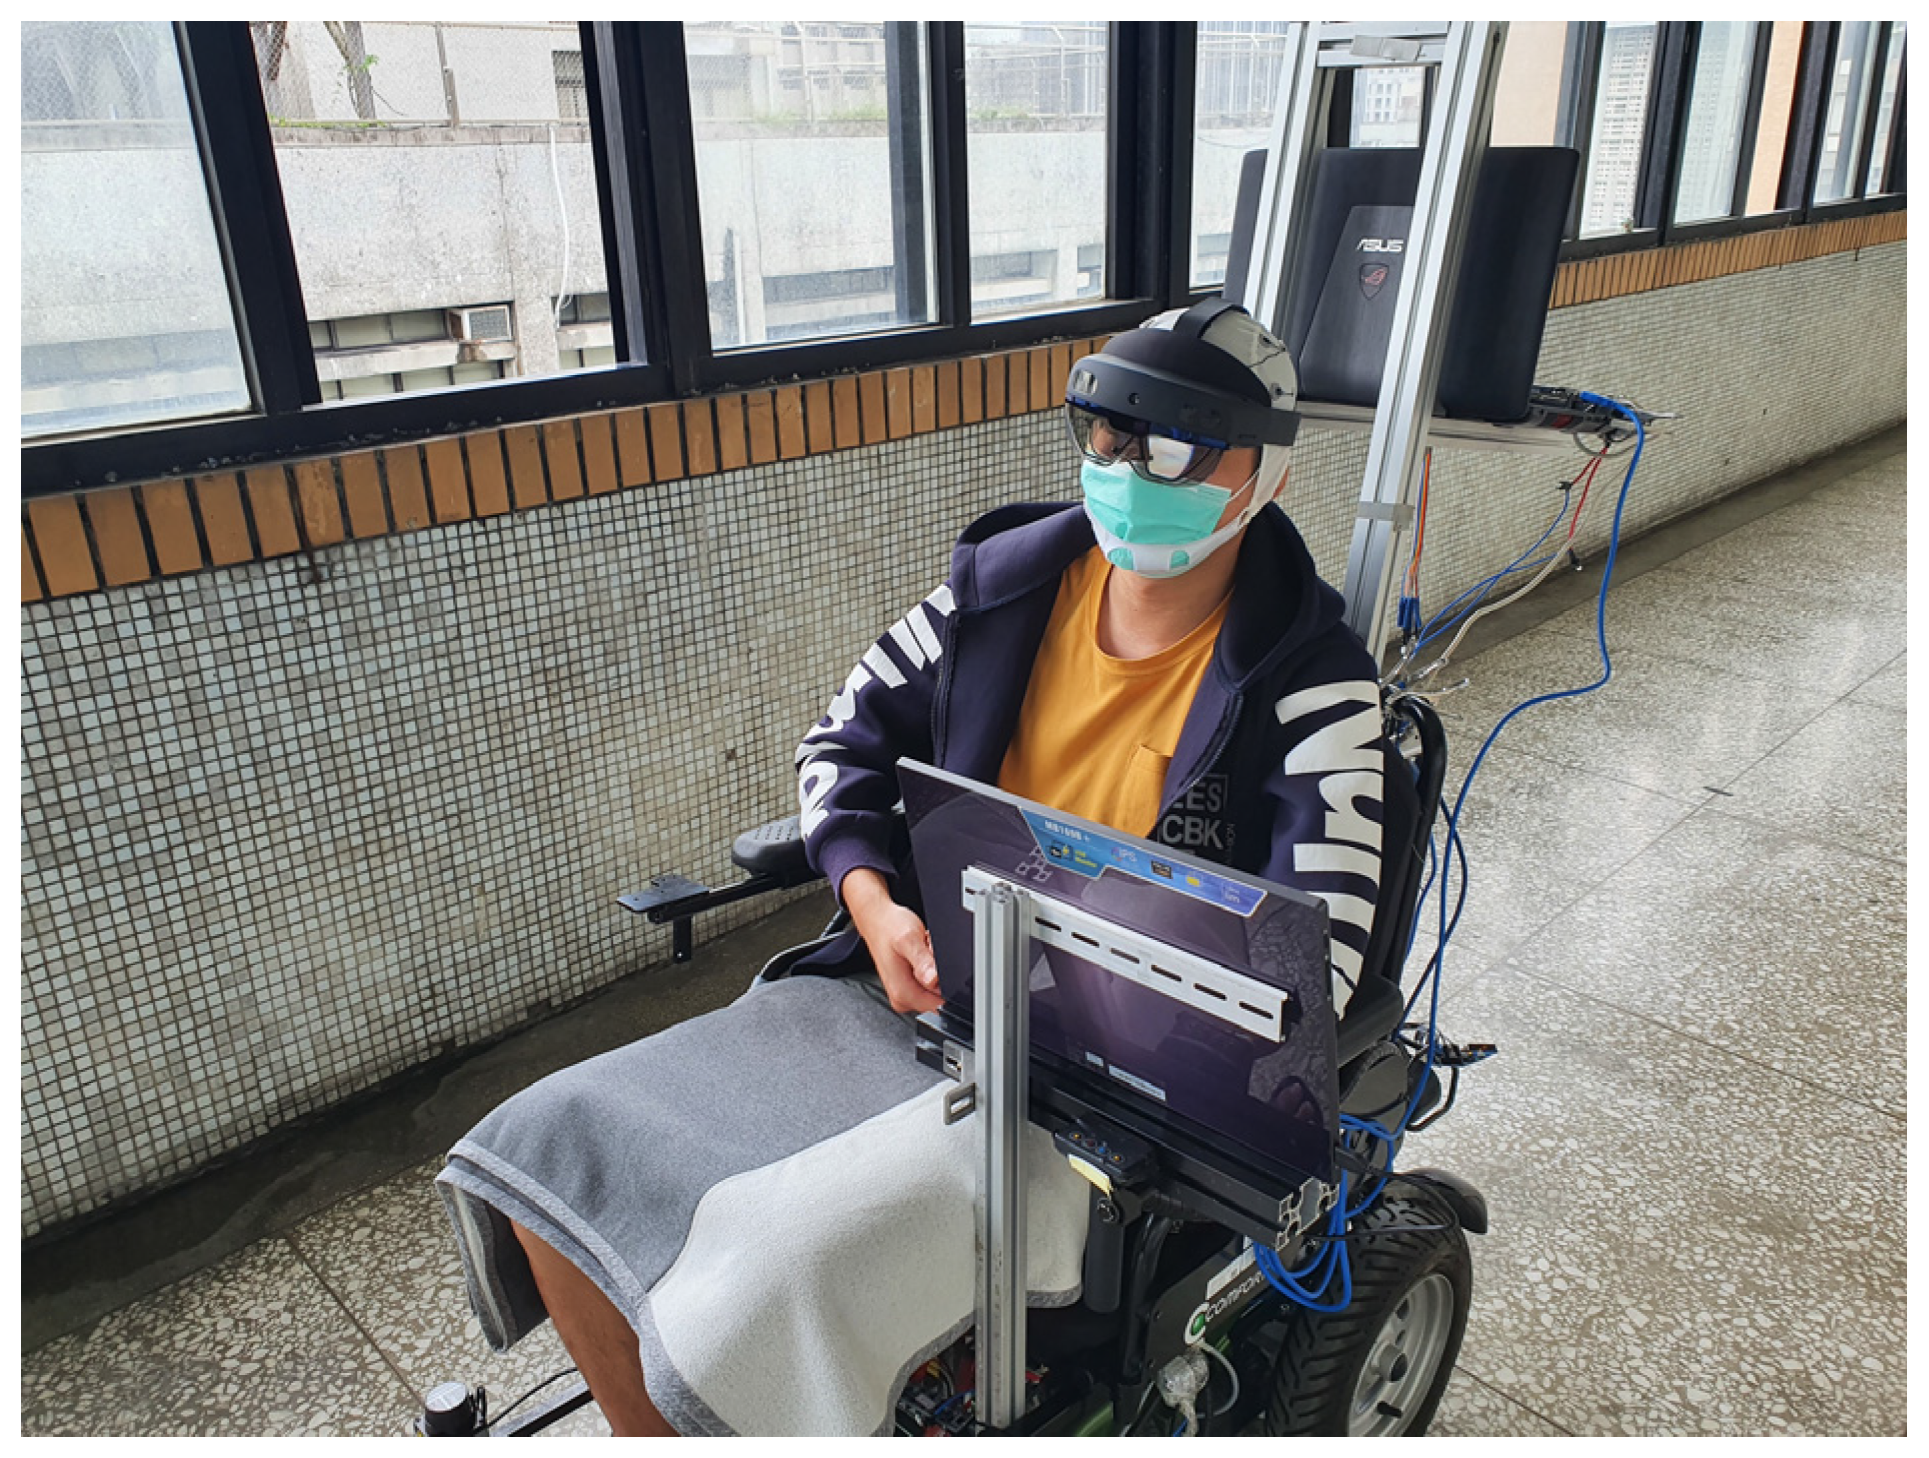
Figure 7. For the experiment that used MR goggles, participants wore an electrode cap kit and then put on the MR goggles. The configuration for the experiment using MR goggles is shown in
Figure 8. Twelve subjects, ten males and two females, participated in the experiment. Their ages were in the range 39 ± 17. Each subject read and signed an informed consent form that was approved by the Study Ethics Committee for Human Study Protections (21MMHIS241e). When the data were acquired, they were fed into a CCA classifier to determine the classification accuracy.
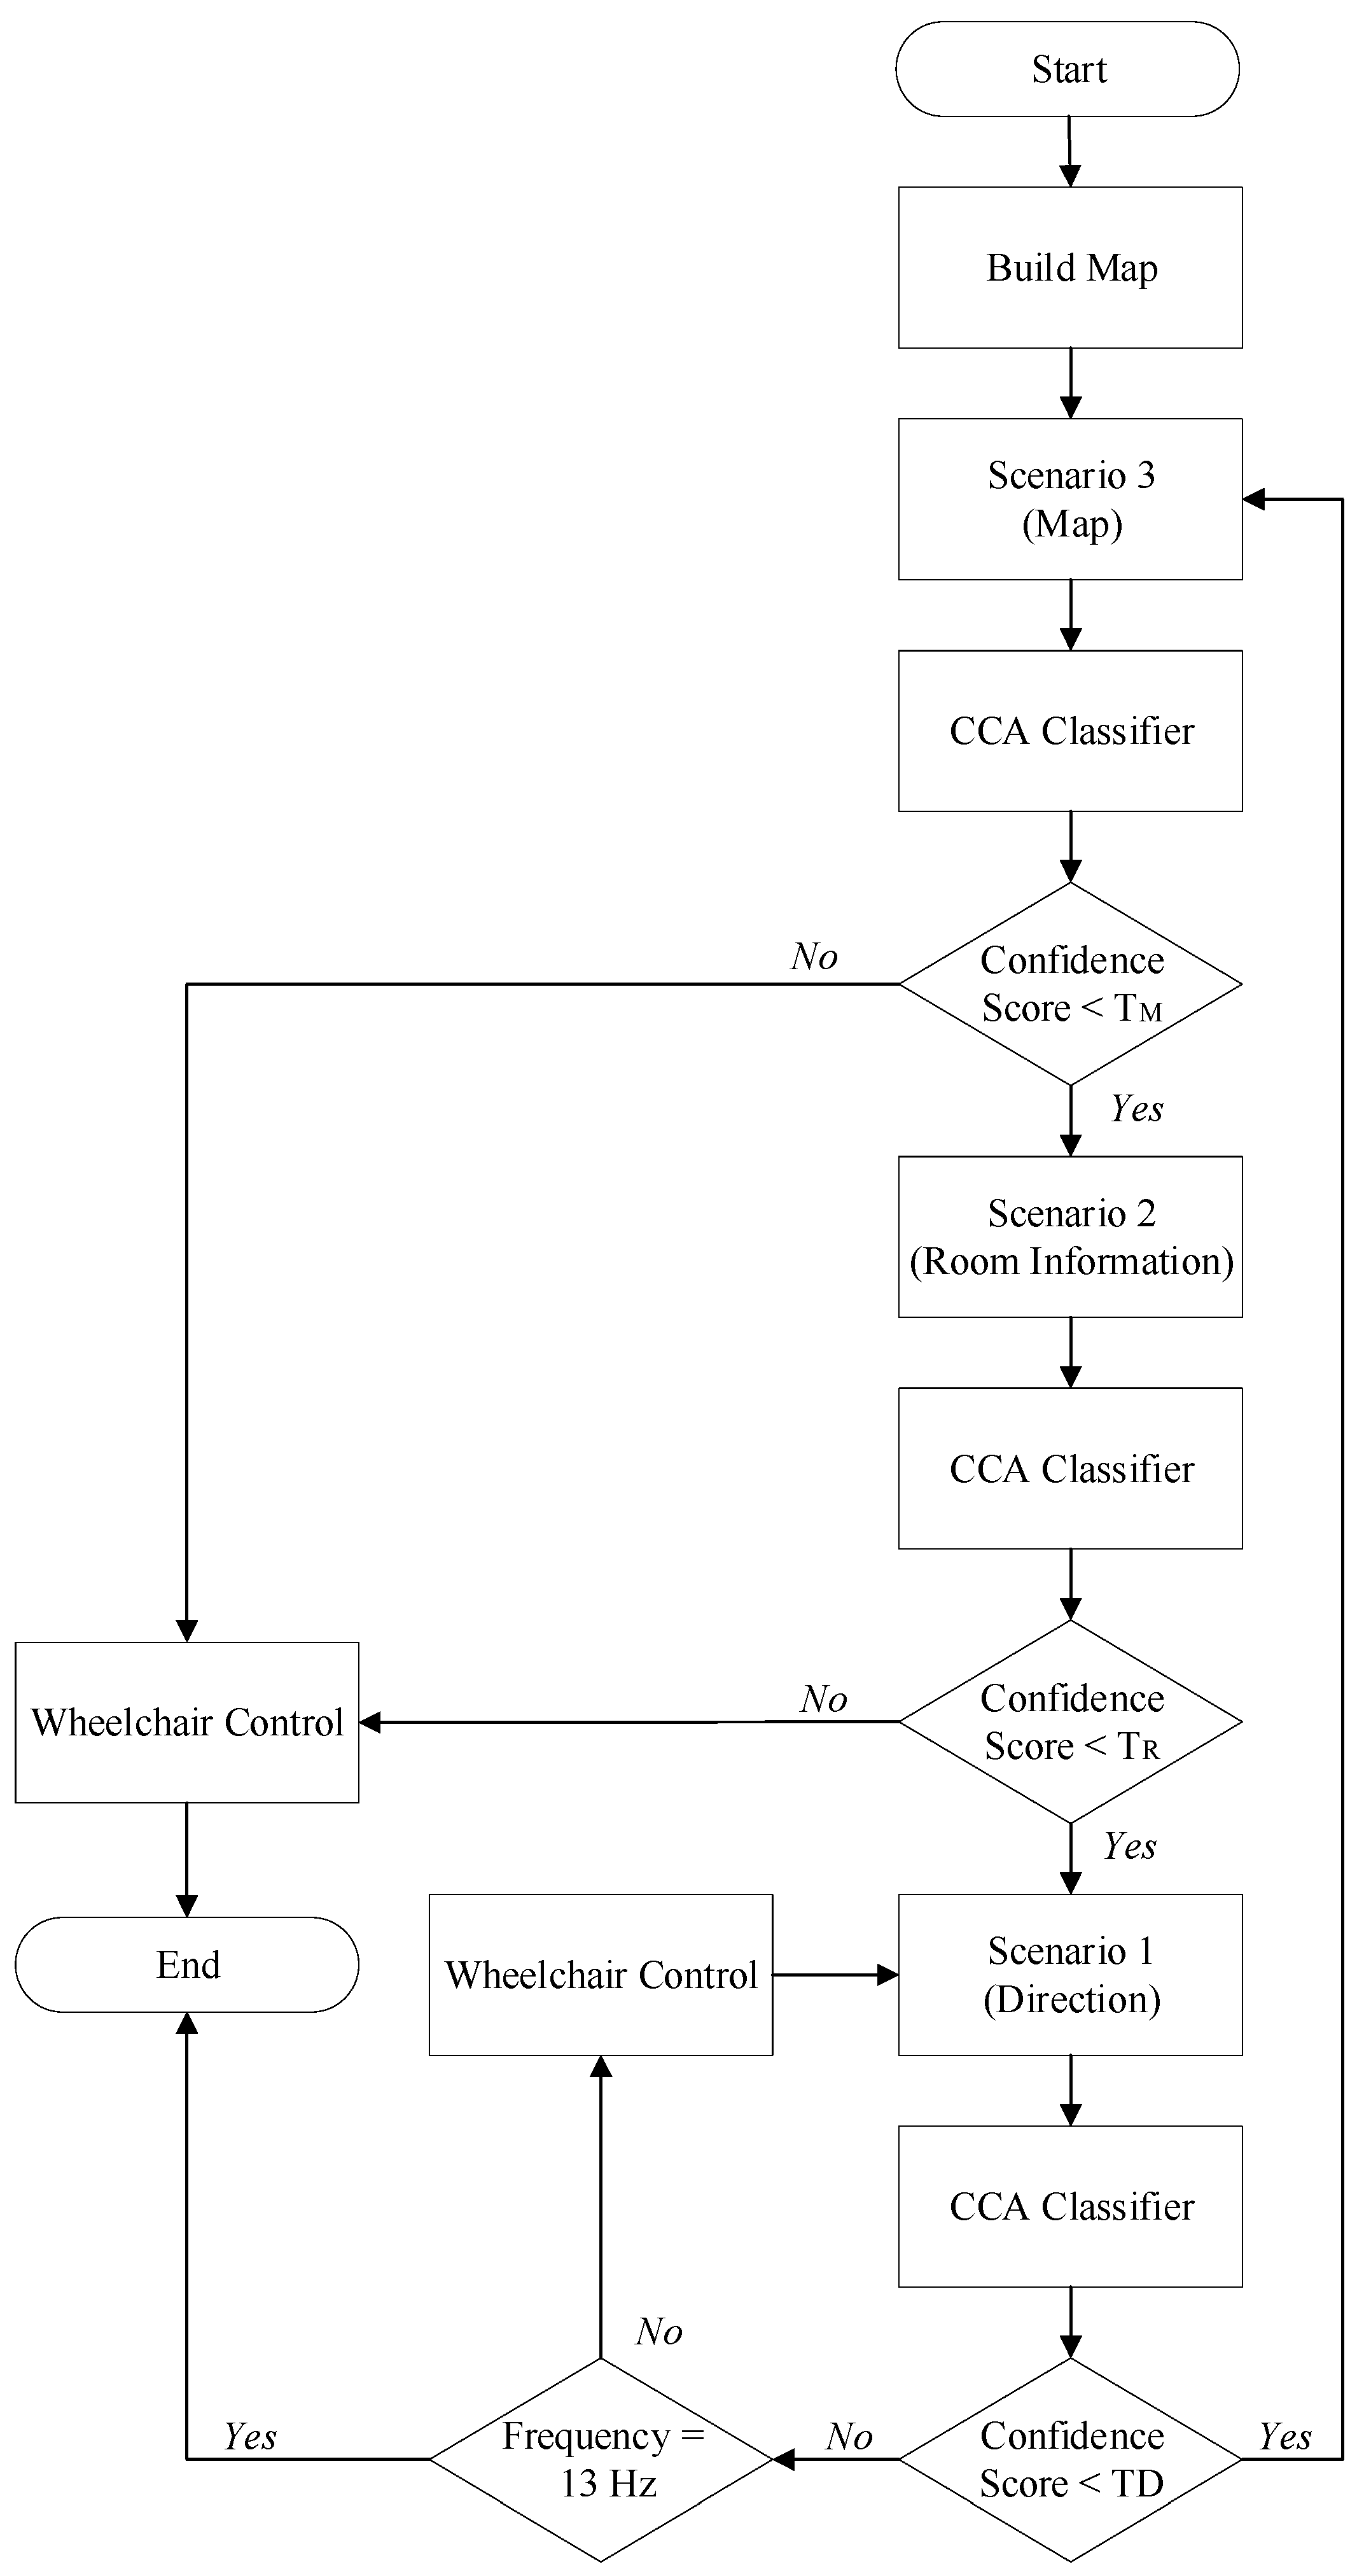
When the CCA classification rate was verified, the electric wheelchair was operated online. When controlling the electric wheelchair using the real-time system, the subject is absorbed in the interface or MR goggles and has five options that correspond to respective flickers. This EEG signal measures the associations with the classified dataset. The outcome is translated into a command to control the movement of the wheelchair or a target location and is transmitted via TCP/IP.
5.2. SSVEP Experimental Results
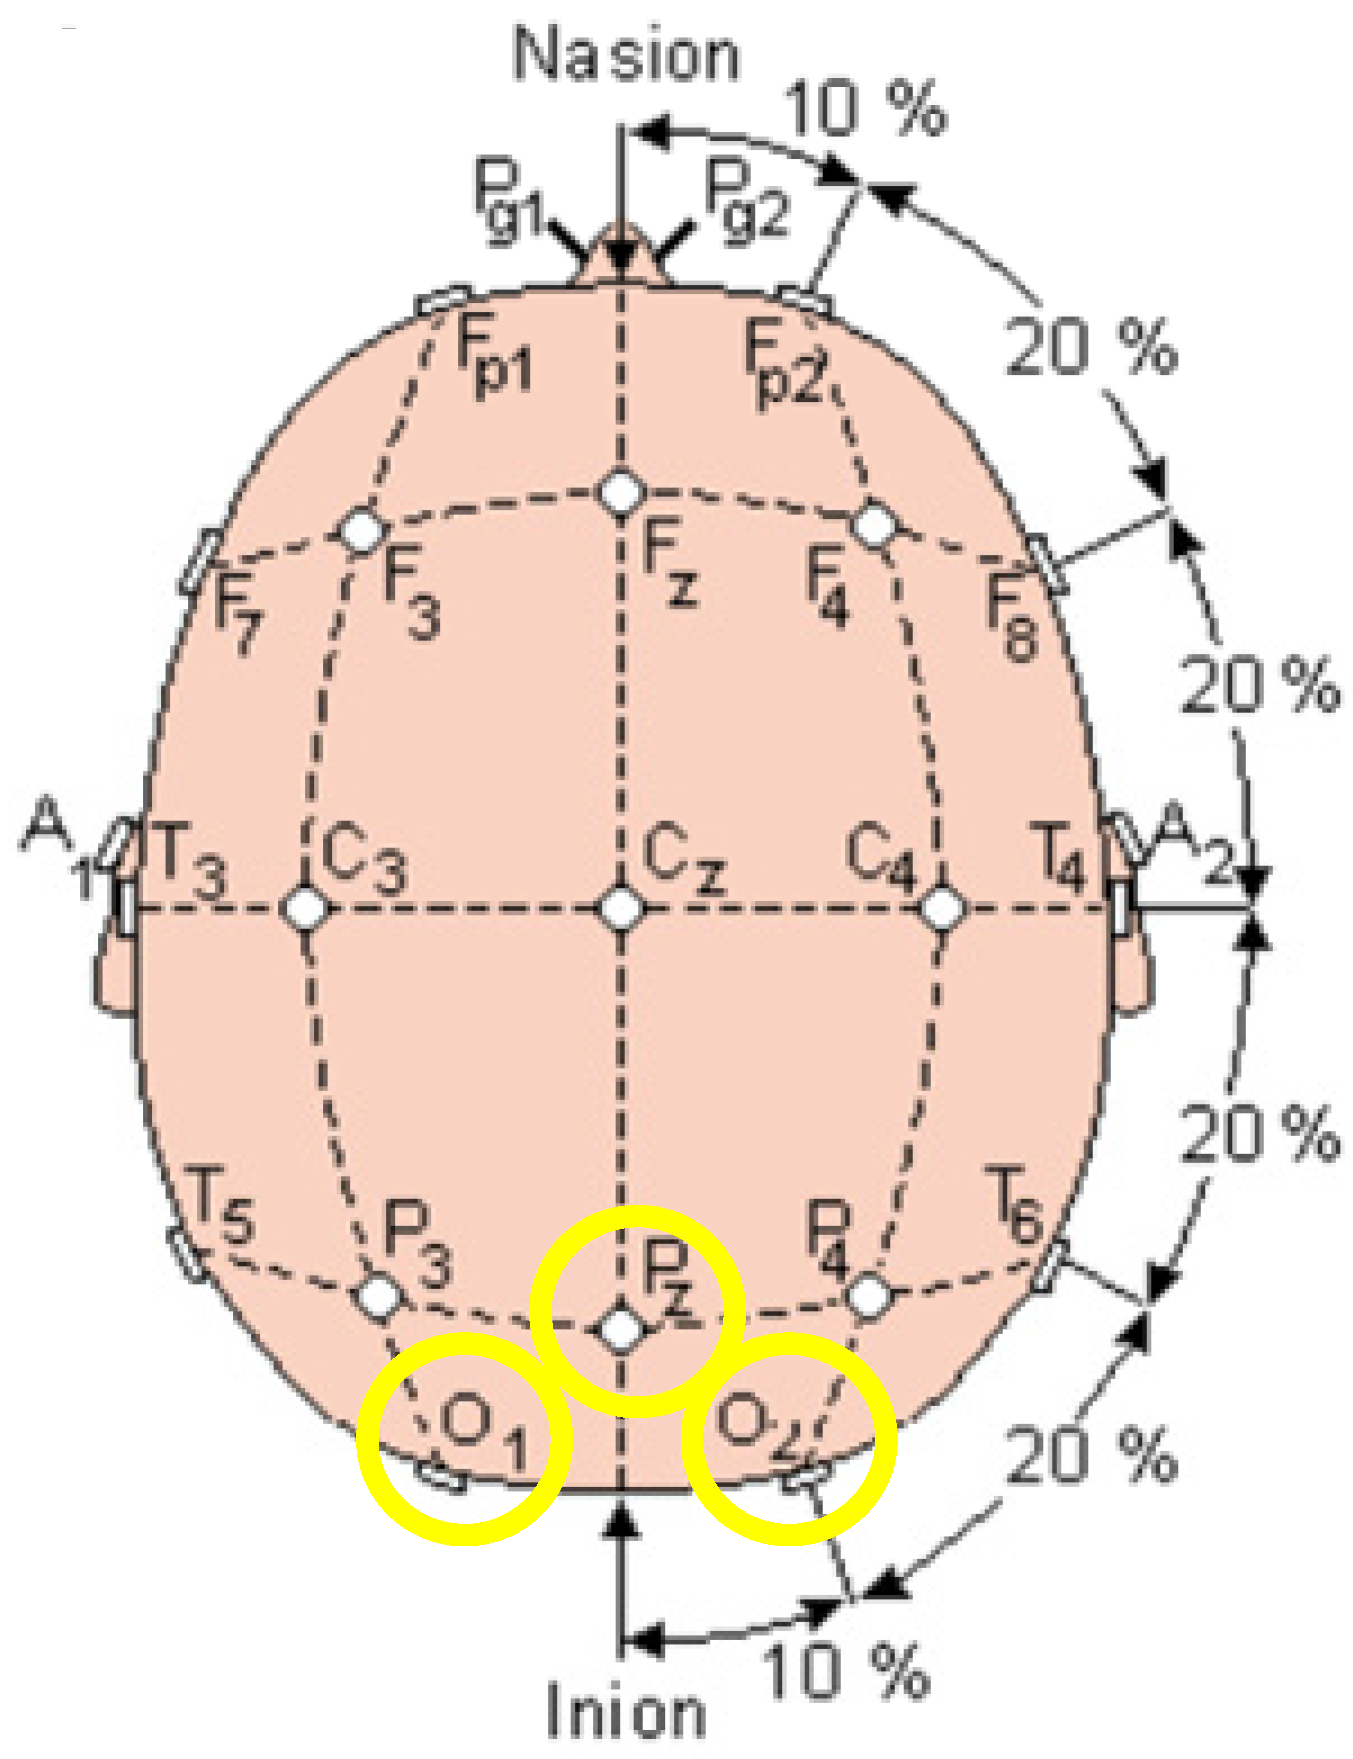
This study collected the EEG signals from a 21-channel EEG cap that has a sampling rate of 250 Hz. A laptop configured with an Intel i7-10750H CPU, 16GB RAM and RTX 1660Ti 6GB GPU was used to acquire the EEG signals from the amplifier. The configuration of the channels on the EEG cap is shown in
Figure 9. The three channels O
1, O
2 and Pz, in the occipital region, which is the yellow region in
Figure 9, were used as the CCA classifier’s input signal to reconstruct the SSVEP-based stimulus.
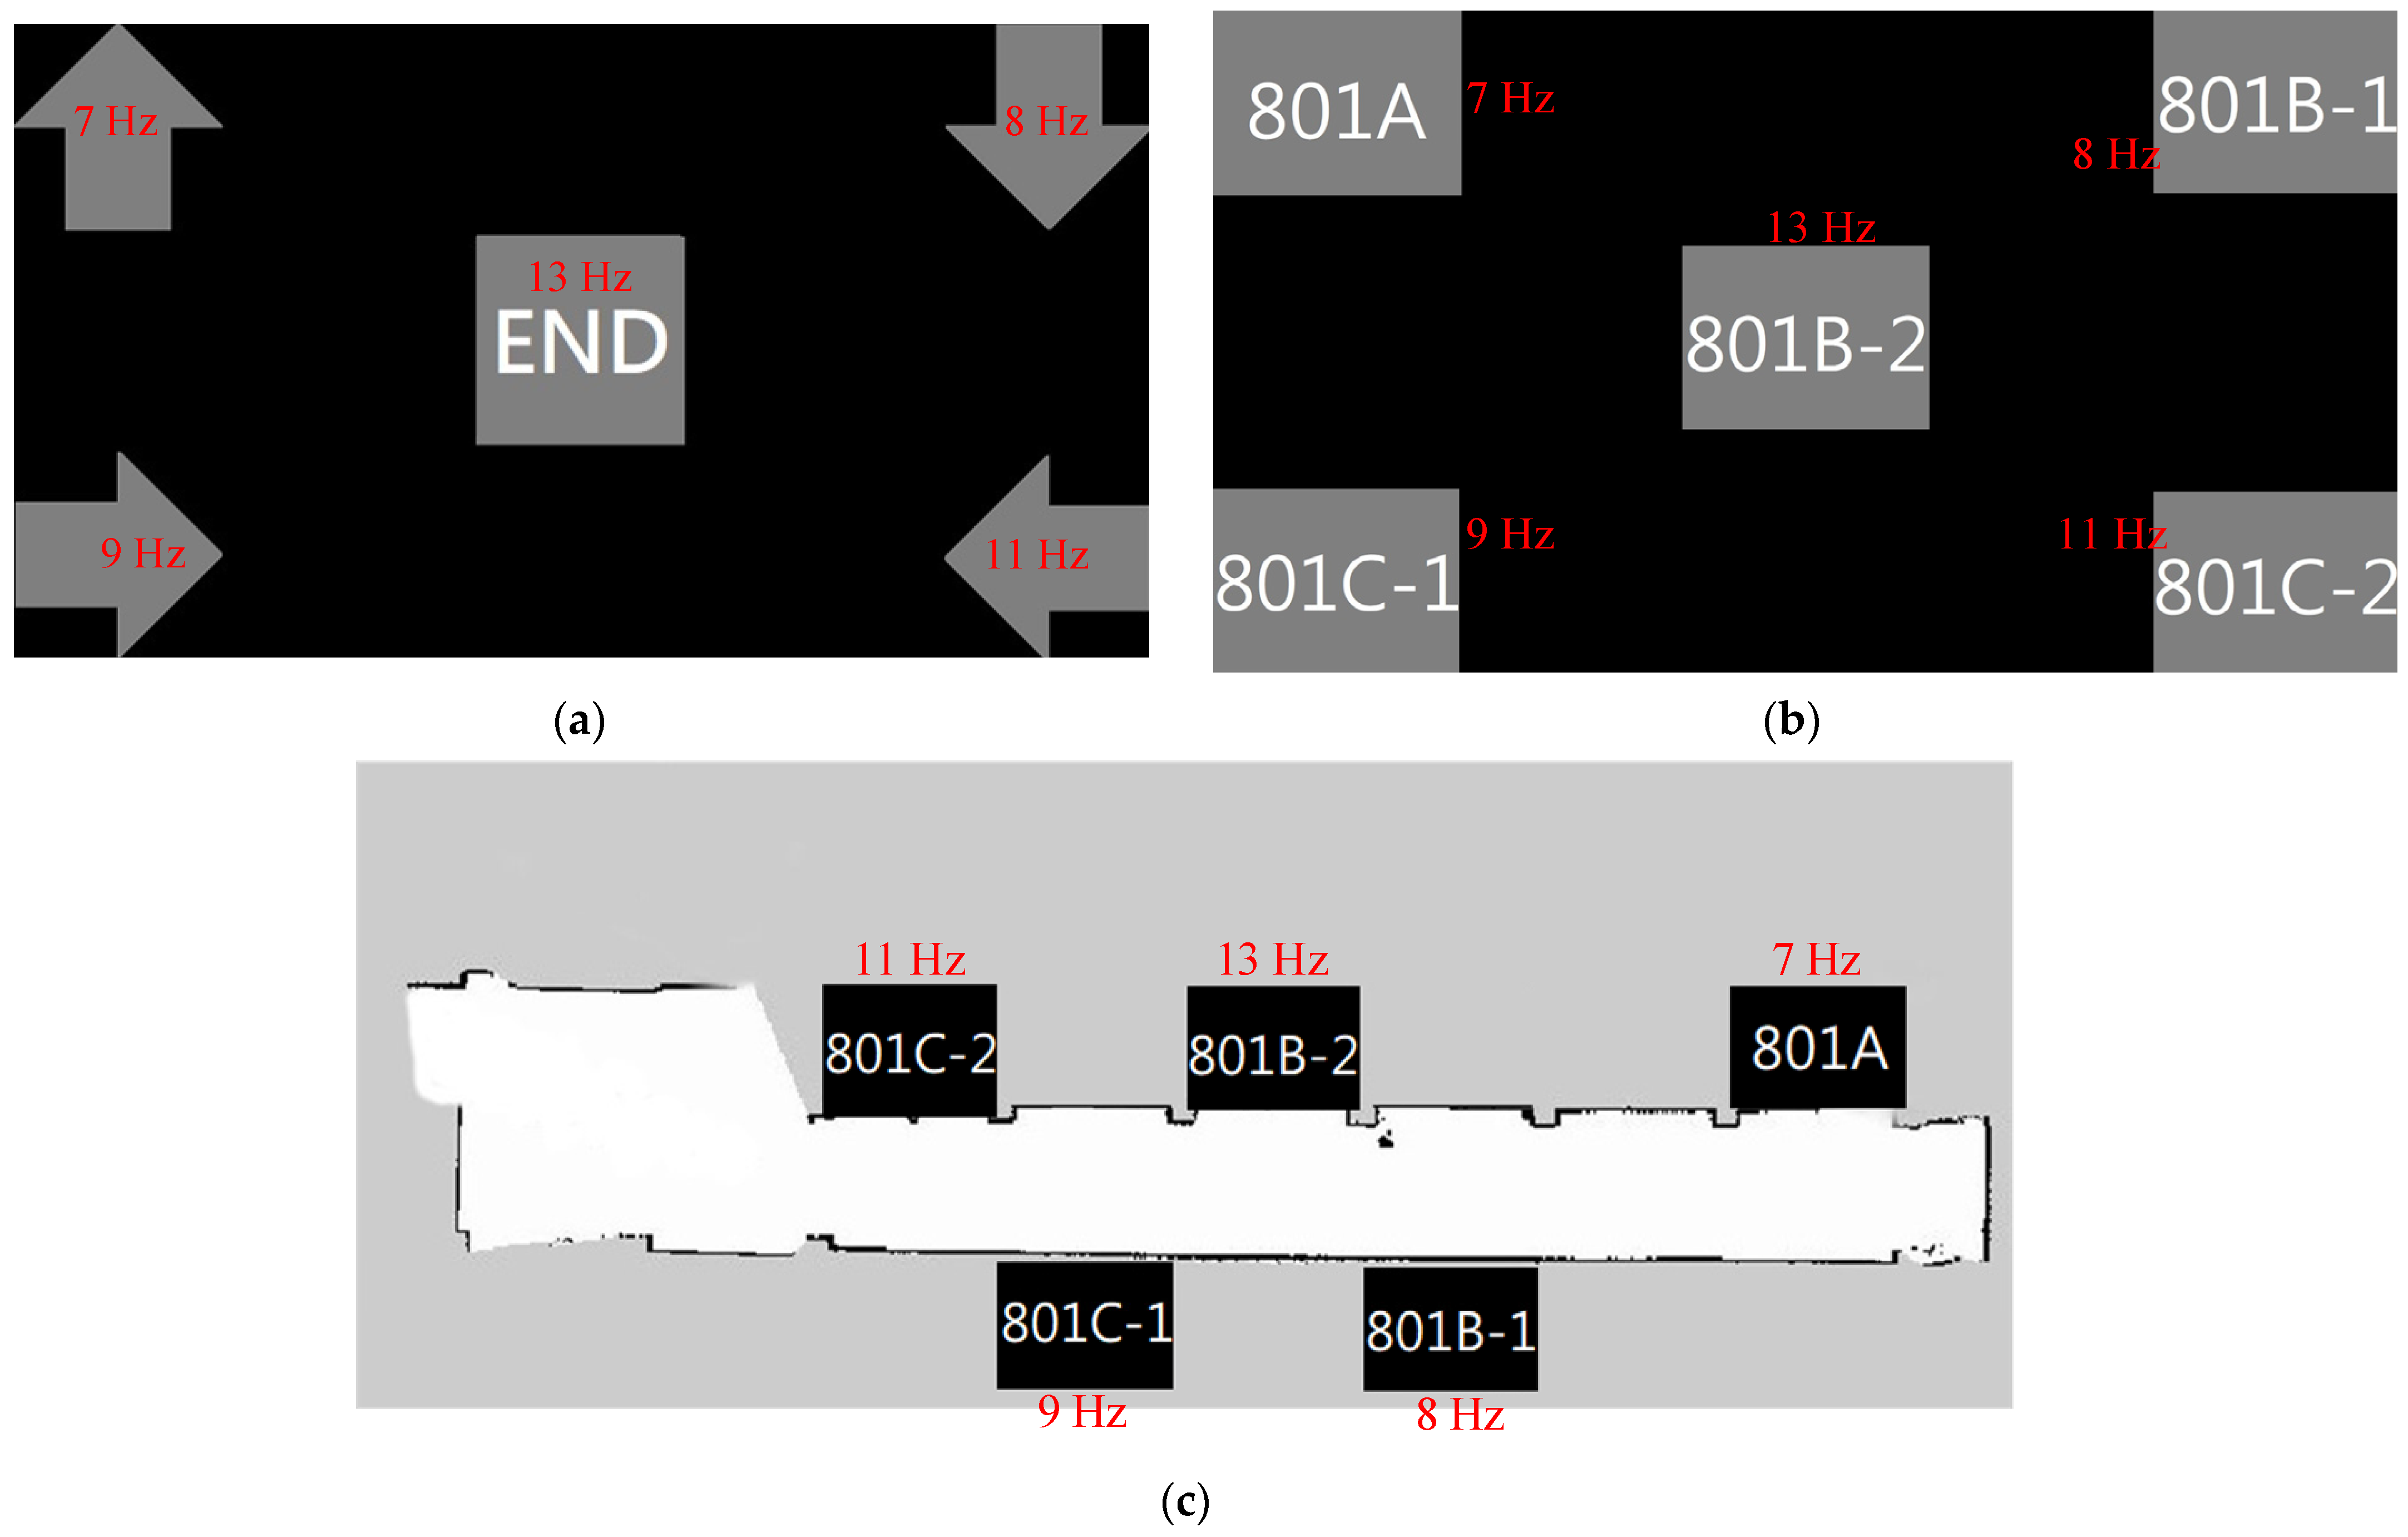
Three scenarios describe the direction (Scenario 1), room information (Scenario 2), and environmental map (Scenario 3), which were analyzed using the CCA and MSI classifier. One experiment used a screen to present the scenarios and the other used MR goggles to display the flickers. The results of the first experiment using a screen and the classification method CCA, collected from twelve participants, are shown in
Table 1,
Table 2 and
Table 3, respectively. The results of another experiment using MSI as an analysis tool are shown in
Table 4,
Table 5 and
Table 6, respectively.
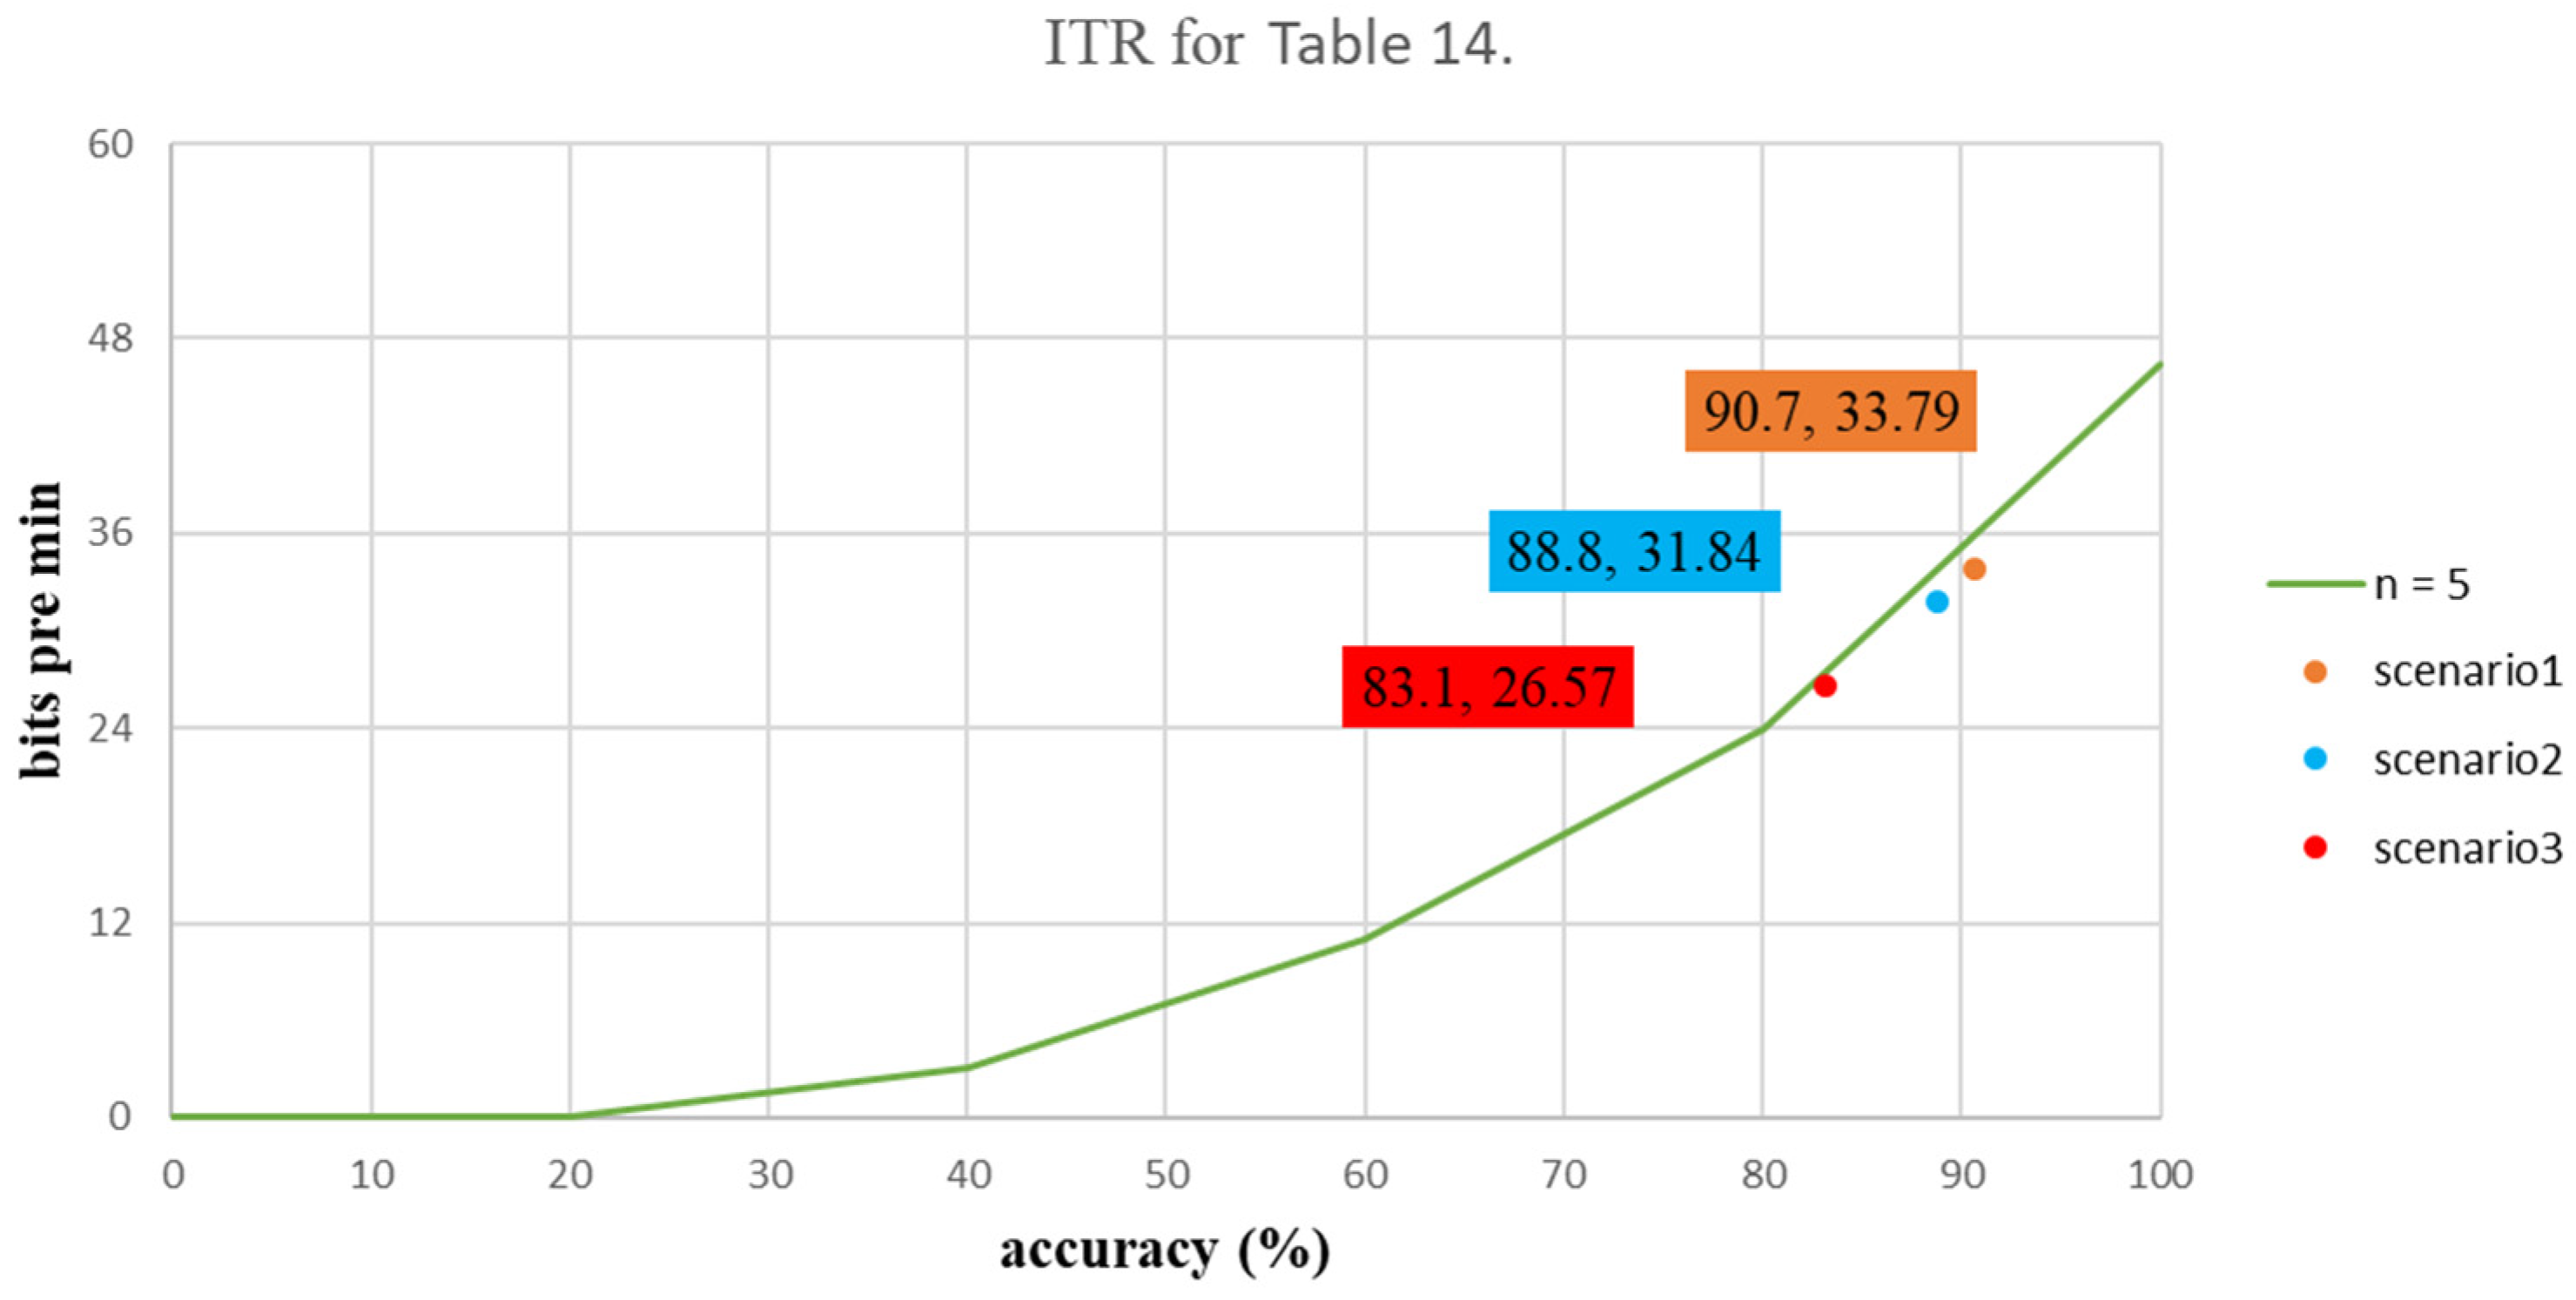
Scenario 1 was designed as a similar function as a joystick, used to control the direction of an electric wheelchair and the accuracies (ACCs) of CCA for four orientations, backward, forward, left and right and an end option, at frequencies of 7 Hz, 8 Hz, 9 Hz, 11 Hz and 13 Hz were 95%, 90.8%, 90.4%, 94.2% and 83%, respectively. The average ACC for all frequencies was 90.7%.
For the experiment involving automatic control five pictures of the room tag with the rooms’ names and identification numbers were used. For Scenario 2, the same frequencies were used, and the classification ACCs of CCA were 94.6%, 92.1%, 92.1%, 88.3% and 77.1%, respectively. The average ACC for all frequencies was 88.8%.
Scenario 3 used a map of the entire experimental field so the subject selected the location of the rooms directly. The ACCs of CCA were 87.1%, 82.5%, 87.1%, 82.1% and 76.7%, respectively. The average ACC for all frequencies was 83.1%.
For the experiment that used a screen to present the scene, Scenario 3 used a map and the user saw the location of the destination initially, but the ACC was obviously low. Therefore, Scenario 2 was used to confirm the user’s choice and increase the accuracy of the BCI system.
Similar to Scenario 1 using the CCA classifier, the results from using the MSI analysis tool were 94.5%, 85%, 89.6%, 88.8% and 72.9%, respectively. The average ACC for all frequencies was 86.2%. For Scenario 2, using the same frequency and MSI for analysis, the classification ACCs were 94.2%, 91.3%, 90.8%, 79.6% and 70%, respectively. The average ACC for all frequencies was 86.3%. Then the classification rates in Scenario 3 were 92.1%, 84.6%, 82.1%, 77.5% and 68.3%, respectively. The average ACC for all frequencies was 80.9%.
The results for the experiment that used MR goggles and CCA for analysis, collected from the same twelve participants, are shown in
Table 7,
Table 8 and
Table 9 respectively. The experimental results using MSI as the analysis method are shown in
Table 10,
Table 11 and
Table 12. Scenarios 1, 2 and 3 were the same as those for the experiment using the screen. Using MR goggles, Scenario 1, which controlled the direction of the electric wheelchair, had respective accuracies (ACCs) for the four orientations, backward, forward, left and right, and an end option at frequencies of 7 Hz, 8 Hz, 9 Hz, 11 Hz and 13 Hz were 95.8%, 97.9%, 100%, 98.8% and 97.5%. The average ACC for all frequencies was 98%. Scenario 2 used the same frequencies and the classification ACCs were 94.6%, 96.3%, 98.8%, 98.3% and 95.8%, respectively. The average ACC for all frequencies was 96.8%. Scenario 3 used a map of the entire experimental field and the ACCs were 99.6%, 98.8%, 100%, 98.3% and 97.5%, respectively. The average ACC for all frequencies was 98.8%.
In the experiment using MR goggles as a display, the results of analyzing the EEG signal with MSI for Scenario 1 were 97.5%, 98.8%, 100%, 97.1% and 95.4%. The average ACC for all frequencies was 97.8%. Scenario 2 used the same frequencies and the classification ACCs were 96.3%, 93.8%, 98.8%, 95% and 92.1%, respectively. The average ACC for all frequencies was 95.2%. Scenario 3 used a map of the entire experimental field and the ACCs were 99.2%, 98.8%, 98.8%, 96.7% and 88.3%, respectively. The average ACC for all frequencies was 95%.
During an online CCA experiment, each category of the different frequencies generates a confidence score. The CCA classifier generates classification results using these confidence scores so the proposed recognition algorithm determines the highest score to classify this EEG signal to the corresponding frequency. However, if the user does not pay attention to the flickers on the screen or wants to change the mode, the confidence scores are low. A threshold based on these twelve subjects is proposed. For Scenario 1, the threshold, TD, is 0.215 and for Scenarios 2 and 3, the thresholds, TR and TM, have a value of 0.22.
Table 13 shows the specified thresholds for this study for the BCI system to enter the next mode.
These experimental results show that the CCA classifier accurately classifies the EEG signals into corresponding classes. Using MR goggles to present flickering stimuli is more accurate and convenient than using a screen to present the scenario. A higher classification rate allows the electric wheelchair to move more stably and safely and the BCI system is easier to use.
