Disposable Paper-Based Biosensors for the Point-of-Care Detection of Hazardous Contaminations—A Review


Abstract
1. Introduction
2. Bio-POCT
2.1. Substrates Used in the Bio-POCT
2.2. Types of Paper
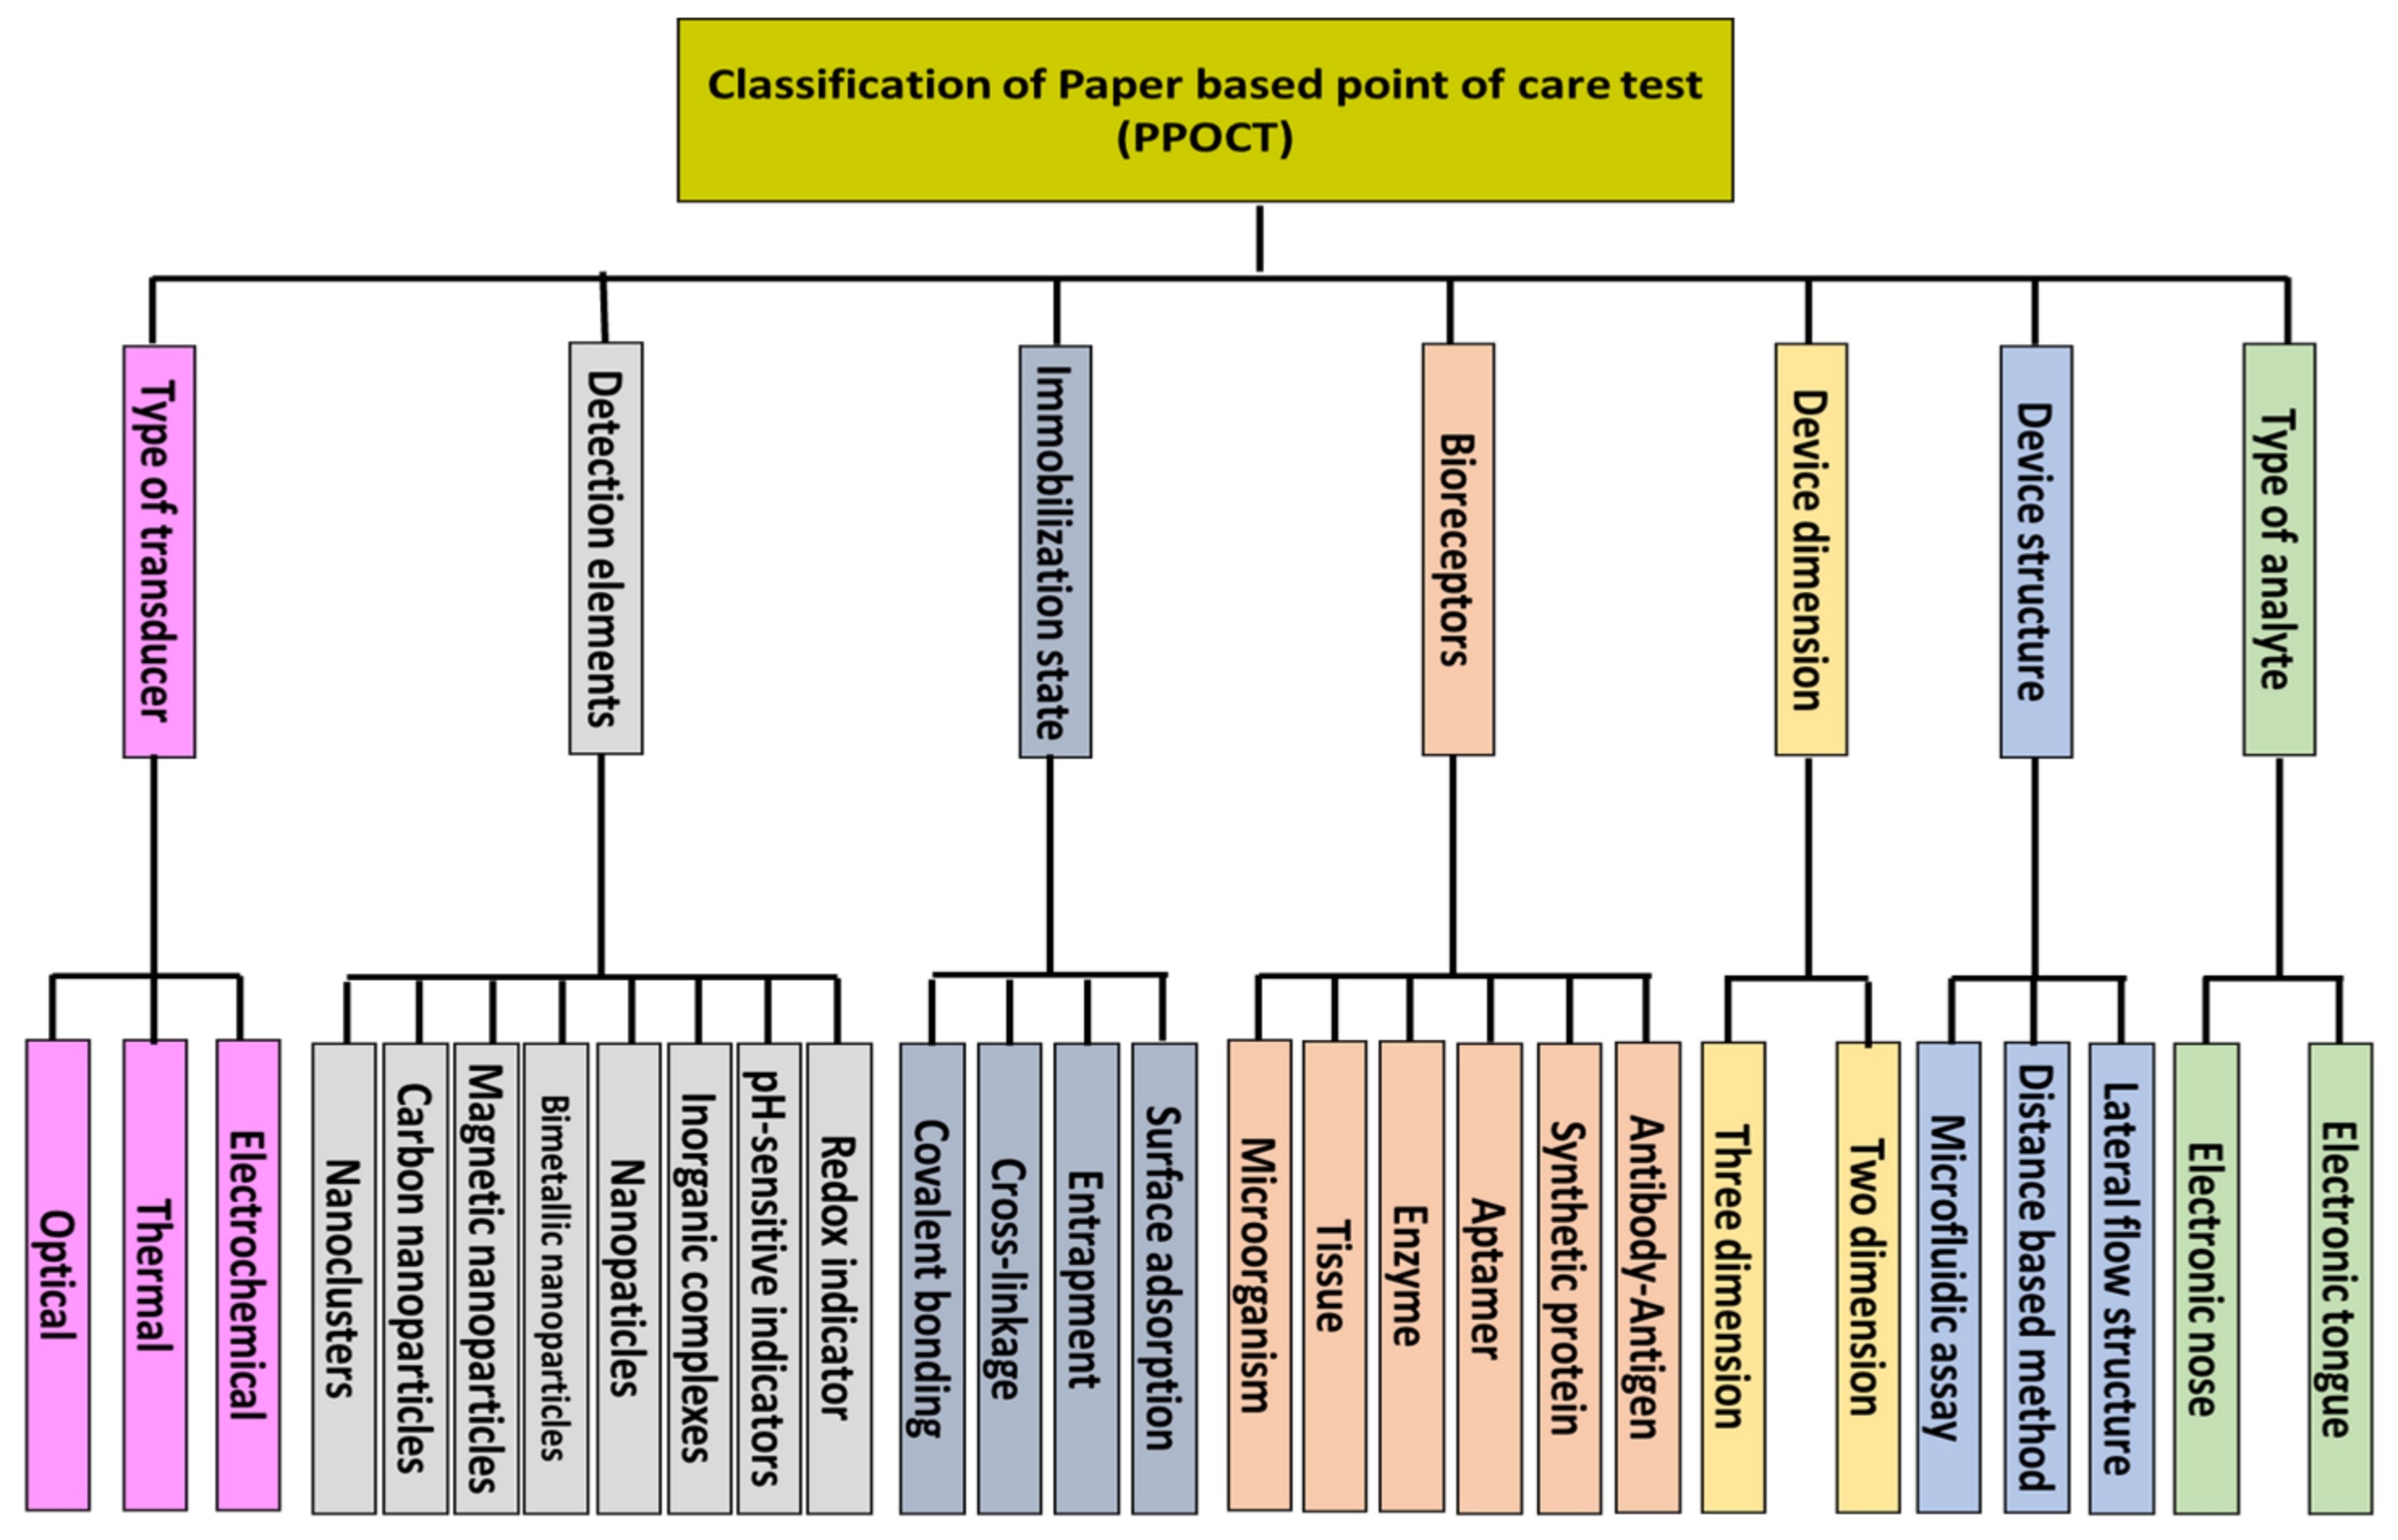
3. Classification of Bio-PPOCT, Based on the Analyte Type
4. Classification of Bio-PPOCT, Based on the Device Structure
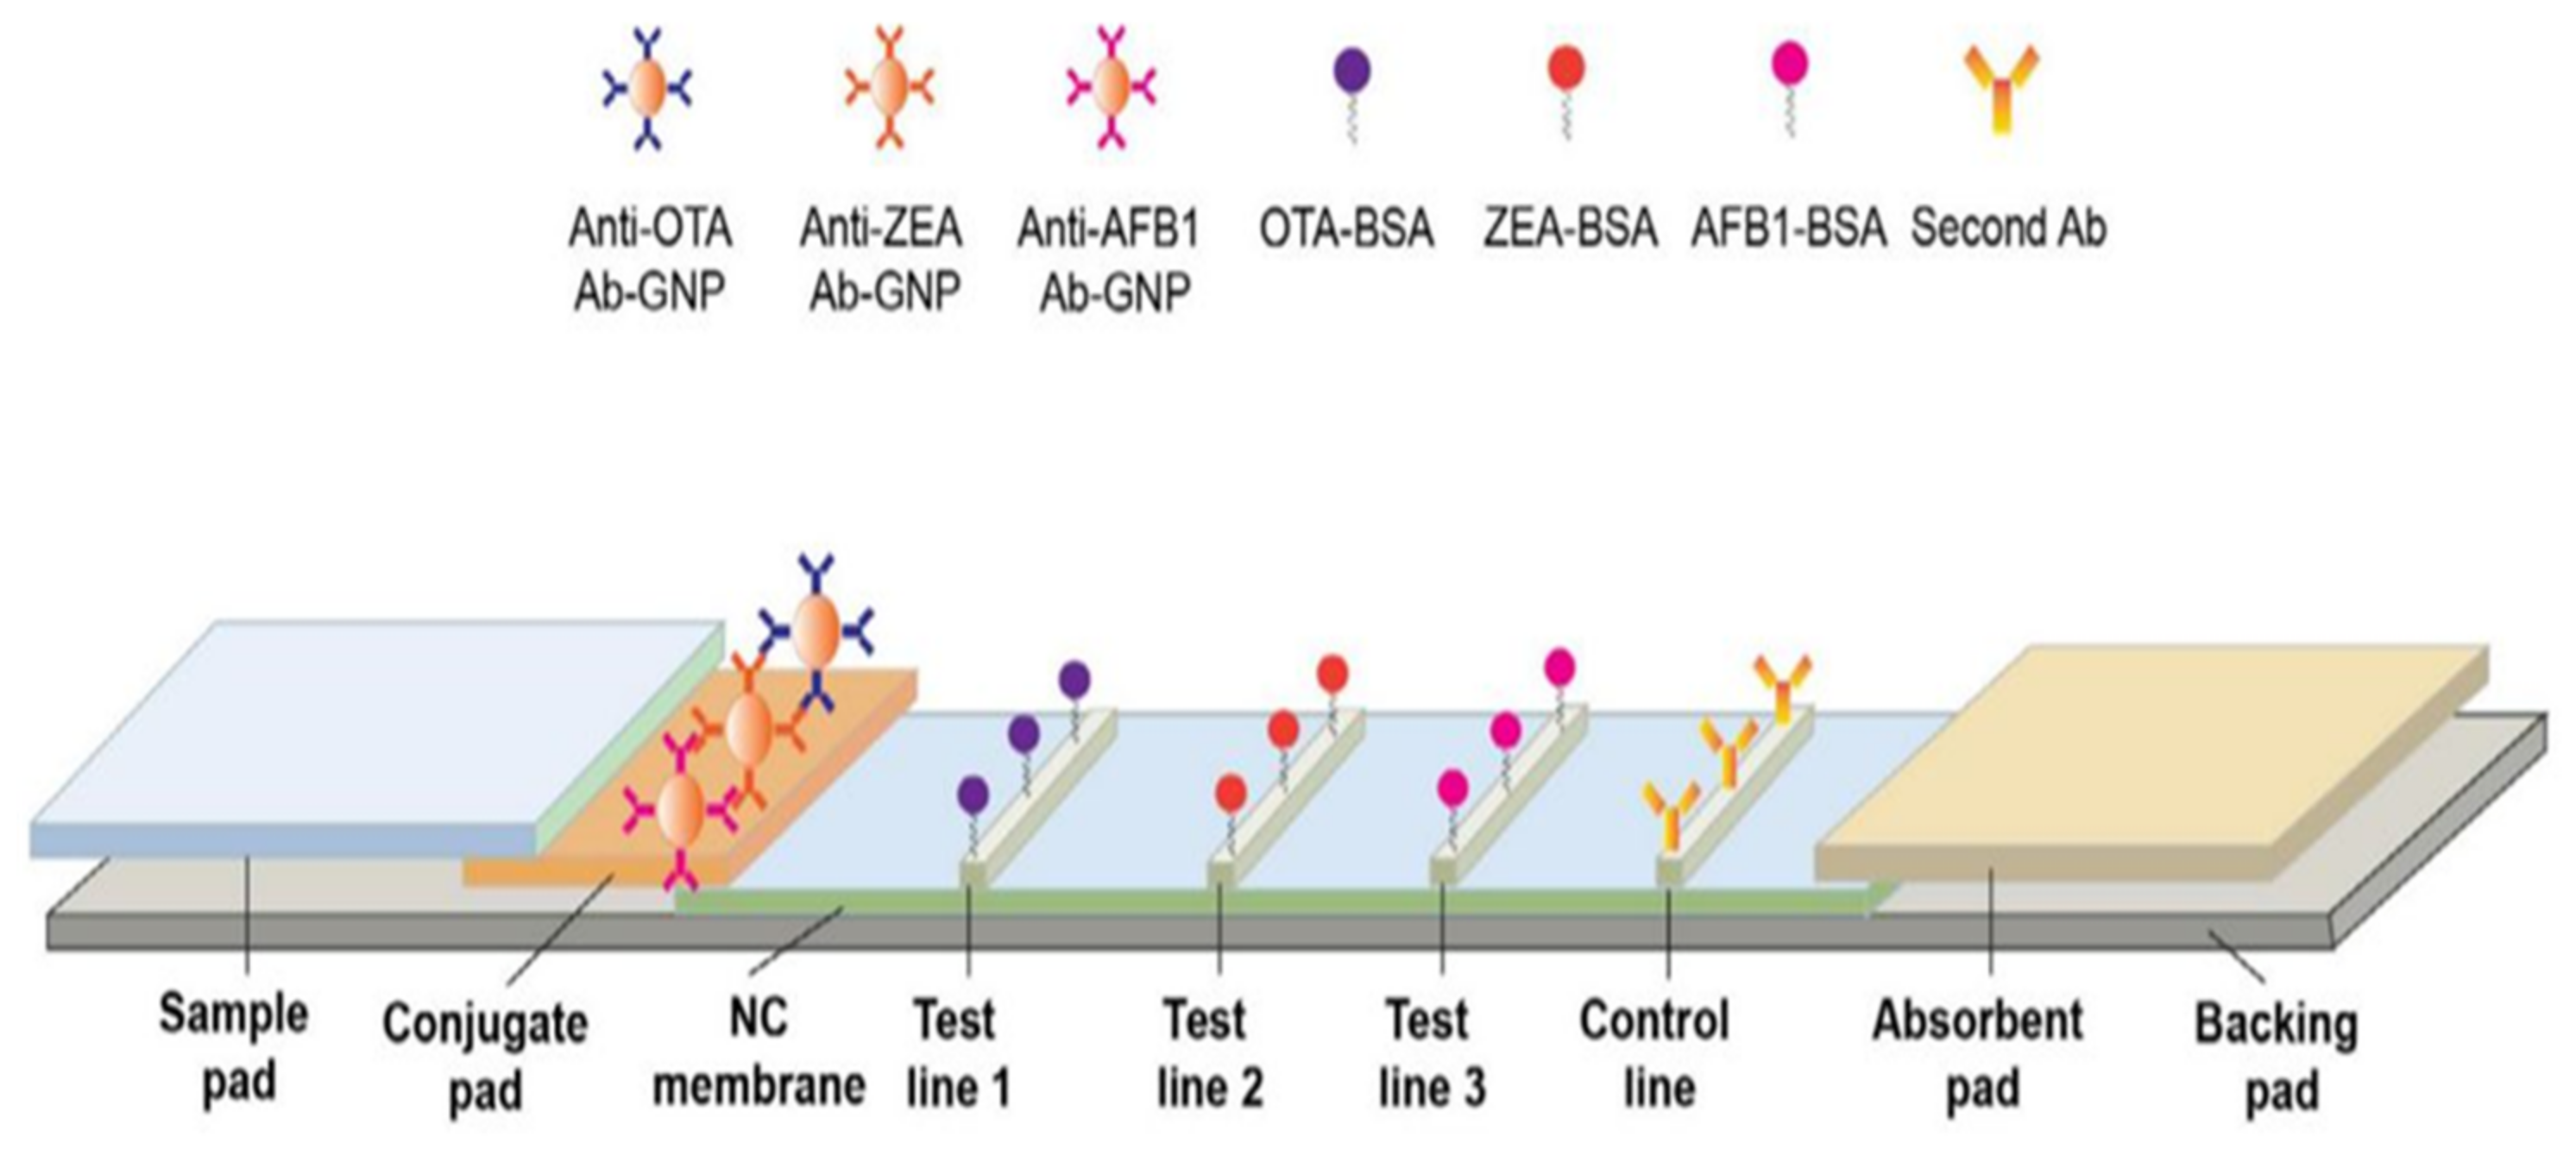
4.1. Lateral Flow Structure
4.2. Distance-Based Method
4.3. Microfluidic Assay
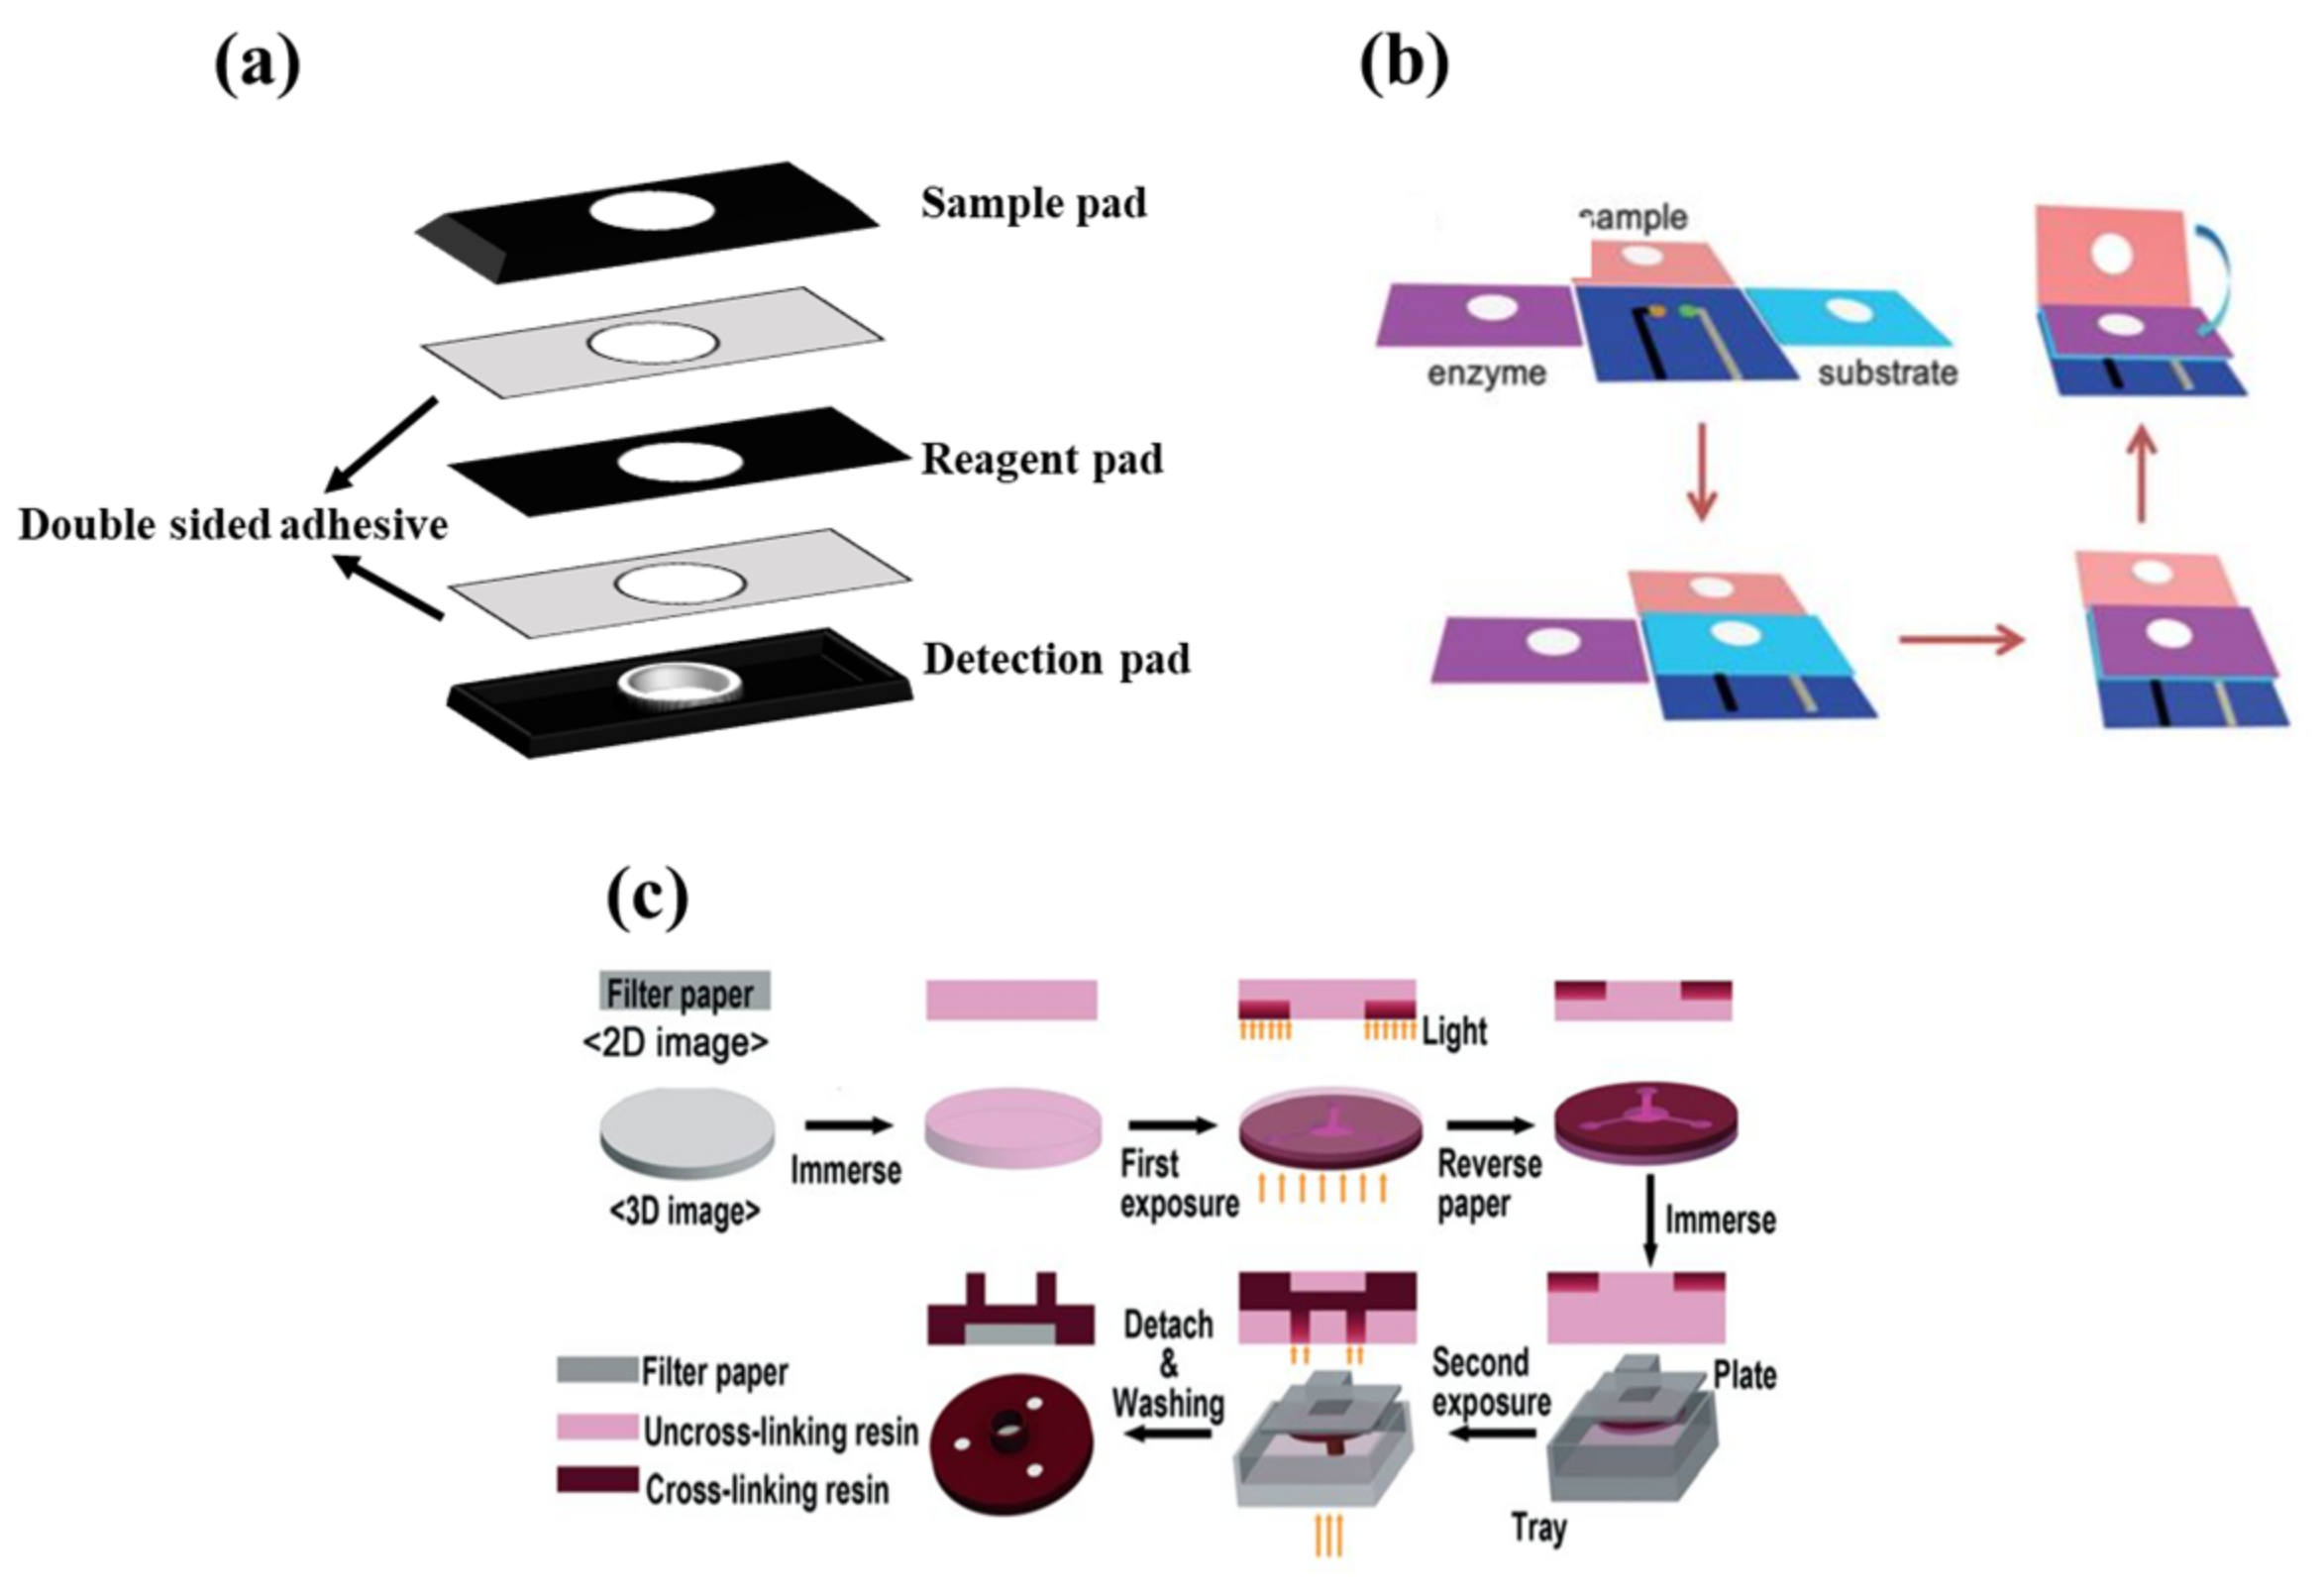
5. Classification of Bio-PPOCT Based on the Device Dimension
5.1. Two-Dimensional Configuration
5.1.1. Physical Methods
5.1.2. Chemical Methods
5.2. Three-Dimensional Configuration

6. Classification of Bio-PPOCT, Based on Bioreceptors
6.1. Antibody-Based Bioreceptors
6.2. Synthetic Protein-Based Bioreceptors
6.3. Aptamer-Based Bioreceptors
6.4. Enzyme-Based Bioreceptors
6.5. Microorganisms-Based Bioreceptors
6.6. Tissue-Based Bioreceptors
7. Classification of Bio-PPOCT, Based on Immobilization State of Bioreceptors
8. Classification of Bio-PPOCT, Based on Detection Elements
8.1. Redox Indicator
8.2. The pH-Sensitive Indicators
8.3. Inorganic Complexes
8.4. Nanopaticles
8.5. Bimetallic Nanoparticles
8.6. Magnetic Nanoparticles
8.7. Carbon Nanoparticles
8.8. Nanoclusters
9. Classification of Bio-PPOCT, Based on the Detection Method
9.1. Electrochemical Transducer
9.2. Thermal Transducers
9.3. Optical Transducers
10. Application of Paper Biosensors in the Detection of Toxic Materials
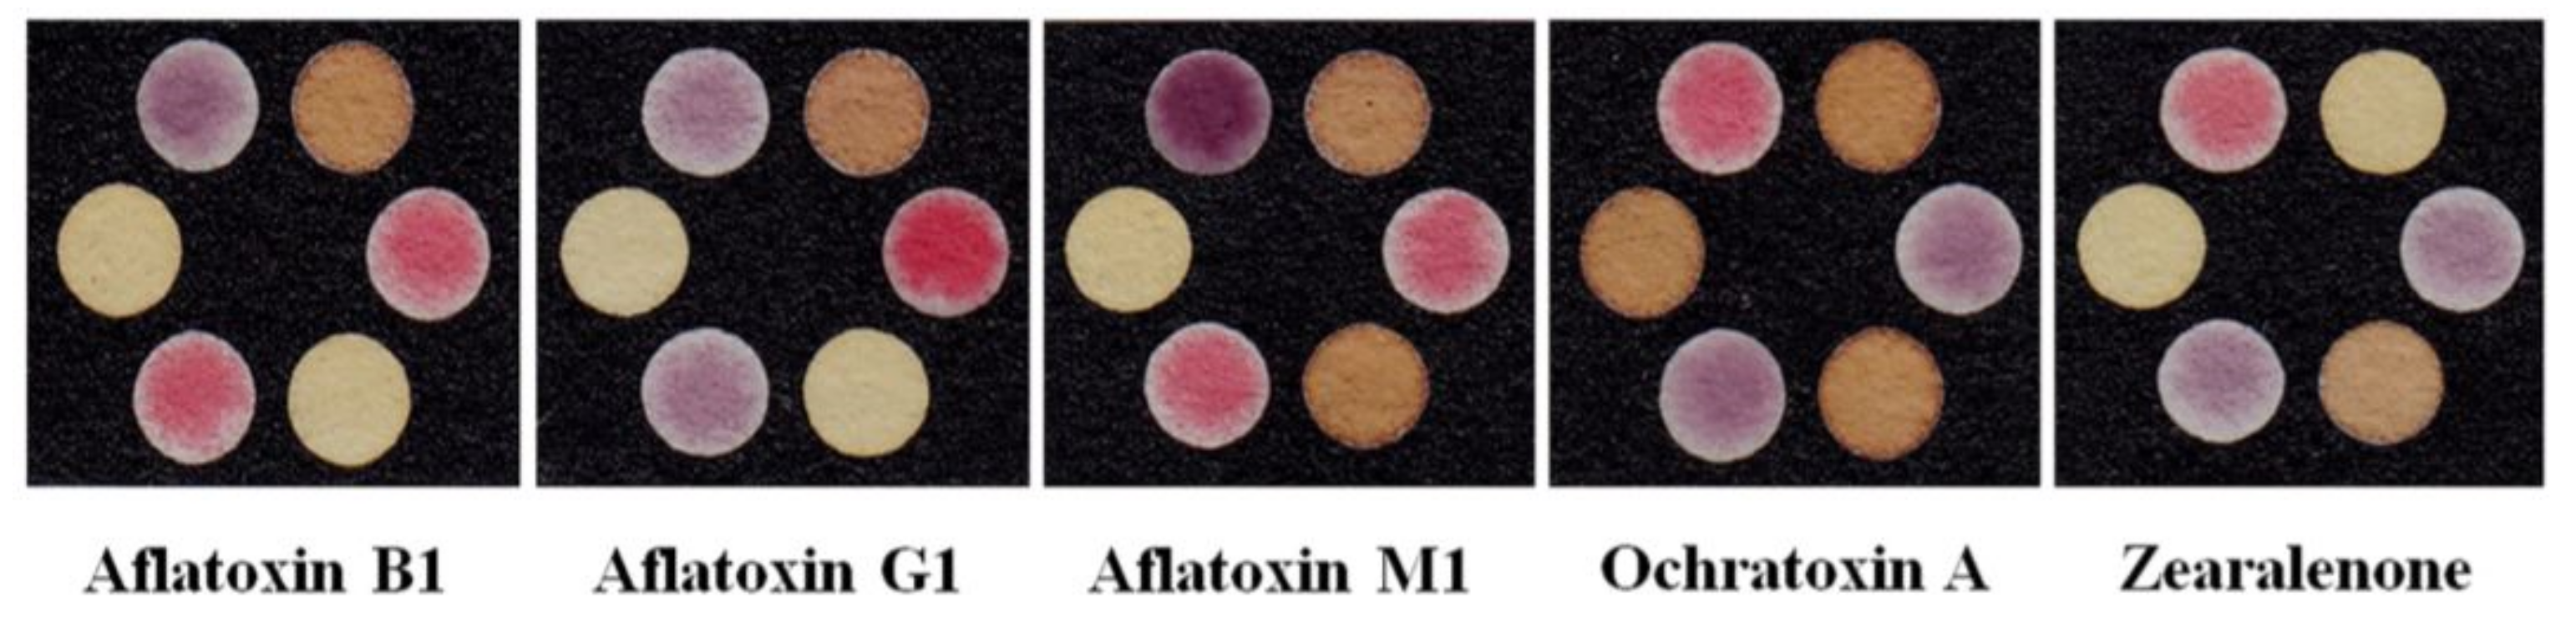
10.1. Mycotoxins Detection

| Type of Mycotoxin | Device Structure | Bioreceptor | Detection Method | Sensing Element | Media | Linear Range | Detection Limit | Ref. |
|---|---|---|---|---|---|---|---|---|
| AFB1 | Immunofiltration assay | Anti-AFB1 | Colorimetric | AuNPs | Rice, corn, and wheat | 0–4000 ng·mL−1 | 2.0 ng·mL−1 | [252] |
| AFB1 | Immunodipstick assay | Anti-AFB1 | Colorimetric | Core-Shell AgAuNPs | Rice, wheat, sunflower, cotton, chillies, and almonds | 0.1–10.0 ng·mL−1 | 0.1 ng·mL−1 | [253] |
| AFB1 | Microfluidic assay | Aptamer | Colorimetric | AuNPs | - | 1 pM–1 mM | 10 nM | [254] |
| AFB1 | Lateral flow assay | Anti-AFB1 | Fluorimetric | Fluorescent microsphere | Soybean sauce | - | 2.5 μgL−1 | [237] |
| AFB1 | Printed electrode | Anti-AFB1 | Impedimetric | MWCNT/chitosan | Maize flour | 1.0 to 30.0 ng·mL−1 | 0.62 ng·mL−1 | [251] |
| AFM1 | Lateral flow assay | Anti-AFM1 | Colorimetric | AuNPs | Milk | - | 50 pgmL−1 | [243] |
| AFM1 | Microfluidic assay | Aptamer | Colorimetric | AuNPs | Milk | 1.0 pM to 1.0 µM | 10.0 nM | [249] |
| AFM1 | Lateral flow assay | Anti-AFB1 | Fluorimetric | Fluorescent microsphere | Milk powder, UHT, and pasteurized milk | 0.05–2.0 ng·mL−1 | 0.019 ng·mL−1 | [238] |
| OTA | Lateral flow assay | Aptamer | Fluorimetric | Fluorescent probe | Corn | 1–1000 ng·mL−1 | 0.40 ng·mL−1 | [247] |
| AFs | Lateral flow assay | Anti-AFs | Fluorimetric | Eu(III) NPs | Corn | 0.03–3.90 ngg−1 | 0.03 ngg−1 | [242] |
| AFB1, AFM1, DON, OTA, T-2, ZEN | Lateral flow assay | Anti-AFB1, Anti-AFM1, Anti-DON, Anti-OTA, Anti-T-2, Anti-ZEN | Fluorimetric | Protein microarrays | Water | 0.04–1.69 ng·mL−1 0.45–3.90 ng·mL−1 20.20–69.23 ng·mL−1 35.68–363.18 ng·mL−1 0.11–1.81 ng·mL−1 0.08–7.47 ng·mL−1 | 0.01 ng·mL−1 0.24 ng·mL−1 15.45 ng·mL−1 15.39 ng·mL−1 0.05 ng·mL−1 0.01 ng·mL−1 | [246] |
| AFB1, OTA, ZEN | Lateral flow assay | Anti-AFB1, Anti-OTA, Anti-ZEN | Colorimetric | AuNPs | Peanuts, maize, and rice | 0.25 ng·mL−1 0.5 ng·mL−1 1.0 ng·mL−1 | [244] | |
| AFB1, OTA, ZEN | Lateral flow assay | Anti-AFB1, Anti-OTA, Anti-ZEN | Colorimetric | AuNPs | Corn, rice and peanut | 0.10–0.13 μg·kg−1 0.42–0.46 μg·kg−1 0.19–0.24 μg·kg−1 | [68] | |
| ZEAs, DONs, T-2s, AFs, FBs | Lateral flow assay | Anti-ZEAs, Anti-DONs, Anti-T-2s Anti-AFs, Anti-FBs, | Colorimetric | AuNPs | Cereal | 0.04–0.17 μg·kg−1 0.06–49 μg·kg−1 0.15–0.22 μg·kg−1 0.056–0.49 μg·kg−1 0.53–1.05 μg·kg−1 | [245] | |
| AFB1 ZEA DON | Lateral flow assay | Anti-AFB1, Anti-ZEA, Anti-DON, | Colorimetric | AuNPs | Cereals | 0.05 μg·kg−1 1.0 μg·kg−1 3.0 μg·kg−1 | [255] | |
| AFB1 AFG1 AFM1 OTA ZEN | Microfluidic assay | Free | Colorimetric | AuNPs and AgNPs | Pistachio, wheat, coffee, and milk | 3.1–7800 ng·mL−1 8.2–8400 ng·mL−1 2.5–8200 ng·mL−1 4.0–3800 ng·mL−1 8.0–7900 ng·mL−1 | 2.7 ng·mL−1 7.3 ng·mL−1 2.1 ng·mL−1 3.3 ng·mL−1 7.0 ng·mL−1 | [250] |
10.2. Organophosphates Detection
| Type of OP | Device Structure | Bioreceptor | Detection Method | Sensing Element | Media | Linear Range | Detection Limit | Ref. |
|---|---|---|---|---|---|---|---|---|
| Parathion | Origami | Enzyme | Potentiometric | butyrylcholine-sensitive membrane | 0.1–1.0 nm | 0.06 nm | [140] | |
| Parathion | Printed electrode | Anti-parathion | Impedimetric | Gr/ABA | Tomato and carrot | 0.1–1000 ng·L−1 | 52 pg·L−1 | [275] |
| Parathion | Micro spot | Free | SERS | Au NPs\4-MBA | apple | 0.018–0.354 μg·cm−2 | 0.011 μg·cm−2 | [270] |
| Paraoxon | Printed electrode | Enzyme | Amperometric | PtNP-IML-PGE/GA | Soil and water | 0.1–1.0 nM | 3 nM | [274] |
| Malathion | Printed electrode | Mitochondria | Voltammetric | Quinone | 20 nM | [278] | ||
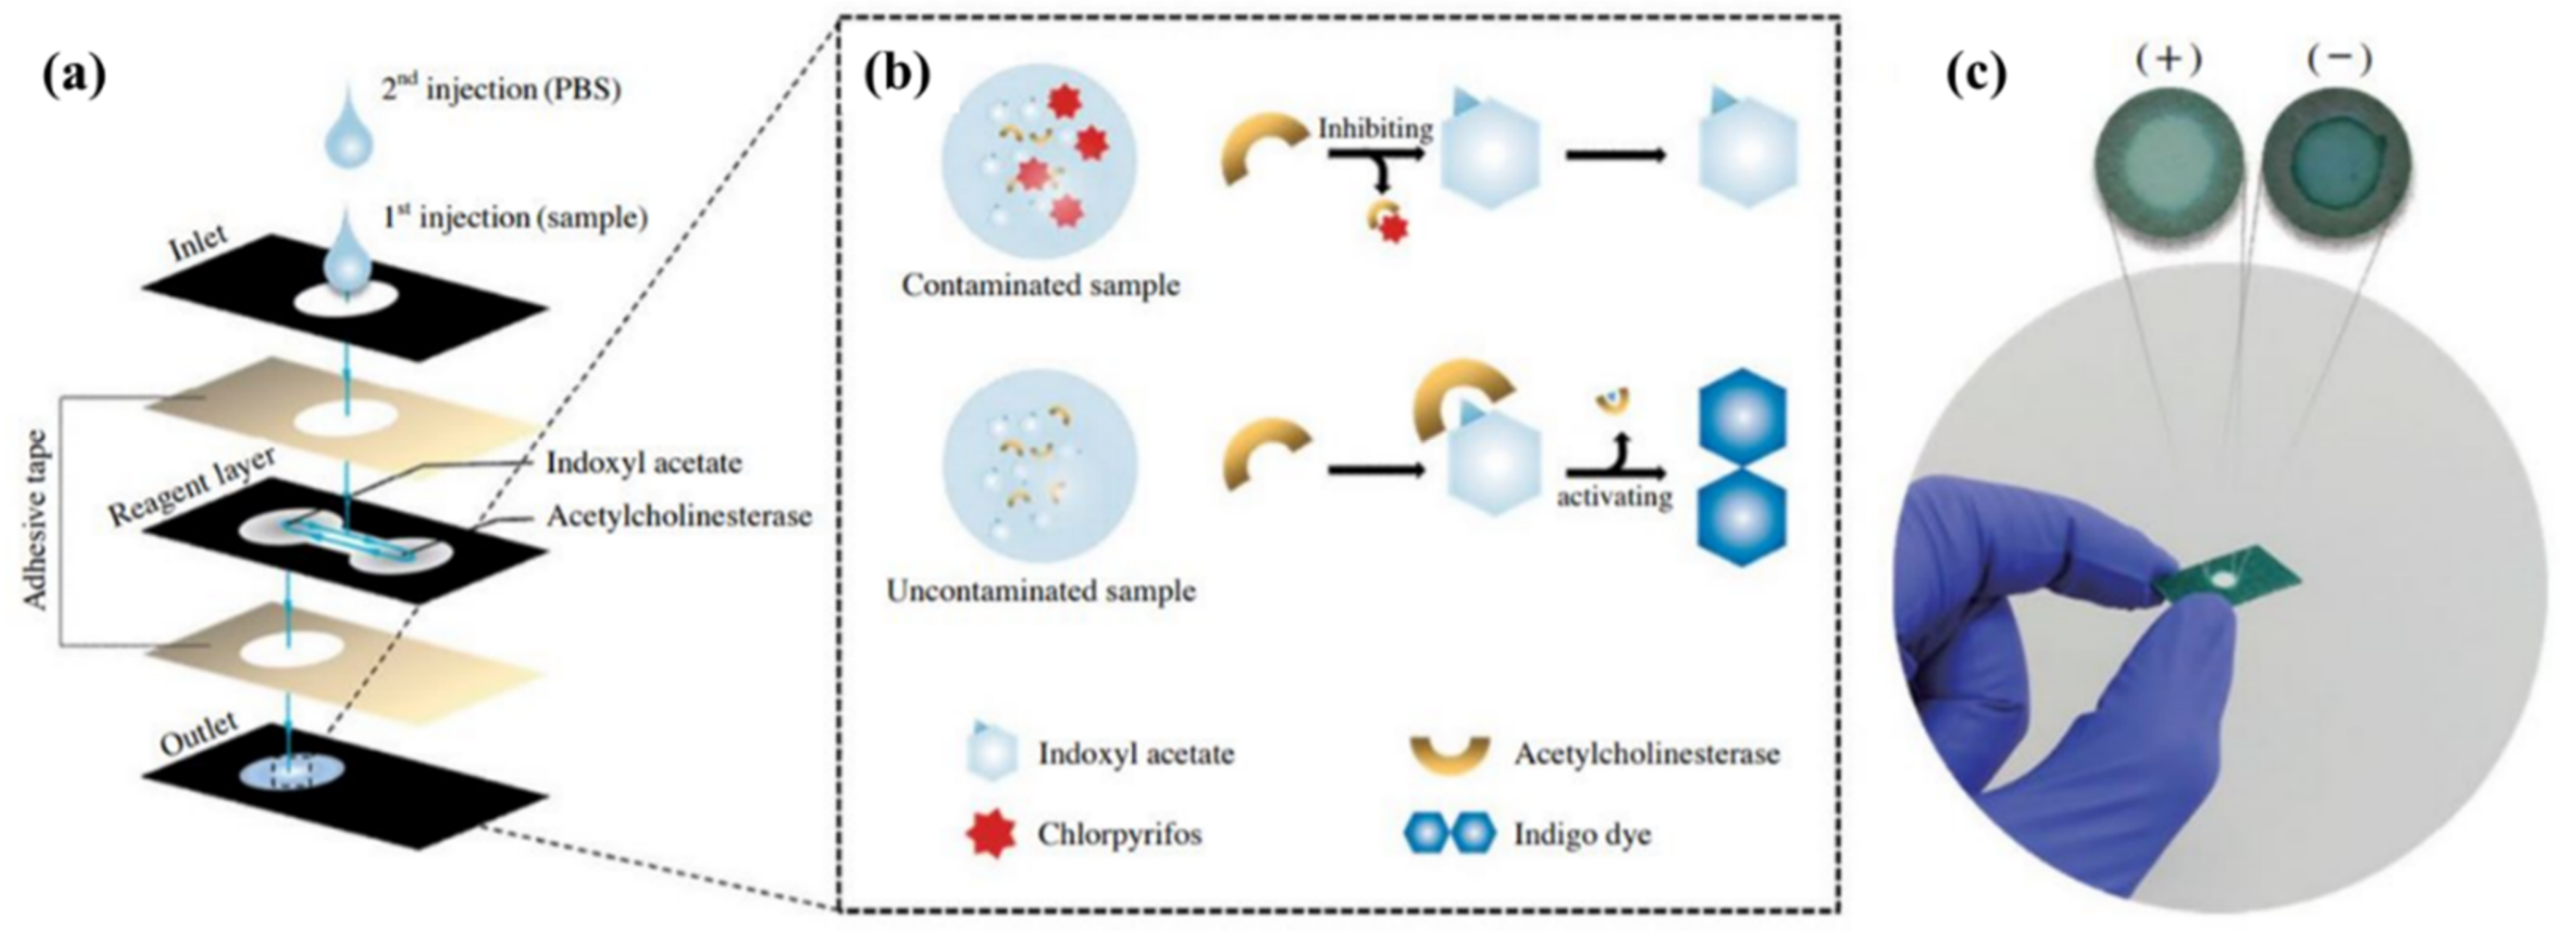
| Chlorpyrifos | 3D paper | Enzyme | Colorimetric | Indoxyl acetate | 0–25.0 ppm | 8.60 ppm | [262] | |
| Trichlorfon | Microfluidic assay | Free | Colorimetric | ammonium molybdate method | Pak choi, broccoli, swamp, cabbage | 1.65 μg·mL−1 | [279] | |
| Diazinon | Micro spot | Enzyme | Fluorimetric | TPE | Human serum | 0.3–5.0 ng·mL−1 | 0.23 ng·mL−1 | [268] |
| Paraoxon Chlorpyrifos | Micro spot | Enzyme | Colorimetric | Nanoceria | Human serum | 0–100.0 ng·mL−1 0–60 ng·mL−1 | 18.0 ng·mL−1 5.3 ng·mL−1 | [267] |
| Phorate, avermectin, imidacloprid | 3D paper | Enzyme | Colorimetric | Indophenol acetate | Lettuce and rice | [280] | ||
| Chlorpyrifos parathion methyl-parathion malathion fenitrothion carbaryl | Origami | Enzyme | Colorimetric | indophenol acetate | Cabbage extracts | 5.0–100.0 μg·mL−1 1.0–8.0 μg·mL−1 0.5–6.0 μg·mL−1 0.5–6.0 μg·mL−1 0.5–6.0 μg·mL−1 1.0–8.0 μg·mL−1 | 3.3 μg·mL−1 0.52 μg·mL−1 0.46 μg·mL−1 0.45 μg·mL−1 0.47 μg·mL−1 0.51 μg·mL−1 | [263] |
| Dimethoate dichlorvos, demeton | Micro spot | Free | Fluorimetric | CdTe QDs/ZnCdSe QDs/Nano-ZnTPyP | Apple and cabbage | [269] | ||
| paraoxon 2.4-DCPA atrazine | Origami | Enzyme | Electrochemical | GP/CB/PBNPs GP/CB GP/CB | River water | 2–20 ppb 100–600 ppb 10–100 ppb | 2 ppb 50 ppb 10 ppb | [272] |
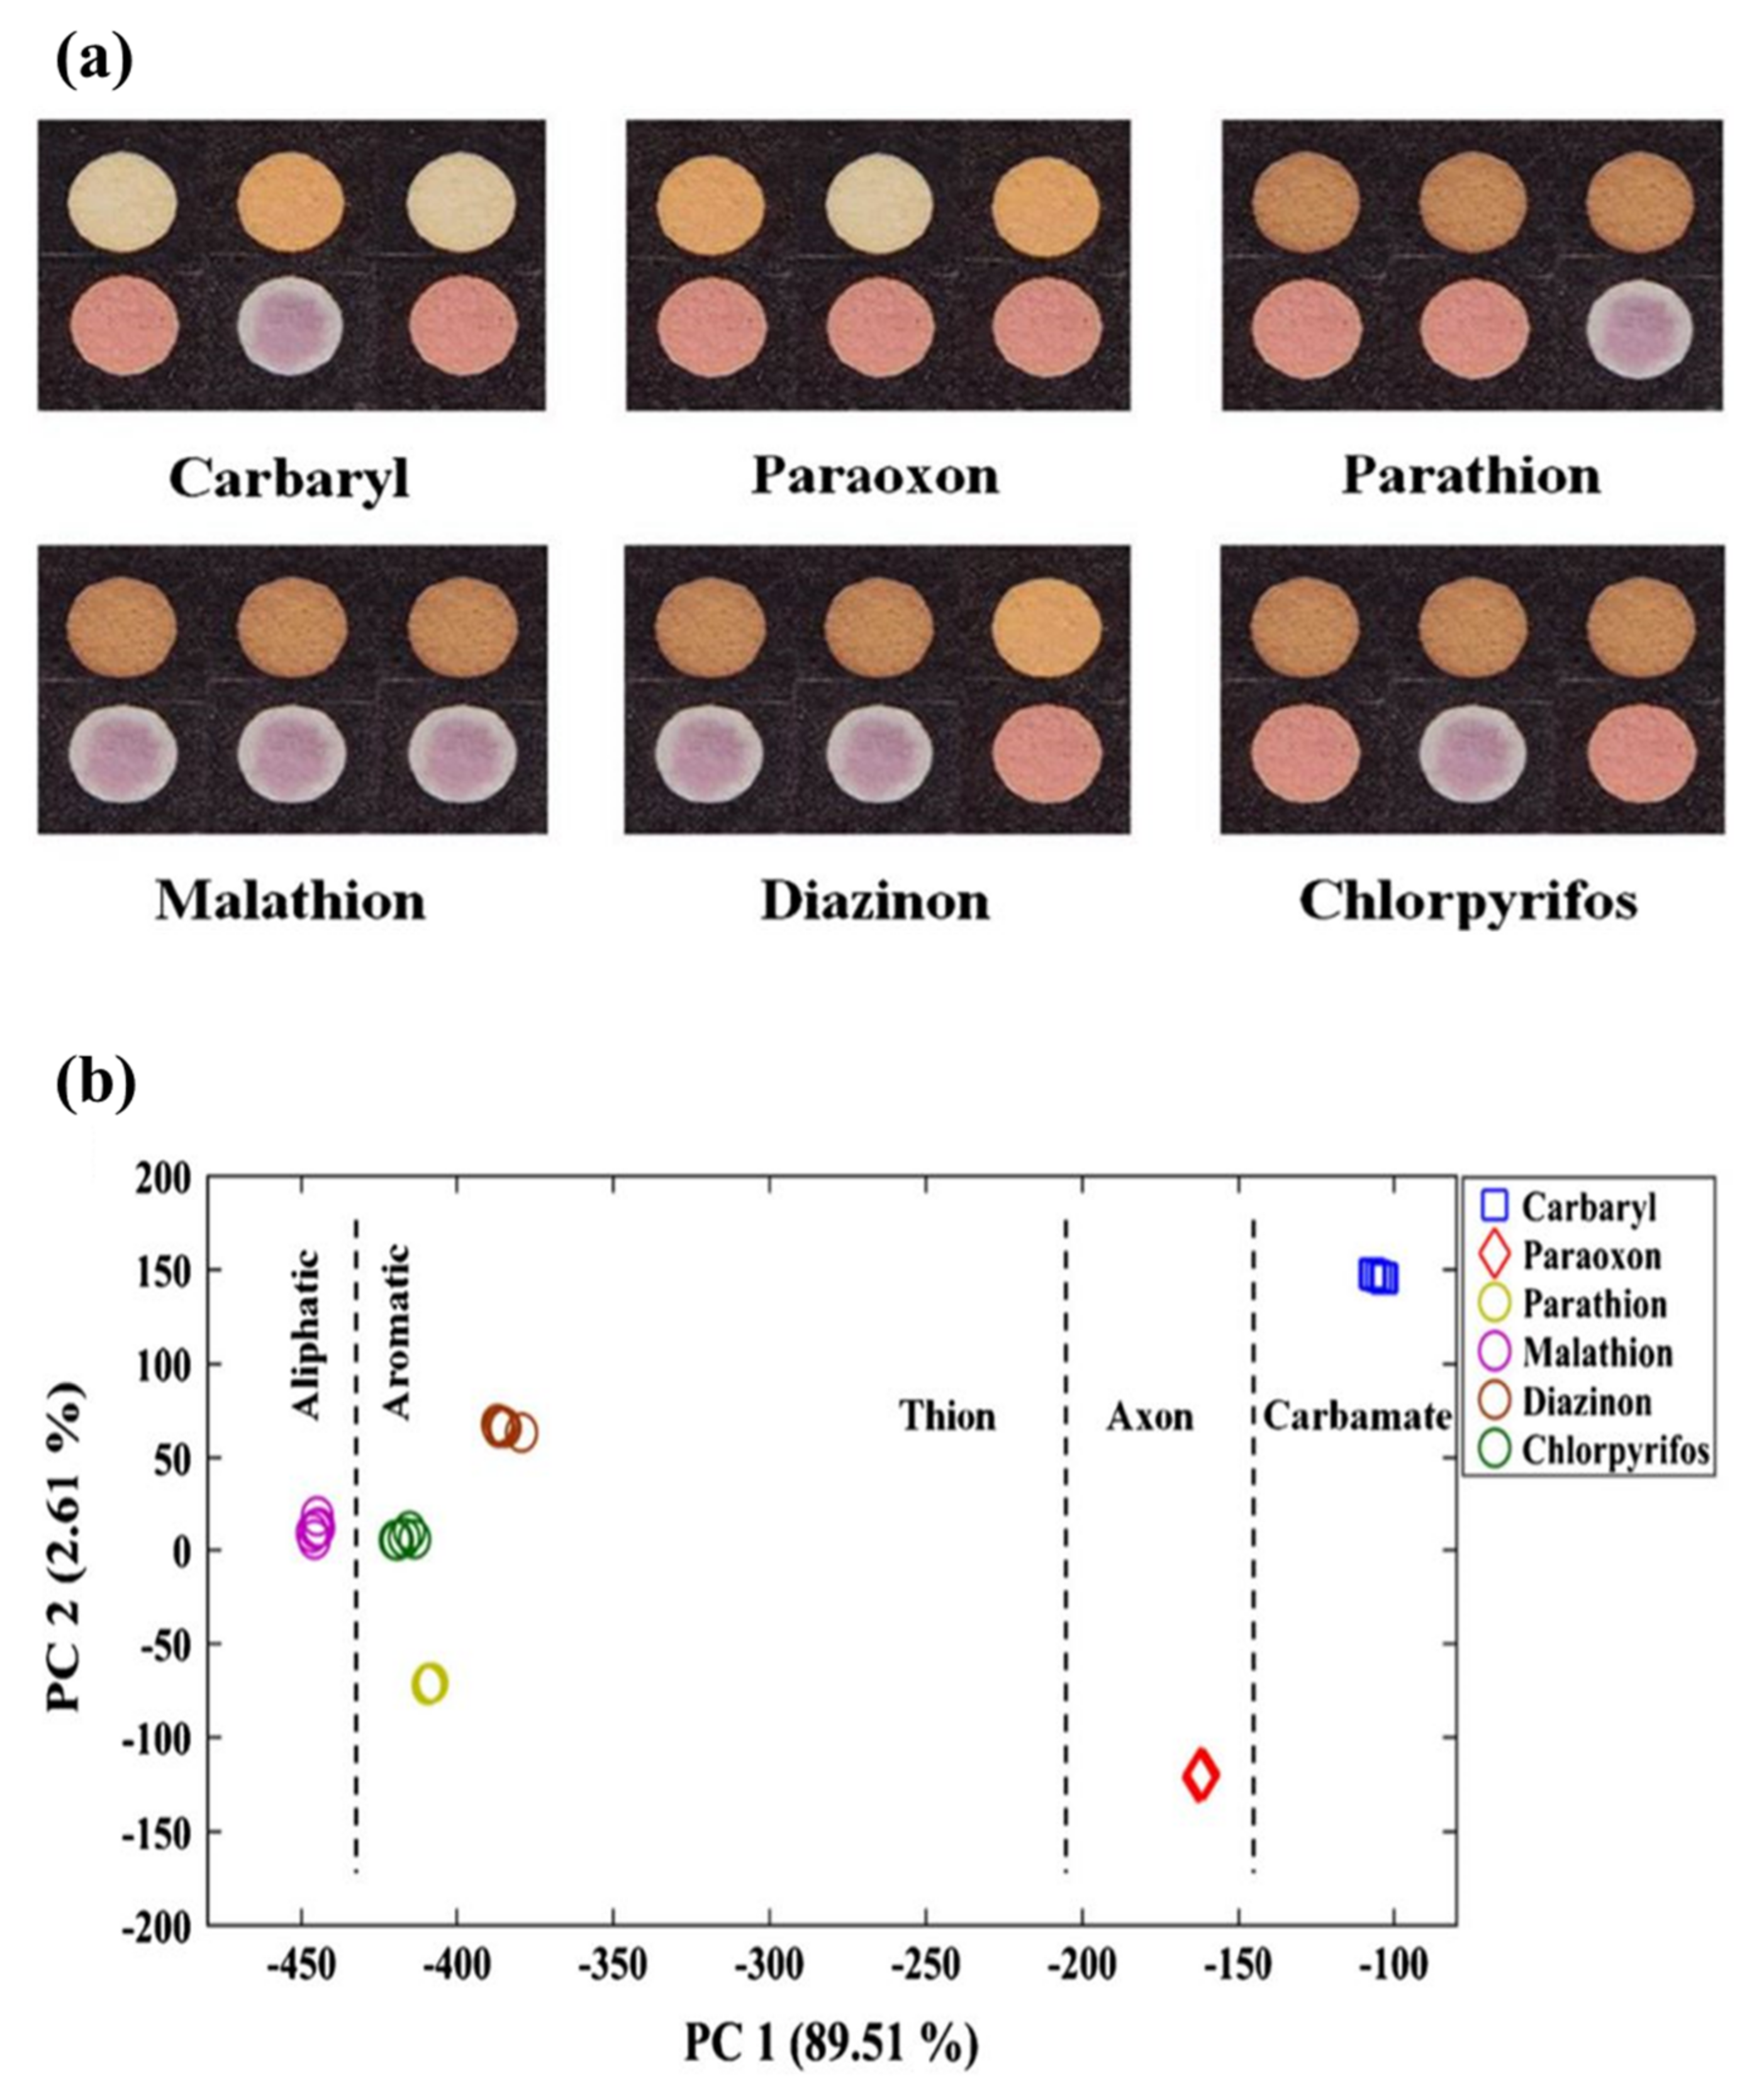
| Carbaryl, paraoxon, parathion, malathion, diazinon, chlorpyrifos | Origami | Array-based e-tongue | Colorimetric | AuNPs and AgNPs | Tap water, apple juice, rice | 35.0–2500.0 ng·mL−1 25.0–5000.0 ng·mL−1 35.0–5000.0 ng·mL−1 20.0–2500.0 ng·mL−1 50.0–7500.0 ng·mL−1 40.0–2500.0 ng·mL−1 | 29.0 ng·mL−1 22.0 ng·mL−1 32.0 ng·mL−1 17.0 ng·mL−1 45.0 ng·mL−1 36.0 ng·mL−1 | [276] |
| Parathion, malathion, diazinon, chlorpyrifos | Origami | Array-based e-nose | Colorimetric | AuNPs and AgNPs | Ambient air | 70–1000 ng·mL−1 110–810 ng·mL−1 90–730 ng·mL−1 130–730 ng·mL−1 | 58.0 ng·mL−1 103.0 ng·mL−1 81.0 ng·mL−1 117.0 ng·mL−1 | [277] |
10.3. Pathogen Bacteria Detection
| Type of Bacteria | Device Structure | Bioreceptor | Detection Method | Sensing Element | Media | Detection Limit | Time | Ref. |
|---|---|---|---|---|---|---|---|---|
| E. coli O157:H7 | paper electrode | Antibody | Impedimetric | rGOPE/AuNPs | Ground beef and cucumber | 1.5 × 10⁻² Cfu mL−1 | [291] | |
| E. coli XL1 | Inkjet-Printed test strip | Enzyme | Colorimetric | CPRG | Drinking water | 102 bacteria mL−1 | 5 min | [286] |
| E. coli | Micro spot | Aptamer | Fluorimetric | Fluorogenic DNAzyme probe | Milk, apple juice, and drinking water | 100 cells mL−1 | [308] | |
| E. coli K12 | Origami | Aptamer | Colorimetric | TMB, Hemin, H2O2 | Juice and milk | 103 Cfu mL−1 | 35 min | [309] |
| E. coli O157:H7 | Printed electrode | Antibody | Electrochemical | SPCE-PANI-AuNPs-Ab1 and PANI-rGO-NR-Au@Pt-Ab2 | Milk and pork | 2.84 × 10³ Cfu mL−1 | 60 min | [292] |
| S. aureus | Paper electrode | Aptamer | Potentiometric | GO or rGO | 1 Cfu mL−1 | 1–2 min | [294] | |
| S. aureus | Test strip | Enzyme | Colorimetric | Magnetic nanobeads/Peptide | Ground beef, turkey sausage, lettuce, milk, and dust samples | 7 Cfu mL−1 (Pure broth culture) 40 Cfu mL−1 (food products) 100 Cfu mL−1 (environmental samples) | 1 min | [288] |
| S. aureus | Paper electrode | Antibody | Electrochemical | SWCNT | Milk | 13 Cfu mL−1 | 30 min | [295] |
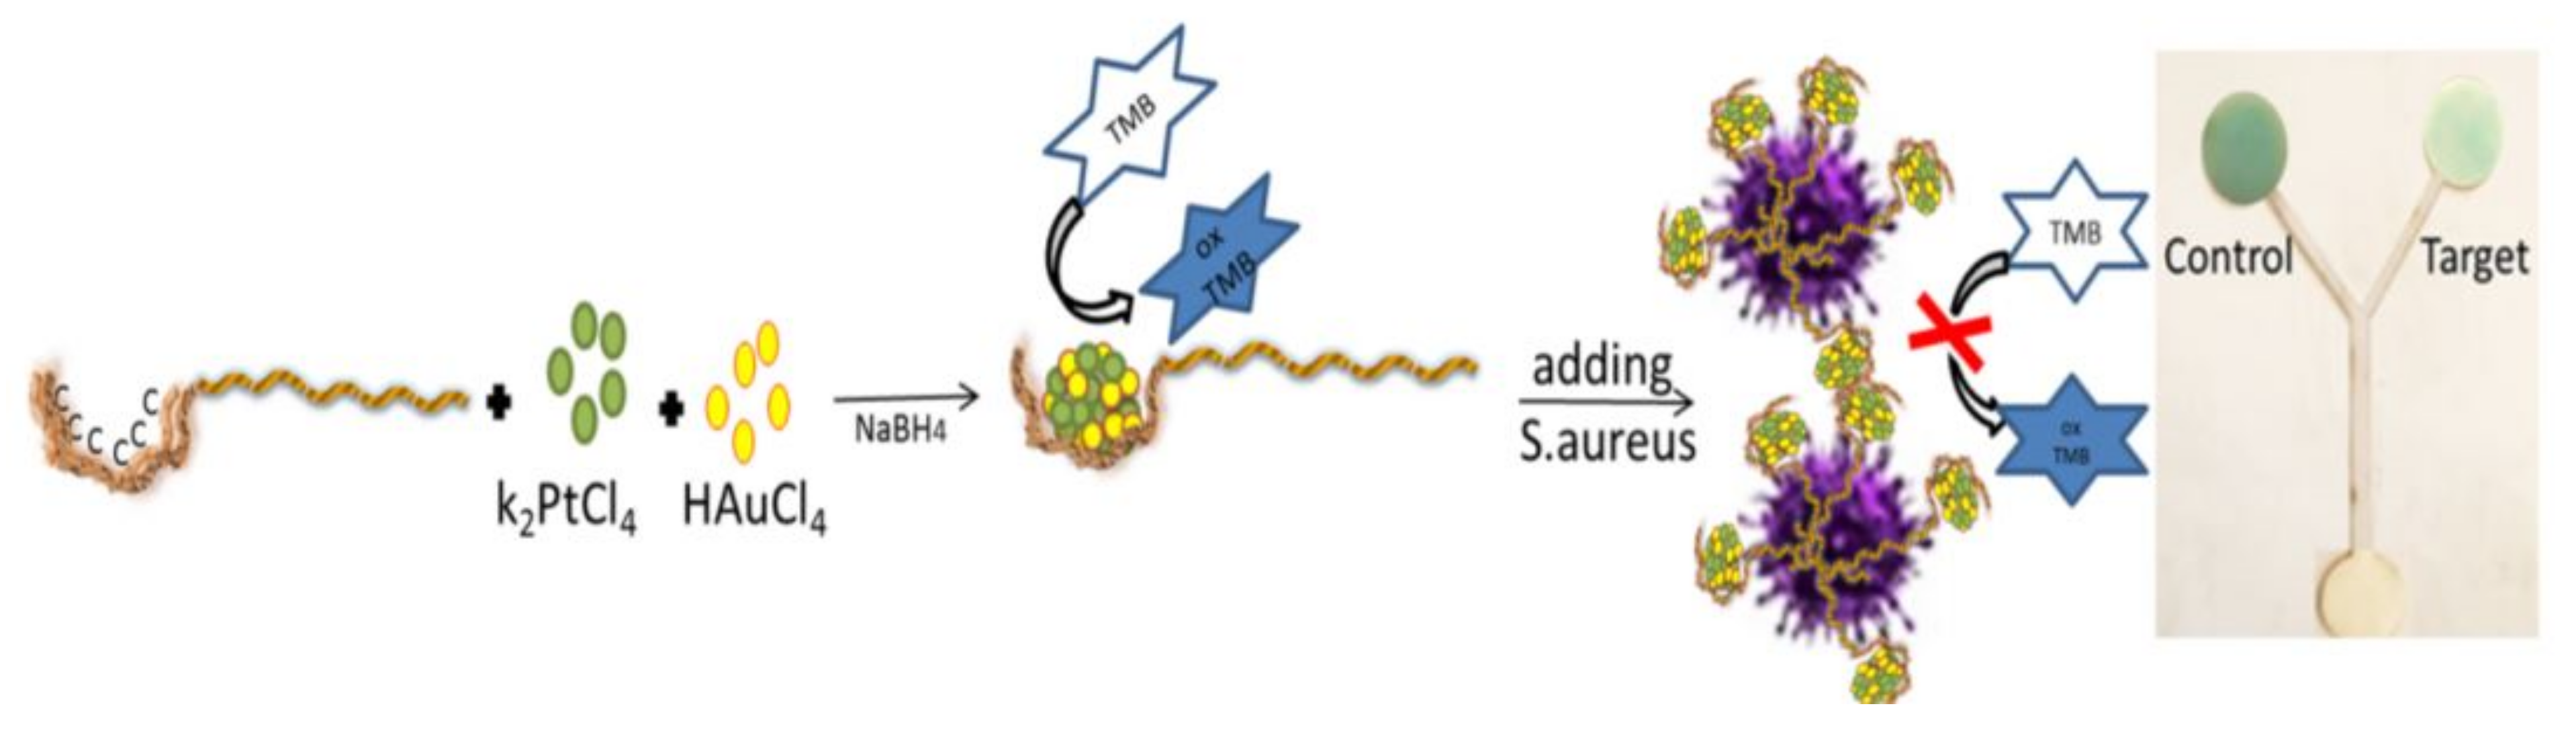
| S. aureus | Microfluidic assay | Nanozym | Colorimetric | DNA-Au/Pt BMNCs, H2O2, and TMB | Milk, orange juice, and human serum | 80 Cfu mL−1 | 60 min | [290] |
| E. faecalis | Paper strip | Free | Colorimetric | Resazurin | 10 min | [310] | ||
| Salmonella typh. | Paper strip | Antibody | Potentiometric | PAMAM(NH2)64/GA/Ab | Apple juice | 5 cells mL−1 | <1 h | [311] |
| Each type | Printed electrode | Protein | Impedimetric | Con A | Water | 1.9 × 10³ Cfu mL−1 | [312] | |
| Cronobacter spp. | Micro spot | Enzyme | Colorimetric | XαGlc | 10 Cfu cm−2 | 10 h | [289] | |
| E. coli O157:H7, Salmonella, and Listeria | Micro spot | Enzyme | Colorimetric | CPRG, Magenta caprylate, and X-InP | Bologna | 10 Cfu cm−2 | 8 h | [287] |
| E. coli, S. mutans, and B. subtilis | Paper electrode | Polymer | Thermoelectrochemical | Gr-PNIPAm-Au | Autoclave, tap and lake waters, and milk | 5 cells mL−1 | less than 10 min | [293] |
| S. aureus, Listeria, E. coli, proteus, klebsiella, E. aerogenes, P. aeruginosa, E. faecalis, S. agalactiae, MRSA | Micro spot | Array-based E.nose | Colorimetric | AuNPs and AgNPs | Tap and mineral water, and human urine | 1.0 × 10² Cfu mL−1 | 50 min (water) 30 min (urine) | [282] |
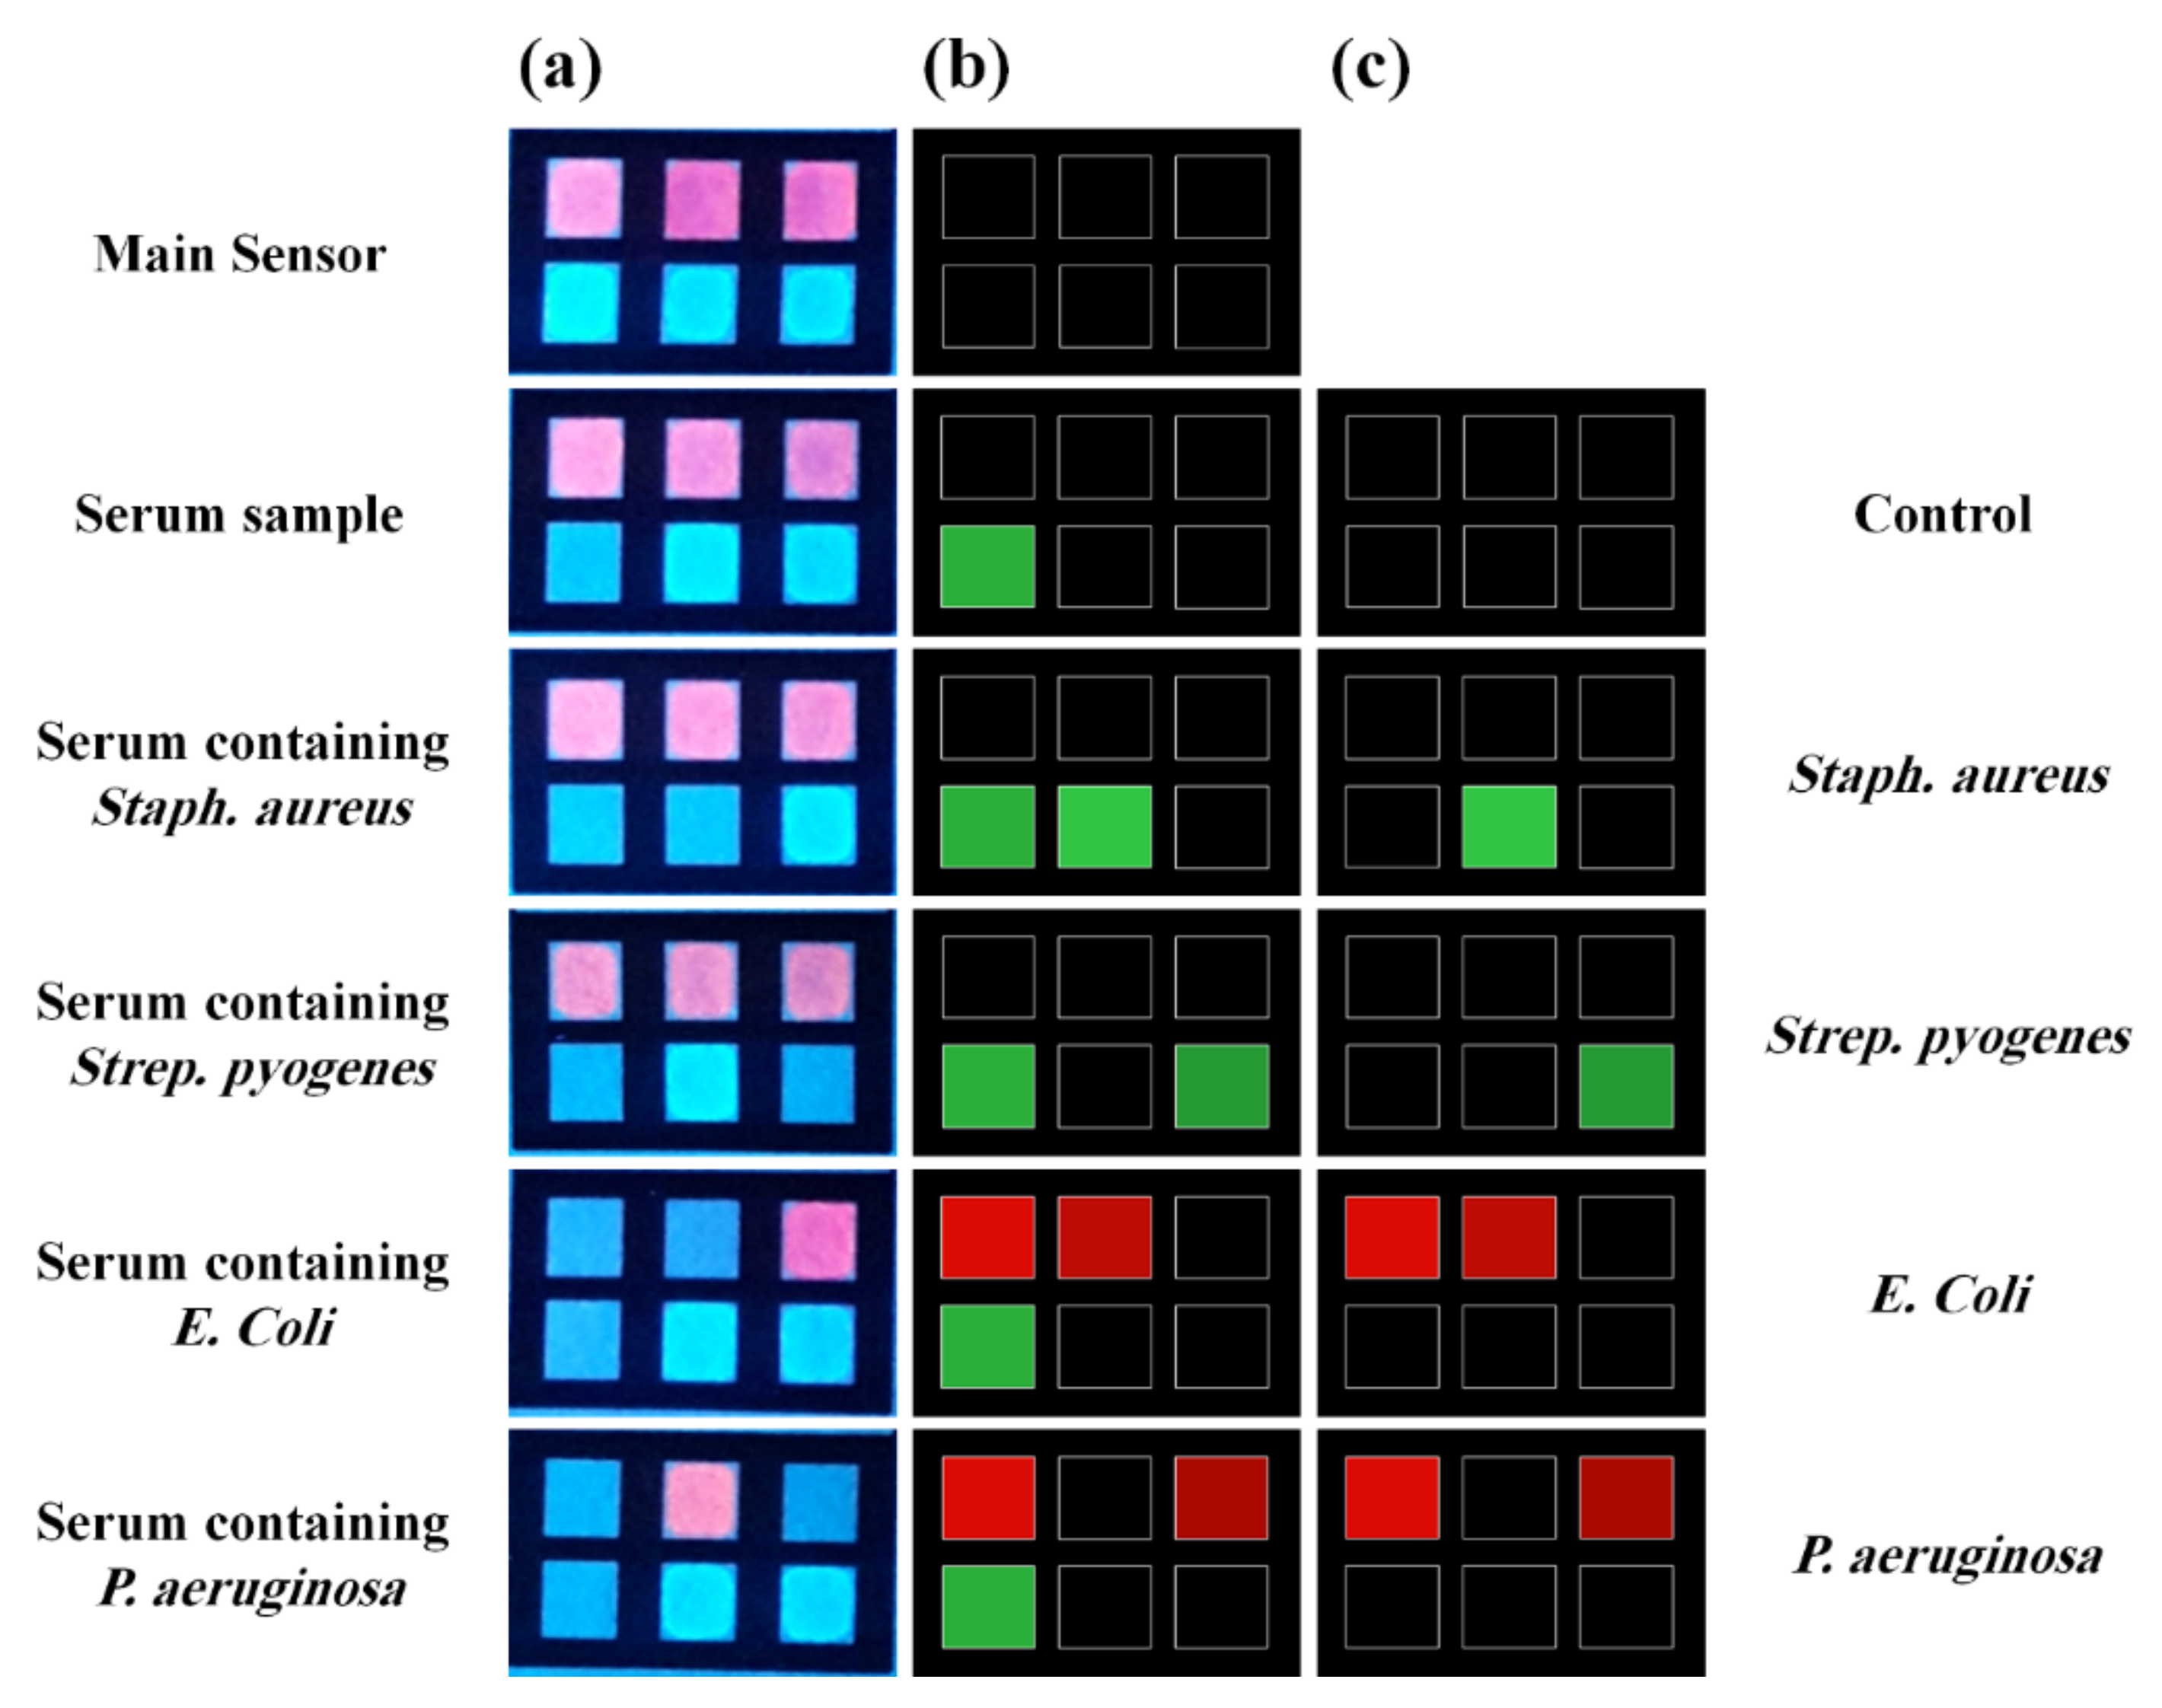
| S. aureus S. pyogenes E. coli P. aeruginosa | Microfluidic assay | Array-based E.tongue | Fluorimetric | Protein based Au and CuNCs | Serum (for detecting sepsis) | 43.0 Cfu mL−1 63.5 Cfu mL−1 26.0 Cfu mL−1 47.0 Cfu mL−1 | 15s | [307] |
10.4. Heavy Metal Ions Detection
| Type of Metal Ions | Device Structure | Detection Method | Sensing Element | Media | Linear Range | Detection Limit | Ref. |
|---|---|---|---|---|---|---|---|
| Hg(II) | Microfluidic assay | Colorimetric | KI, KIO3, Starch | Soil | 50–350 mg L−1 | 20 mg L−1 | [320] |
| Hg(II) | Distance-based sensor | Fluorimetric | NCD | Drinking, pond, and tap waters | 0.5–25 mg L−1 | 0.5 mg L−1 | [316] |
| Hg(II) | Distance-based sensor | Colorimetric | Dithizone | whitening cream | 1–30 µg mL−1 | 0.93 µg mL−1 | [319] |
| Hg(II) | Micro spot | Colorimetric | PtNPs-TMB | Pond and tap waters | 0.025–0.5 μM | 0.01 μM | [318] |
| Hg(II) | Micro spot | Colorimetric | ssDNA-AuNPs | Water | 0–2 µM | 50 nM | [317] |
| Cu(II) | Microfluidic assay | Colorimetric | Hcy-DTT-AgNP | Water | 7.8–62.8 μM | 7.8 nM | [322] |
| Cu(II) | Microfluidic assay | Fluorometric | CdTe QDs-Cu-IIP | Sea and lake waters | 0.032‒3.2 mg L‒1 | 0.012 mg L‒1 | [342] |
| Cu(II) | Distance-based sensor | Fluorometric | BSA-AuNCs | 5–500 µM | 5 µM | [324] | |
| Cu(II) | Distance-based sensor | Colorimetric | Dithiooxamide | Drinking water | 20–500,000 ppb | 20 ppb | [321] |
| Cu(II) | Paper electrode | SWSV | Lake waters | 5–1000 µg L−1 | 2 µg·L−1 | [323] | |
| Cu(II) | Micro paper | Fluorometric | CdTe QDs/GCNNs | Tea soup, orange juice, and red wine | 0.01~5.0 μg·mL−1 | 0.47 ng·mL−1 | [343] |
| Cu(II) | Origami | Colorimetric | Chrome azurol S, Pyrocatechol violet | Rain and Tab waters | 5.0–1400.0 mg L−1 5.0–200.0 mg L−1 | 1.7 mg L−1 1.9 mg L−1 | [62] |
| Cr(III) | Paper strip | Colorimetric | Citrate-AuNPs | 10−3–10−6 M | 1.06×10⁻⁷ M | [333] | |
| Cd(II) | Lateral flow | Colorimetric | Antibody/modified AuNPs | Drinking and tap waters | 0.4–10 ppb | 0.1 ppb | [327] |
| Cd(II) | Origami | Colorimetric | Ion imprinted polymer | Water | 1–100 ng mL–1 | 0.4 ng mL–1 | [328] |
| Pb(II) | Paper strip | Fluorometric | CDs (potato-dextrose agar) | Human cells | Up to 1 μM | 106 pM | [330] |
| Pb(II) | Paper strip | Colorimetric | Mixture of blue CDs and red CDs | Tap water and lake water | 15−80 nM | 2.89 nM | [331] |
| Hg(II) Cu(II) | Origami | Fluorometric | CdTe QDs-IIP | Lake and sea waters | 0.26–34.0 µgL−1 0.11–58.0 µgL−1 | 0.056 µg·L−1 0.035 µg·L−1 | [340] |
| Hg(II) Pb(II) | Origami | ECL | Si@CNCs and Ru@AuNPs | Lake water and human serum | 5.0 × 10⁻¹⁰ to 1.0 × 10⁻⁶ M 3.0 × 10⁻¹¹–3.0 × 10⁻⁶ M | 0.2 nM 10 pM | [344] |
| Cd(II) Pb(II) | Printed electrode | SWSV | Salty soda and dirty ground waters | 10–100 ppb 10–100 ppb | 2.3 ppb 2.0 ppb | [345] | |
| Ni(II), Cr(VI), Hg(II) | Microfluidic assay | Colorimetric | DMG DPC MT | Lake water | 0.24 ppm 0.18 ppm 0.19 ppm | [336] | |
| Fe(II) Ni(II) Cu(II) | Barrier-free patterned paper | Colorimetric | BP DMG DDC | Pond water | 0.5–20 ppm 0.4–20 ppm 0.5–20 ppm | 0.25 ppm 0.4 ppm 0.5 ppm | [337] |
| Fe(II) Cu(II) Ni(II) | Micro spot | Colorimetric | BC Phen DMG | Tap and lake water and papermaking wastewater | 0.5–500 mg L−1 0.5–500 mg L−1 2–500 mg L−1 | 0.5 mg L−1 0.5 mg L−1 2 mg L−1 | [338] |
| Zn(II) Cr(II) Cu(II) Pb(II) Mn(II) | Filter paper | Colorimetric | ZI, cyanide and cyclohexanone DPC CPZ ALS PAN and cyanide | Wastewater | 2.00–6.00 mg L−1 0.10–0.50 mg L−1 0.30–8.00 mg L−1 0.08–0.60 mg L−1 0.20–1.00 mg L−1 | 0.63 mg L−1 0.07 mg L−1 0.17 mg L−1 0.03 mg L−1 0.11 mg L−1 | [339] |
| Hg(II) Ag(I) Cu(II) Cd(II) Pb(II), Cr(VI) Ni(II) | Microfluidic assay | Colorimetric | CPRG | Distilled, tap, lake, and fall water | 0.001 ppm 0.002 ppm 0.020 ppm 0.020 ppm 0.140 ppm 0.150 ppm 0.230 ppm | [341] | |
| Hg(II), Cd(II), Co(II), Cu(II), Ni(II), Zn(II), and Ag(I) | Array-based e-tongue | Fluorometric | DPA derivatives | Wastewater | 10−7 M | [334] | |
| Hg(II), Cd(II), Co(II), Cu(II), Ni(II), Zn(II), and Pb(II) | Array-based e-tongue | Colorimetric | Pyridylazo compounds | Sewage water | 50 µM | [335] |
11. Conclusions
Author Contributions
Funding
Institutional Review Board Statement
Informed Consent Statement
Data Availability Statement
Acknowledgments
Conflicts of Interest
References
- Vallero, D.A. Fundamentals of environmental chemistry. In Environmental Contaminants: Assessment and Control; Elsevier: Amsterdam, The Netherlands, 2010; pp. 289–332. [Google Scholar]
- Kudr, J.; Zitka, O.; Klimanek, M.; Vrba, R.; Adam, V. Microfluidic electrochemical devices for pollution analysis–A review. Sens. Actuators B Chem. 2017, 246, 578–590. [Google Scholar] [CrossRef]
- WHO. 7 Million Premature Deaths Annually Linked to Air Pollution; World Health Organization: Geneva, Switzerland, 2019. [Google Scholar]
- Landrigan, P.J.; Fuller, R. Global health and environmental pollution. Int. J. Public Health 2015, 60, 761–762. [Google Scholar] [CrossRef] [PubMed]
- Lead poisoning and health. Saudi Med. J. 2013, 34, 1090–1091.
- WHO. Arsenic; World Health Organization: Geneva, Switzerland, 2016. [Google Scholar]
- Sidhu, G.K.; Singh, S.; Kumar, V.; Dhanjal, D.S.; Datta, S.; Singh, J. Toxicity, monitoring and biodegradation of organophosphate pesticides: A review. Crit. Rev. Environ. Sci. Technol. 2019, 49, 1135–1187. [Google Scholar] [CrossRef]
- Bordbar, M.M.; Hemmateenejad, B.; Tashkhourian, J.; Nami-Ana, S.F. An optoelectronic tongue based on an array of gold and silver nanoparticles for analysis of natural, synthetic and biological antioxidants. Microchim. Acta 2018, 185, 493. [Google Scholar] [CrossRef]
- George, M. The origins and the future of microfluidics. Nature 2006, 442, 368. [Google Scholar]
- Ren, K.; Zhou, J.; Wu, H. Materials for microfluidic chip fabrication. Acc. Chem. Res. 2013, 46, 2396–2406. [Google Scholar] [CrossRef]
- Olanrewaju, A.; Beaugrand, M.; Yafia, M.; Juncker, D. Capillary microfluidics in microchannels: From microfluidic networks to capillaric circuits. Lab Chip 2018, 18, 2323–2347. [Google Scholar] [CrossRef] [PubMed]
- Hansen, S.; Wahed, A.A. El Point-of-care or point-of-need diagnostic tests: Time to change outbreak investigation and pathogen detection. Trop. Med. Infect. Dis. 2020, 5, 151. [Google Scholar] [CrossRef] [PubMed]
- Niculescu, A.G.; Chircov, C.; Bîrcă, A.C.; Grumezescu, A.M. Fabrication and applications of microfluidic devices: A review. Int. J. Mol. Sci. 2021, 22, 2011. [Google Scholar] [CrossRef]
- Vashist, S.K. Point-of-care diagnostics: Recent advances and trends. Biosensors 2017, 7, 62. [Google Scholar] [CrossRef] [PubMed]
- Kumar, S.; Nehra, M.; Khurana, S.; Dilbaghi, N.; Kumar, V.; Kaushik, A.; Kim, K.H. Aspects of point-of-care diagnostics for personalized health wellness. Int. J. Nanomed. 2021, 16, 383–402. [Google Scholar] [CrossRef]
- Mohankumar, P.; Ajayan, J.; Mohanraj, T.; Yasodharan, R. Recent developments in biosensors for healthcare and biomedical applications: A review. Meas. J. Int. Meas. Confed. 2021, 167, 108293. [Google Scholar] [CrossRef]
- Chen, C.; Wang, J. Optical biosensors: An exhaustive and comprehensive review. Analyst 2020, 145, 1605–1628. [Google Scholar] [CrossRef]
- Chen, S.; Shamsi, M.H. Biosensors-on-chip: A topical review. J. Micromech. Microeng. 2017, 27, 083001. [Google Scholar] [CrossRef]
- Azmi, A.; Azman, A.A.; Ibrahim, S.; Yunus, M.A.M. Techniques in advancing the capabilities of various nitrate detection methods: A review. Int. J. Smart Sens. Intell. Syst. 2017, 10, 223–261. [Google Scholar] [CrossRef]
- Nery, E.W.; Kubota, L.T. Sensing approaches on paper-based devices: A review. Anal. Bioanal. Chem. 2013, 405, 7573–7595. [Google Scholar] [CrossRef] [PubMed]
- Nguyen, T.; Chidambara, V.A.; Andreasen, S.Z.; Golabi, M.; Huynh, V.N.; Linh, Q.T.; Bang, D.D.; Wolff, A. Point-of-care devices for pathogen detections: The three most important factors to realise towards commercialization. TrAC Trends Anal. Chem. 2020, 131, 116004. [Google Scholar] [CrossRef]
- Cate, D.M.; Adkins, J.A.; Mettakoonpitak, J.; Henry, C.S. Recent developments in paper-based microfluidic devices. Anal. Chem. 2015, 87, 19–41. [Google Scholar] [CrossRef]
- Gong, M.M.; Sinton, D. Turning the Page: Advancing Paper-Based Microfluidics for Broad Diagnostic Application. Chem. Rev. 2017, 117, 8447–8480. [Google Scholar] [CrossRef]
- Bracher, P.J.; Gupta, M.; Whitesides, G.M. Shaped films of ionotropic hydrogels fabricated using templates of patterned paper. Adv. Mater. 2009, 21, 445–450. [Google Scholar] [CrossRef]
- Tseng, S.C.; Yu, C.C.; Wan, D.; Chen, H.L.; Wang, L.A.; Wu, M.C.; Su, W.F.; Han, H.C.; Chen, L.C. Eco-friendly plasmonic sensors: Using the photothermal effect to prepare metal nanoparticle-containing test papers for highly sensitive colorimetric detection. Anal. Chem. 2012, 84, 5140–5145. [Google Scholar] [CrossRef]
- Ngo, Y.H.; Li, D.; Simon, G.P.; Garnier, G. Gold nanoparticle-paper as a three-dimensional surface enhanced raman scattering substrate. Langmuir 2012, 28, 8782–8790. [Google Scholar] [CrossRef]
- Jarujamrus, P.; Tian, J.; Li, X.; Siripinyanond, A.; Shiowatana, J.; Shen, W. Mechanisms of red blood cells agglutination in antibody-treated paper. Analyst 2012, 137, 2205–2210. [Google Scholar] [CrossRef] [PubMed]
- Bordbar, M.M.; Tashkhourian, J.; Hemmateenejad, B. Structural Elucidation and Ultrasensitive Analyses of Volatile Organic Compounds by Paper-Based Nano-Optoelectronic Noses. ACS Sens. 2019, 4, 1442–1451. [Google Scholar] [CrossRef]
- Singh, A.T.; Lantigua, D.; Meka, A.; Taing, S.; Pandher, M.; Camci-Unal, G. Paper-based sensors: Emerging themes and applications. Sensors 2018, 18, 2838. [Google Scholar] [CrossRef] [PubMed]
- Kuswandi, B.; Ensafi, A.A. Perspective—Paper-Based Biosensors: Trending Topic in Clinical Diagnostics Developments and Commercialization. J. Electrochem. Soc. 2020, 167, 037509. [Google Scholar] [CrossRef]
- Ratajczak, K.; Stobiecka, M. High-performance modified cellulose paper-based biosensors for medical diagnostics and early cancer screening: A concise review. Carbohydr. Polym. 2020, 229, 115463. [Google Scholar] [CrossRef] [PubMed]
- Kouisni, L.; Rochefort, D. Confocal microscopy study of polymer microcapsules for enzyme immobilisation in paper substrates. J. Appl. Polym. Sci. 2009, 111, 1–10. [Google Scholar] [CrossRef]
- Akyazi, T.; Basabe-Desmonts, L.; Benito-Lopez, F. Review on microfluidic paper-based analytical devices towards commercialisation. Anal. Chim. Acta 2018, 1001, 1–17. [Google Scholar] [CrossRef] [PubMed]
- Fu, L.M.; Wang, Y.N. Detection methods and applications of microfluidic paper-based analytical devices. TrAC Trends Anal. Chem. 2018, 107, 196–211. [Google Scholar] [CrossRef]
- Tang, R.H.; Yang, H.; Choi, J.R.; Gong, Y.; Feng, S.S.; Pingguan-Murphy, B.; Huang, Q.S.; Shi, J.L.; Mei, Q.B.; Xu, F. Advances in paper-based sample pretreatment for point-of-care testing. Crit. Rev. Biotechnol. 2017, 37, 411–428. [Google Scholar] [CrossRef] [PubMed]
- Bracher, P.J.; Gupta, M.; Whitesides, G.M. Patterned paper as a template for the delivery of reactants in the fabrication of planar materials. Soft Matter 2010, 6, 4303–4309. [Google Scholar] [CrossRef]
- Tang, R.H.; Liu, L.N.; Zhang, S.F.; He, X.C.; Li, X.J.; Xu, F.; Ni, Y.H.; Li, F. A review on advances in methods for modification of paper supports for use in point-of-care testing. Microchim. Acta 2019, 186, 521. [Google Scholar] [CrossRef] [PubMed]
- Bongiovanni, R.; Zeno, E.; Pollicino, A.; Serafini, P.M.; Tonelli, C. UV light-induced grafting of fluorinated monomer onto cellulose sheets. Cellulose 2011, 18, 117–126. [Google Scholar] [CrossRef]
- Princi, E.; Vicini, S. Graft polymerisation of ethyl acrylate/methyl methacrylate copolymers: A tool for the consolidation of paper-based materials. Eur. Polym. J. 2008, 44, 2392–2403. [Google Scholar] [CrossRef]
- Liana, D.D.; Raguse, B.; Justin Gooding, J.; Chow, E. Recent advances in paper-based sensors. Sensors 2012, 12, 11505–11526. [Google Scholar] [CrossRef]
- Kühl, S.; Krummenauer, F.; Dagassan-Berndt, D.; Lambrecht, T.J.; d’Hoedt, B.; Schulze, R.K.W. Ink-jet printout of radiographs on transparent film and glossy paper versus monitor display: An ROC analysis. Clin. Oral Investig. 2011, 15, 351–356. [Google Scholar] [CrossRef][Green Version]
- Lin, Y.; Gritsenko, D.; Liu, Q.; Lu, X.; Xu, J. Recent Advancements in Functionalized Paper-Based Electronics. ACS Appl. Mater. Interfaces 2016, 8, 20501–20515. [Google Scholar] [CrossRef] [PubMed]
- Kamel, S.; Khattab, T.A. Recent advances in cellulose-based biosensors for medical diagnosis. Biosensors 2020, 10, 67. [Google Scholar] [CrossRef]
- Li, Z.; Askim, J.R.; Suslick, K.S. The Optoelectronic Nose: Colorimetric and Fluorometric Sensor Arrays. Chem. Rev. 2019, 119, 231–292. [Google Scholar] [CrossRef]
- Li, Z.; Suslick, K.S. The Optoelectronic Nose. Acc. Chem. Res. 2021, 54, 950–960. [Google Scholar] [CrossRef]
- Sola Martínez, R.A.; Pastor Hernández, J.M.; Yanes Torrado, Ó.; Cánovas Díaz, M.; de Diego Puente, T.; Vinaixa Crevillent, M. Exhaled volatile organic compounds analysis in clinical pediatrics: A systematic review. Pediatr. Res. 2021, 89, 1352–1363. [Google Scholar] [CrossRef] [PubMed]
- Oakley-Girvan, I.; Davis, S.W. Breath based volatile organic compounds in the detection of breast, lung, and colorectal cancers: A systematic review. Cancer Biomark. 2017, 21, 29–39. [Google Scholar] [CrossRef]
- Bel’skaya, L.V.; Sarf, E.A.; Shalygin, S.P.; Postnova, T.V.; Kosenok, V.K. Identification of salivary volatile organic compounds as potential markers of stomach and colorectal cancer: A pilot study. J. Oral Biosci. 2020, 62, 212–221. [Google Scholar] [CrossRef]
- Mirzaei, Y.; Gholami, A.; Bordbar, M.M. A distance-based paper sensor for rapid detection of blood lactate concentration using gold nanoparticles synthesized by Satureja hortensis. Sens. Actuators B Chem. 2021, 345, 130445. [Google Scholar] [CrossRef]
- Khalid, T.; Aggio, R.; White, P.; De Lacy Costello, B.; Persad, R.; Al-Kateb, H.; Jones, P.; Probert, C.S.; Ratcliffe, N. Urinary volatile organic compounds for the detection of prostate cancer. PLoS ONE 2015, 10, e0143283. [Google Scholar] [CrossRef] [PubMed]
- Roy, M.; Yadav, B.K. Electronic nose for detection of food adulteration: A review. J. Food Sci. Technol. 2021, 1–13. [Google Scholar] [CrossRef]
- Bordbar, M.M.; Tashkhourian, J.; Hemmateenejad, B. Qualitative and quantitative analysis of toxic materials in adulterated fruit pickle samples by a colorimetric sensor array. Sens. Actuators B Chem. 2018, 257, 783–791. [Google Scholar] [CrossRef]
- Hemmateenejad, B.; Tashkhourian, J.; Bordbar, M.M.; Mobaraki, N. Development of colorimetric sensor array for discrimination of herbal medicine. J. Iran. Chem. Soc. 2017, 14, 595–604. [Google Scholar] [CrossRef]
- Shi, H.; Zhang, M.; Adhikari, B. Advances of electronic nose and its application in fresh foods: A review. Crit. Rev. Food Sci. Nutr. 2018, 58, 2700–2710. [Google Scholar] [CrossRef]
- Zhang, Y.; Askim, J.R.; Zhong, W.; Orlean, P.; Suslick, K.S. Identification of pathogenic fungi with an optoelectronic nose. Analyst 2014, 139, 1922–1928. [Google Scholar] [CrossRef] [PubMed]
- Lough, F.; Perry, J.D.; Stanforth, S.P.; Dean, J.R. Detection of exogenous VOCs as a novel in vitro diagnostic technique for the detection of pathogenic bacteria. TrAC Trends Anal. Chem. 2017, 87, 71–81. [Google Scholar] [CrossRef]
- Tai, H.; Duan, Z.; Wang, Y.; Wang, S.; Jiang, Y. Paper-Based Sensors for Gas, Humidity, and Strain Detections: A Review. ACS Appl. Mater. Interfaces 2020, 12, 31037–31053. [Google Scholar] [CrossRef]
- Boeker, P. On ‘electronic nose’methodology. Sens. Actuators B Chem. 2014, 204, 2–17. [Google Scholar] [CrossRef]
- Morbioli, G.G.; Mazzu-Nascimento, T.; Stockton, A.M.; Carrilho, E. Technical aspects and challenges of colorimetric detection with microfluidic paper-based analytical devices (μPADs)—A review. Anal. Chim. Acta 2017, 970, 1–22. [Google Scholar] [CrossRef] [PubMed]
- He, Y.; Wu, Y.; Fu, J.Z.; Wu, W. Bin Fabrication of paper-based microfluidic analysis devices: A review. RSC Adv. 2015, 5, 78109–78127. [Google Scholar] [CrossRef]
- Podrazka, M.; Báczyńska, E.; Kundys, M.; Jeleń, P.S.; Nery, E.W. Electronic tongue-A tool for all tastes? Biosensors 2017, 8, 3. [Google Scholar] [CrossRef]
- Sharifi, H.; Tashkhourian, J.; Hemmateenejad, B. A 3D origami paper-based analytical device combined with PVC membrane for colorimetric assay of heavy metal ions: Application to determination of Cu(II) in water samples. Anal. Chim. Acta 2020, 1126, 114–123. [Google Scholar] [CrossRef]
- Zhang, Y.; Li, X.; Li, H.; Song, M.; Feng, L.; Guan, Y. Postage stamp-sized array sensor for the sensitive screening test of heavy-metal ions. Analyst 2014, 139, 4887–4893. [Google Scholar] [CrossRef]
- Yetisen, A.K.; Akram, M.S.; Lowe, C.R. Paper-based microfluidic point-of-care diagnostic devices. Lab Chip 2013, 13, 2210–2251. [Google Scholar] [CrossRef]
- Nguyen, Q.H.; Kim, M. Il Nanomaterial-mediated paper-based biosensors for colorimetric pathogen detection. TrAC Trends Anal. Chem. 2020, 132, 116038. [Google Scholar] [CrossRef]
- Quesada-González, D.; Merkoçi, A. Nanoparticle-based lateral flow biosensors. Biosens. Bioelectron. 2015, 73, 47–63. [Google Scholar] [CrossRef]
- Parolo, C.; Sena-Torralba, A.; Bergua, J.F.; Calucho, E.; Fuentes-Chust, C.; Hu, L.; Rivas, L.; Álvarez-Diduk, R.; Nguyen, E.P.; Cinti, S.; et al. Tutorial: Design and fabrication of nanoparticle-based lateral-flow immunoassays. Nat. Protoc. 2020, 15, 3788–3816. [Google Scholar] [CrossRef] [PubMed]
- Chen, Y.; Chen, Q.; Han, M.; Zhou, J.; Gong, L.; Niu, Y.; Zhang, Y.; He, L.; Zhang, L. Development and optimization of a multiplex lateral flow immunoassay for the simultaneous determination of three mycotoxins in corn, rice and peanut. Food Chem. 2016, 213, 478–484. [Google Scholar] [CrossRef] [PubMed]
- Quesada-González, D.; Baiocco, A.; Martos, A.A.; de la Escosura-Muñiz, A.; Palleschi, G.; Merkoçi, A. Iridium oxide (IV) nanoparticle-based electrocatalytic detection of PBDE. Biosens. Bioelectron. 2019, 127, 150–154. [Google Scholar] [CrossRef] [PubMed]
- Tsai, T.T.; Huang, T.H.; Chen, C.A.; Ho, N.Y.J.; Chou, Y.J.; Chen, C.F. Development a stacking pad design for enhancing the sensitivity of lateral flow immunoassay. Sci. Rep. 2018, 8, 17319. [Google Scholar] [CrossRef]
- Jia, L.; David, M.; Joanne, M. Enhancing the signal of lateral flow immunoassays by using different developing methods. Sens. Mater. 2015, 27, 549–561. [Google Scholar]
- Bahadır, E.B.; Sezgintürk, M.K. Lateral flow assays: Principles, designs and labels. TrAC Trends Anal. Chem. 2016, 82, 286–306. [Google Scholar] [CrossRef]
- Luo, K.; Kim, H.Y.; Oh, M.H.; Kim, Y.R. Paper-based lateral flow strip assay for the detection of foodborne pathogens: Principles, applications, technological challenges and opportunities. Crit. Rev. Food Sci. Nutr. 2020, 60, 157–170. [Google Scholar] [CrossRef]
- Huang, Y.; Xu, T.; Wang, W.; Wen, Y.; Li, K.; Qian, L.; Zhang, X.; Liu, G. Lateral flow biosensors based on the use of micro- and nanomaterials: A review on recent developments. Microchim. Acta 2020, 187, 70. [Google Scholar] [CrossRef]
- Sharma, R.; Gautam, P.B.; Rajput, Y.S.; Mann, B.; Gandhi, K. Identification of analyte of interest through lateral flow assay. In Nano-Technological and Biochemical Techniques for Assessing the Quality and Safety of Milk and Milk Products. 2019. Available online: https://www.academia.edu/download/58315915/CAFT_Compendium.pdf#page=111 (accessed on 29 August 2021).
- Byzova, N.A.; Zherdev, A.V.; Khlebtsov, B.N.; Burov, A.M.; Khlebtsov, N.G.; Dzantiev, B.B. Advantages of highly spherical gold nanoparticles as labels for lateral flow immunoassay. Sensors 2020, 20, 3608. [Google Scholar] [CrossRef] [PubMed]
- Nguyen, V.T.; Song, S.; Park, S.; Joo, C. Recent advances in high-sensitivity detection methods for paper-based lateral-flow assay. Biosens. Bioelectron. 2020, 152, 112015. [Google Scholar] [CrossRef]
- Apilux, A.; Rengpipat, S.; Suwanjang, W.; Chailapakul, O. Development of competitive lateral flow immunoassay coupled with silver enhancement for simple and sensitive salivary cortisol detection. EXCLI J. 2018, 17, 1198–1209. [Google Scholar] [CrossRef]
- Rey, E.G.; O’Dell, D.; Mehta, S.; Erickson, D. Mitigating the Hook Effect in Lateral Flow Sandwich Immunoassays Using Real-Time Reaction Kinetics. Anal. Chem. 2017, 89, 5095–5100. [Google Scholar] [CrossRef]
- Ge, X.; Asiri, A.M.; Du, D.; Wen, W.; Wang, S.; Lin, Y. Nanomaterial-enhanced paper-based biosensors. TrAC Trends Anal. Chem. 2014, 58, 31–39. [Google Scholar] [CrossRef]
- Ross, G.M.S.; Salentijn, G.I.; Nielen, M.W.F. A critical comparison between flow-through and lateral flow immunoassay formats for visual and smartphone-based multiplex allergen detection. Biosensors 2019, 9, 143. [Google Scholar] [CrossRef]
- Taghizadeh-Behbahani, M.; Hemmateenejad, B.; Shamsipur, M.; Tavassoli, A. A paper-based length of stain analytical device for naked eye (readout-free) detection of cystic fibrosis. Anal. Chim. Acta 2019, 1080, 138–145. [Google Scholar] [CrossRef]
- Alsaeed, B.; Mansour, F.R. Distance-based paper microfluidics; principle, technical aspects and applications. Microchem. J. 2020, 155, 104664. [Google Scholar] [CrossRef]
- Zhang, J.X.J.; Hoshino, K. Microfluidics and micro total analytical systems. In Molecular Sensors and Nanodevices: Principles, Designs and Applications in Biomedical Engineering, 2nd ed.; Elsevier: Amsterdam, The Netherlands, 2019; pp. 113–179. ISBN 978-0-12-814862-4. [Google Scholar]
- Jiang, L.; Korivi, N.S. Microfluidics: Technologies and applications. Nanolithogr. Art Fabr. Nanoelectron. Nanophotonic Devices Syst. 2013, 424–443. [Google Scholar] [CrossRef]
- Melin, J.; Van Der Wijngaart, W.; Stemme, G. Behaviour and design considerations for continuous flow closed-open-closed liquid microchannels. Lab Chip 2005, 5, 682–686. [Google Scholar] [CrossRef]
- Konda, A.; Morin, S.A. Flow-directed synthesis of spatially variant arrays of branched zinc oxide mesostructures. Nanoscale 2017, 9, 8393–8400. [Google Scholar] [CrossRef]
- Chokkalingam, V.; Tel, J.; Wimmers, F.; Liu, X.; Semenov, S.; Thiele, J.; Figdor, C.G.; Huck, W.T.S. Probing cellular heterogeneity in cytokine-secreting immune cells using droplet-based microfluidics. Lab Chip 2013, 13, 4740–4744. [Google Scholar] [CrossRef] [PubMed]
- Pesant, J.; Hareng, M.; Mourey, B.; Perbet, J. Electrodes for a Device Operating by Electrically Controlled Fluid Displacement. U.S. Patent 4569575, 11 February 1986. [Google Scholar]
- Martinez, A.W.; Phillips, S.T.; Butte, M.J.; Whitesides, G.M. Patterned Paper as a Platform for Inexpensive, Low-Volume, Portable Bioassays. Angew. Chem. 2007, 119, 1340–1342. [Google Scholar] [CrossRef]
- DeBlois, R.W.; Bean, C.P. Counting and sizing of submicron particles by the resistive pulse technique. Rev. Sci. Instrum. 1970, 41, 909–916. [Google Scholar] [CrossRef]
- Kauffman, P.; Fu, E.; Lutz, B.; Yager, P. Visualization and measurement of flow in two-dimensional paper networks. Lab Chip 2010, 10, 2614–2617. [Google Scholar] [CrossRef] [PubMed]
- Martinez, A.W.; Phillips, S.T.; Whitesides, G.M. Three-dimensional microfluidic devices fabricated in layered paper and tape. Proc. Natl. Acad. Sci. USA 2008, 105, 19606–19611. [Google Scholar] [CrossRef]
- Liu, H.; Crooks, R.M. Three-dimensional paper microfluidic devices assembled using the principles of origami. J. Am. Chem. Soc. 2011, 133, 17564–17566. [Google Scholar] [CrossRef]
- Santhiago, M.; Nery, E.W.; Santos, G.P.; Kubota, L.T. Microfluidic paper-based devices for bioanalytical applications. Bioanalysis 2014, 6, 89–106. [Google Scholar] [CrossRef]
- Lim, H.; Jafry, A.T.; Lee, J. Fabrication, flow control, and applications of microfluidic paper-based analytical devices. Molecules 2019, 24, 2869. [Google Scholar] [CrossRef]
- Fenton, E.M.; Mascarenas, M.R.; López, G.P.; Sibbett, S.S. Multiplex lateral-flow test strips fabricated by two-dimensional shaping. ACS Appl. Mater. Interfaces 2009, 1, 124–129. [Google Scholar] [CrossRef]
- Sadri, B.; Goswami, D.; Martinez, R.V. Rapid fabrication of epidermal paper-based electronic devices using razor printing. Micromachines 2018, 9, 420. [Google Scholar] [CrossRef]
- Cassano, C.L.; Fan, Z.H. Laminated paper-based analytical devices (LPAD): Fabrication, characterization, and assays. Microfluid. Nanofluidics 2013, 15, 173–181. [Google Scholar] [CrossRef]
- Jafry, A.T.; Lim, H.; Sung, W.K.; Lee, J. Flexible time–temperature indicator: A versatile platform for laminated paper-based analytical devices. Microfluid. Nanofluidics 2017, 21, 57. [Google Scholar] [CrossRef]
- Glavan, A.C.; Martinez, R.V.; Maxwell, E.J.; Subramaniam, A.B.; Nunes, R.M.D.; Soh, S.; Whitesides, G.M. Rapid fabrication of pressure-driven open-channel microfluidic devices in omniphobic RF paper. Lab Chip 2013, 13, 2922–2930. [Google Scholar] [CrossRef]
- Thuo, M.M.; Martinez, R.V.; Lan, W.J.; Liu, X.; Barber, J.; Atkinson, M.B.J.; Bandarage, D.; Bloch, J.F.; Whitesides, G.M. Fabrication of low-cost paper-based microfluidic devices by embossing or cut-and-stack methods. Chem. Mater. 2014, 26, 4230–4237. [Google Scholar] [CrossRef]
- Theillet, G.; Rubens, A.; Foucault, F.; Dalbon, P.; Rozand, C.; Leparc-Goffart, I.; Bedin, F. Laser-cut paper-based device for the detection of dengue non-structural NS1 protein and specific IgM in human samples. Arch. Virol. 2018, 163, 1757–1767. [Google Scholar] [CrossRef]
- Spicar-Mihalic, P.; Houghtaling, J.; Fu, E.; Yager, P.; Liang, T.; Toley, B. CO2 laser cutting and ablative etching for the fabrication of paper-based devices. J. Micromech. Microeng. 2013, 23, 067003. [Google Scholar] [CrossRef]
- Xia, Y.; Si, J.; Li, Z. Fabrication techniques for microfluidic paper-based analytical devices and their applications for biological testing: A review. Biosens. Bioelectron. 2016, 77, 774–789. [Google Scholar] [CrossRef]
- Jeong, S.G.; Kim, J.; Nam, J.O.; Song, Y.S.; Lee, C.S. Paper-based analytical device for quantitative urinalysis. Int. Neurourol. J. 2013, 17, 155–161. [Google Scholar] [CrossRef]
- Songok, J.; Tuominen, M.; Teisala, H.; Haapanen, J.; Mäkelä, J.M.; Kuusipalo, J.; Toivakka, M. Paper-Based Microfluidics: Fabrication Technique and Dynamics of Capillary-Driven Surface Flow. ACS Appl. Mater. Interfaces 2016, 6, 20060–20066. [Google Scholar] [CrossRef] [PubMed]
- Sones, C.L.; Katis, I.N.; He, P.J.W.; Mills, B.; Namiq, M.F.; Shardlow, P.; Ibsen, M.; Eason, R.W. Laser-induced photo-polymerisation for creation of paper-based fluidic devices. Lab Chip 2014, 14, 4567–4574. [Google Scholar] [CrossRef] [PubMed]
- Nargang, T.M.; Dierkes, R.; Bruchmann, J.; Keller, N.; Sachsenheimer, K.; Lee-Thedieck, C.; Kotz, F.; Helmer, D.; Rapp, B.E. Photolithographic structuring of soft, extremely foldable and autoclavable hydrophobic barriers in paper. Anal. Methods 2018, 10, 4028–4035. [Google Scholar] [CrossRef]
- Carrilho, E.; Martinez, A.W.; Whitesides, G.M. Understanding wax printing: A simple micropatterning process for paper-based microfluidics. Anal. Chem. 2009, 81, 7091–7095. [Google Scholar] [CrossRef] [PubMed]
- Suresh, V.; Qunya, O.; Kanta, B.L.; Yuh, L.Y.; Chong, K.S.L. Non-invasive paper-based microfluidic device for ultra-low detection of urea through enzyme catalysis. R. Soc. Open Sci. 2018, 5, 171980. [Google Scholar] [CrossRef]
- Songjaroen, T.; Dungchai, W.; Chailapakul, O.; Laiwattanapaisal, W. Novel, simple and low-cost alternative method for fabrication of paper-based microfluidics by wax dipping. Talanta 2011, 85, 2587–2593. [Google Scholar] [CrossRef]
- Zhang, A.L.; Zha, Y. Fabrication of paper-based microfluidic device using printed circuit technology. AIP Adv. 2012, 2, 022171. [Google Scholar] [CrossRef]
- Noh, H.; Phillips, S.T. Metering the capillary-driven flow of fluids in paper-based microfluidic devices. Anal. Chem. 2010, 82, 4181–4187. [Google Scholar] [CrossRef]
- Maejima, K.; Tomikawa, S.; Suzuki, K.; Citterio, D. Inkjet printing: An integrated and green chemical approach to microfluidic paper-based analytical devices. RSC Adv. 2013, 3, 9258–9263. [Google Scholar] [CrossRef]
- Li, X.; Tian, J.; Garnier, G.; Shen, W. Fabrication of paper-based microfluidic sensors by printing. Colloids Surf. B Biointerfaces 2010, 76, 564–570. [Google Scholar] [CrossRef] [PubMed]
- Wang, J.; Monton, M.R.N.; Zhang, X.; Filipe, C.D.M.; Pelton, R.; Brennan, J.D. Hydrophobic sol-gel channel patterning strategies for paper-based microfluidics. Lab Chip 2014, 14, 691–695. [Google Scholar] [CrossRef]
- Hiltunen, J.; Liedert, C.; Hiltunen, M.; Huttunen, O.H.; Hiitola-Keinänen, J.; Aikio, S.; Harjanne, M.; Kurkinen, M.; Hakalahti, L.; Lee, L.P. Roll-to-roll fabrication of integrated PDMS-paper microfluidics for nucleic acid amplification. Lab Chip 2018, 18, 1552–1559. [Google Scholar] [CrossRef]
- Olkkonen, J.; Lehtinen, K.; Erho, T. Flexographically printed fluidic structures in paper. Anal. Chem. 2010, 82, 10246–10250. [Google Scholar] [CrossRef]
- Bracher, P.J.; Gupta, M.; MacK, E.T.; Whitesides, G.M. Heterogeneous films of ionotropic hydrogels fabricated from delivery templates of patterned paper. ACS Appl. Mater. Interfaces 2009, 1, 1807–1812. [Google Scholar] [CrossRef]
- Ghosh, R.; Gopalakrishnan, S.; Savitha, R.; Renganathan, T.; Pushpavanam, S. Fabrication of laser printed microfluidic paper-based analytical devices (LP-µPADs) for point-of-care applications. Sci. Rep. 2019, 9, 7896. [Google Scholar] [CrossRef]
- Mohamed, H.M. Screen-printed disposable electrodes: Pharmaceutical applications and recent developments. TrAC Trends Anal. Chem. 2016, 82, 1–11. [Google Scholar] [CrossRef]
- Lamas-Ardisana, P.J.; Martínez-Paredes, G.; Añorga, L.; Grande, H.J. Glucose biosensor based on disposable electrochemical paper-based transducers fully fabricated by screen-printing. Biosens. Bioelectron. 2018, 109, 8–12. [Google Scholar] [CrossRef] [PubMed]
- Beitollahi, H.; Mohammadi, S.Z.; Safaei, M.; Tajik, S. Applications of electrochemical sensors and biosensors based on modified screen-printed electrodes: A review. Anal. Methods 2020, 12, 1547–1560. [Google Scholar] [CrossRef]
- He, Y.; Wu, Y.; Fu, J.Z.; Gao, Q.; Qiu, J.J. Developments of 3D Printing Microfluidics and Applications in Chemistry and Biology: A Review. Electroanalysis 2016, 28, 1658–1678. [Google Scholar] [CrossRef]
- He, Y.; Gao, Q.; Wu, W.B.; Nie, J.; Fu, J.Z. 3D printed paper-based microfluidic analytical devices. Micromachines 2016, 7, 108. [Google Scholar] [CrossRef] [PubMed]
- Curto, V.F.; Lopez-Ruiz, N.; Capitan-Vallvey, L.F.; Palma, A.J.; Benito-Lopez, F.; Diamond, D. Fast prototyping of paper-based microfluidic devices by contact stamping using indelible ink. RSC Adv. 2013, 3, 18811–18816. [Google Scholar] [CrossRef]
- Yao, X.H.; Jia, T.; Xie, C.Q.; Fu, J.Z.; He, Y. Facial fabrication of paper-based flexible electronics with flash foam stamp lithography. Microsyst. Technol. 2017, 23, 4419–4426. [Google Scholar] [CrossRef]
- Liu, N.; Xu, J.; An, H.J.; Phan, D.T.; Hashimoto, M.; Lew, W.S. Direct spraying method for fabrication of paper-based microfluidic devices. J. Micromech. Microeng. 2017, 27, 104001. [Google Scholar] [CrossRef]
- Nurak, T.; Praphairaksit, N.; Chailapakul, O. Fabrication of paper-based devices by lacquer spraying method for the determination of nickel (II) ion in waste water. Talanta 2013, 114, 291–296. [Google Scholar] [CrossRef] [PubMed]
- Kwong, P.; Gupta, M. Vapor phase deposition of functional polymers onto paper-based microfluidic devices for advanced unit operations. Anal. Chem. 2012, 84, 10129–10135. [Google Scholar] [CrossRef] [PubMed]
- Lawal, A.T.; Wallace, G.G. Vapour phase polymerisation of conducting and non-conducting polymers: A review. Talanta 2014, 119, 133–143. [Google Scholar] [CrossRef]
- Demirel, G.; Babur, E. Vapor-phase deposition of polymers as a simple and versatile technique to generate paper-based microfluidic platforms for bioassay applications. Analyst 2014, 139, 2326–2331. [Google Scholar] [CrossRef]
- Obeso, C.G.; Sousa, M.P.; Song, W.; Rodriguez-Pérez, M.A.; Bhushan, B.; Mano, J.F. Modification of paper using polyhydroxybutyrate to obtain biomimetic superhydrophobic substrates. Colloids Surf. A Physicochem. Eng. Asp. 2013, 416, 51–55. [Google Scholar] [CrossRef]
- Sheini, A.; Aseman, M.D.; Bordbar, M.M. Origami paper analytical assay based on metal complex sensor for rapid determination of blood cyanide concentration in fire survivors. Sci. Rep. 2021, 11, 3521. [Google Scholar] [CrossRef]
- Sheini, A. A paper-based device for the colorimetric determination of ammonia and carbon dioxide using thiomalic acid and maltol functionalized silver nanoparticles: Application to the enzymatic determination of urea in saliva and blood. Microchim. Acta 2020, 187, 565. [Google Scholar] [CrossRef] [PubMed]
- Jeong, S.G.; Lee, S.H.; Choi, C.H.; Kim, J.; Lee, C.S. Toward instrument-free digital measurements: A three-dimensional microfluidic device fabricated in a single sheet of paper by double-sided printing and lamination. Lab Chip 2015, 15, 1188–1194. [Google Scholar] [CrossRef] [PubMed]
- Mohammadifar, M.; Zhang, J.; Yazgan, I.; Sadik, O.; Choi, S. Power-on-paper: Origami-inspired fabrication of 3-D microbial fuel cells. Renew. Energy 2018, 118, 695–700. [Google Scholar] [CrossRef]
- Park, C.; Han, Y.D.; Kim, H.V.; Lee, J.; Yoon, H.C.; Park, S. Double-sided 3D printing on paper towards mass production of three-dimensional paper-based microfluidic analytical devices (3D-μPADs). Lab Chip 2018, 18, 1533–1538. [Google Scholar] [CrossRef]
- Ding, J.; Li, B.; Chen, L.; Qin, W. A Three-Dimensional Origami Paper-Based Device for Potentiometric Biosensing. Angew. Chem. Int. Ed. 2016, 55, 13033–13037. [Google Scholar] [CrossRef]
- Razmi, N.; Baradaran, B.; Hejazi, M.; Hasanzadeh, M.; Mosafer, J.; Mokhtarzadeh, A.; de la Guardia, M. Recent advances on aptamer-based biosensors to detection of platelet-derived growth factor. Biosens. Bioelectron. 2018, 113, 58–71. [Google Scholar] [CrossRef] [PubMed]
- Juzgado, A.; Soldà, A.; Ostric, A.; Criado, A.; Valenti, G.; Rapino, S.; Conti, G.; Fracasso, G.; Paolucci, F.; Prato, M. Highly sensitive electrochemiluminescence detection of a prostate cancer biomarker. J. Mater. Chem. B 2017, 5, 6681–6687. [Google Scholar] [CrossRef] [PubMed]
- Vo-Dinh, T.; Cullum, B. Biosensors and biochips: Advances in biological and medical diagnostics. Fresenius. J. Anal. Chem. 2000, 366, 540–551. [Google Scholar] [CrossRef]
- Valenti, G.; Rampazzo, E.; Biavardi, E.; Villani, E.; Fracasso, G.; Marcaccio, M.; Bertani, F.; Ramarli, D.; Dalcanale, E.; Paolucci, F.; et al. An electrochemiluminescence-supramolecular approach to sarcosine detection for early diagnosis of prostate cancer. Faraday Discuss. 2015, 185, 299–309. [Google Scholar] [CrossRef]
- Holford, T.R.J.; Davis, F.; Higson, S.P.J. Recent trends in antibody based sensors. Biosens. Bioelectron. 2012, 34, 12–24. [Google Scholar] [CrossRef]
- Aleman, J.; Kilic, T.; Mille, L.S.; Shin, S.R.; Zhang, Y.S. Microfluidic integration of regeneratable electrochemical affinity-based biosensors for continual monitoring of organ-on-a-chip devices. Nat. Protoc. 2021, 16, 2564–2593. [Google Scholar] [CrossRef]
- JD, B.; BG, B.; WG, V. Measurement of monoclonal antibody affinity by non-competitive enzyme immunoassay. J. Immunol. Methods 1987, 100, 173–179. [Google Scholar]
- Nistor, C.; Emnéus, J. Chapter 9 Immunoassay: Potentials and limitations. Compr. Anal. Chem. 2005, 44, 375–427. [Google Scholar] [CrossRef]
- Jost, C.; Plückthun, A. Engineered proteins with desired specificity: DARPins, other alternative scaffolds and bispecific IgGs. Curr. Opin. Struct. Biol. 2014, 27, 102–112. [Google Scholar] [CrossRef] [PubMed]
- Mehlhorn, A.; Rahimi, P.; Joseph, Y. Aptamer-based biosensors for antibiotic detection: A review. Biosensors 2018, 8, 54. [Google Scholar] [CrossRef]
- Mello, L.D.; Kubota, L.T. Review of the use of biosensors as analytical tools in the food and drink industries. Food Chem. 2002, 77, 237–256. [Google Scholar] [CrossRef]
- Du, Y.; Dong, S. Nucleic acid biosensors: Recent advances and perspectives. Anal. Chem. 2017, 89, 189–215. [Google Scholar] [CrossRef]
- Bollella, P.; Gorton, L. Enzyme based amperometric biosensors. Curr. Opin. Electrochem. 2018, 10, 157–173. [Google Scholar] [CrossRef]
- Mross, S.; Pierrat, S.; Zimmermann, T.; Kraft, M. Microfluidic enzymatic biosensing systems: A review. Biosens. Bioelectron. 2015, 70, 376–391. [Google Scholar] [CrossRef] [PubMed]
- Marazuela, M.D.; Moreno-Bondi, M.C. Fiber-optic biosensors—An overview. Anal. Bioanal. Chem. 2002, 372, 664–682. [Google Scholar] [CrossRef] [PubMed]
- Upadhyay, L.; Verm, N. Enzyme Inhibition Based Biosensors: A Review. Anal. Lett. 2013, 46, 225–241. [Google Scholar] [CrossRef]
- Mehrotra, P. Biosensors and their applications—A review. J. Oral Biol. Craniofacial Res. 2016, 6, 153–159. [Google Scholar] [CrossRef]
- Kazemi-Darsanaki, R.; Azizzadeh, A.; Nourbakhsh, M.; Raeisi, G.; AzizollahiAliabadi, M. Biosensors: Functions and Applications. J. Biol. Today’s World 2013, 2, 20–23. [Google Scholar] [CrossRef]
- Nakamura, H. Current status of water environment and their microbial biosensor techniques—Part II: Recent trends in microbial biosensor development. Anal. Bioanal. Chem. 2018, 410, 3967–3989. [Google Scholar] [CrossRef]
- Varzakas, T.; Nikoleli, G.-P.; Nikolelis, D. Tissue, Microorganisms, Organelles, and Cell-Based Biosensors, 1st ed.; Taylor & Francis Group: Abingdon, UK, 2013. [Google Scholar]
- Campàs, M.; Carpentier, R.; Rouillon, R. Plant tissue-and photosynthesis-based biosensors. Biotechnol. Adv. 2008, 26, 370–378. [Google Scholar] [CrossRef] [PubMed]
- Jung, Y.; Jeong, J.Y.; Chung, B.H. Recent advances in immobilization methods of antibodies on solid supports. Analyst 2008, 133, 697–701. [Google Scholar] [CrossRef]
- Nery, E.W.; Kubota, L.T. Evaluation of enzyme immobilization methods for paper-based devices—A glucose oxidase study. J. Pharm. Biomed. Anal. 2016, 117, 551–559. [Google Scholar] [CrossRef] [PubMed]
- Kong, F.; Hu, Y.F. Biomolecule immobilization techniques for bioactive paper fabrication. Anal. Bioanal. Chem. 2012, 403, 7–13. [Google Scholar] [CrossRef]
- Narsaiah, K.; Jha, S.N.; Bhardwaj, R.; Sharma, R.; Kumar, R. Optical biosensors for food quality and safety assurance—A review. J. Food Sci. Technol. 2012, 49, 383–406. [Google Scholar] [CrossRef]
- Kaur, K.; Kaushal, P. Enzymes as analytical tools for the assessment of food quality and food safety. Biomass Biofuels Biochem. Adv. Enzym. Technol. 2019, 273–292. [Google Scholar] [CrossRef]
- Yamaguchi, H.; Kiyota, Y.; Miyazaki, M. Techniques for preparation of cross-linked enzyme aggregates and their applications in bioconversions. Catalysts 2018, 8, 174. [Google Scholar] [CrossRef]
- Liebich, V.J.; Avrutina, O.; Habermann, J.; Hillscher, L.M.; Langhans, M.; Meckel, T.; Biesalski, M.; Kolmar, H. Toward Fabrication of Bioactive Papers: Covalent Immobilization of Peptides and Proteins. Biomacromolecules 2021. [Google Scholar] [CrossRef]
- Kasoju, N.; Nguyen, L.T.B.; Padalhin, A.R.; Dye, J.F.; Cui, Z.; Ye, H. Techniques for modifying biomaterials to improve hemocompatibility. Hemocompat. Biomater. Clin. Appl. Blood-Biomater. Interact. 2018, 191–220. [Google Scholar] [CrossRef]
- Al-Husseini, Z.N.O. A Literature Review on the Indicators in Precipitation. Am. Int. J. Sci. Eng. Res. 2019, 2, 1–8. [Google Scholar] [CrossRef]
- Martinez, A.W.; Phillips, S.T.; Whitesides, G.M.; Carrilho, E. Diagnostics for the developing world: Microfluidic paper-based analytical devices. Anal. Chem. 2010, 82, 3–10. [Google Scholar] [CrossRef]
- Liu, M.M.; Lian, X.; Liu, H.; Guo, Z.Z.; Huang, H.H.; Lei, Y.; Peng, H.P.; Chen, W.; Lin, X.H.; Liu, A.L.; et al. A colorimetric assay for sensitive detection of hydrogen peroxide and glucose in microfluidic paper-based analytical devices integrated with starch-iodide-gelatin system. Talanta 2019, 200, 511–517. [Google Scholar] [CrossRef]
- Almeida, L.C.; Correia, J.P.; Viana, A.S. Electrochemical and optical characterization of thin polydopamine films on carbon surfaces for enzymatic sensors. Electrochim. Acta 2018, 263, 480–489. [Google Scholar] [CrossRef]
- Mu, C.; Lu, H.; Bao, J.; Zhang, Q. Visual colorimetric ‘turn-off’ biosensor for ascorbic acid detection based on hypochlorite–3,3′,5,5′,-Tetramethylbenzidine system. Spectrochim. Acta Part A Mol. Biomol. Spectrosc. 2018, 201, 61–66. [Google Scholar] [CrossRef]
- Gao, S.; Zheng, X.; Hu, B.; Sun, M.; Wu, J.; Jiao, B.; Wang, L. Enzyme-linked, aptamer-based, competitive biolayer interferometry biosensor for palytoxin. Biosens. Bioelectron. 2017, 89, 952–958. [Google Scholar] [CrossRef]
- Ding, L.; Gong, Z.; Yan, M.; Yu, J.; Song, X. Determination of glucose by using fluorescent silicon nanoparticles and an inner filter caused by peroxidase-induced oxidation of o-phenylenediamine by hydrogen peroxide. Microchim. Acta 2017, 184, 4531–4536. [Google Scholar] [CrossRef]
- Fan, Y.; Shi, S.; Ma, J.; Guo, Y. A paper-based electrochemical immunosensor with reduced graphene oxide/thionine/gold nanoparticles nanocomposites modification for the detection of cancer antigen 125. Biosens. Bioelectron. 2019, 135, 1–7. [Google Scholar] [CrossRef]
- Dutta, G.; Lillehoj, P.B. An ultrasensitive enzyme-free electrochemical immunosensor based on redox cycling amplification using methylene blue. Analyst 2017, 142, 3492–3499. [Google Scholar] [CrossRef]
- Hamidi-Asl, E.; Raoof, J.B.; Ojani, R.; Hejazi, M.S. Indigo carmine as new label in PNA biosensor for detection of short sequence of p53 tumor suppressor gene. Electroanalysis 2013, 25, 2075–2083. [Google Scholar] [CrossRef]
- Chen, Q.; Huang, F.; Cai, G.; Wang, M.; Lin, J. An optical biosensor using immunomagnetic separation, urease catalysis and pH indication for rapid and sensitive detection of Listeria monocytogenes. Sens. Actuators B Chem. 2018, 258, 447–453. [Google Scholar] [CrossRef]
- Van der Schueren, L.; de Clerck, K. Coloration and application of pH-sensitive dyes on textile materials. Color. Technol. 2012, 128, 82–90. [Google Scholar] [CrossRef]
- Crosland, M.; Hannaway, O. Gay-Lussac, Scientist and Bourgeois. Phys. Today 1981, 34, 84–86. [Google Scholar] [CrossRef]
- Mahmoudi, M.; Lohse, S.E.; Murphy, C.J.; Suslick, K.S. Identification of Nanoparticles with a Colorimetric Sensor Array. ACS Sens. 2016, 1, 17–21. [Google Scholar] [CrossRef]
- Askim, J.R.; Mahmoudi, M.; Suslick, K.S. Optical sensor arrays for chemical sensing: The optoelectronic nose. Chem. Soc. Rev. 2013, 42, 8649–8682. [Google Scholar] [CrossRef]
- Sedgwick, A.C.; Brewster, J.T.; Wu, T.; Feng, X.; Bull, S.D.; Qian, X.; Sessler, J.L.; James, T.D.; Anslyn, E.V.; Sun, X. Indicator displacement assays (IDAs): The past, present and future. Chem. Soc. Rev. 2021, 50, 9–38. [Google Scholar] [CrossRef]
- Khajehsharifi, H.; Bordbar, M.M. A highly selective chemosensor for detection and determination of cyanide by using an indicator displacement assay and PC-ANN and its logic gate behavior. Sens. Actuators B Chem. 2015, 209, 1015–1022. [Google Scholar] [CrossRef]
- Ealia, S.A.M.; Saravanakumar, M.P. A review on the classification, characterisation, synthesis of nanoparticles and their application. IOP Conf. Ser. Mater. Sci. 2017, 263, 032019. [Google Scholar]
- Cuenya, B.R. Synthesis and catalytic properties of metal nanoparticles: Size, shape, support, composition, and oxidation state effects. Thin Solid Film. 2010, 518, 3127–3150. [Google Scholar] [CrossRef]
- Lan, L.; Yao, Y.; Ping, J.; Ying, Y. Recent advances in nanomaterial-based biosensors for antibiotics detection. Biosens. Bioelectron. 2017, 91, 504–514. [Google Scholar] [CrossRef] [PubMed]
- Zeng, Y.; Zhu, Z.; Du, D.; Lin, Y. Nanomaterial-based electrochemical biosensors for food safety. J. Electroanal. Chem. 2016, 781, 147–154. [Google Scholar] [CrossRef]
- Srikar, S.K.; Giri, D.D.; Pal, D.B.; Mishra, P.K.; Upadhyay, S.N. Green Synthesis of Silver Nanoparticles: A Review. Green Sustain. Chem. 2016, 6, 34–56. [Google Scholar] [CrossRef]
- Srinoi, P.; Chen, Y.T.; Vittur, V.; Marquez, M.D.; Lee, T.R. Bimetallic nanoparticles: Enhanced magnetic and optical properties for emerging biological applications. Appl. Sci. 2018, 8, 1106. [Google Scholar] [CrossRef]
- Sharma, G.; Kumar, A.; Sharma, S.; Naushad, M.; Prakash Dwivedi, R.; ALOthman, Z.A.; Mola, G.T. Novel development of nanoparticles to bimetallic nanoparticles and their composites: A review. J. King Saud Univ. Sci. 2019, 31, 257–269. [Google Scholar] [CrossRef]
- Wu, K.; Su, D.; Liu, J.; Saha, R.; Wang, J.P. Magnetic nanoparticles in nanomedicine: A review of recent advances. Nanotechnology 2019, 30, 502003. [Google Scholar] [CrossRef]
- Pastucha, M.; Farka, Z.; Lacina, K.; Mikušová, Z.; Skládal, P. Magnetic nanoparticles for smart electrochemical immunoassays: A review on recent developments. Microchim. Acta 2019, 186, 1–26. [Google Scholar] [CrossRef]
- Mohammed, L.; Gomaa, H.G.; Ragab, D.; Zhu, J. Magnetic nanoparticles for environmental and biomedical applications: A review. Particuology 2017, 30, 1–14. [Google Scholar] [CrossRef]
- Asadian, E.; Ghalkhani, M.; Shahrokhian, S. Electrochemical sensing based on carbon nanoparticles: A review. Sens. Actuators B Chem. 2019, 293, 183–209. [Google Scholar] [CrossRef]
- LeCroy, G.E.; Yang, S.T.; Yang, F.; Liu, Y.; Fernando, K.A.S.; Bunker, C.E.; Hu, Y.; Luo, P.G.; Sun, Y.P. Functionalized carbon nanoparticles: Syntheses and applications in optical bioimaging and energy conversion. Coord. Chem. Rev. 2016, 320, 66–81. [Google Scholar] [CrossRef]
- Balarastaghi, M.; Ahmadi, V. Formulation of atomic positions and carbon–carbon bond length in armchair graphene nanoribbons: An ab initio study. J. Theor. Appl. Phys. 2017, 11, 191–199. [Google Scholar] [CrossRef]
- Ji, K.; Han, J.; Hirata, A.; Fujita, T.; Shen, Y.; Ning, S.; Liu, P.; Kashani, H.; Tian, Y.; Ito, Y.; et al. Lithium intercalation into bilayer graphene. Nat. Commun. 2019, 10, 68–70. [Google Scholar] [CrossRef] [PubMed]
- Kokorina, A.A.; Ermakov, A.V.; Abramova, A.M.; Goryacheva, I.Y.; Sukhorukov, G.B. Carbon nanoparticles and materials on their basis. Colloids Interfaces 2020, 4, 42. [Google Scholar] [CrossRef]
- Anzar, N.; Hasan, R.; Tyagi, M.; Yadav, N.; Narang, J. Carbon nanotube—A review on Synthesis, Properties and plethora of applications in the field of biomedical science. Sens. Int. 2020, 1, 100003. [Google Scholar] [CrossRef]
- Campuzano, S.; Yáñez-Sedeño, P.; Pingarrón, J.M. Carbon dots and graphene quantum dots in electrochemical biosensing. Nanomaterials 2019, 9, 634. [Google Scholar] [CrossRef]
- Zhang, Y.; Zhang, C.; Xu, C.; Wang, X.; Liu, C.; Waterhouse, G.I.N.; Wang, Y.; Yin, H. Ultrasmall Au nanoclusters for biomedical and biosensing applications: A mini-review. Talanta 2019, 200, 432–442. [Google Scholar] [CrossRef]
- Cui, H.; Shao, Z.S.; Song, Z.; Wang, Y.B.; Wang, H.S. Development of gold nanoclusters: From preparation to applications in the field of biomedicine. J. Mater. Chem. C 2020, 8, 14312–14333. [Google Scholar] [CrossRef]
- Kimmel, D.W.; Leblanc, G.; Meschievitz, M.E.; Cliffel, D.E. Electrochemical sensors and biosensors. Anal. Chem. 2012, 84, 685–707. [Google Scholar] [CrossRef]
- Kanyong, P.; Krampa, F.D.; Aniweh, Y.; Awandare, G.A. Enzyme-based amperometric galactose biosensors: A review. Microchim. Acta 2017, 184, 3663–3671. [Google Scholar] [CrossRef]
- Ding, J.; Qin, W. Recent advances in potentiometric biosensors. TrAC Trends Anal. Chem. 2020, 124, 115803. [Google Scholar] [CrossRef]
- Bahadir, E.B.; Sezgintürk, M.K. A review on impedimetric biosensors. Artif. Cells Nanomed. Biotechnol. 2016, 44, 248–262. [Google Scholar] [CrossRef]
- Adley, C.C.; Ryan, M.P. Conductometric biosensors for high throughput screening of pathogens in food. High Throughput Screen. Food Saf. Assess. Biosens. Technol. Hyperspectr. Imaging Pract. Appl. 2015, 315–326. [Google Scholar] [CrossRef]
- Chen, D.; Zhang, M.; Zhou, F.; Hai, H.; Li, J. Ultrasensitive electroluminescence biosensor for a breast cancer marker microRNA based on target cyclic regeneration and multi-labeled magnetized nanoparticles. Microchim. Acta 2019, 186, 1–9. [Google Scholar] [CrossRef] [PubMed]
- Shamsi, M.H.; Choi, K.; Ng, A.H.C.; Dean Chamberlain, M.; Wheeler, A.R. Electrochemiluminescence on digital microfluidics for microRNA analysis. Biosens. Bioelectron. 2016, 77, 845–852. [Google Scholar] [CrossRef] [PubMed]
- Nie, Z.; Deiss, F.; Liu, X.; Akbulut, O.; Whitesides, G.M. Integration of paper-based microfluidic devices with commercial electrochemical readers. Lab Chip 2010, 10, 3163–3169. [Google Scholar] [CrossRef]
- Millo, T.; Jaiswal, A.K.; Prasad, Y.S.; Murty, O.P. Breath alcohol analyzer and its forensic applications. J. Forensic Med. Toxicol. 2010, 27, 55–59. [Google Scholar]
- Van Dyk, J.S.; Pletschke, B. Review on the use of enzymes for the detection of organochlorine, organophosphate and carbamate pesticides in the environment. Chemosphere 2011, 82, 291–307. [Google Scholar] [CrossRef]
- Mercer, C.; Bennett, R.; Conghaile, P.; Rusling, J.F.; Leech, D. Glucose biosensor based on open-source wireless microfluidic potentiostat. Sens. Actuators B Chem. 2019, 290, 616–624. [Google Scholar] [CrossRef]
- Ramanathan, K.; Danielsson, B. Principles and applications of thermal biosensors. Biosens. Bioelectron. 2001, 16, 417–423. [Google Scholar] [CrossRef]
- Alan, T. Improving the accuracy of temperature measurements. Sens. Rev. 2001, 21, 193–198. [Google Scholar]
- Yu, L.; Li, N. Noble metal nanoparticles-based colorimetric biosensor for visual quantification: A mini review. Chemosensors 2019, 7, 53. [Google Scholar] [CrossRef]
- Huang, X.; Xu, D.; Chen, J.; Liu, J.; Li, Y.; Song, J.; Ma, X.; Guo, J. Smartphone-based analytical biosensors. Analyst 2018, 143, 5339–5351. [Google Scholar] [CrossRef] [PubMed]
- Hemmateenejad, B.; Mobaraki, N.; Shakerizadeh-Shirazi, F.; Miri, R. Multivariate image analysis-thin layer chromatography (MIA-TLC) for simultaneous determination of co-eluting components. Analyst 2010, 135, 1747–1758. [Google Scholar] [CrossRef] [PubMed]
- Leopold, A.V.; Shcherbakova, D.M.; Verkhusha, V.V. Fluorescent Biosensors for Neurotransmission and Neuromodulation: Engineering and Applications. Front. Cell. Neurosci. 2019, 13, 474. [Google Scholar] [CrossRef] [PubMed]
- Gaviria-Arroyave, M.I.; Cano, J.B.; Peñuela, G.A. Nanomaterial-based fluorescent biosensors for monitoring environmental pollutants: A critical review. Talanta Open 2020, 2, 100006. [Google Scholar] [CrossRef]
- Van De Weert, M.; Stella, L. Fluorescence quenching and ligand binding: A critical discussion of a popular methodology. J. Mol. Struct. 2011, 998, 144–150. [Google Scholar] [CrossRef]
- Ulep, T.H.; Yoon, J.Y. Challenges in paper-based fluorogenic optical sensing with smartphones. Nano Converg. 2018, 5, 1–11. [Google Scholar] [CrossRef]
- Biological Toxin Safe Work Practices. Available online: https://www.ehs.washington.edu/resource/biological-toxin-safe-work-practices-65 (accessed on 29 August 2021).
- Singh, J.; Mehta, A. Rapid and sensitive detection of mycotoxins by advanced and emerging analytical methods: A review. Food Sci. Nutr. 2020, 8, 2183–2204. [Google Scholar] [CrossRef]
- Haque, M.A.; Wang, Y.; Shen, Z.; Li, X.; Saleemi, M.K.; He, C. Mycotoxin contamination and control strategy in human, domestic animal and poultry: A review. Microb. Pathog. 2020, 142, 104095. [Google Scholar] [CrossRef]
- Al-Jaal, B.A.; Jaganjac, M.; Barcaru, A.; Horvatovich, P.; Latiff, A. Aflatoxin, fumonisin, ochratoxin, zearalenone and deoxynivalenol biomarkers in human biological fluids: A systematic literature review, 2001–2018. Food Chem. Toxicol. 2019, 129, 211–228. [Google Scholar] [CrossRef] [PubMed]
- Chauhan, R.; Singh, J.; Sachdev, T.; Basu, T.; Malhotra, B.D. Recent advances in mycotoxins detection. Biosens. Bioelectron. 2016, 81, 532–545. [Google Scholar] [CrossRef]
- Liu, D.; Li, W.; Zhu, C.; Li, Y.; Shen, X.; Li, L.; Yan, X.; You, T. Recent progress on electrochemical biosensing of aflatoxins: A review. TrAC Trends Anal. Chem. 2020, 133, 115966. [Google Scholar] [CrossRef]
- Wannop, C.C. The Histopathology of Turkey “X” Disease in Great Britain. Avian Dis. 1961, 5, 371. [Google Scholar] [CrossRef]
- Negash, D. A Review of Aflatoxin: Occurrence, Prevention, and Gaps in Both Food and Feed Safety. J. Appl. Microb. Res. 2018, 1, 35–43. [Google Scholar] [CrossRef]
- Robertson, A. Risk of Aflatoxin Contamination Increases with Hot and Dry Growing Conditions. Available online: https://lib.dr.iastate.edu/cropnews/1383/ (accessed on 29 August 2021).
- FDA Guidance for Industry: Action Levels for Poisonous or Deleterious Substances in Human Food and Animal Feed. Available online: https://www.fda.gov/media/121202/download (accessed on 29 August 2021).
- Xue, Z.; Zhang, Y.; Yu, W.; Zhang, J.; Wang, J.; Wan, F.; Kim, Y.; Liu, Y.; Kou, X. Recent advances in aflatoxin B1 detection based on nanotechnology and nanomaterials-A review. Anal. Chim. Acta 2019, 1069, 1–27. [Google Scholar] [CrossRef] [PubMed]
- Liu, D.; Huang, Y.; Chen, M.; Wang, S.; Liu, K.; Lai, W. Rapid detection method for aflatoxin B1 in soybean sauce based on fluorescent microspheres probe. Food Control 2015, 50, 659–662. [Google Scholar] [CrossRef]
- Li, M.; Wang, H.; Sun, J.; Ji, J.; Ye, Y.; Lu, X.; Zhang, Y.; Sun, X. Rapid, on-site, and sensitive detection of aflatoxin M1 in milk products by using time-resolved fluorescence microsphere test strip. Food Control 2021, 121, 107616. [Google Scholar] [CrossRef]
- Yang, Q.; Zhu, J.; Ma, F.; Li, P.; Zhang, L.; Zhang, W.; Ding, X.; Zhang, Q. Quantitative determination of major capsaicinoids in serum by ELISA and time-resolved fluorescent immunoassay based on monoclonal antibodies. Biosens. Bioelectron. 2016, 81, 229–235. [Google Scholar] [CrossRef]
- Tang, X.; Li, P.; Zhang, Q.; Zhang, Z.; Zhang, W.; Jiang, J. Time-Resolved Fluorescence Immunochromatographic Assay Developed Using Two Idiotypic Nanobodies for Rapid, Quantitative, and Simultaneous Detection of Aflatoxin and Zearalenone in Maize and Its Products. Anal. Chem. 2017, 89, 11520–11528. [Google Scholar] [CrossRef] [PubMed]
- Wang, Q.X.; Xue, S.F.; Chen, Z.H.; Ma, S.H.; Zhang, S.; Shi, G.; Zhang, M. Dual lanthanide-doped complexes: The development of a time-resolved ratiometric fluorescent probe for anthrax biomarker and a paper-based visual sensor. Biosens. Bioelectron. 2017, 94, 388–393. [Google Scholar] [CrossRef]
- Tang, X.; Zhang, Q.; Zhang, Z.; Ding, X.; Jiang, J.; Zhang, W.; Li, P. Rapid, on-site and quantitative paper-based immunoassay platform for concurrent determination of pesticide residues and mycotoxins. Anal. Chim. Acta 2019, 1078, 142–150. [Google Scholar] [CrossRef] [PubMed]
- Wang, C.; Peng, J.; Liu, D.F.; Xing, K.Y.; Zhang, G.G.; Huang, Z.; Cheng, S.; Zhu, F.F.; Duan, M.L.; Zhang, K.Y.; et al. Lateral flow immunoassay integrated with competitive and sandwich models for the detection of aflatoxin M1 and Escherichia coli O157:H7 in milk. J. Dairy Sci. 2018, 101, 8767–8777. [Google Scholar] [CrossRef]
- Li, X.; Li, P.; Zhang, Q.; Li, R.; Zhang, W.; Zhang, Z.; Ding, X.; Tang, X. Multi-component immunochromatographic assay for simultaneous detection of aflatoxin B1, ochratoxin A and zearalenone in agro-food. Biosens. Bioelectron. 2013, 49, 426–432. [Google Scholar] [CrossRef] [PubMed]
- Kong, D.; Liu, L.; Song, S.; Suryoprabowo, S.; Li, A.; Kuang, H.; Wang, L.; Xu, C. A gold nanoparticle-based semi-quantitative and quantitative ultrasensitive paper sensor for the detection of twenty mycotoxins. Nanoscale 2016, 8, 5245–5253. [Google Scholar] [CrossRef]
- Wang, Y.; Liu, N.; Ning, B.; Liu, M.; Lv, Z.; Sun, Z.; Peng, Y.; Chen, C.; Li, J.; Gao, Z. Simultaneous and rapid detection of six different mycotoxins using an immunochip. Biosens. Bioelectron. 2012, 34, 44–50. [Google Scholar] [CrossRef]
- Zhang, G.; Zhu, C.; Huang, Y.; Yan, J.; Chen, A. A lateral flow strip based aptasensor for detection of Ochratoxin a in corn samples. Molecules 2018, 23, 291. [Google Scholar] [CrossRef] [PubMed]
- Kyung-Mi, S.; Seonghwan, L.; Changill, B. Aptamers and Their Biological Applications. Sensors 2012, 12, 612–631. [Google Scholar]
- Kasoju, A.; Shahdeo, D.; Khan, A.A.; Shrikrishna, N.S.; Mahari, S.; Alanazi, A.M.; Bhat, M.A.; Giri, J.; Gandhi, S. Fabrication of microfluidic device for Aflatoxin M1 detection in milk samples with specific aptamers. Sci. Rep. 2020, 10, 1–8. [Google Scholar] [CrossRef]
- Sheini, A. Colorimetric aggregation assay based on array of gold and silver nanoparticles for simultaneous analysis of aflatoxins, ochratoxin and zearalenone by using chemometric analysis and paper based analytical devices. Microchim. Acta 2020, 187, 1–11. [Google Scholar] [CrossRef]
- Migliorini, F.L.; dos Santos, D.M.; Soares, A.C.; Mattoso, L.H.C.; Oliveira, O.N.; Correa, D.S. Design of a low-cost and disposable paper-based immunosensor for the rapid and sensitive detection of aflatoxin B1. Chemosensors 2020, 8, 87. [Google Scholar] [CrossRef]
- Ye, Y.; Zhou, Y.; Mo, Z.; Cheng, W.; Yang, S.; Wang, X.; Chen, F. Rapid detection of aflatoxin B1 on membrane by dot-immunogold filtration assay. Talanta 2010, 81, 792–798. [Google Scholar] [CrossRef]
- Liao, J.Y.; Li, H. Lateral flow immunodipstick for visual detection of aflatoxin B1 in food using immuno-nanoparticles composed of a silver core and a gold shell. Microchim. Acta 2010, 171, 289–295. [Google Scholar] [CrossRef]
- Kasoju, A.; Shrikrishna, N.S.; Shahdeo, D.; Khan, A.A.; Alanazi, A.M.; Gandhi, S. Microfluidic paper device for rapid detection of aflatoxin B1 using an aptamer based colorimetric assay. RSC Adv. 2020, 10, 11843–11850. [Google Scholar] [CrossRef]
- Song, S.; Liu, N.; Zhao, Z.; Njumbe Ediage, E.; Wu, S.; Sun, C.; De Saeger, S.; Wu, A. Multiplex lateral flow immunoassay for mycotoxin determination. Anal. Chem. 2014, 86, 4995–5001. [Google Scholar] [CrossRef] [PubMed]
- Pirsaheb, M.; Hossini, H.; Asadi, F.; Janjani, H. A systematic review on organochlorine and organophosphorus pesticides content in water resources. Toxin Rev. 2017, 36, 210–221. [Google Scholar] [CrossRef]
- Diauudin, F.N.; Rashid, J.I.A.; Knight, V.F.; Wan Yunus, W.M.Z.; Ong, K.K.; Kasim, N.A.M.; Abdul Halim, N.; Noor, S.A.M. A review of current advances in the detection of organophosphorus chemical warfare agents based biosensor approaches. Sens. Bio-Sens. Res. 2019, 26, 100305. [Google Scholar] [CrossRef]
- Obare, S.O.; De, C.; Guo, W.; Haywood, T.L.; Samuels, T.A.; Adams, C.P.; Masika, N.O.; Murray, D.H.; Anderson, G.A.; Campbell, K.; et al. Fluorescent chemosensors for toxic organophosphorus pesticides: A review. Sensors 2010, 10, 7018–7043. [Google Scholar] [CrossRef] [PubMed]
- Gourie-Devi, M. Neurological practice: An Indian perspective. Ann. Indian Acad. Neurol. 2006, 9, 129. [Google Scholar] [CrossRef]
- Hmouda, H.; Salem, C.B.; Bouraoui, K. Management of acute organophosphorus pesticide poisoning. Lancet 2008, 371, 2169–2170. [Google Scholar] [CrossRef]
- Pundir, C.S.; Chauhan, N. Acetylcholinesterase inhibition-based biosensors for pesticide determination: A review. Anal. Biochem. 2012, 429, 19–31. [Google Scholar] [CrossRef] [PubMed]
- Kim, H.J.; Kim, Y.; Park, S.J.; Kwon, C.; Noh, H. Development of Colorimetric Paper Sensor for Pesticide Detection Using Competitive-inhibiting Reaction. Biochip J. 2018, 12, 326–331. [Google Scholar] [CrossRef]
- Fu, Q.; Zhang, C.; Xie, J.; Li, Z.; Qu, L.; Cai, X.; Ouyang, H.; Song, Y.; Du, D.; Lin, Y.; et al. Ambient light sensor based colorimetric dipstick reader for rapid monitoring organophosphate pesticides on a smart phone. Anal. Chim. Acta 2019, 1092, 126–131. [Google Scholar] [CrossRef]
- George, J.M.; Antony, A.; Mathew, B. Metal oxide nanoparticles in electrochemical sensing and biosensing: A review. Microchim. Acta 2018, 185, 1–26. [Google Scholar] [CrossRef]
- Kargozar, S.; Baino, F.; Hoseini, S.J.; Hamzehlou, S.; Darroudi, M.; Verdi, J.; Hasanzadeh, L.; Kim, H.W.; Mozafari, M. Biomedical applications of nanoceria: New roles for an old player. Nanomedicine 2018, 13, 3051–3069. [Google Scholar] [CrossRef]
- Liu, B.; Sun, Z.; Huang, P.J.J.; Liu, J. Hydrogen peroxide displacing DNA from nanoceria: Mechanism and detection of glucose in serum. J. Am. Chem. Soc. 2015, 137, 1290–1295. [Google Scholar] [CrossRef] [PubMed]
- Nouanthavong, S.; Nacapricha, D.; Henry, C.S.; Sameenoi, Y. Pesticide analysis using nanoceria-coated paper-based devices as a detection platform. Analyst 2016, 141, 1837–1846. [Google Scholar] [CrossRef]
- Chang, J.; Li, H.; Hou, T.; Li, F. Paper-based fluorescent sensor for rapid naked-eye detection of acetylcholinesterase activity and organophosphorus pesticides with high sensitivity and selectivity. Biosens. Bioelectron. 2016, 86, 971–977. [Google Scholar] [CrossRef] [PubMed]
- Wang, Q.; Yin, Q.; Fan, Y.; Zhang, L.; Xu, Y.; Hu, O.; Guo, X.; Shi, Q.; Fu, H.; She, Y. Double quantum dots-nanoporphyrin fluorescence-visualized paper-based sensors for detecting organophosphorus pesticides. Talanta 2019, 199, 46–53. [Google Scholar] [CrossRef]
- Xie, J.; Li, L.; Khan, I.M.; Wang, Z.; Ma, X. Flexible paper-based SERS substrate strategy for rapid detection of methyl parathion on the surface of fruit. Spectrochim. Acta Part A Mol. Biomol. Spectrosc. 2020, 231, 118104. [Google Scholar] [CrossRef] [PubMed]
- Xiong, S.; Deng, Y.; Zhou, Y.; Gong, D.; Xu, Y.; Yang, L.; Chen, H.; Chen, L.; Song, T.; Luo, A.; et al. Current progress in biosensors for organophosphorus pesticides based on enzyme functionalized nanostructures: A review. Anal. Methods 2018, 10, 5468–5479. [Google Scholar] [CrossRef]
- Arduini, F.; Cinti, S.; Caratelli, V.; Amendola, L.; Palleschi, G.; Moscone, D. Origami multiple paper-based electrochemical biosensors for pesticide detection. Biosens. Bioelectron. 2019, 126, 346–354. [Google Scholar] [CrossRef] [PubMed]
- Bigley, A.N.; Raushel, F.M. Catalytic mechanisms for phosphotriesterases. Biochim. Biophys. Acta Proteins Proteom. 2013, 1834, 443–453. [Google Scholar] [CrossRef] [PubMed]
- Hondred, J.A.; Breger, J.C.; Alves, N.J.; Trammell, S.A.; Walper, S.A.; Medintz, I.L.; Claussen, J.C. Printed Graphene Electrochemical Biosensors Fabricated by Inkjet Maskless Lithography for Rapid and Sensitive Detection of Organophosphates. ACS Appl. Mater. Interfaces 2018, 10, 11125–11134. [Google Scholar] [CrossRef]
- Mehta, J.; Vinayak, P.; Tuteja, S.K.; Chhabra, V.A.; Bhardwaj, N.; Paul, A.K.; Kim, K.H.; Deep, A. Graphene modified screen printed immunosensor for highly sensitive detection of parathion. Biosens. Bioelectron. 2016, 83, 339–346. [Google Scholar] [CrossRef]
- Bordbar, M.M.; Nguyen, T.A.; Arduini, F.; Bagheri, H. A paper-based colorimetric sensor array for discrimination and simultaneous determination of organophosphate and carbamate pesticides in tap water, apple juice, and rice. Microchim. Acta 2020, 187, 1–13. [Google Scholar] [CrossRef]
- Bordbar, M.M.; Nguyen, T.A.; Tran, A.Q.; Bagheri, H. Optoelectronic nose based on an origami paper sensor for selective detection of pesticide aerosols. Sci. Rep. 2020, 10, 1–12. [Google Scholar] [CrossRef]
- Wang, T.; Reid, R.C.; Minteer, S.D. A Paper-based Mitochondrial Electrochemical Biosensor for Pesticide Detection. Electroanalysis 2016, 28, 854–859. [Google Scholar] [CrossRef]
- Deng, S.; Yang, T.; Zhang, W.; Ren, C.; Zhang, J.; Zhang, Y.; Cui, T.; Yue, W. Rapid detection of trichlorfon residues by a microfluidic paper-based phosphorus-detection chip (μPPC). New J. Chem. 2019, 43, 7194–7197. [Google Scholar] [CrossRef]
- Yang, N.; Shaheen, N.; Xie, L.; Yu, J.; Ahmad, H.; Mao, H. Pesticide residues identification by optical spectrum in the time-sequence of enzyme inhibitors performed on microfluidic paper-based analytical devices (μPADs). Molecules 2019, 24, 2428. [Google Scholar] [CrossRef]
- Bridle, H.; Miller, B.; Desmulliez, M.P.Y. Application of microfluidics in waterborne pathogen monitoring: A review. Water Res. 2014, 55, 256–271. [Google Scholar] [CrossRef] [PubMed]
- Bordbar, M.M.; Tashkhourian, J.; Tavassoli, A.; Bahramali, E.; Hemmateenejad, B. Ultrafast detection of infectious bacteria using optoelectronic nose based on metallic nanoparticles. Sens. Actuators B Chem. 2020, 319, 128262. [Google Scholar] [CrossRef]
- Gregersen, T. Rapid method for distinction of gram-negative from gram-positive bacteria. Eur. J. Appl. Microbiol. Biotechnol. 1978, 5, 123–127. [Google Scholar] [CrossRef]
- Saravanan, A.; Kumar, P.S.; Hemavathy, R.V.; Jeevanantham, S.; Kamalesh, R.; Sneha, S.; Yaashikaa, P.R. Methods of detection of food-borne pathogens: A review. Environ. Chem. Lett. 2021, 19, 189–207. [Google Scholar] [CrossRef]
- Rajapaksha, P.; Elbourne, A.; Gangadoo, S.; Brown, R.; Cozzolino, D.; Chapman, J. A review of methods for the detection of pathogenic microorganisms. Analyst 2019, 144, 396–411. [Google Scholar] [CrossRef]
- Creran, B.; Li, X.; Duncan, B.; Kim, C.S.; Moyano, D.F.; Rotello, V.M. Detection of bacteria using inkjet-printed enzymatic test strips. ACS Appl. Mater. Interfaces 2014, 6, 19525–19530. [Google Scholar] [CrossRef] [PubMed]
- Jokerst, J.C.; Adkins, J.A.; Bisha, B.; Mentele, M.M.; Goodridge, L.D.; Henry, C.S. Development of a paper-based analytical device for colorimetric detection of select foodborne pathogens. Anal. Chem. 2012, 84, 2900–2907. [Google Scholar] [CrossRef]
- Suaifan, G.A.R.Y.; Alhogail, S.; Zourob, M. Rapid and low-cost biosensor for the detection of Staphylococcus aureus. Biosens. Bioelectron. 2017, 90, 230–237. [Google Scholar] [CrossRef] [PubMed]
- Sun, L.; Jiang, Y.; Pan, R.; Li, M.; Wang, R.; Chen, S.; Fu, S.; Man, C. A novel, simple and low-cost paper-based analytical device for colorimetric detection of Cronobacter spp. Anal. Chim. Acta 2018, 1036, 80–88. [Google Scholar] [CrossRef] [PubMed]
- Bagheri Pebdeni, A.; Hosseini, M. Fast and selective whole cell detection of Staphylococcus aureus bacteria in food samples by paper based colorimetric nanobiosensor using peroxidase-like catalytic activity of DNA-Au/Pt bimetallic nanoclusters. Microchem. J. 2020, 159, 105475. [Google Scholar] [CrossRef]
- Wang, Y.; Ping, J.; Ye, Z.; Wu, J.; Ying, Y. Impedimetric immunosensor based on gold nanoparticles modified graphene paper for label-free detection of Escherichia coli O157: H7. Biosens. Bioelectron. 2013, 49, 492–498. [Google Scholar] [CrossRef]
- Mo, X.; Wu, Z.; Huang, J.; Zhao, G.; Dou, W. A sensitive and regenerative electrochemical immunosensor for quantitative detection of: Escherichia coli O157:H7 based on stable polyaniline coated screen-printed carbon electrode and rGO-NR-Au@Pt. Anal. Methods 2019, 11, 1475–1482. [Google Scholar] [CrossRef]
- Khan, M.S.; Misra, S.K.; Dighe, K.; Wang, Z.; Schwartz-Duval, A.S.; Sar, D.; Pan, D. Electrically-receptive and thermally-responsive paper-based sensor chip for rapid detection of bacterial cells. Biosens. Bioelectron. 2018, 110, 132–140. [Google Scholar] [CrossRef] [PubMed]
- Hernández, R.; Vallés, C.; Benito, A.M.; Maser, W.K.; Xavier Rius, F.; Riu, J. Graphene-based potentiometric biosensor for the immediate detection of living bacteria. Biosens. Bioelectron. 2014, 54, 553–557. [Google Scholar] [CrossRef] [PubMed]
- Bhardwaj, J.; Devarakonda, S.; Kumar, S.; Jang, J. Development of a paper-based electrochemical immunosensor using an antibody-single walled carbon nanotubes bio-conjugate modified electrode for label-free detection of foodborne pathogens. Sens. Actuators B Chem. 2017, 253, 115–123. [Google Scholar] [CrossRef]
- Han, J.; Cheng, H.; Wang, B.; Braun, M.S.; Fan, X.; Bender, M.; Huang, W.; Domhan, C.; Mier, W.; Lindner, T.; et al. A Polymer/Peptide Complex-Based Sensor Array That Discriminates Bacteria in Urine. Angew. Chem. 2017, 129, 15448–15453. [Google Scholar] [CrossRef]
- Yan, P.; Ding, Z.; Li, X.; Dong, Y.; Fu, T.; Wu, Y. Colorimetric Sensor Array Based on Wulff-Type Boronate Functionalized AgNPs at Various pH for Bacteria Identification. Anal. Chem. 2019, 91, 12134–12137. [Google Scholar] [CrossRef]
- Sun, H.; Tian, F.; Liang, Z.; Sun, T.; Yu, B.; Yang, S.X.; He, Q.; Zhang, L.; Liu, X. Sensor Array Optimization of Electronic Nose for Detection of Bacteria in Wound Infection. IEEE Trans. Ind. Electron. 2017, 64, 7350–7358. [Google Scholar] [CrossRef]
- Wu, Y.; Wang, B.; Wang, K.; Yan, P. Identification of proteins and bacteria based on a metal ion-gold nanocluster sensor array. Anal. Methods 2018, 10, 3939–3944. [Google Scholar] [CrossRef]
- Svechkarev, D.; Sadykov, M.R.; Bayles, K.W.; Mohs, A.M. Ratiometric Fluorescent Sensor Array as a Versatile Tool for Bacterial Pathogen Identification and Analysis. ACS Sens. 2018, 3, 700–708. [Google Scholar] [CrossRef] [PubMed]
- Lai, S.Y.; Deffenderfer, O.F.; Hanson, W.; Phillips, M.P.; Thaler, E.R. Identification of upper respiratory bacterial pathogens with the electronic nose. Laryngoscope 2002, 112, 975–979. [Google Scholar] [CrossRef] [PubMed]
- Carey, J.R.; Suslick, K.S.; Hulkower, K.I.; Imlay, J.A.; Imlay, K.R.C.; Ingison, C.K.; Ponder, J.B.; Sen, A.; Wittrig, A.E. Rapid identification of bacteria with a disposable colorimetric sensing array. J. Am. Chem. Soc. 2011, 133, 7571–7576. [Google Scholar] [CrossRef] [PubMed]
- Lim, S.H.; Mix, S.; Xu, Z.; Taba, B.; Budvytiene, I.; Berliner, A.N.; Queralto, N.; Churi, Y.S.; Huang, R.S.; Eiden, M.; et al. Colorimetric sensor array allows fast detection and simultaneous identification of sepsis-causing bacteria in spiked blood culture. J. Clin. Microbiol. 2014, 52, 592–598. [Google Scholar] [CrossRef] [PubMed]
- Canhoto, O.; Magan, N. Electronic nose technology for the detection of microbial and chemical contamination of potable water. Sens. Actuators B Chem. 2005, 106, 3–6. [Google Scholar] [CrossRef]
- Dutta, R.; Das, A.; Stocks, N.G.; Morgan, D. Stochastic resonance-based electronic nose: A novel way to classify bacteria. Sens. Actuators B Chem. 2006, 115, 17–27. [Google Scholar] [CrossRef]
- Chen, Q.; Li, H.; Ouyang, Q.; Zhao, J. Identification of spoilage bacteria using a simple colorimetric sensor array. Sens. Actuators B Chem. 2014, 205, 1–8. [Google Scholar] [CrossRef]
- Sheini, A. A point-of-care testing sensor based on fluorescent nanoclusters for rapid detection of septicemia in children. Sens. Actuators B Chem. 2021, 328, 129029. [Google Scholar] [CrossRef]
- Ali, M.M.; Brown, C.L.; Jahanshahi-Anbuhi, S.; Kannan, B.; Li, Y.; Filipe, C.D.M.; Brennan, J.D. A Printed Multicomponent Paper Sensor for Bacterial Detection. Sci. Rep. 2017, 7, 1–10. [Google Scholar] [CrossRef]
- Sun, Y.; Chang, Y.; Zhang, Q.; Liu, M. An origami paper-based device printed with DNAzyme-containing DNA superstructures for Escherichia Coli detection. Micromachines 2019, 10, 531. [Google Scholar] [CrossRef]
- Sun, Q.; Tam, N.F.Y.; Han, J.; Yung-Kang Peng, W.; Zhu, Z.; Chen, J.L. A simple paper-based colorimetric analytical device for rapid detection of Enterococcus faecalis under the stress of chlorophenols. Talanta 2021, 225, 121966. [Google Scholar] [CrossRef]
- Silva, N.F.D.; Almeida, C.M.R.; Magalhães, J.M.C.S.; Gonçalves, M.P.; Freire, C.; Delerue-Matos, C. Development of a disposable paper-based potentiometric immunosensor for real-time detection of a foodborne pathogen. Biosens. Bioelectron. 2019, 141, 111317. [Google Scholar] [CrossRef]
- Rengaraj, S.; Cruz-Izquierdo, Á.; Scott, J.L.; Di Lorenzo, M. Impedimetric paper-based biosensor for the detection of bacterial contamination in water. Sens. Actuators B Chem. 2018, 265, 50–58. [Google Scholar] [CrossRef]
- Unnikrishnan, B.; Lien, C.-W.; Chu, H.-W.; Huang, C.-C. A review on metal nanozyme-based sensing of heavy metal ions: Challenges and future perspectives. J. Hazard. Mater. 2021, 401, 123397. [Google Scholar] [CrossRef]
- Malik, L.A.; Bashir, A.; Qureashi, A.; Pandith, A.H. Detection and removal of heavy metal ions: A review. Environ. Chem. Lett. 2019, 17, 1495–1521. [Google Scholar] [CrossRef]
- Sall, M.L.; Diaw, A.K.D.; Gningue-Sall, D.; Efremova Aaron, S.; Aaron, J.J. Toxic heavy metals: Impact on the environment and human health, and treatment with conducting organic polymers, a review. Environ. Sci. Pollut. Res. 2020, 27, 29927–29942. [Google Scholar] [CrossRef]
- Ninwong, B.; Sangkaew, P.; Hapa, P.; Ratnarathorn, N.; Menger, R.F.; Henry, C.S.; Dungchai, W. Sensitive distance-based paper-based quantification of mercury ions using carbon nanodots and heating-based preconcentration. RSC Adv. 2020, 10, 9884–9893. [Google Scholar] [CrossRef]
- Chen, G.H.; Chen, W.Y.; Yen, Y.C.; Wang, C.W.; Chang, H.T.; Chen, C.F. Detection of mercury(II) ions using colorimetric gold nanoparticles on paper-based analytical devices. Anal. Chem. 2014, 86, 6843–6849. [Google Scholar] [CrossRef] [PubMed]
- Chen, W.; Fang, X.; Li, H.; Cao, H.; Kong, J. A Simple Paper-Based Colorimetric Device for Rapid Mercury(II) Assay. Sci. Rep. 2016, 6, 1–7. [Google Scholar] [CrossRef] [PubMed]
- Cai, L.; Fang, Y.; Mo, Y.; Huang, Y.; Xu, C.; Zhang, Z.; Wang, M. Visual quantification of Hg on a microfluidic paper-based analytical device using distance-based detection technique. AIP Adv. 2017, 7, 85214. [Google Scholar] [CrossRef]
- Nashukha, H.L.; Sitanurak, J.; Sulistyarti, H.; Nacapricha, D.; Uraisin, K. Simple and equipment-free paper-based device for determination of mercury in contaminated soil. Molecules 2021, 26, 2004. [Google Scholar] [CrossRef] [PubMed]
- Quinn, C.W.; Cate, D.M.; Miller-Lionberg, D.D.; Reilly, T.; Volckens, J.; Henry, C.S. Solid-Phase Extraction Coupled to a Paper-Based Technique for Trace Copper Detection in Drinking Water. Environ. Sci. Technol. 2018, 52, 3567–3573. [Google Scholar] [CrossRef]
- Ratnarathorn, N.; Chailapakul, O.; Henry, C.S.; Dungchai, W. Simple silver nanoparticle colorimetric sensing for copper by paper-based devices. Talanta 2012, 99, 552–557. [Google Scholar] [CrossRef]
- Wang, X.; Sun, J.; Tong, J.; Guan, X.; Bian, C.; Xia, S. Paper-based sensor chip for heavy metal ion detection by SWSV. Micromachines 2018, 9, 150. [Google Scholar] [CrossRef]
- Fang, X.; Zhao, Q.; Cao, H.; Liu, J.; Guan, M.; Kong, J. Rapid detection of Cu2+ by a paper-based microfluidic device coated with bovine serum albumin (BSA)-Au nanoclusters. Analyst 2015, 140, 7823–7826. [Google Scholar] [CrossRef]
- Wang, H.; Da, L.; Yang, L.; Chu, S.; Yang, F.; Yu, S.; Jiang, C. Colorimetric fluorescent paper strip with smartphone platform for quantitative detection of cadmium ions in real samples. J. Hazard. Mater. 2020, 392, 122506. [Google Scholar] [CrossRef]
- WHO. Guidelines for Drinking-water Quality, 3rd ed.; World Health Organization: Geneva, Switzerland, 2008; Available online: https://www.who.int/water_sanitation_health/dwq/fulltext.pdf (accessed on 29 August 2021).
- López Marzo, A.M.; Pons, J.; Blake, D.A.; Merkoçi, A. All-integrated and highly sensitive paper based device with sample treatment platform for Cd2+ immunodetection in drinking/tap waters. Anal. Chem. 2013, 85, 3532–3538. [Google Scholar] [CrossRef]
- Huang, K.; Chen, Y.; Zhou, F.; Zhao, X.; Liu, J.; Mei, S.; Zhou, Y.; Jing, T. Integrated ion imprinted polymers-paper composites for selective and sensitive detection of Cd(II) ions. J. Hazard. Mater. 2017, 333, 137–143. [Google Scholar] [CrossRef]
- EPA 816-F-09-0004, United States Environmental Protection Agency. Available online: https://www.nrc.gov/docs/ML1307/ML13078A040.pdf (accessed on 29 August 2021).
- Gupta, A.; Verma, N.C.; Khan, S.; Tiwari, S.; Chaudhary, A.; Nandi, C.K. Paper strip based and live cell ultrasensitive lead sensor using carbon dots synthesized from biological media. Sens. Actuators B Chem. 2016, 232, 107–114. [Google Scholar] [CrossRef]
- Wang, H.; Yang, L.; Chu, S.; Liu, B.; Zhang, Q.; Zou, L.; Yu, S.; Jiang, C. Semiquantitative Visual Detection of Lead Ions with a Smartphone via a Colorimetric Paper-Based Analytical Device. Anal. Chem. 2019, 91, 9292–9299. [Google Scholar] [CrossRef] [PubMed]
- Pechova, A.; Pavlata, L. Chromium as an essential nutrient: A review. Vet. Med. 2007, 52, 1–18. [Google Scholar] [CrossRef]
- Elavarasi, M.; Rajeshwari, A.; Chandrasekaran, N.; Mukherjee, A. Simple colorimetric detection of Cr(III) in aqueous solutions by as synthesized citrate capped gold nanoparticles and development of a paper based assay. Anal. Methods 2013, 5, 6211–6218. [Google Scholar] [CrossRef]
- Feng, L.; Li, H.; Niu, L.Y.; Guan, Y.S.; Duan, C.F.; Guan, Y.F.; Tung, C.H.; Yang, Q.Z. A fluorometric paper-based sensor array for the discrimination of heavy-metal ions. Talanta 2013, 108, 103–108. [Google Scholar] [CrossRef] [PubMed]
- Feng, L.; Li, X.; Li, H.; Yang, W.; Chen, L.; Guan, Y. Enhancement of sensitivity of paper-based sensor array for the identification of heavy-metal ions. Anal. Chim. Acta 2013, 780, 74–80. [Google Scholar] [CrossRef] [PubMed]
- Devadhasan, J.P.; Kim, J. A chemically functionalized paper-based microfluidic platform for multiplex heavy metal detection. Sens. Actuators B Chem. 2018, 273, 18–24. [Google Scholar] [CrossRef]
- Zhang, L.; Guan, L.; Lu, Z.; Li, M.; Wu, J.; Cao, R.; Tian, J. Barrier-free patterned paper sensors for multiplexed heavy metal detection. Talanta 2019, 196, 408–414. [Google Scholar] [CrossRef] [PubMed]
- Wu, J.; Li, M.; Tang, H.; Su, J.; He, M.; Chen, G.; Guan, L.; Tian, J. Portable paper sensors for the detection of heavy metals based on light transmission-improved quantification of colorimetric assays. Analyst 2019, 144, 6382–6390. [Google Scholar] [CrossRef] [PubMed]
- Muhammad-aree, S.; Teepoo, S. On-site detection of heavy metals in wastewater using a single paper strip integrated with a smartphone. Anal. Bioanal. Chem. 2020, 412, 1395–1405. [Google Scholar] [CrossRef]
- Qi, J.; Li, B.; Wang, X.; Zhang, Z.; Wang, Z.; Han, J.; Chen, L. Three-dimensional paper-based microfluidic chip device for multiplexed fluorescence detection of Cu2+ and Hg2+ ions based on ion imprinting technology. Sens. Actuators B Chem. 2017, 251, 224–233. [Google Scholar] [CrossRef]
- Hossain, S.M.Z.; Brennan, J.D. β-Galactosidase-based colorimetric paper sensor for determination of heavy metals. Anal. Chem. 2011, 83, 8772–8778. [Google Scholar] [CrossRef]
- Wang, X.R.; Li, B.W.; You, H.Y.; Chen, L.X. An ion imprinted polymers grafted paper-based fluorescent sensor based on quantum dots for detection of Cu2+ ions. Chin. J. Anal. Chem. 2015, 43, 1499–1504. [Google Scholar] [CrossRef]
- He, K.; Zhan, X.; Liu, L.; Ruan, X.; Wu, Y. Ratiometric Fluorescent Paper-Based Sensor Based on CdTe Quantum Dots and Graphite Carbon Nitride Hybrid for Visual and Rapid Determination of Cu2+ in Drinks. Photochem. Photobiol. 2020, 96, 1154–1160. [Google Scholar] [CrossRef] [PubMed]
- Zhang, M.; Ge, L.; Ge, S.; Yan, M.; Yu, J.; Huang, J.; Liu, S. Three-dimensional paper-based electrochemiluminescence device for simultaneous detection of Pb2+ and Hg2+ based on potential-control technique. Biosens. Bioelectron. 2013, 41, 544–550. [Google Scholar] [CrossRef] [PubMed]
- Shi, J.; Tang, F.; Xing, H.; Zheng, H.; Bi, L.; Wang, W. Electrochemical detection of Pb and Cd in paper-based microfluidic devices. J. Braz. Chem. Soc. 2012, 23, 1124–1130. [Google Scholar] [CrossRef]


Publisher’s Note: MDPI stays neutral with regard to jurisdictional claims in published maps and institutional affiliations. |
© 2021 by the authors. Licensee MDPI, Basel, Switzerland. This article is an open access article distributed under the terms and conditions of the Creative Commons Attribution (CC BY) license (https://creativecommons.org/licenses/by/4.0/).
Share and Cite
Bordbar, M.M.; Sheini, A.; Hashemi, P.; Hajian, A.; Bagheri, H. Disposable Paper-Based Biosensors for the Point-of-Care Detection of Hazardous Contaminations—A Review. Biosensors 2021, 11, 316. https://doi.org/10.3390/bios11090316
Bordbar MM, Sheini A, Hashemi P, Hajian A, Bagheri H. Disposable Paper-Based Biosensors for the Point-of-Care Detection of Hazardous Contaminations—A Review. Biosensors. 2021; 11(9):316. https://doi.org/10.3390/bios11090316
Chicago/Turabian StyleBordbar, Mohammad Mahdi, Azarmidokht Sheini, Pegah Hashemi, Ali Hajian, and Hasan Bagheri. 2021. "Disposable Paper-Based Biosensors for the Point-of-Care Detection of Hazardous Contaminations—A Review" Biosensors 11, no. 9: 316. https://doi.org/10.3390/bios11090316
APA StyleBordbar, M. M., Sheini, A., Hashemi, P., Hajian, A., & Bagheri, H. (2021). Disposable Paper-Based Biosensors for the Point-of-Care Detection of Hazardous Contaminations—A Review. Biosensors, 11(9), 316. https://doi.org/10.3390/bios11090316