Urinary Volatiles and Chemical Characterisation for the Non-Invasive Detection of Prostate and Bladder Cancers

 , and
, and 
Abstract
:1. Introduction
2. Materials and Methods
2.1. Urine Samples
2.2. Analytical Devices
2.2.1. G.A.S. FlavourSpec Gas Chromatography-Ion Mobility Spectrometry (GC-IMS)
2.2.2. Markes Gas Chromatography Time-of-Flight Mass Spectrometry (GC-TOF-MS)
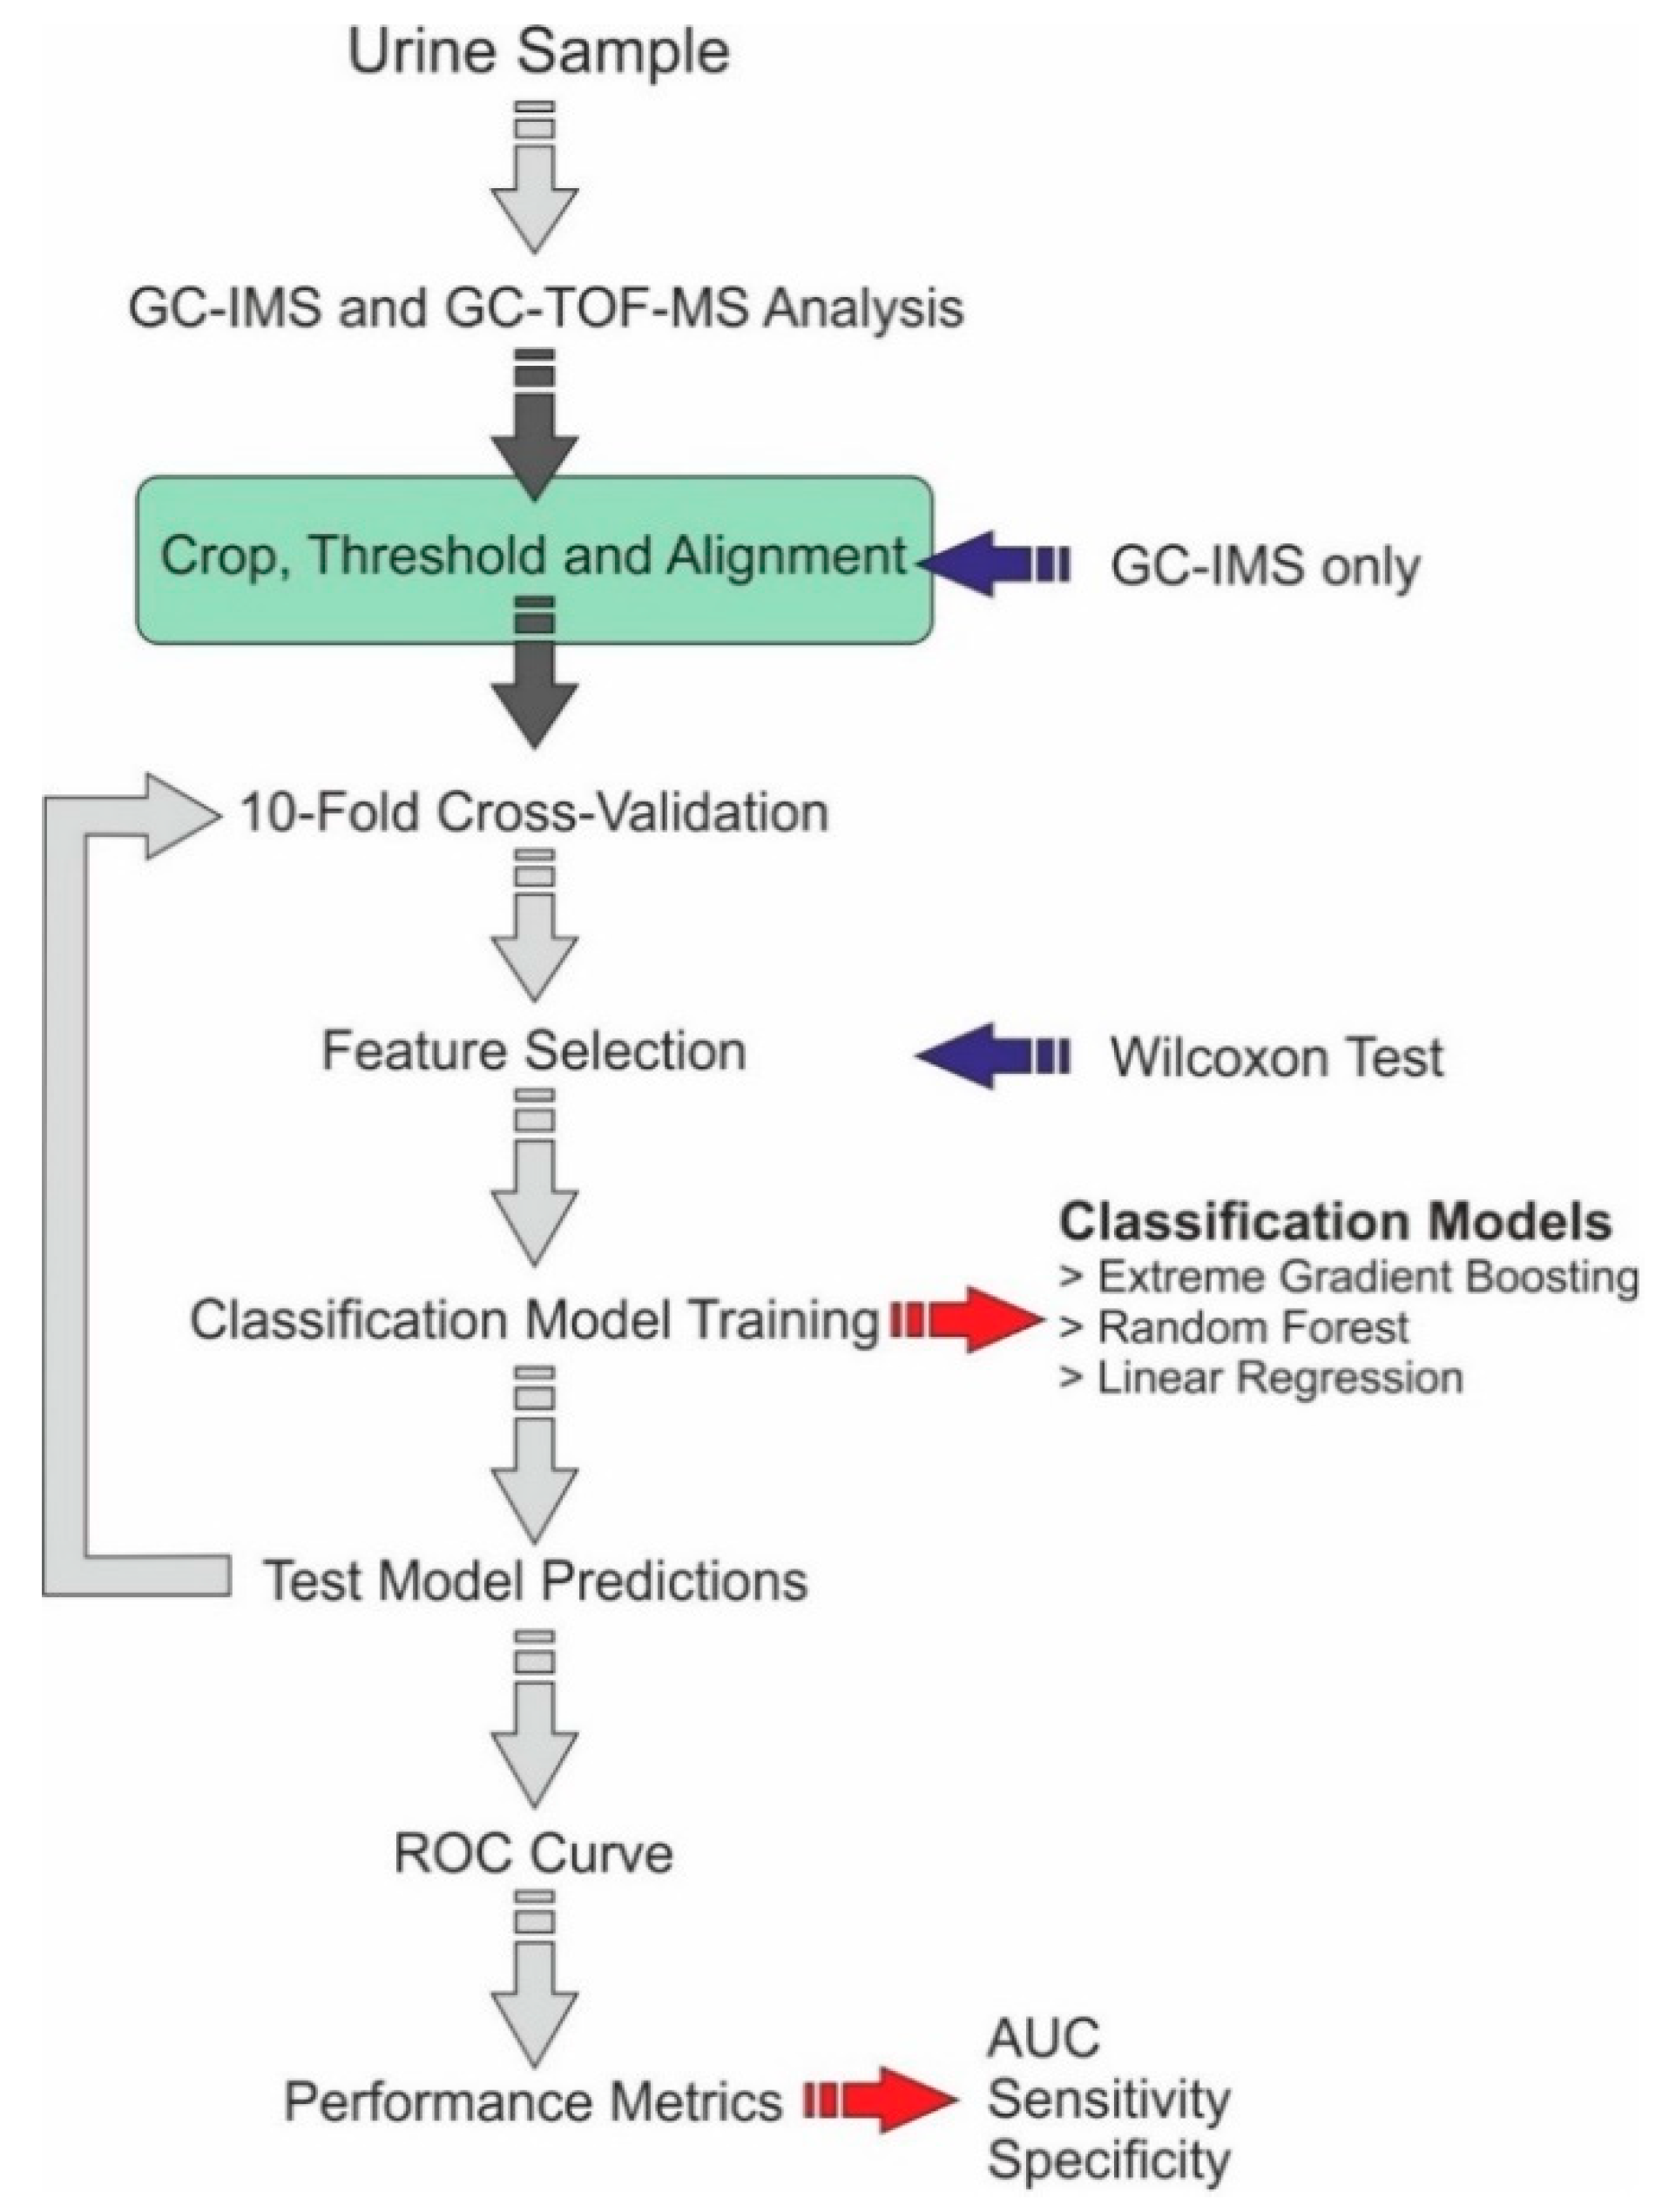
2.3. Statistical Methods
3. Results
4. Discussion
5. Conclusions
Author Contributions
Funding
Institutional Review Board Statement
Informed Consent Statement
Data Availability Statement
Conflicts of Interest
References
- Ott, J.J.; Ullrich, A.; Miller, A.B. The importance of early symptom recognition in the context of early detection and cancer survival. Eur. J. Cancer 2009, 45, 2743–2748. [Google Scholar] [CrossRef]
- de Nooijer, J.; Lechner, L.; de Vries, H. Early detection of cancer: Knowledge and behavior among Dutch adults. Cancer Detect. Prev. 2002, 26, 362–369. [Google Scholar] [CrossRef]
- Bloom, J.R. Early detection of cancer. Psychologic and social dimensions. Cancer 1994, 74, 1464–1473. [Google Scholar] [CrossRef]
- McPhail, S.D.; Johnson, S.T.; Greenberg, D.S.; Peake, M.D.; Rous, B. Stage at diagnosis and early mortality from cancer in England. Br. J. Cancer 2015, 112, S108–S115. [Google Scholar] [CrossRef] [Green Version]
- Sung, H.; Ferlay, J.; Siegel, R.L.; Laversanne, M.; Soerjomataram, I.; Jemal, A.; Bray, F. Global cancer statistics 2020: GLOBOCAN estimates of incidence and mortality worldwide for 36 cancers in 185 countries. CA A Cancer J. Clin. 2021, 71, 209–249. [Google Scholar] [CrossRef] [PubMed]
- Bray, F.; Ferlay, J.; Soerjomataram, I.; Siegel, R.L.; Torre, L.A.; Jemal, A.E. Global cancer statistics 2018: GLOBOCAN estimates of incidence and mortality worldwide for 36 cancers in 185 countries. CA A Cancer J. Clin. 2018, 68, 394–424. [Google Scholar] [CrossRef] [PubMed] [Green Version]
- Richards, M.A. The size of the prize for earlier diagnosis of cancer in England. Br. J. Cancer 2009, 101, S125–S129. [Google Scholar] [CrossRef] [Green Version]
- Saginala, K.; Barsouk, A.; Aluru, J.S.; Rawla, P.; Padala, S.A.; Barsouk, A. Epidemiology of Bladder Cancer. Med. Sci. 2020, 8, 15. [Google Scholar] [CrossRef] [Green Version]
- Richters, A.; Aben, K.K.H.; Kiemeney, L.A.L.M. The global burden of urinary bladder cancer: An update. World J. Urol. 2019, 38, 1895–1904. [Google Scholar] [CrossRef] [Green Version]
- Yafi, F.A.; Brimo, F.; Steinberg, J.; Aprikian, A.G.; Tanguay, S.; Kassouf, W. Prospective analysis of sensitivity and specificity of urinary cytology and other urinary biomarkers for bladder cancer. Urol. Oncol. Semin. Orig. Investig. 2015, 33, 66.e25–66.e31. [Google Scholar] [CrossRef]
- Planz, B.; Jochims, E.; Deix, T.; Caspers, H.P.; Jakse, G.; Boecking, A. The role of urinary cytology for detection of bladder cancer. Eur. J. Surg. Oncol. (EJSO) 2005, 31, 304–308. [Google Scholar] [CrossRef]
- Kumar, N.; Talwar, R.; Nandy, P.R. Efficacy of voided urinary cytology and ultrasonography compared to cystoscopy in the detection of urinary bladder cancer. Afr. J. Urol. 2017, 23, 192–196. [Google Scholar] [CrossRef]
- Budman, L.I.; Kassouf, W.; Steinberg, J.R. Biomarkers for detection and surveillance of bladder cancer. Can. Urol. Assoc. J. 2013, 2, 212–221. [Google Scholar] [CrossRef] [PubMed] [Green Version]
- Culp, M.B.; Soerjomataram, I.; Efstathiou, J.A.; Bray, F.; Jemal, A. Recent Global Patterns in Prostate Cancer Incidence and Mortality Rates. Eur. Urol. 2019, 77, 38–52. [Google Scholar] [CrossRef] [PubMed]
- Bleyer, A.; Spreafico, F.; Barr, R. Prostate cancer in young men: An emerging young adult and older adolescent challenge. Cancer 2020, 126, 46–57. [Google Scholar] [CrossRef] [Green Version]
- Deev, V.; Solovieva, S.; Andreev, E.; Protoshchak, V.; Karpushchenko, E.; Sleptsov, A.; Kartsova, L.; Bessonova, E.; Legin, A.; Kirsanov, D. Prostate cancer screening using chemometric processing of GC–MS profiles obtained in the headspace above urine samples. J. Chromatogr. B 2020, 1155, 122298. [Google Scholar] [CrossRef]
- van den Bergh, R.C.N.; Roemeling, S.; Roobol, M.J.; Roobol, W.; Schröder, F.H.; Bangma, C.H. Prospective Validation of Active Surveillance in Prostate Cancer: The PRIAS Study. Eur. Urol. 2007, 52, 1560–1563. [Google Scholar] [CrossRef]
- Catalona, W.J.; Smith, D.S.; Ratliff, T.L.; Dodds, K.M.; Coplen, D.E.; Yuan, J.J.; Petros, J.A.; Andriole, G.L. Measurement of Prostate-Specific Antigen in Serum as a Screening Test for Prostate Cancer. N. Engl. J. Med. 1991, 324, 1156–1161. [Google Scholar] [CrossRef]
- Schröder, F.H.; Hugosson, J.; Roobol, M.J.; Tammela, T.L.J.; Ciatto, S.; Nelen, V.; Kwiatkowski, M.; Lujan, M.; Lilja, H.; Zappa, M.; et al. Screening and Prostate-Cancer Mortality in a Randomized European Study. N. Engl. J. Med. 2009, 360, 1320–1328. [Google Scholar] [CrossRef] [PubMed] [Green Version]
- Rosario, D.J.; Lane, J.A.; Metcalfe, C.; Donovan, J.L.; Doble, A.; Goodwin, L.; Davis, M.; Catto, J.W.F.; Avery, K.; Neal, D.E.; et al. Short term outcomes of prostate biopsy in men tested for cancer by prostate specific antigen: Prospective evaluation within ProtecT study. BMJ 2012, 344, d7894. [Google Scholar] [CrossRef] [Green Version]
- Wade, J.; Rosario, D.J.; Macefield, R.C.; Avery, K.N.; Salter, C.E.; Goodwin, M.L.; Blazeby, J.M.; Lane, J.A.; Metcalfe, C.; Neal, D.E. Psychological impact of prostate biopsy: Physical symptoms, anxiety, and depression. J. Clin. Oncol. 2013, 31, 4235–4241. [Google Scholar] [CrossRef]
- Mottet, N.; Bellmunt, J.; Bolla, M.; Briers, E.; Cumberbatch, M.G.; De Santis, M.; Fossati, N.; Gross, T.; Henry, A.M.; Joniau, S.; et al. EAU-ESTRO-SIOG Guidelines on Prostate Cancer. Part 1: Screening, Diagnosis, and Local Treatment with Curative Intent. Eur. Urol. 2017, 71, 618–629. [Google Scholar] [CrossRef]
- Williams, H.; Pembroke, A. Sniffer dogs in the melanoma clinic? Lancet 1989, 333, 734. [Google Scholar] [CrossRef]
- Chang, J.-E.; Lee, D.-S.; Ban, S.-W.; Oh, J.; Jung, M.Y.; Kim, S.-H.; Park, S.; Persaud, K.; Jheon, S. Analysis of volatile organic compounds in exhaled breath for lung cancer diagnosis using a sensor system. Sensors Actuators B Chem. 2018, 255, 800–807. [Google Scholar] [CrossRef]
- Bond, A.; Greenwood, R.; Lewis, S.; Corfe, B.; Sarkar, S.; O’Toole, P.; Rooney, P.; Burkitt, M.; Hold, G.; Probert, C. Volatile organic compounds emitted from faeces as a biomarker for colorectal cancer. Aliment. Pharmacol. Ther. 2019, 49, 1005–1012. [Google Scholar] [CrossRef]
- Arasaradnam, R.P.; Wicaksono, A.; O’Brien, H.; Kocher, H.M.; Covington, J.A.; Crnogorac-Jurcevic, T. Noninvasive diagnosis of pancreatic cancer through detection of volatile organic compounds in urine. Gastroenterology 2018, 154, 485–487. [Google Scholar] [CrossRef] [PubMed] [Green Version]
- Staff, P.O. Correction: Detection of Colorectal Cancer (CRC) by Urinary Volatile Organic Compound Analysis. PLoS ONE 2015, 10, e0118975. [Google Scholar]
- Becker, R. Non-invasive cancer detection using volatile biomarkers: Is urine superior to breath? Med. Hypotheses 2020, 143, 110060. [Google Scholar] [CrossRef]
- Cauchi, M.; Weber, C.M.; Bolt, B.J.; Spratt, P.B.; Bessant, C.; Turner, D.C.; Willis, C.M.; Britton, L.E.; Turner, C.; Morgan, G. Evaluation of gas chromatography mass spectrometry and pattern recognition for the identification of bladder cancer from urine headspace. Anal. Methods 2016, 8, 4037–4046. [Google Scholar] [CrossRef] [Green Version]
- Renshaw, A.A.; Nappi, D.; Weinberg, D.S. Cytology of Grade 1 Papillary Transitional Cell Carcinoma. Acta Cytol. 1996, 40, 676–682. [Google Scholar] [CrossRef] [PubMed]
- Raab, S.S.; Grzybicki, D.M.; Vrbin, C.M.; Geisinger, K.R. Urine cytology discrepancies: Frequency, causes, and outcomes. Am. J. Clin. Pathol. 2007, 127, 946–953. [Google Scholar] [CrossRef]
- Muus Ubago, J.; Mehta, V.; Wojcik, E.M.; Barkan, G.A. Evaluation of atypical urine cytology progression to malignancy. Cancer Cytopathol. 2013, 121, 387–391. [Google Scholar] [CrossRef]
- Chang, K.L.; Ho, P.C. Gas Chromatography Time-Of-Flight Mass Spectrometry (GC-TOF-MS)-Based Metabolomics for Comparison of Caffeinated and Decaffeinated Coffee and Its Implications for Alzheimer’s Disease. PLoS ONE 2014, 9, e104621. [Google Scholar] [CrossRef] [Green Version]
- Rudnicka, J.; Kowalkowski, T.; Ligor, T.; Buszewski, B. Determination of volatile organic compounds as biomarkers of lung cancer by SPME–GC–TOF/MS and chemometrics. J. Chromatogr. B 2011, 879, 3360–3366. [Google Scholar] [CrossRef]
- Tiele, A.; Wicaksono, A.; Daulton, E.; Ifeachor, E.; Eyre, V.; Clarke, S.; Timings, L.; Pearson, S.; Covington, J.A.; Li, X. Breath-based non-invasive diagnosis of Alzheimer’s disease: A pilot study. J. Breath Res. 2020, 14, 26003. [Google Scholar] [CrossRef]
- Bosch, S.; Bot, R.; Wicaksono, A.; Savelkoul, E.; van der Hulst, R.; Kuijvenhoven, J.; Stokkers, P.; Daulton, E.; Covington, J.A.; de Meij, T.G.J.; et al. Early detection and follow-up of colorectal neoplasia based on faecal volatile organic compounds. Colorectal Dis. 2020, 22, 1119–1129. [Google Scholar] [CrossRef]
- Esfahani, S.; Sagar, N.M.; Kyrou, I.; Mozdiak, E.; O’Connell, N.; Nwokolo, C.; Bardhan, K.D.; Arasaradnam, R.P.; Covington, J.A. Variation in Gas and Volatile Compound Emissions from Human Urine as It Ages, Measured by an Electronic Nose. Biosensors 2016, 6, 4. [Google Scholar] [CrossRef] [PubMed] [Green Version]
- Epstein, J.I.; Egevad, L.; Amin, M.B.; Delahunt, B.; Srigley, J.R.; Humphrey, P.A. The 2014 International Society of Urological Pathology (ISUP) consensus conference on Gleason grading of prostatic carcinoma. Am. J. Surg. Pathol. 2016, 40, 244–252. [Google Scholar] [CrossRef] [PubMed]
- Mostofi, F.K. Histological typing of urinary bladder tumors. Int. Histol. Classif. Tumors 1973, 17. Available online: https://apps.who.int/iris/handle/10665/41533 (accessed on 16 October 2021).
- Haley, L.V.; Romeskie, J.M. Development of an explosives detection system using fast GC-IMS technology. In Proceedings of the IEEE 32nd Annual 1998 International Carnahan Conference on Security Technology (Cat. No.98CH36209), Alexandria, VA, USA, 12–14 October 1998; pp. 59–64. [Google Scholar] [CrossRef]
- Cook, G.W.; LaPuma, P.T.; Hook, G.L.; Eckenrode, B.A. Using Gas Chromatography with Ion Mobility Spectrometry to Resolve Explosive Compounds in the Presence of Interferents*. J. Forensic Sci. 2010, 55, 1582–1591. [Google Scholar] [CrossRef]
- Kwan, C.; Snyder, A.P.; Erickson, R.P.; Smith, P.A.; Maswadeh, W.M.; Ayhan, B.; Jensen, J.L.; Jensen, J.O.; Tripathi, A. Chemical Agent Detection Using GC-IMS: A Comparative Study. IEEE Sensors J. 2010, 10, 451–460. [Google Scholar] [CrossRef]
- Moura, P.C.; Vassilenko, V.; Fernandes, J.M.; Santos, P.H. Indoor and Outdoor Air Profiling with GC-IMS. In Doctoral Conference on Computing, Electrical and Industrial Systems; Springer: Berlin/Heidelberg, Germany, 2020. [Google Scholar]
- Allers, M.; Langejuergen, J.; Gaida, A.; Holz, O.; Schuchardt, S.; Hohlfeld, J.M.; Zimmermann, S. Measurement of exhaled volatile organic compounds from patients with chronic obstructive pulmonary disease (COPD) using closed gas loop GC-IMS and GC-APCI-MS. J. Breath Res. 2016, 10, 26004. [Google Scholar] [CrossRef]
- Tiele, A.; Wicaksono, A.; Kansara, J.; Arasaradnam, R.P.; Covington, J.A. Breath Analysis Using eNose and Ion Mobility Technology to Diagnose Inflammatory Bowel Disease—A Pilot Study. Biosensors 2019, 9, 55. [Google Scholar] [CrossRef] [PubMed] [Green Version]
- Rouvroye, M.D.; Wicaksono, A.; Bosch, S.; Savelkoul, E.; Covington, J.A.; Beaumont, H.; Mulder, C.J.; Bouma, G.; de Meij, T.G.J.; de Boer, N.K.H. Faecal Scent as a Novel Non-Invasive Biomarker to Discriminate between Coeliac Disease and Refractory Coeliac Disease: A Proof of Principle Study. Biosensors 2019, 9, 69. [Google Scholar] [CrossRef] [PubMed] [Green Version]
- Valli, E.; Panni, F.; Casadei, E.; Barbieri, S.; Cevoli, C.; Bendini, A.; García-González, D.L.; Gallina Toschi, T. An HS-GC-IMS Method for the Quality Classification of Virgin Olive Oils as Screening Support for the Panel Test. Foods 2020, 9, 657. [Google Scholar] [CrossRef] [PubMed]
- Wang, S.; Chen, H.; Sun, B. Recent progress in food flavor analysis using gas chromatography–ion mobility spectrometry (GC–IMS). Food Chem. 2020, 315, 126158. [Google Scholar] [CrossRef]
- Zhang, X.; Dai, Z.; Fan, X.; Liu, M.; Ma, J.; Shang, W.; Liu, J.; Strappe, P.; Blanchard, C.; Zhou, Z. A study on volatile metabolites screening by HS-SPME-GC-MS and HS-GC-IMS for discrimination and characterization of white and yellowed rice. Cereal Chem. 2020, 97, 496–504. [Google Scholar] [CrossRef]
- Haley, L.V.; Romeskie, J.M. GC-IMS: A technology for many applications. Proc. SPIE 1998, 3575, 375–383. [Google Scholar] [CrossRef]
- Kanu, A.B.; Hill, H.H. Ion mobility spectrometry detection for gas chromatography. J. Chromatogr. A 2008, 1177, 12–27. [Google Scholar] [CrossRef]
- Denawaka, C.J.; Fowlis, I.A.; Dean, J.R. Evaluation and application of static headspace–multicapillary column-gas chromatography–ion mobility spectrometry for complex sample analysis. J. Chromatogr. A 2014, 1338, 136–148. [Google Scholar] [CrossRef] [PubMed] [Green Version]
- Ferrer, I.; Thurman, E.M. Liquid chromatography/time-of-flight/mass spectrometry (LC/TOF/MS) for the analysis of emerging contaminants. TrAC Trends Anal. Chem. 2003, 22, 750–756. [Google Scholar] [CrossRef]
- Weber, C.M.; Cauchi, M.; Patel, M.; Bessant, C.; Turner, C.; Britton, L.E.; Willis, C.M. Evaluation of a gas sensor array and pattern recognition for the identification of bladder cancer from urine headspace. Analyst 2011, 136, 359–364. [Google Scholar] [CrossRef] [Green Version]
- Khalid, T.; White, P.; De Lacy Costello, B.; Persad, R.; Ewen, R.; Johnson, E.; Probert, C.S.; Ratcliffe, N. A Pilot Study Combining a GC-Sensor Device with a Statistical Model for the Identification of Bladder Cancer from Urine Headspace. PLoS ONE 2013, 8, e69602. [Google Scholar] [CrossRef] [Green Version]
- Gao, Q.; Lee, W.-Y. Urinary metabolites for urological cancer detection: A review on the application of volatile organic compounds for cancers. Am. J. Clin. Exp. Urol. 2019, 7, 232–248. [Google Scholar]
- Lima, A.R.; Pinto, J.; Carvalho-Maia, C.; Jerónimo, C.; Henrique, R.; Bastos, M.D.; Carvalho, M.; Guedes de Pinho, P. A Panel of Urinary Volatile Biomarkers for Differential Diagnosis of Prostate Cancer from Other Urological Cancers. Cancers 2020, 12, 2017. [Google Scholar] [CrossRef]
- Kurata, Y.; Asamoto, M.; Hagiwara, A.; Masui, T.; Fukushima, S. Promoting effects of various agents in rat urinary bladder carcinogenesis initiated by N-butyl-N-(4-hydroxybutyl)nitrosamine. Cancer Lett. 1986, 32, 125–135. [Google Scholar] [CrossRef]
- Boyes, W.K.; Bingham, E.; Cohrssen, B.; Powell, C.H. Neurotoxicology and behavior. In Patty’s Toxicology; Wiley: Hoboken, NJ, USA, 2001. [Google Scholar]
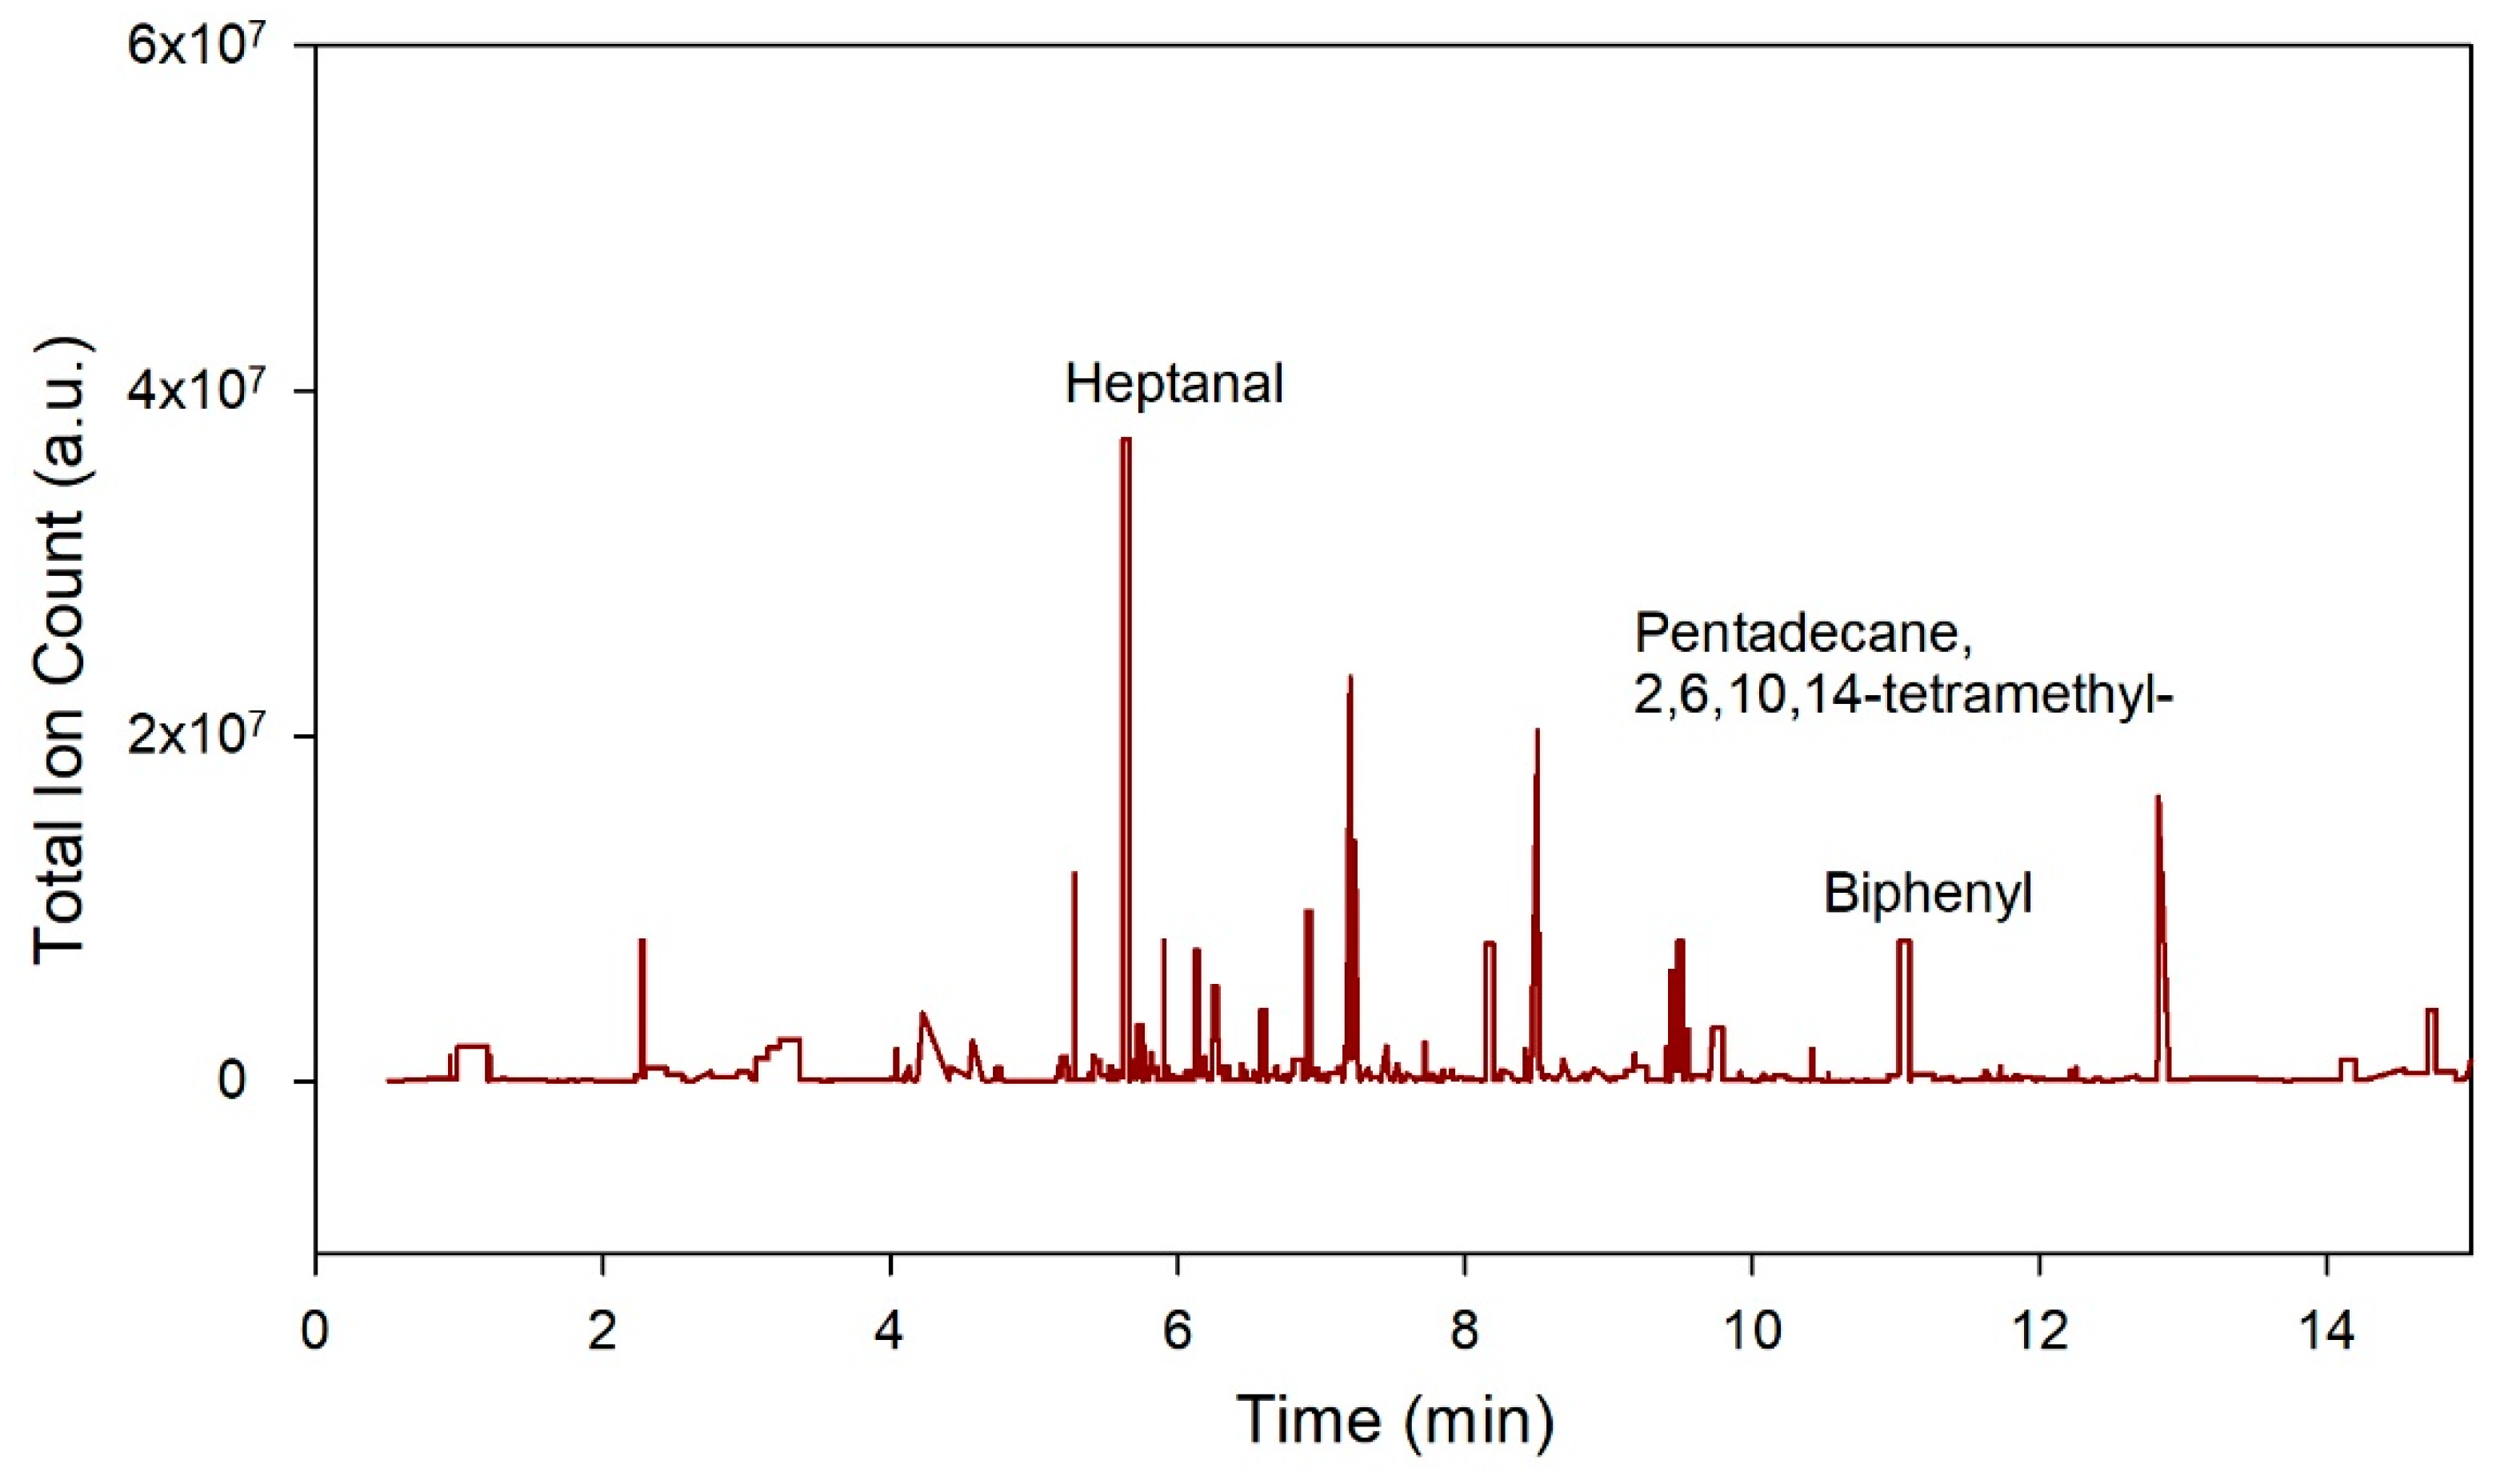
- Heptanal. Available online: https://pubchem.ncbi.nlm.nih.gov/compound/Heptanal (accessed on 16 October 2021).
- Wishart, D.S.; Tzur, D.; Knox, C.; Eisner, R.; Guo, A.C.; Young, N.; Cheng, D.; Jewell, K.; Arndt, D.; Sawhney, S.; et al. HMDB: The Human Metabolome Database. Nucleic Acids Res. 2007, 35, D521–D526. [Google Scholar] [CrossRef] [PubMed]
- National Center for Biotechnology Information. PubChem Compound Summary for CID 15979, Pristane. Available online: https://pubchem.ncbi.nlm.nih.gov/compound/Pristane (accessed on 16 October 2021).
- Rodrigues, D.; Pinto, J.; Araújo, A.M.; Monteiro-Reis, S.; Jerónimo, C.; Henrique, R.; de Lourdes Bastos, M.; de Pinho, P.G.; Carvalho, M. Volatile metabolomic signature of bladder cancer cell lines based on gas chromatography–mass spectrometry. Metabolomics 2018, 14, 62. [Google Scholar] [CrossRef] [PubMed]
- Peng, G.; Hakim, M.; Broza, Y.Y.; Billan, S.; Abdah-Bortnyak, R.; Kuten, A.; Tisch, U.; Haick, H. Detection of lung, breast, colorectal, and prostate cancers from exhaled breath using a single array of nanosensors. Br. J. Cancer 2010, 103, 542–551. [Google Scholar] [CrossRef]
- Chung, W.-G.; Yu, I.-J.; Park, C.-S.; Lee, K.-H.; Roh, H.-K.; Cha, Y.-N. Decreased formation of ethoxyacetic acid from ethylene glycol monoethyl ether and reduced atrophy of testes in male rats upon combined administration with toluene and xylene. Toxicol. Lett. 1999, 104, 143–150. [Google Scholar] [CrossRef]
- Yu, I.-J.; Lee, J.-Y.; Chung, Y.-H.; Kim, K.-J.; Han, J.-H.; Cha, G.-Y.; Chung, W.-G.; Cha, Y.-N.; Park, J.-D.; Lee, Y.-M.; et al. Co-administration of toluene and xylene antagonized the testicular toxicity but not the hematopoietic toxicity caused by ethylene glycol monoethyl ether in Sprague–Dawley rats. Toxicol. Lett. 1999, 109, 11–20. [Google Scholar] [CrossRef]
- Smith, S.; White, P.; Redding, J.; Ratcliffe, N.M.; Probert, C.S.J. Application of Similarity Coefficients to Predict Disease Using Volatile Organic Compounds. IEEE Sens. J. 2010, 10, 92–96. [Google Scholar] [CrossRef]
- Jiménez-Pacheco, A.; Salinero-Bachiller, M.; Iribar, M.C.; López-Luque, A.; Miján-Ortiz, J.L.; Peinado, J.M. Furan and p-xylene as candidate biomarkers for prostate cancer. Urol. Oncol. Semin. Orig. Investig. 2018, 36, 243.e221–243.e227. [Google Scholar] [CrossRef] [PubMed]
- Wu, H.; Liu, T.; Ma, C.; Xue, R.; Deng, C.; Zeng, H.; Shen, X. GC/MS-based metabolomic approach to validate the role of urinary sarcosine and target biomarkers for human prostate cancer by microwave-assisted derivatization. Anal. Bioanal. Chem. 2011, 401, 635–646. [Google Scholar] [CrossRef] [PubMed]
- Lima, A.R.; Pinto, J.; Azevedo, A.I.; Barros-Silva, D.; Jerónimo, C.; Henrique, R.; de Lourdes Bastos, M.; Guedes de Pinho, P.; Carvalho, M. Identification of a biomarker panel for improvement of prostate cancer diagnosis by volatile metabolic profiling of urine. Br. J. Cancer 2019, 121, 857–868. [Google Scholar] [CrossRef]
- Phillips, M.; Gleeson, K.; Hughes, J.M.B.; Greenberg, J.; Cataneo, R.N.; Baker, L.; McVay, W.P. Volatile organic compounds in breath as markers of lung cancer: A cross-sectional study. Lancet 1999, 353, 1930–1933. [Google Scholar] [CrossRef]
- Cai, X.; Chen, L.; Kang, T.; Tang, Y.; Lim, T.; Xu, M.; Hui, H. A Prediction Model with a Combination of Variables for Diagnosis of Lung Cancer. Med. Sci. Monit. Int. Med J. Exp. Clin. Res. 2017, 23, 5620–5629. [Google Scholar] [CrossRef] [Green Version]
- Belugina, R.; Karpushchenko, E.; Sleptsov, A.; Protoshchak, V.; Legin, A.; Kirsanov, D. Developing non-invasive bladder cancer screening methodology through potentiometric multisensor urine analysis. Talanta 2021, 234, 122696. [Google Scholar] [CrossRef] [PubMed]
- Kim, Y.-H.; Kim, K.-H. A novel method to quantify the emission and conversion of VOCs in the smoking of electronic cigarettes. Sci. Rep. 2015, 5, 16383. [Google Scholar] [CrossRef] [PubMed]
- Charles, S.M.; Batterman, S.; Jia, C. Composition and emissions of VOCs in main-and side-stream smoke of research cigarettes. Atmos. Environ. 2007, 41, 5371–5384. [Google Scholar] [CrossRef]
- McWilliams, A.; Beigi, P.; Srinidhi, A.; Lam, S.; MacAulay, C.E. Sex and Smoking Status Effects on the Early Detection of Early Lung Cancer in High-Risk Smokers Using an Electronic Nose. IEEE Trans. Biomed. Eng. 2015, 62, 2044–2054. [Google Scholar] [CrossRef] [PubMed]


| Group | Bladder Cancer | Prostate Cancer | Non-Cancerous |
|---|---|---|---|
| Number of samples | 15 | 55 | 36 |
| Mean Age (years) | 70.0 | 71.9 | 62.5 |
| Sex: Male/Female | 12:3 | All Male | 24:12 |
| Mean BMI (Kg/m2) | 24.4 | 27.5 | 30.9 |
| Current Smoker n (% of patients) | 1 (6.7%) | 6 (10.9%) | 3 (8.3%) |
| Mean PSA level (ng/mL) | - | 20.6 (3.6–153.90) | - |
| Gleason score | - | Case 01 4 + 5 = 9 Case 02 3 + 4 = 7 Case 03 3 + 3 = 6 Case 04 4 + 5 = 9 Case 05 4 + 5 = 9 Case 06 3 + 4 = 7 Case 07 3 + 4 = 7 Case 08 3 + 5 = 8 Case 09 5 + 4 = 9 Case 10 3 + 4 = 7 Case 11 3 + 3 = 6 Case 12 3 + 4 = 7 Case 13 3 + 3 = 6 Case 14 4 + 5 = 9 Case 15 3 + 4 = 7 Case 16 3 + 4 = 7 Case 17 3 + 4 = 7 Case 18 3 + 4 = 7 Case 19 3 + 4 = 7 Case 20 3 + 3 = 6 Case 21 4 + 5 = 9 Case 22 3 + 3 = 6 Case 23 4 + 3 = 7 Case 24 3 + 4 = 7 Case 25 4 + 4 = 8 Case 26 3 + 3 = 6 Case 27 4 + 5 = 9 Case 28 4 + 4 = 8 Case 29 3 + 3 = 6 Case 30 3 + 3 = 6 Case 31 4 + 4 = 8 Case 32 3 + 4 = 7 Case 33 4 + 5 = 9 Case 34 3 + 4 = 7 Case 35 3 + 4 = 7 Case 36 3 + 4 = 7 Case 37 3 + 4 = 7 Case 38 3 + 5 = 8 Case 39 4 + 5 = 9 Case 40 3 + 4 = 7 Case 41 3 + 4 = 7 Case 42 3 + 4 = 7 Case 43 3 + 5 = 8 Case 44 3 + 4 = 7 Case 45 5 + 5 = 10 Case 46 4 + 5 = 9 Case 47 4 + 4 = 8 Case 48 3 + 4 = 7 Case 49 4 + 3 = 7 Case 50 3 + 3 = 6 Case 51 4 + 5 = 9 Case 52 4 + 4 + 8 Case 53 3 + 3 = 6 Case 54 3 + 4 = 7 Case 55 3 + 3 = 6 | - |
| WHO 1973 Grade | Case 01 G2 Case 02 G3 Case 03 G3 Case 04 G1 Case 05 G2 Case 06 G3 Case 07 G1 Case 08 G3 Case 09 G3 Case 10 G1 Case 11 G3 Case 12 G1 Case 13 G1 Case 14 G2 Case 15 G1 | - | - |
| Prostate cancer Gleason grading: Score ≤ 6, pattern ≤ 3 + 3. This refers to Grade 1. Tumour cells look like normal prostate cells with only individual discrete well-formed glands. Score 7, pattern 3 + 4. This refers to Grade 2. Tumour with well-form glands and lesser component of poorly differentiated glands. Score 7, pattern 4 + 3. This refers to Grade 3. Tumour has predominantly poorly formed/fused/cribriform glands with lesser component of well-formed glands. Score 8, pattern 4 + 4, 3 + 5 and 5 + 3. This refers to Grade 4. Tumour with only poorly formed/fused/cribriform glands. Score 9 or 10, pattern 4 + 5, 5 + 4 and 5 + 5. This refers to Grade 5. Tumour lacking gland formation (or with necrosis) with or without poorly formed/fused/cribriform glands [38]. G1 low grade differentiation, G2 moderate grade differentiation and G3 is high grade differentiation [39]. | |||
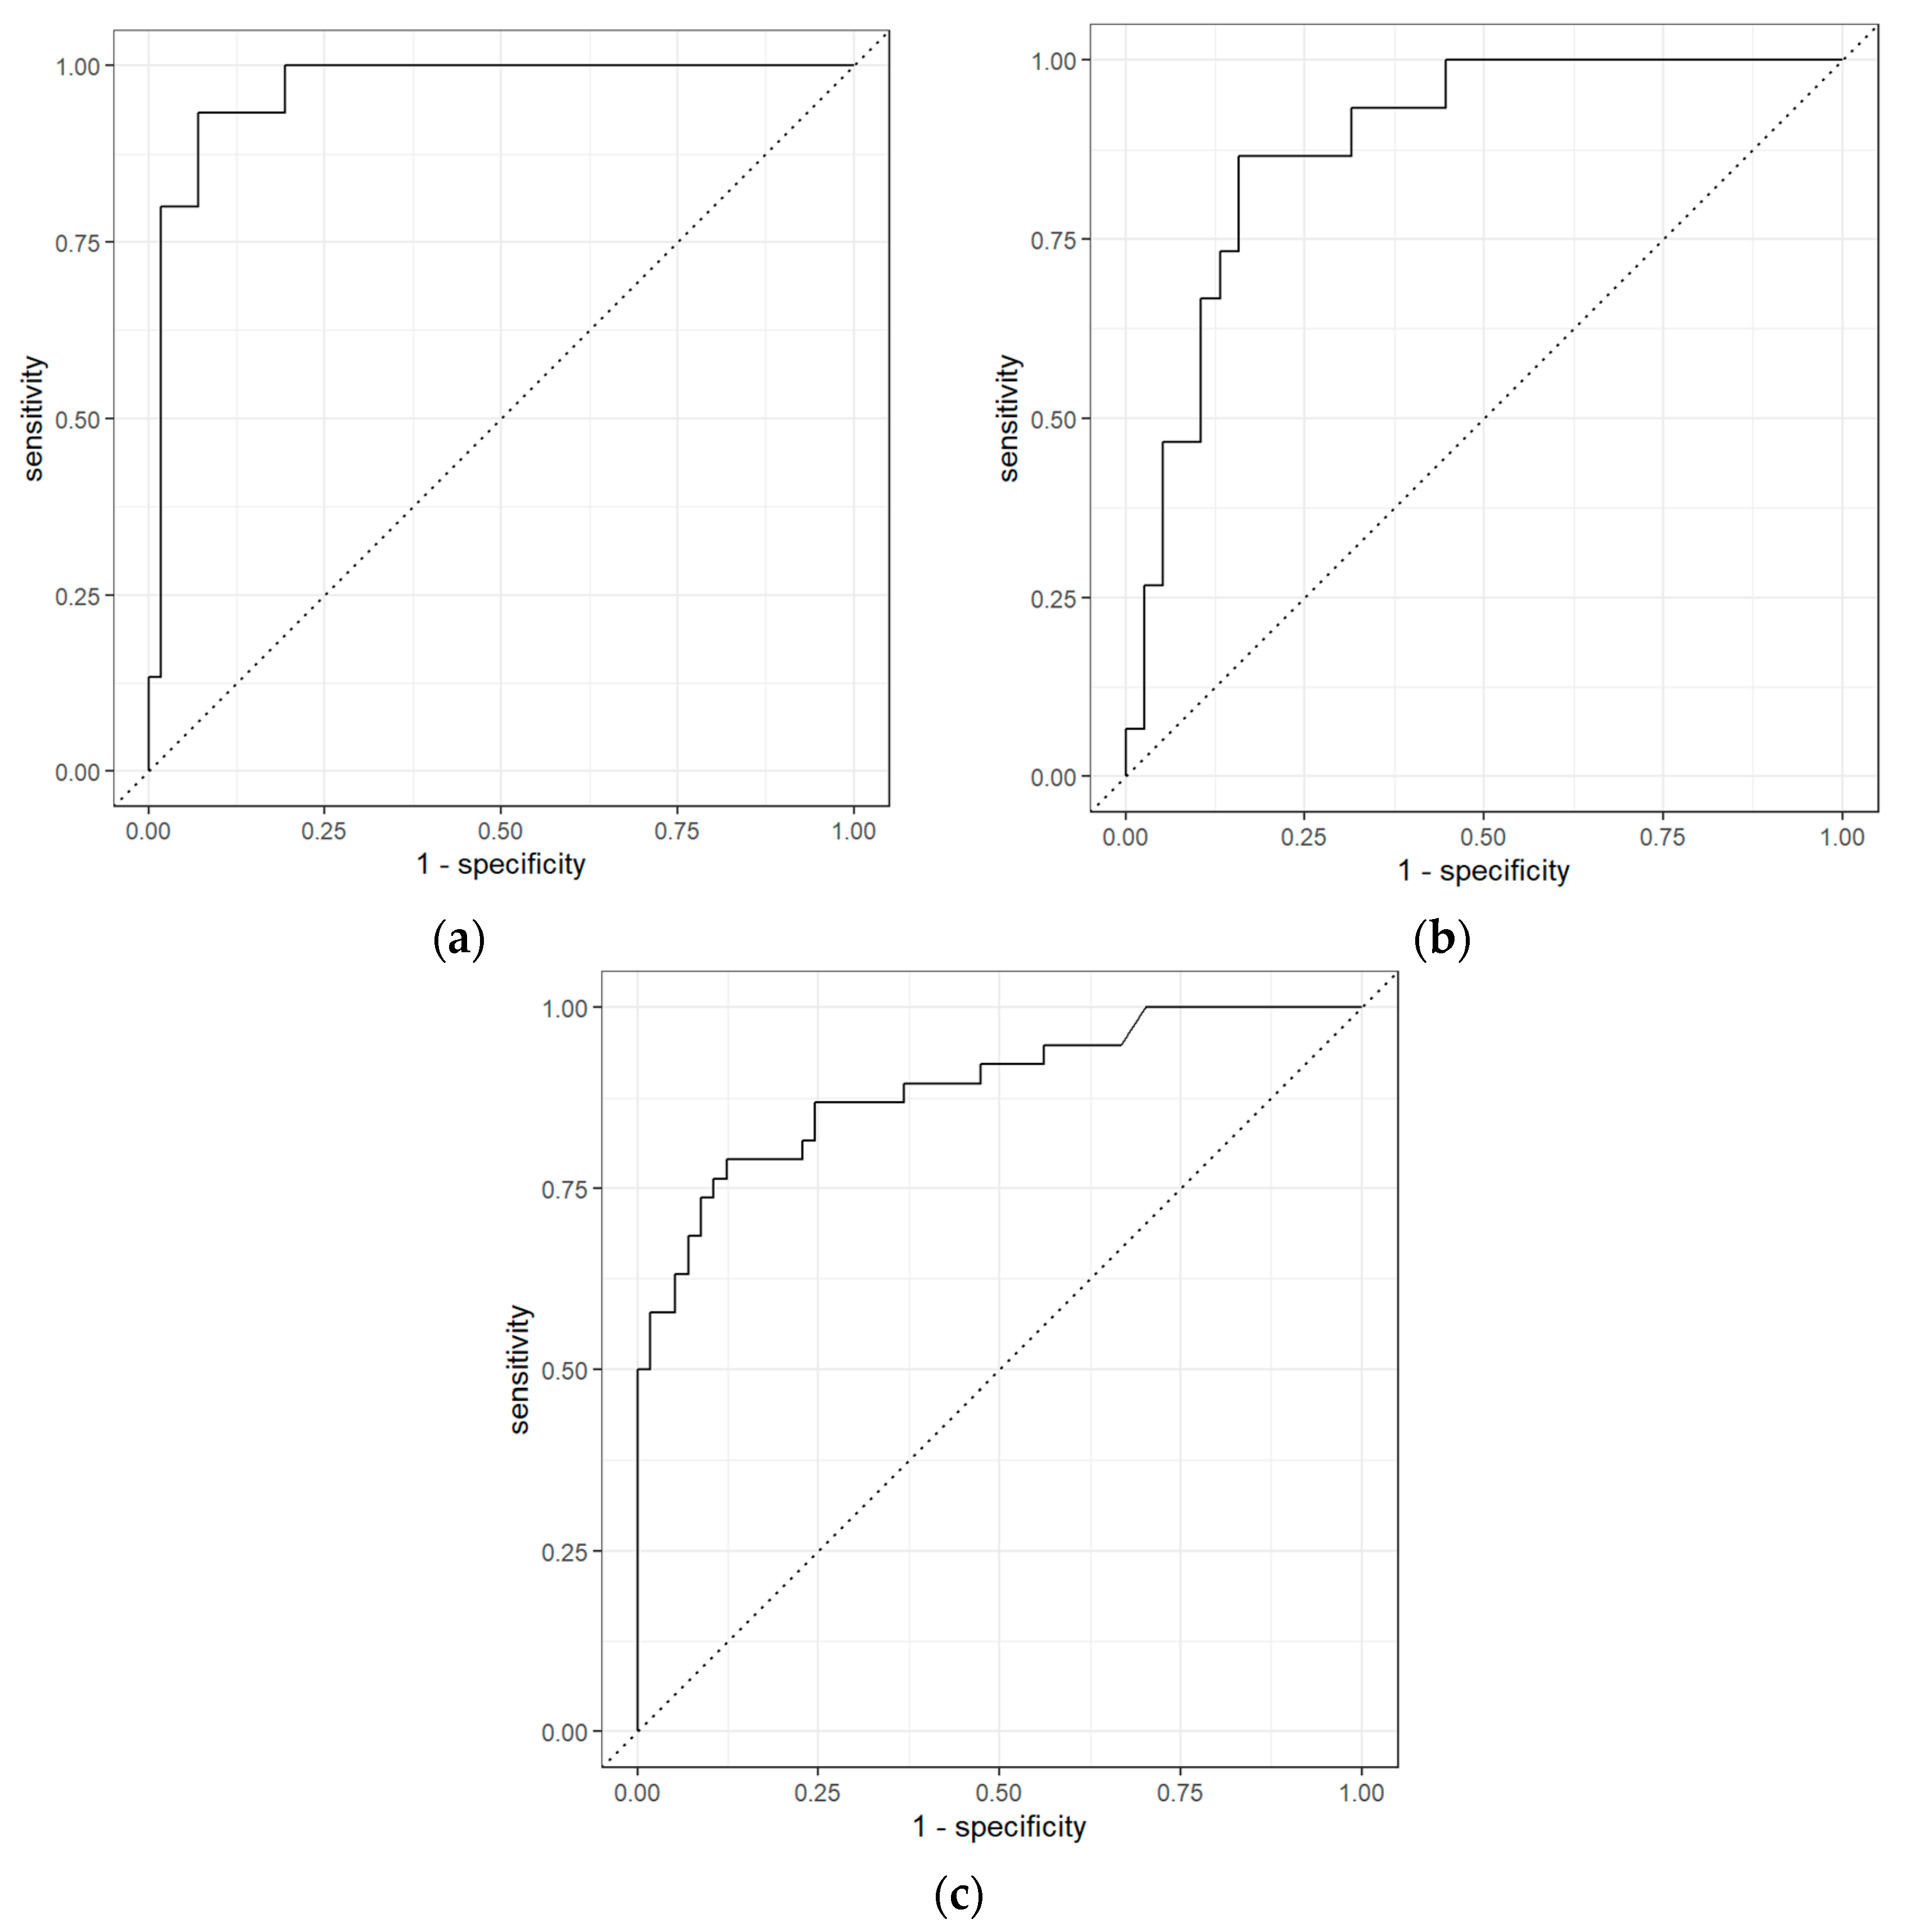
| Comparisons | Classifiers | AUC | Sensitivity | Specificity | PPV | NPV |
|---|---|---|---|---|---|---|
| BCa vs. PCa | Logistic Regression with Elastic Net Regularization | 0.97 (0.93–1.00) | 0.60 (0.38–0.80) | 0.98 (0.95–1.00) | 0.90 | 0.90 |
| BCa vs. non-Cancerous | Logistic Regression with Elastic Net Regularization | 0.95 (0.90–0.99) | 0.87 (0.70–1.00) | 0.92 (0.84–0.98) | 0.81 | 0.95 |
| PCa vs. non-Cancerous | Extreme Gradient Boosting | 0.89 (0.83–0.94) | 0.76 (0.64–0.88) | 0.88 (0.80–0.95) | 0.81 | 0.85 |
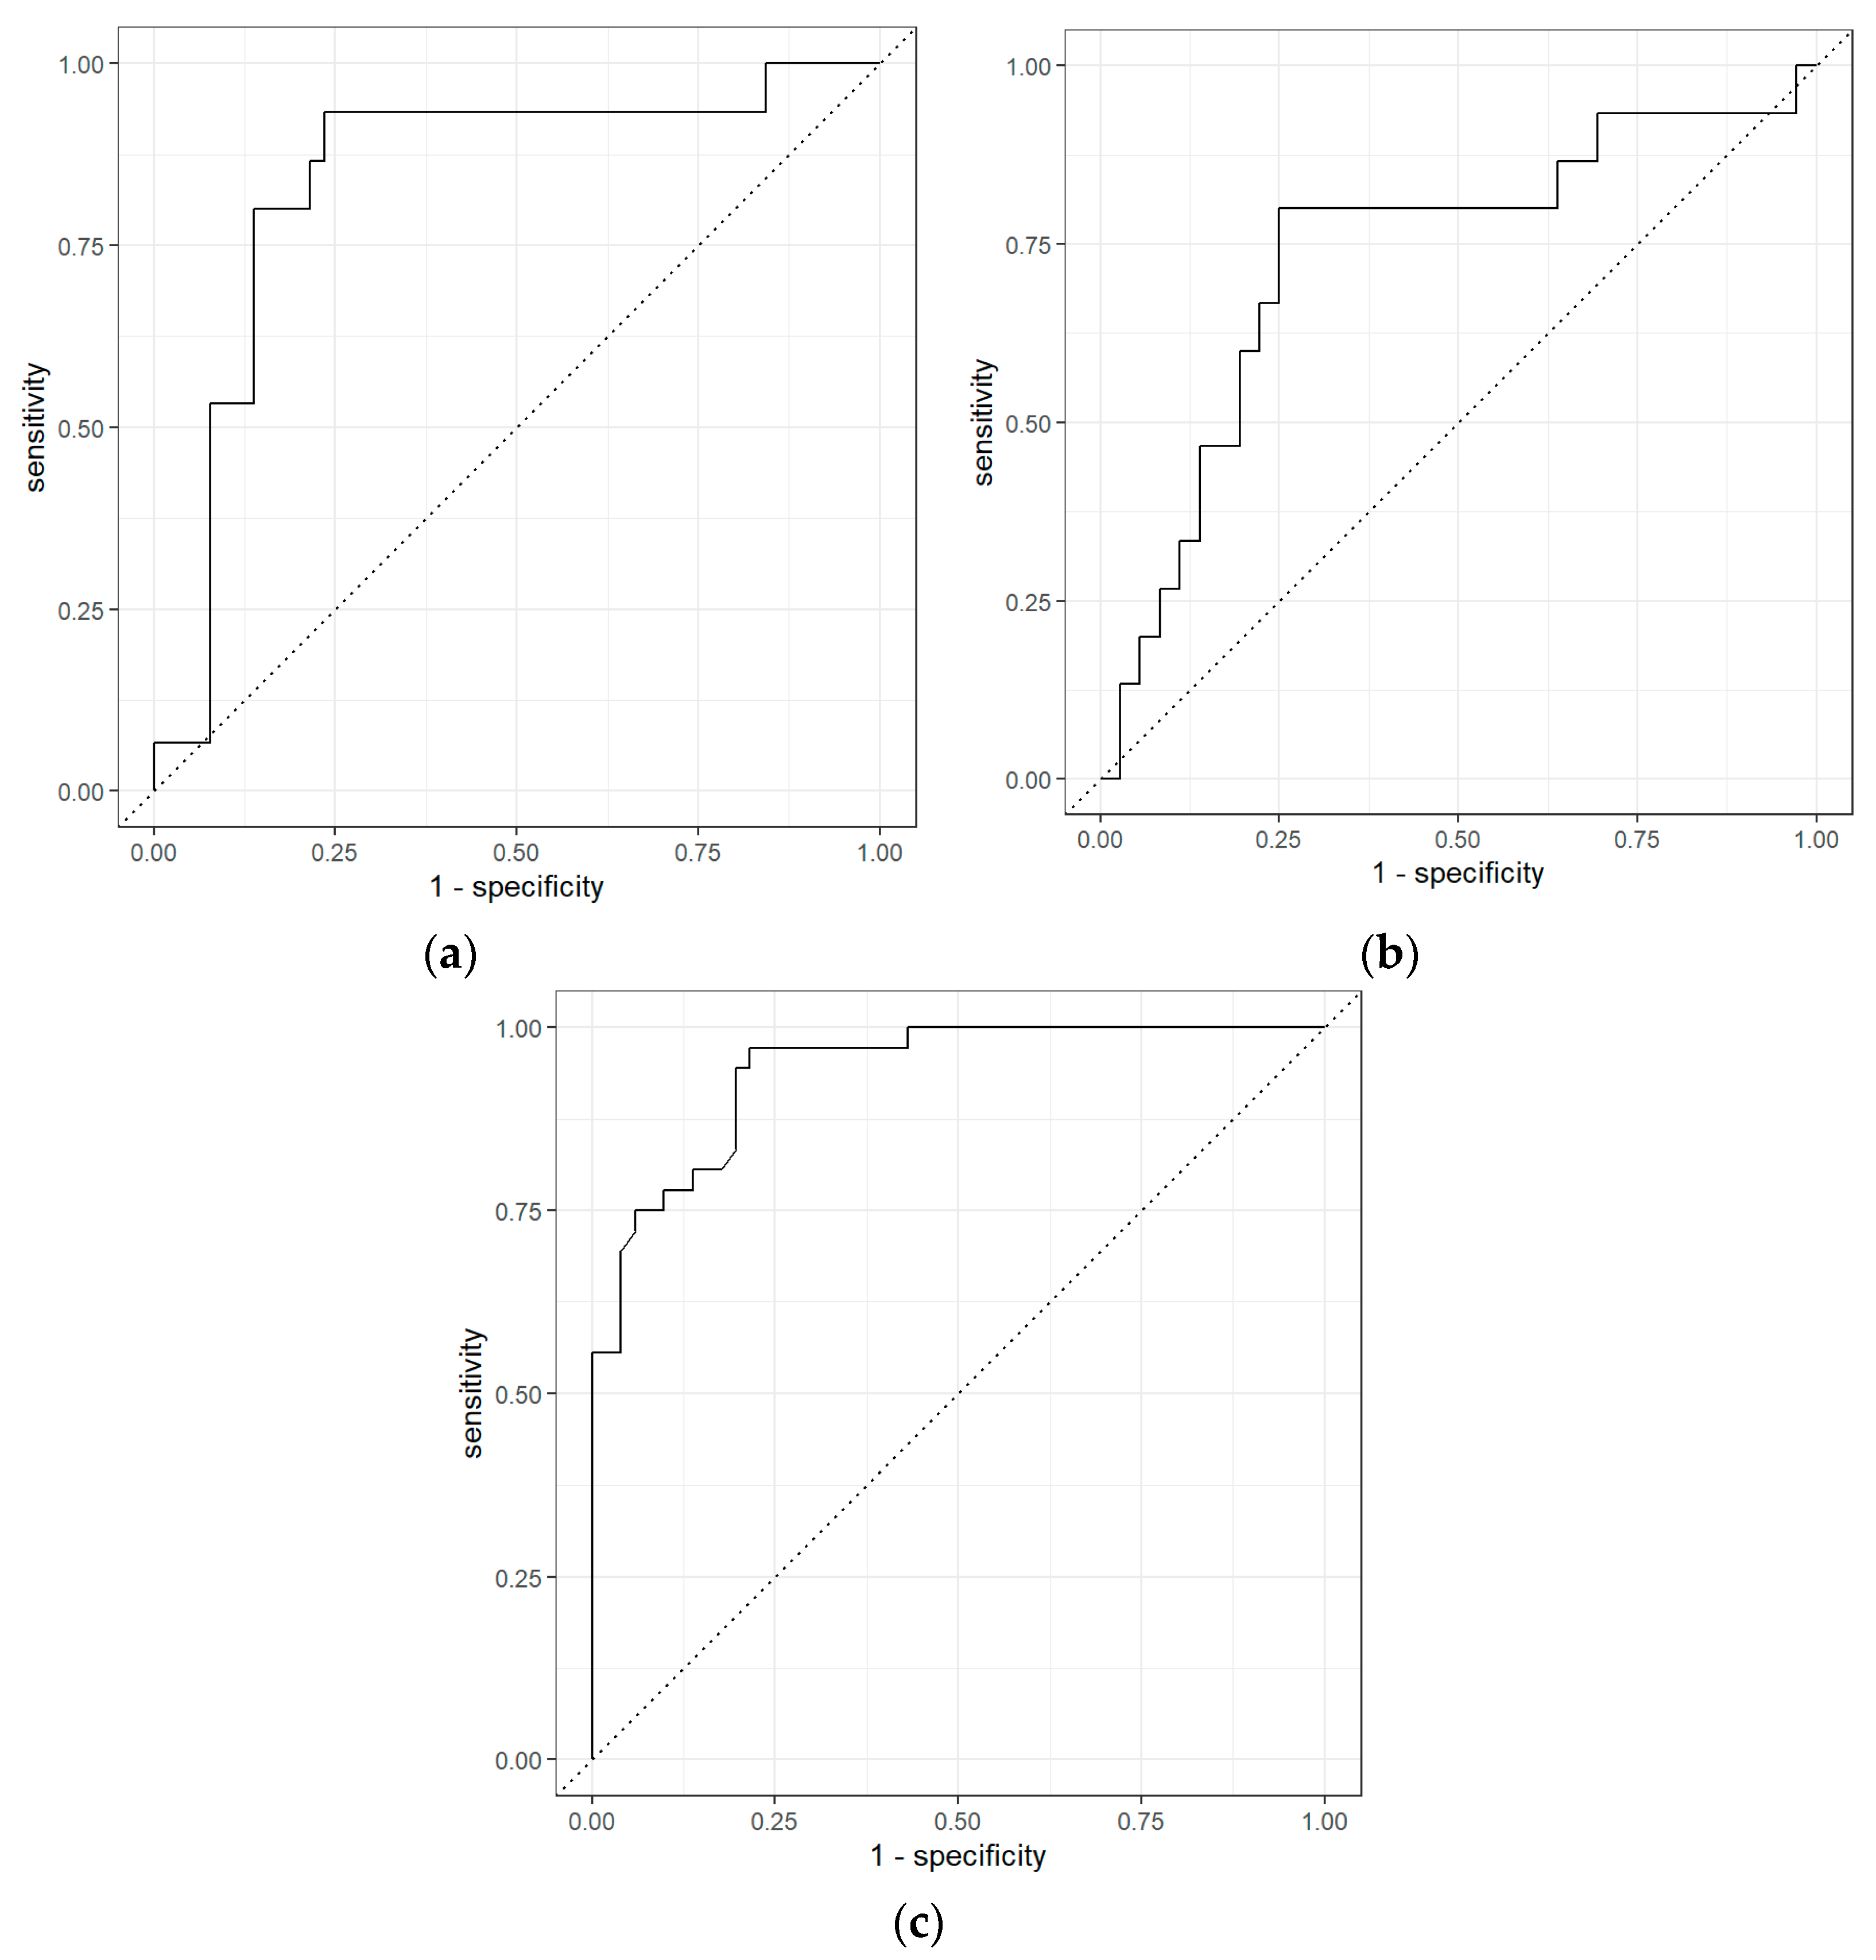
| Comparisons | Classifiers | AUC | Sensitivity | Specificity | PPV | NPV |
|---|---|---|---|---|---|---|
| BCa vs. PCa | Logistic Regression with Elastic Net Regularization | 0.84 (0.73–0.93) | 0.53 (0.33–0.75) | 0.90 (0.83–0.96) | 0.62 | 0.87 |
| BCa vs. non-Cancerous | Random Forest | 0.81 (0.70–0.90) | 0.27 (0.09–0.46) | 0.94 (0.88–1.00) | 0.33 | 0.71 |
| PCa vs. Non-Cancerous | Random Forest | 0.94 (0.90–0.97) | 0.78 (0.66–0.89) | 0.88 (0.80–0.95) | 0.82 | 0.85 |
| Chemicals | p-Values | Molecular Weight (g/mol) | |
|---|---|---|---|
| 1 | Biphenyl | <0.01 | 154.21 |
| 2 | Nonanal | <0.01 | 142.24 |
| 3 | Tetradecane | <0.01 | 198.39 |
| 4 | Pentadecane, 2,6,10,14-tetramethyl- | 0.012 | 268.5 |
| 5 | 2-Pentanone | 0.012 | 86.13 |
| 6 | Undecane | 0.014 | 156.31 |
| 7 | 4-Heptanone | 0.018 | 114.19 |
| 8 | Dodecane | 0.025 | 170.33 |
| 9 | Hexadecane | 0.026 | 226.44 |
| 10 | Heptanal | 0.026 | 114.19 |
| 11 | Methyl Isobutyl Ketone | 0.045 | 100.16 |
| 12 | Naphthalene | 0.046 | 128.169 |
| 13 | Benzoic acid | 0.049 | 122.12 |
| Chemicals | p-Values | Molecular Weight (g/mol) | |
|---|---|---|---|
| 1 | Toluene | <0.01 | 92.14 |
| 2 | Phenol | <0.01 | 325.4 |
| 3 | Acetic acid | <0.01 | 60.05 |
| 4 | 1-Hexanol, 2-ethyl- | 0.011 | 130.229 |
| 5 | Disulfide, dimethyl | 0.012 | 94.2 |
| 6 | Cyclopentanone, 2-methyl- | 0.017 | 98.14 |
| 7 | Pyrrole | 0.033 | 67.09 |
| Chemicals | p-Values | Molecular Weight (g/mol) | |
|---|---|---|---|
| 1 | Toluene | <0.01 | 92.14 |
| 2 | Methyl Isobutyl Ketone | <0.01 | 100.16 |
| 3 | Dodecane | <0.01 | 170.33 |
| 4 | Phenol | <0.01 | 325.4 |
| 5 | Cyclopentanone, 2-methyl- | <0.01 | 98.14 |
| 6 | 2-Hexanone | <0.01 | 100.16 |
| 7 | Heptanal | <0.01 | 114.19 |
| 8 | p-Xylene | <0.01 | 106.16 |
| 9 | Nonane, 3-methyl- | <0.01 | 142.28 |
| 10 | Tetradecane | <0.01 | 198.39 |
| 11 | Nonanal | <0.01 | 142.24 |
| 12 | Biphenyl | 0.019 | 154.21 |
| 13 | Acetic acid | 0.025 | 60.05 |
| 14 | 2-Pentanone | 0.032 | 86.13 |
Publisher’s Note: MDPI stays neutral with regard to jurisdictional claims in published maps and institutional affiliations. |
© 2021 by the authors. Licensee MDPI, Basel, Switzerland. This article is an open access article distributed under the terms and conditions of the Creative Commons Attribution (CC BY) license (https://creativecommons.org/licenses/by/4.0/).
Share and Cite
Tyagi, H.; Daulton, E.; Bannaga, A.S.; Arasaradnam, R.P.; Covington, J.A. Urinary Volatiles and Chemical Characterisation for the Non-Invasive Detection of Prostate and Bladder Cancers. Biosensors 2021, 11, 437. https://doi.org/10.3390/bios11110437
Tyagi H, Daulton E, Bannaga AS, Arasaradnam RP, Covington JA. Urinary Volatiles and Chemical Characterisation for the Non-Invasive Detection of Prostate and Bladder Cancers. Biosensors. 2021; 11(11):437. https://doi.org/10.3390/bios11110437
Chicago/Turabian StyleTyagi, Heena, Emma Daulton, Ayman S. Bannaga, Ramesh P. Arasaradnam, and James A. Covington. 2021. "Urinary Volatiles and Chemical Characterisation for the Non-Invasive Detection of Prostate and Bladder Cancers" Biosensors 11, no. 11: 437. https://doi.org/10.3390/bios11110437
APA StyleTyagi, H., Daulton, E., Bannaga, A. S., Arasaradnam, R. P., & Covington, J. A. (2021). Urinary Volatiles and Chemical Characterisation for the Non-Invasive Detection of Prostate and Bladder Cancers. Biosensors, 11(11), 437. https://doi.org/10.3390/bios11110437