Instrumenting Polyodon spathula (Paddlefish) Rostra in Flowing Water with Strain Gages and Accelerometers

Abstract
1. Introduction
2. Approach and Design
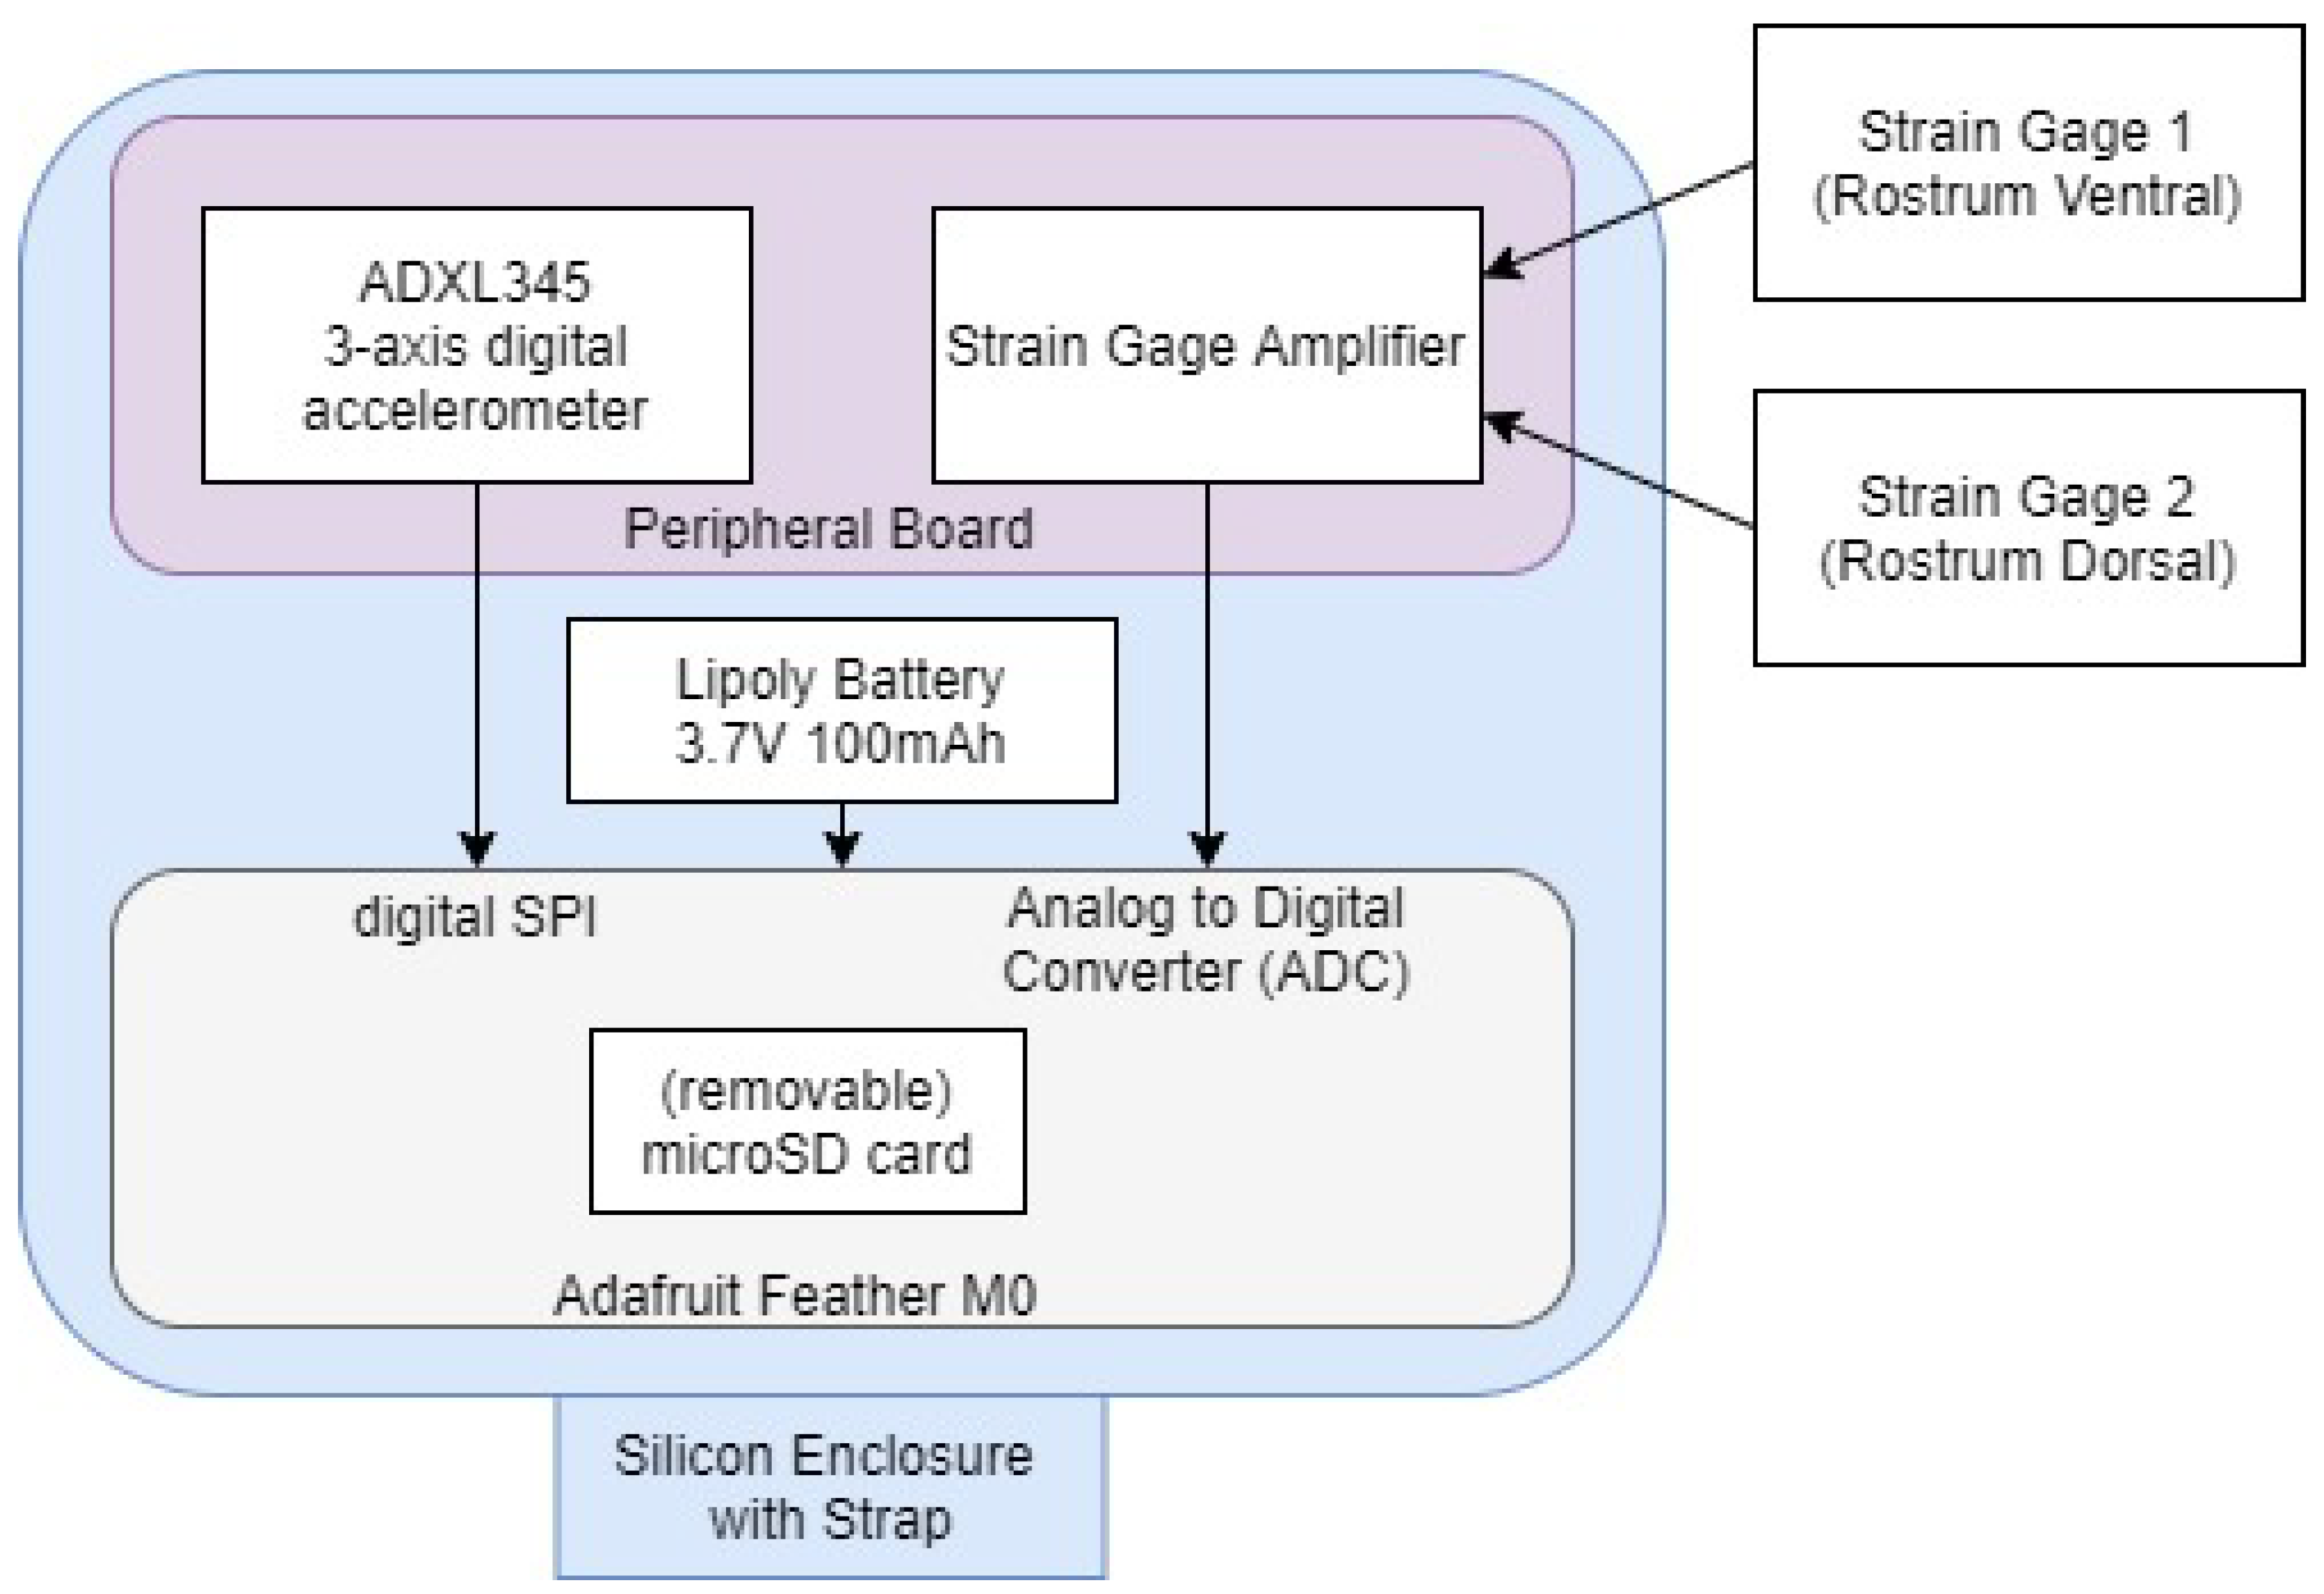
2.1. Measurement
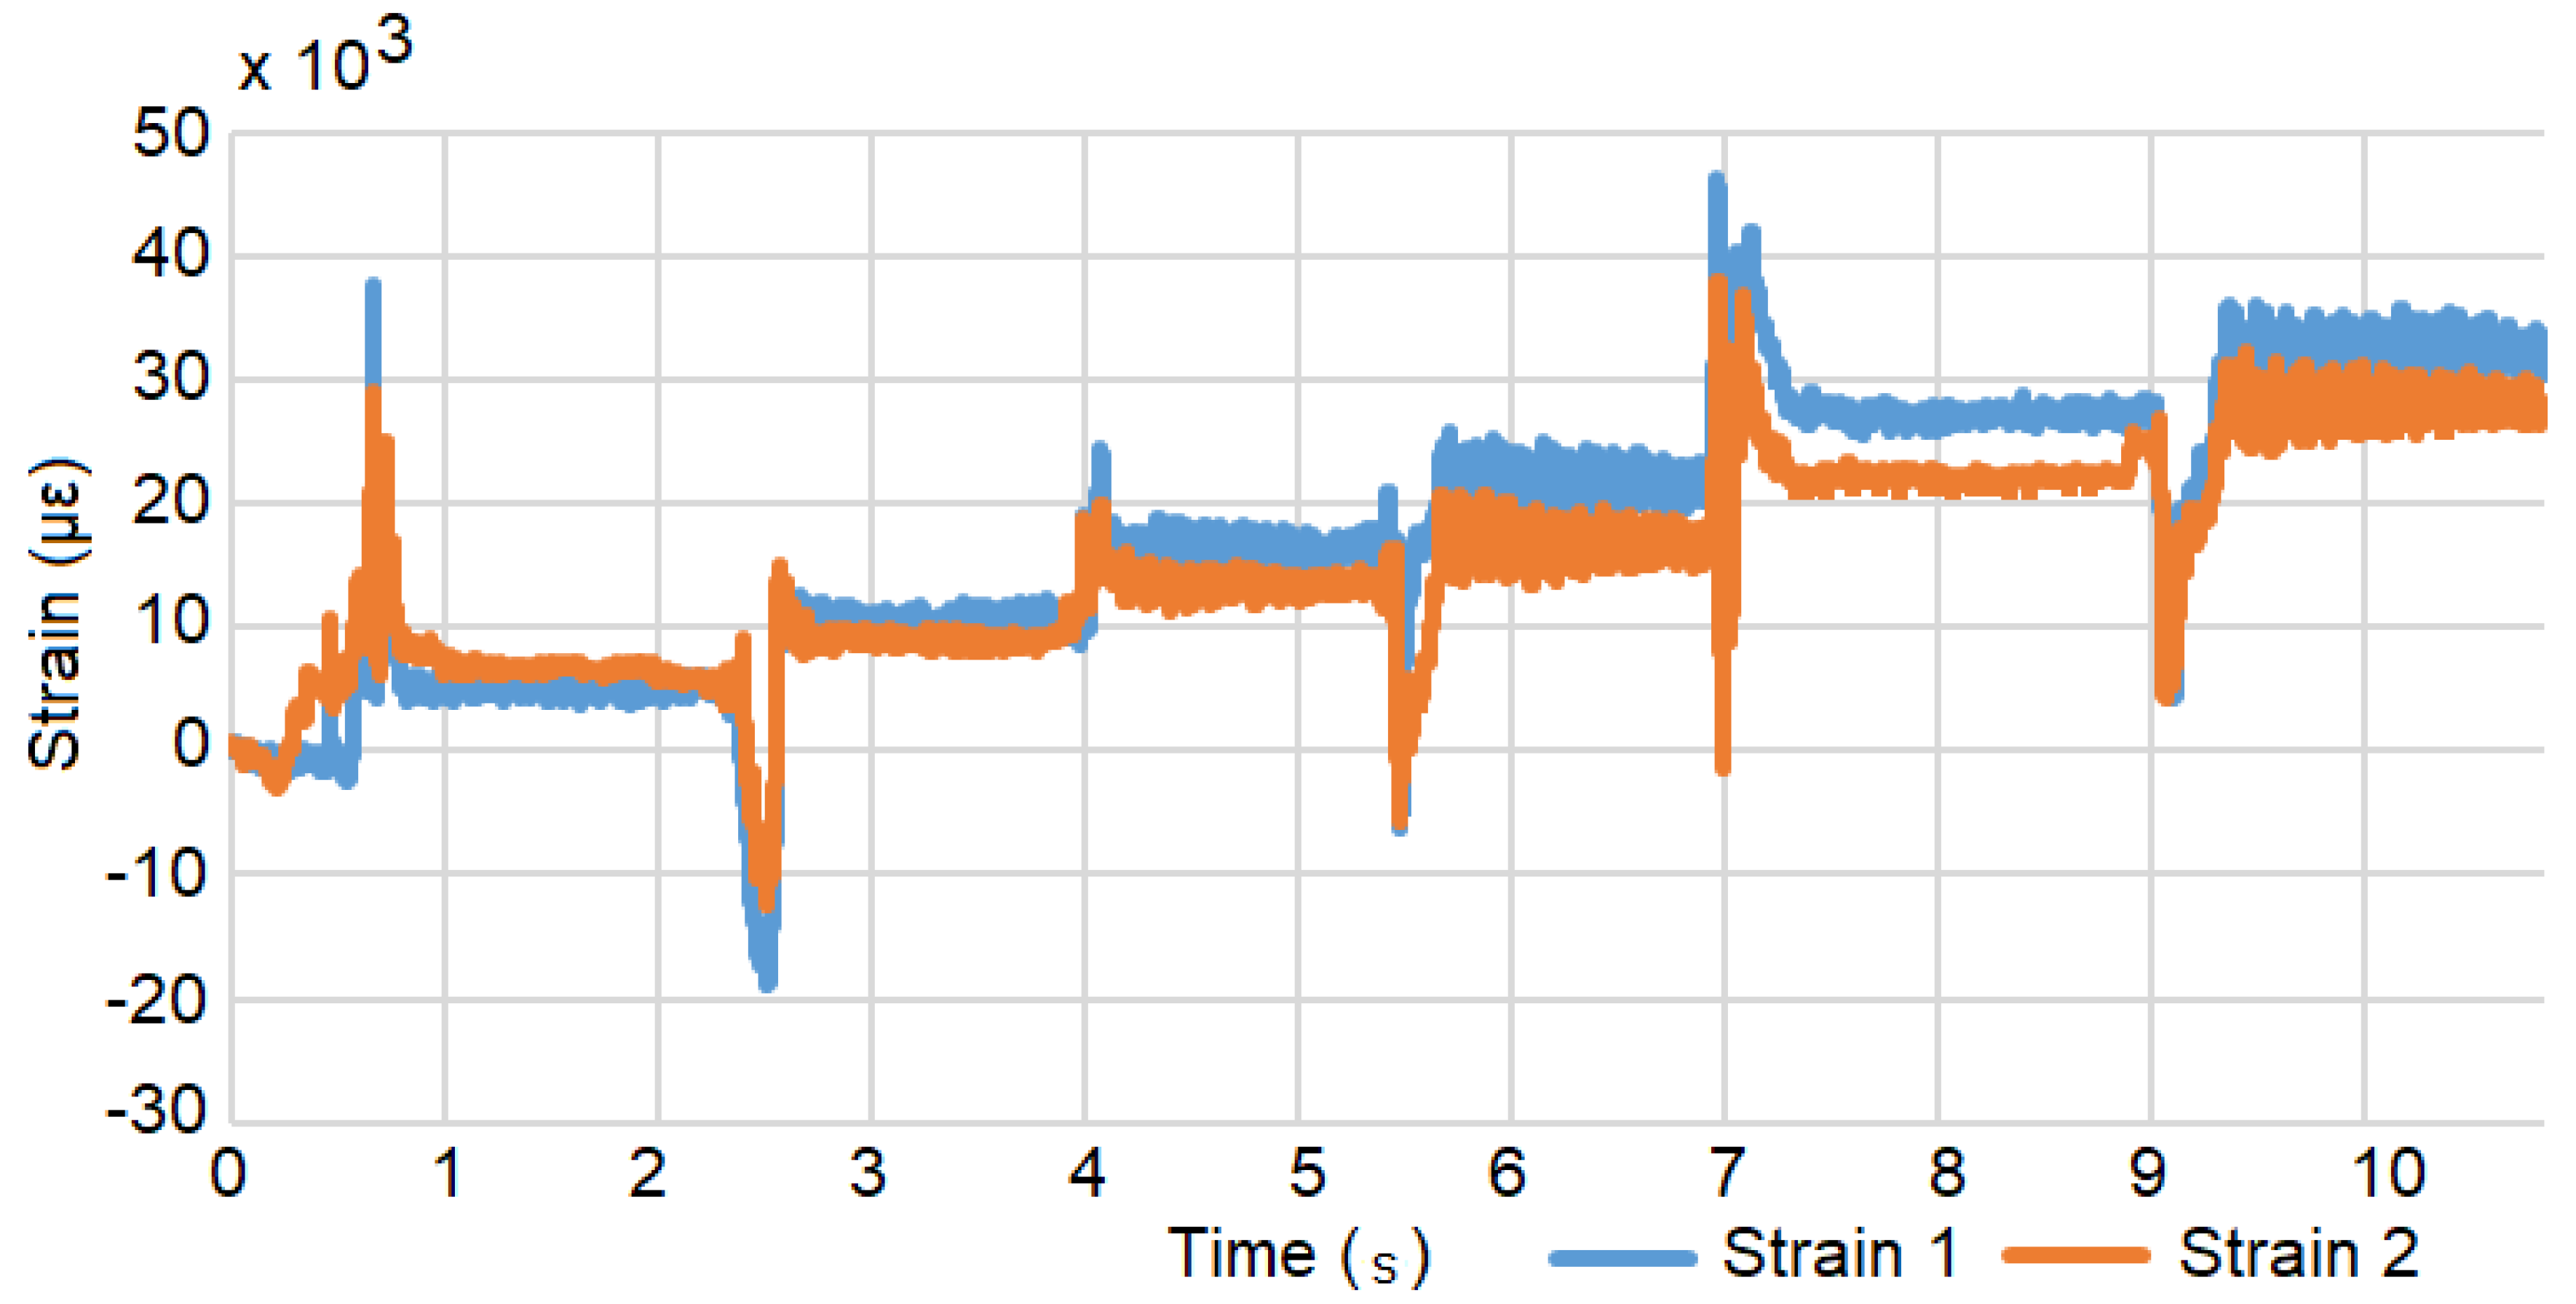
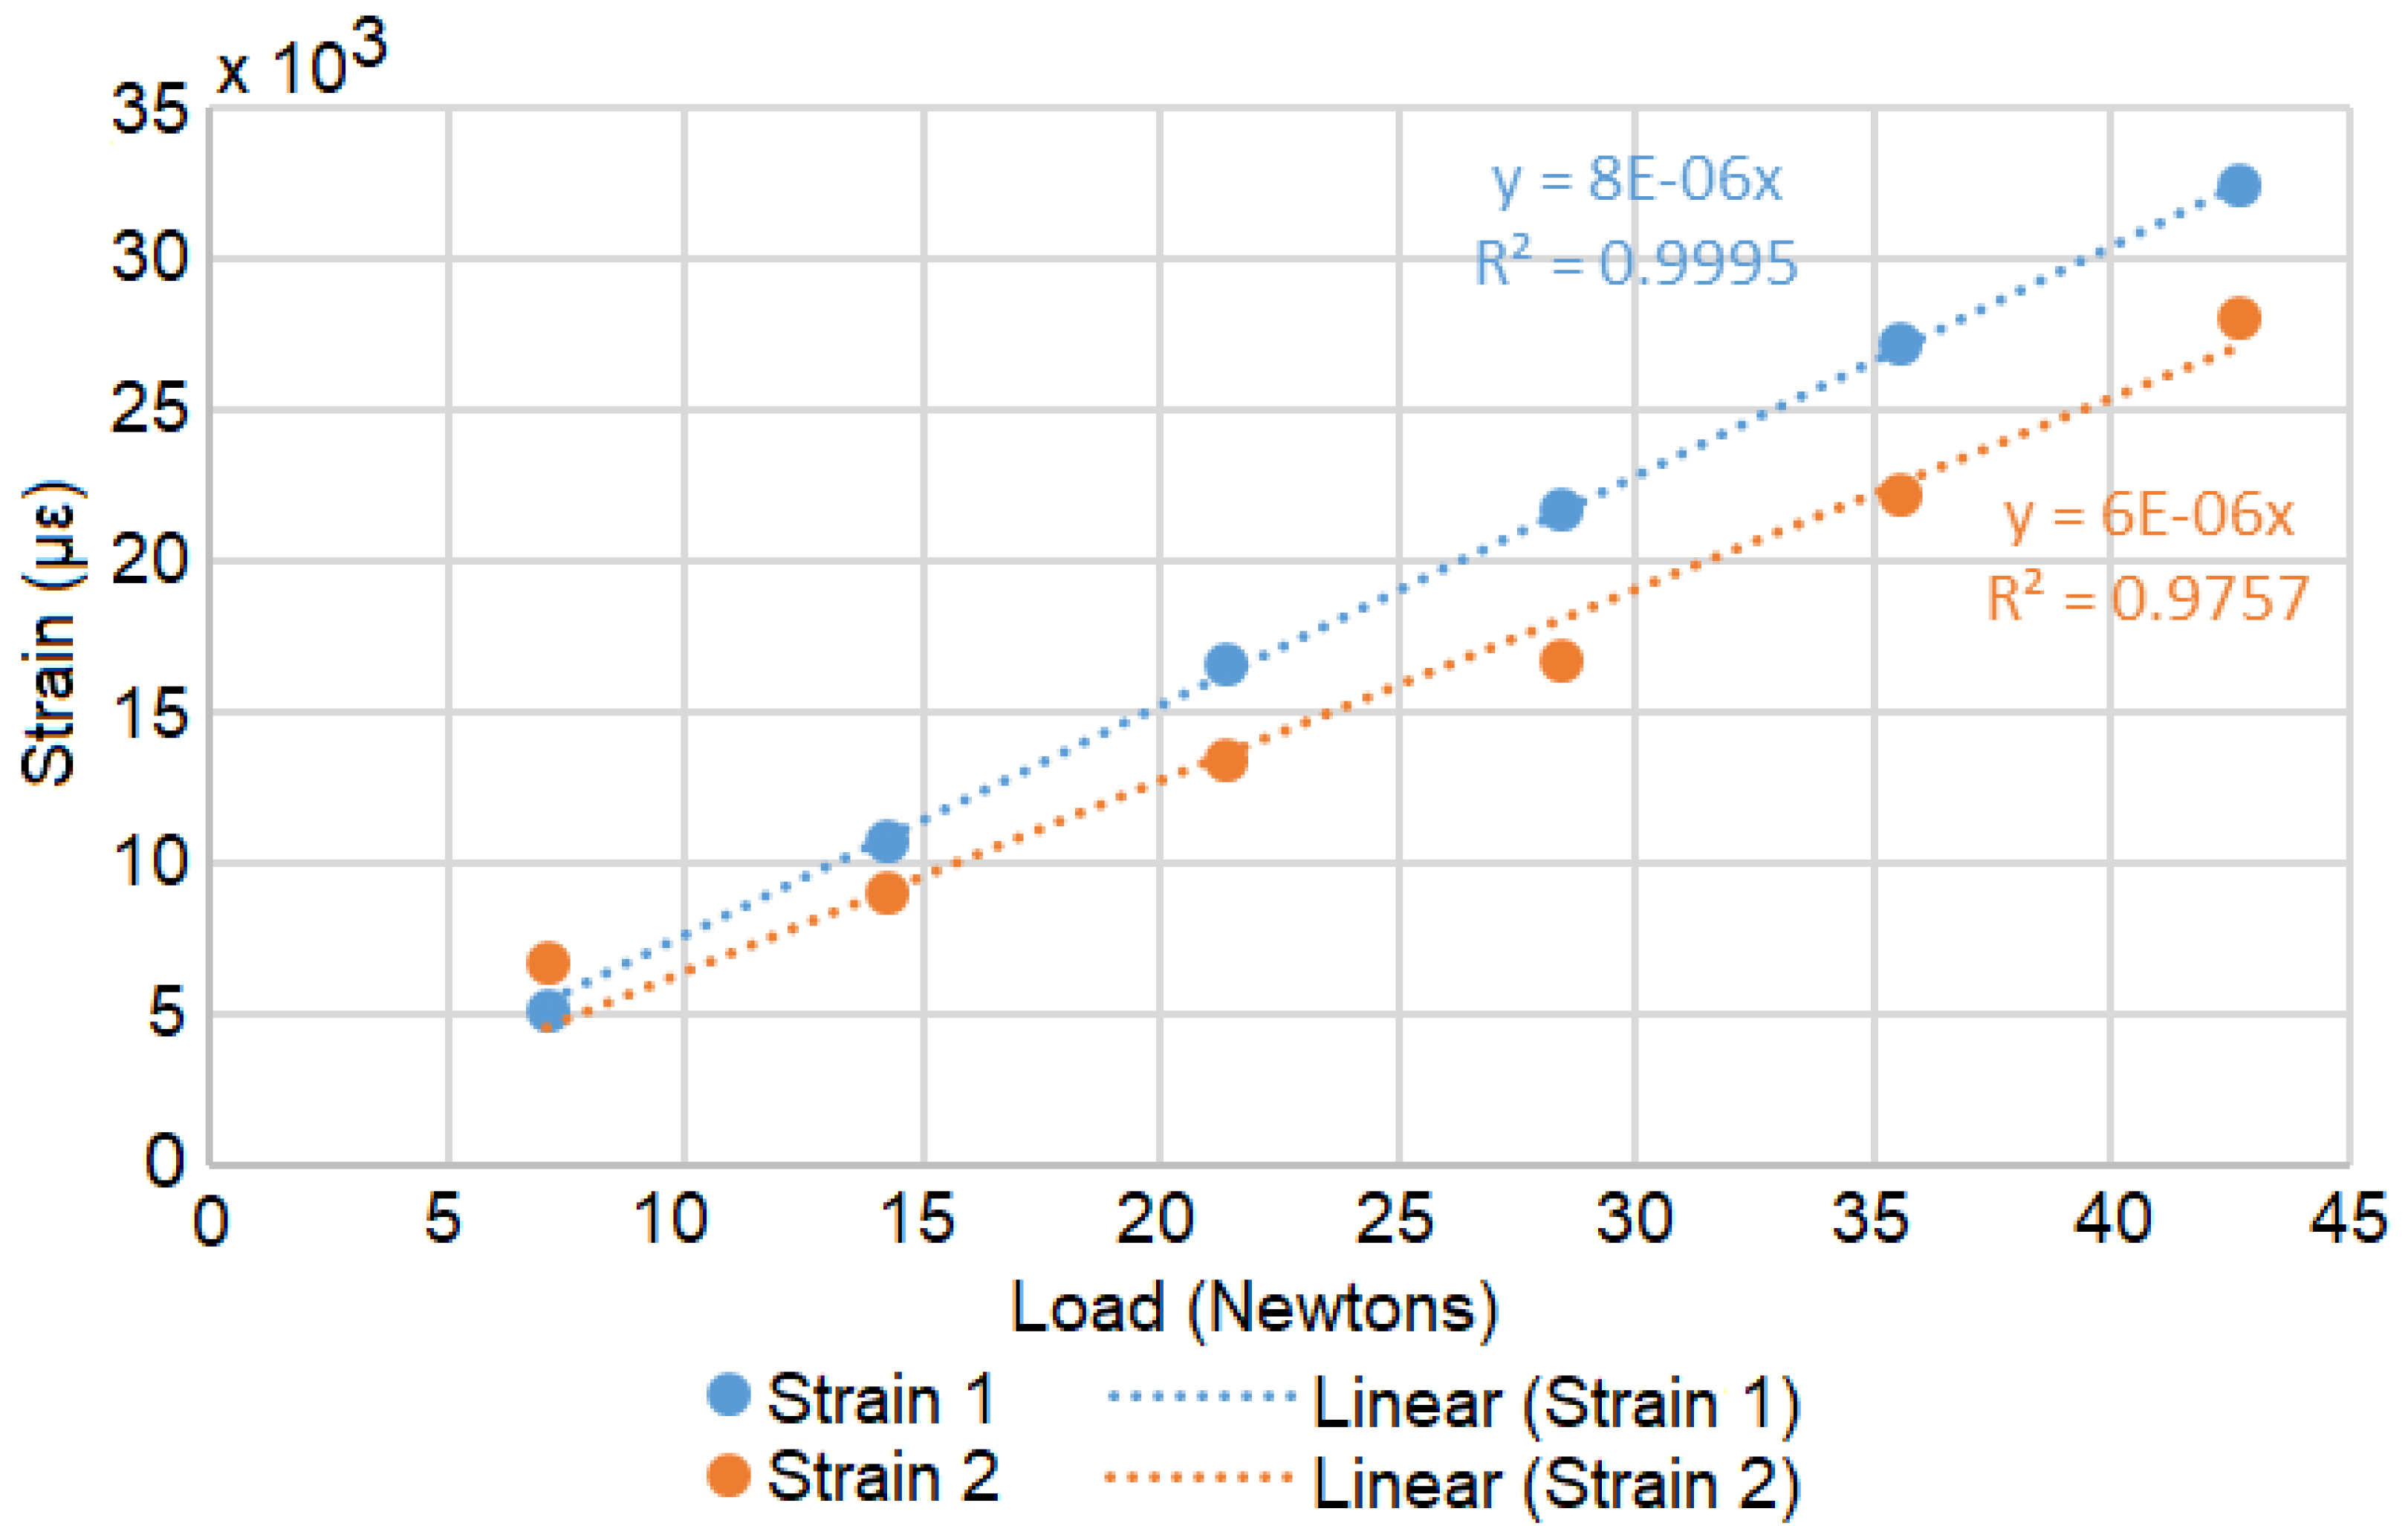
2.1.1. Strain
2.1.2. Acceleration
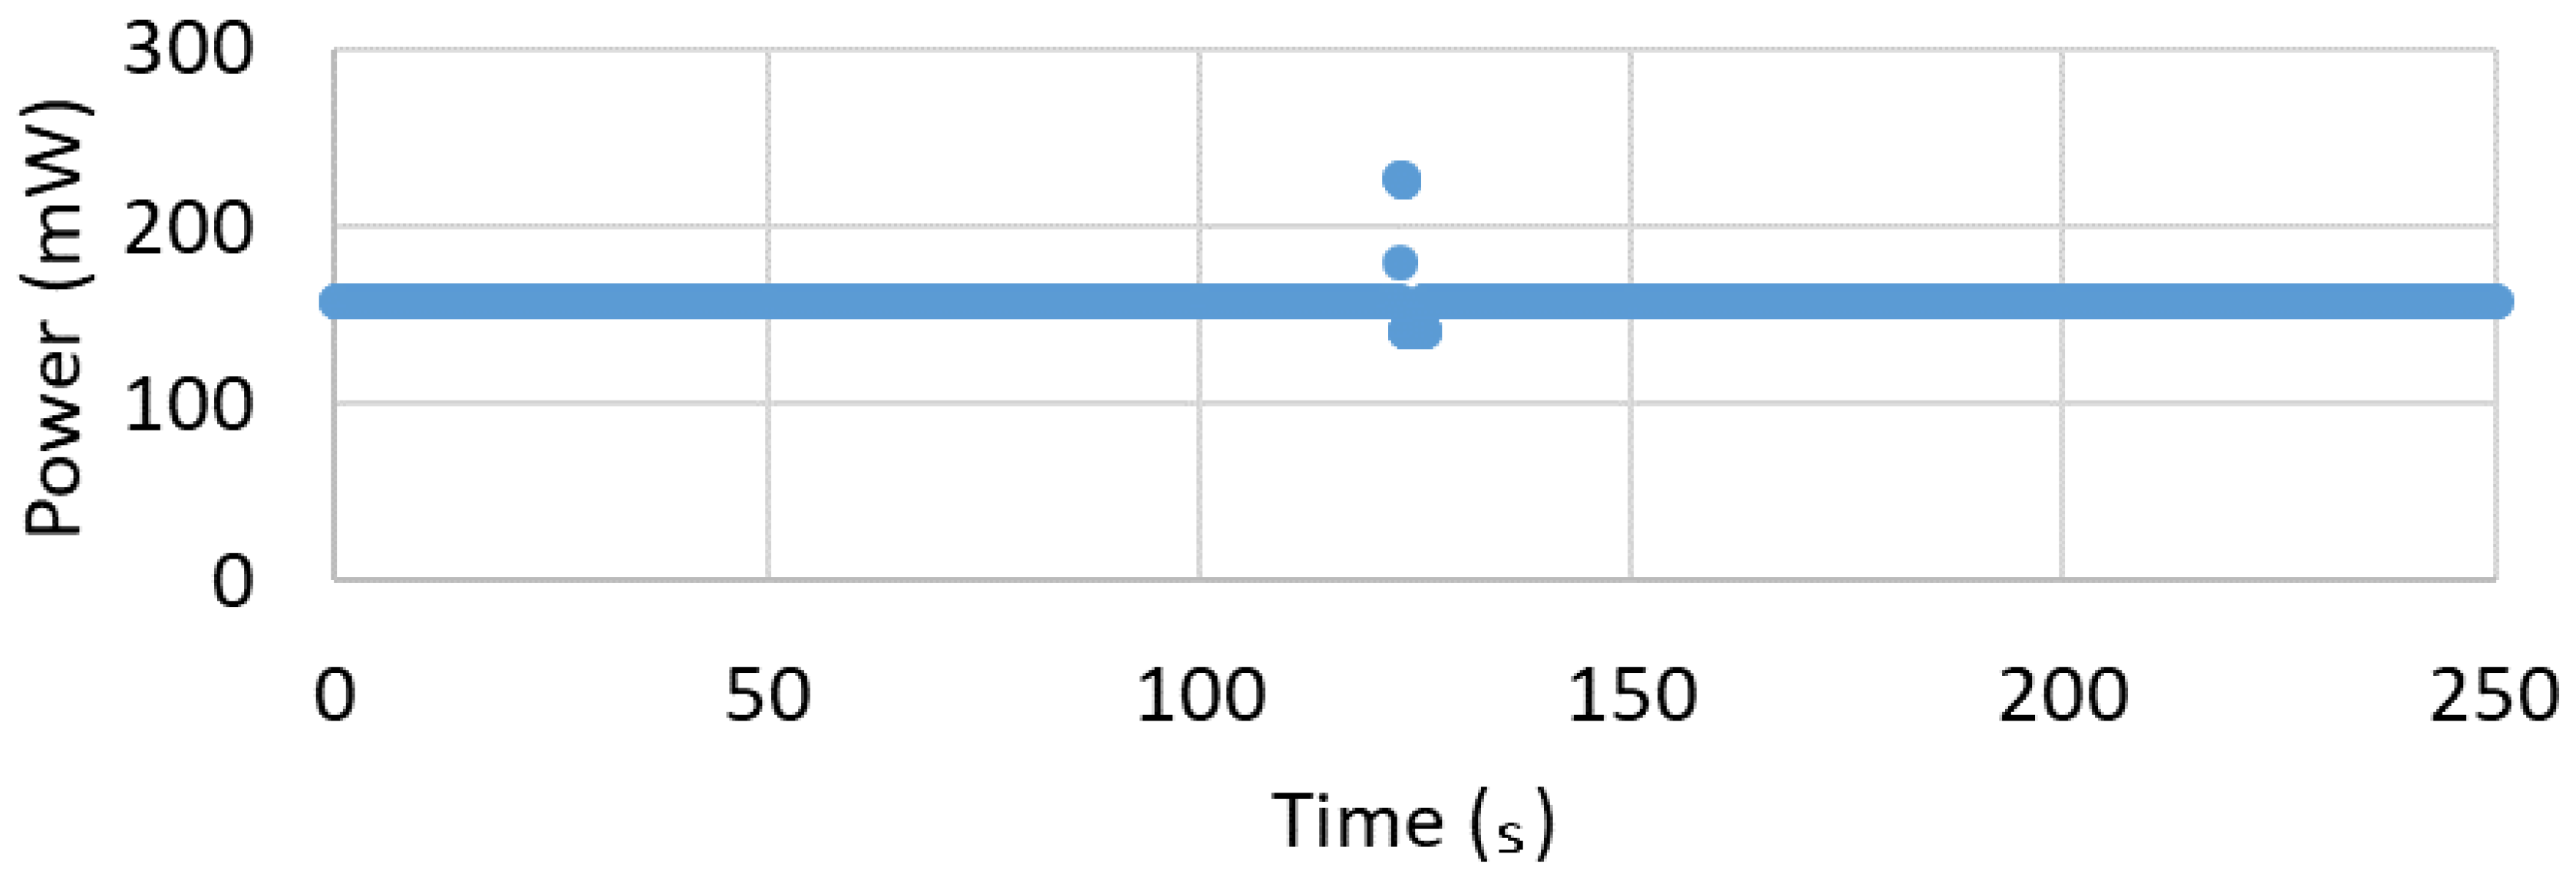
2.1.3. Power Consumption
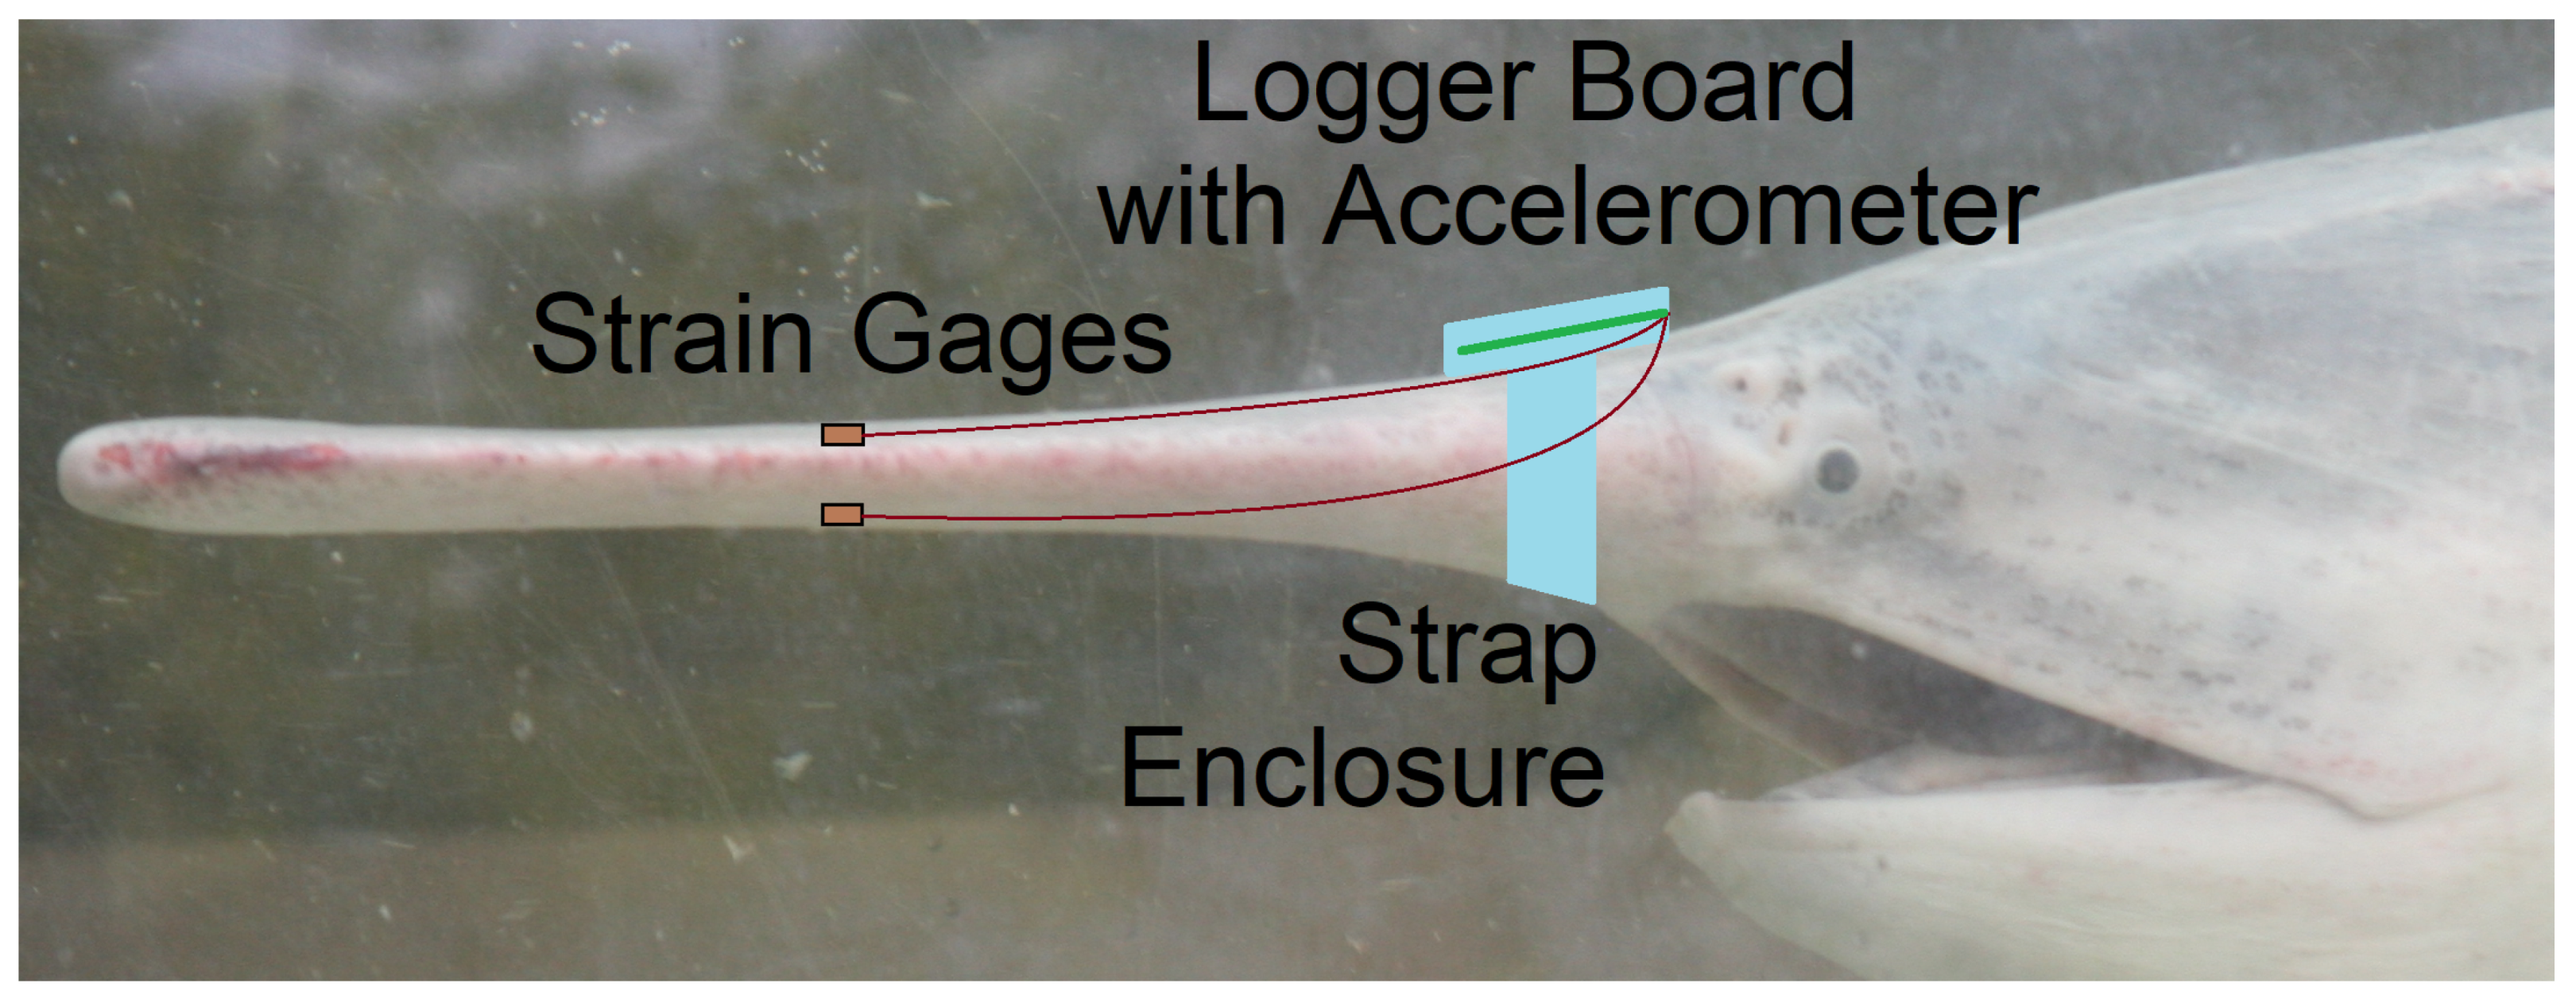
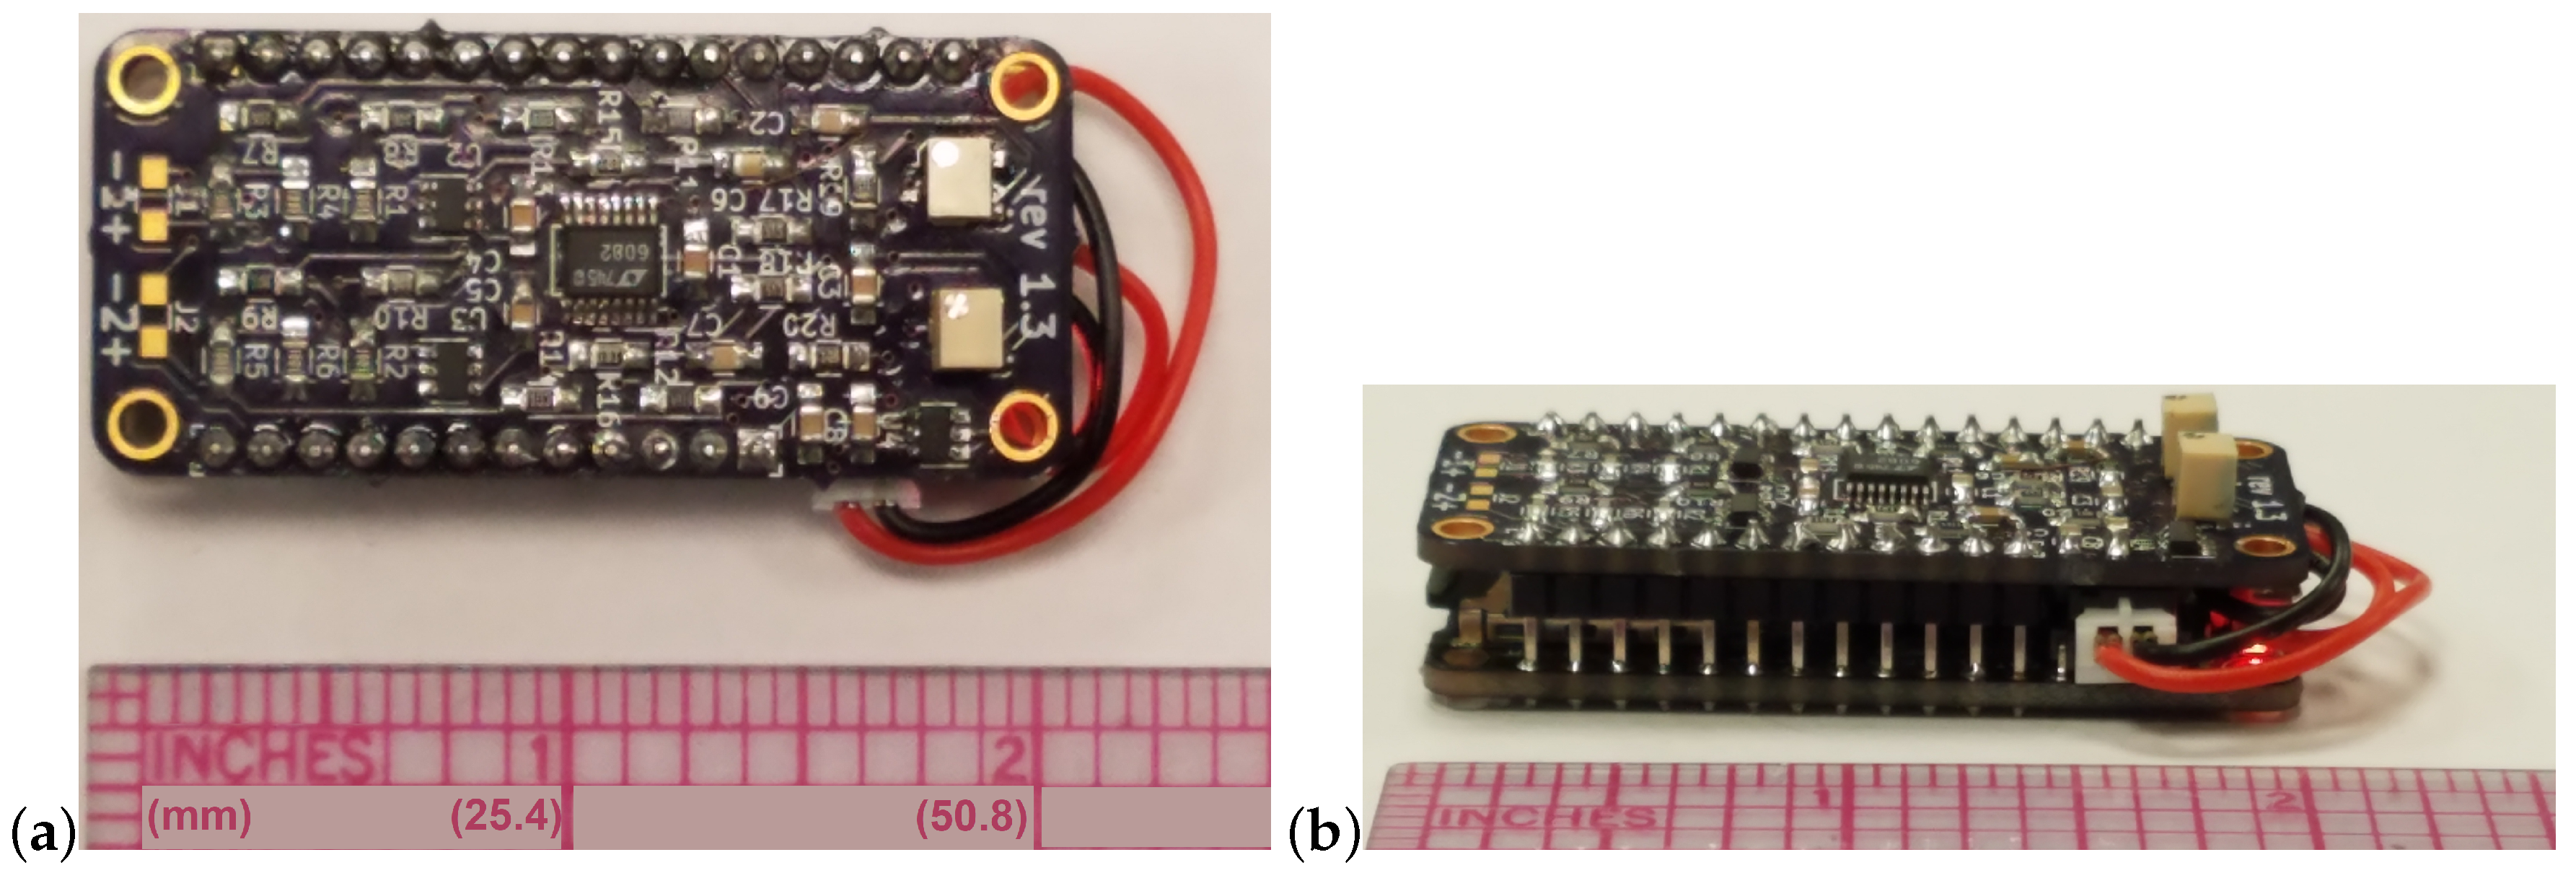
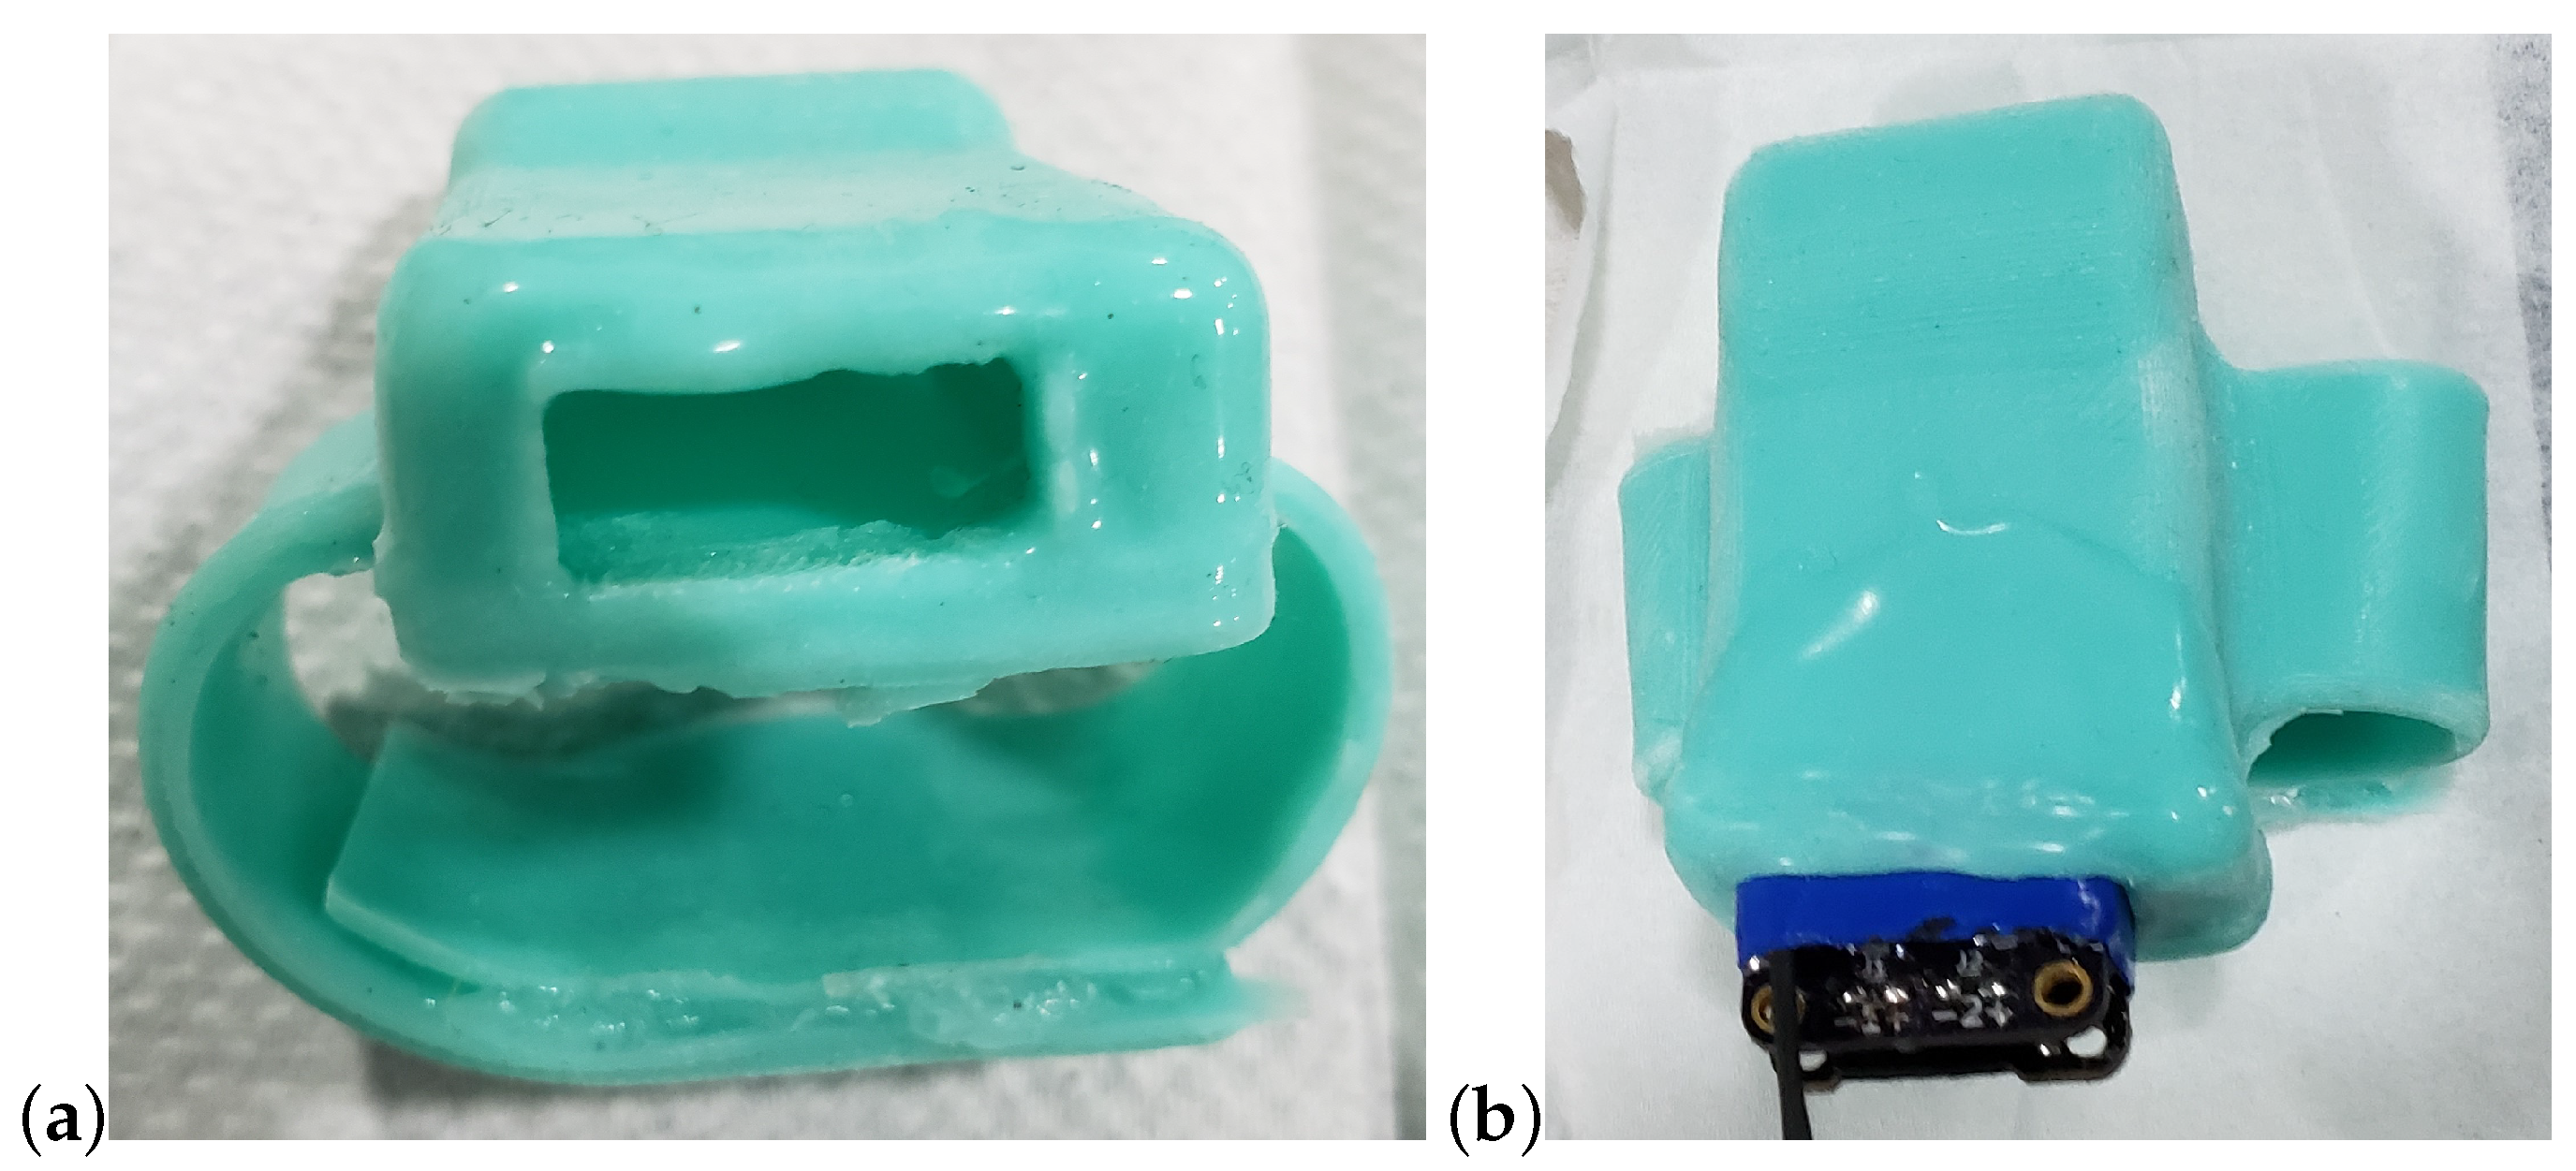
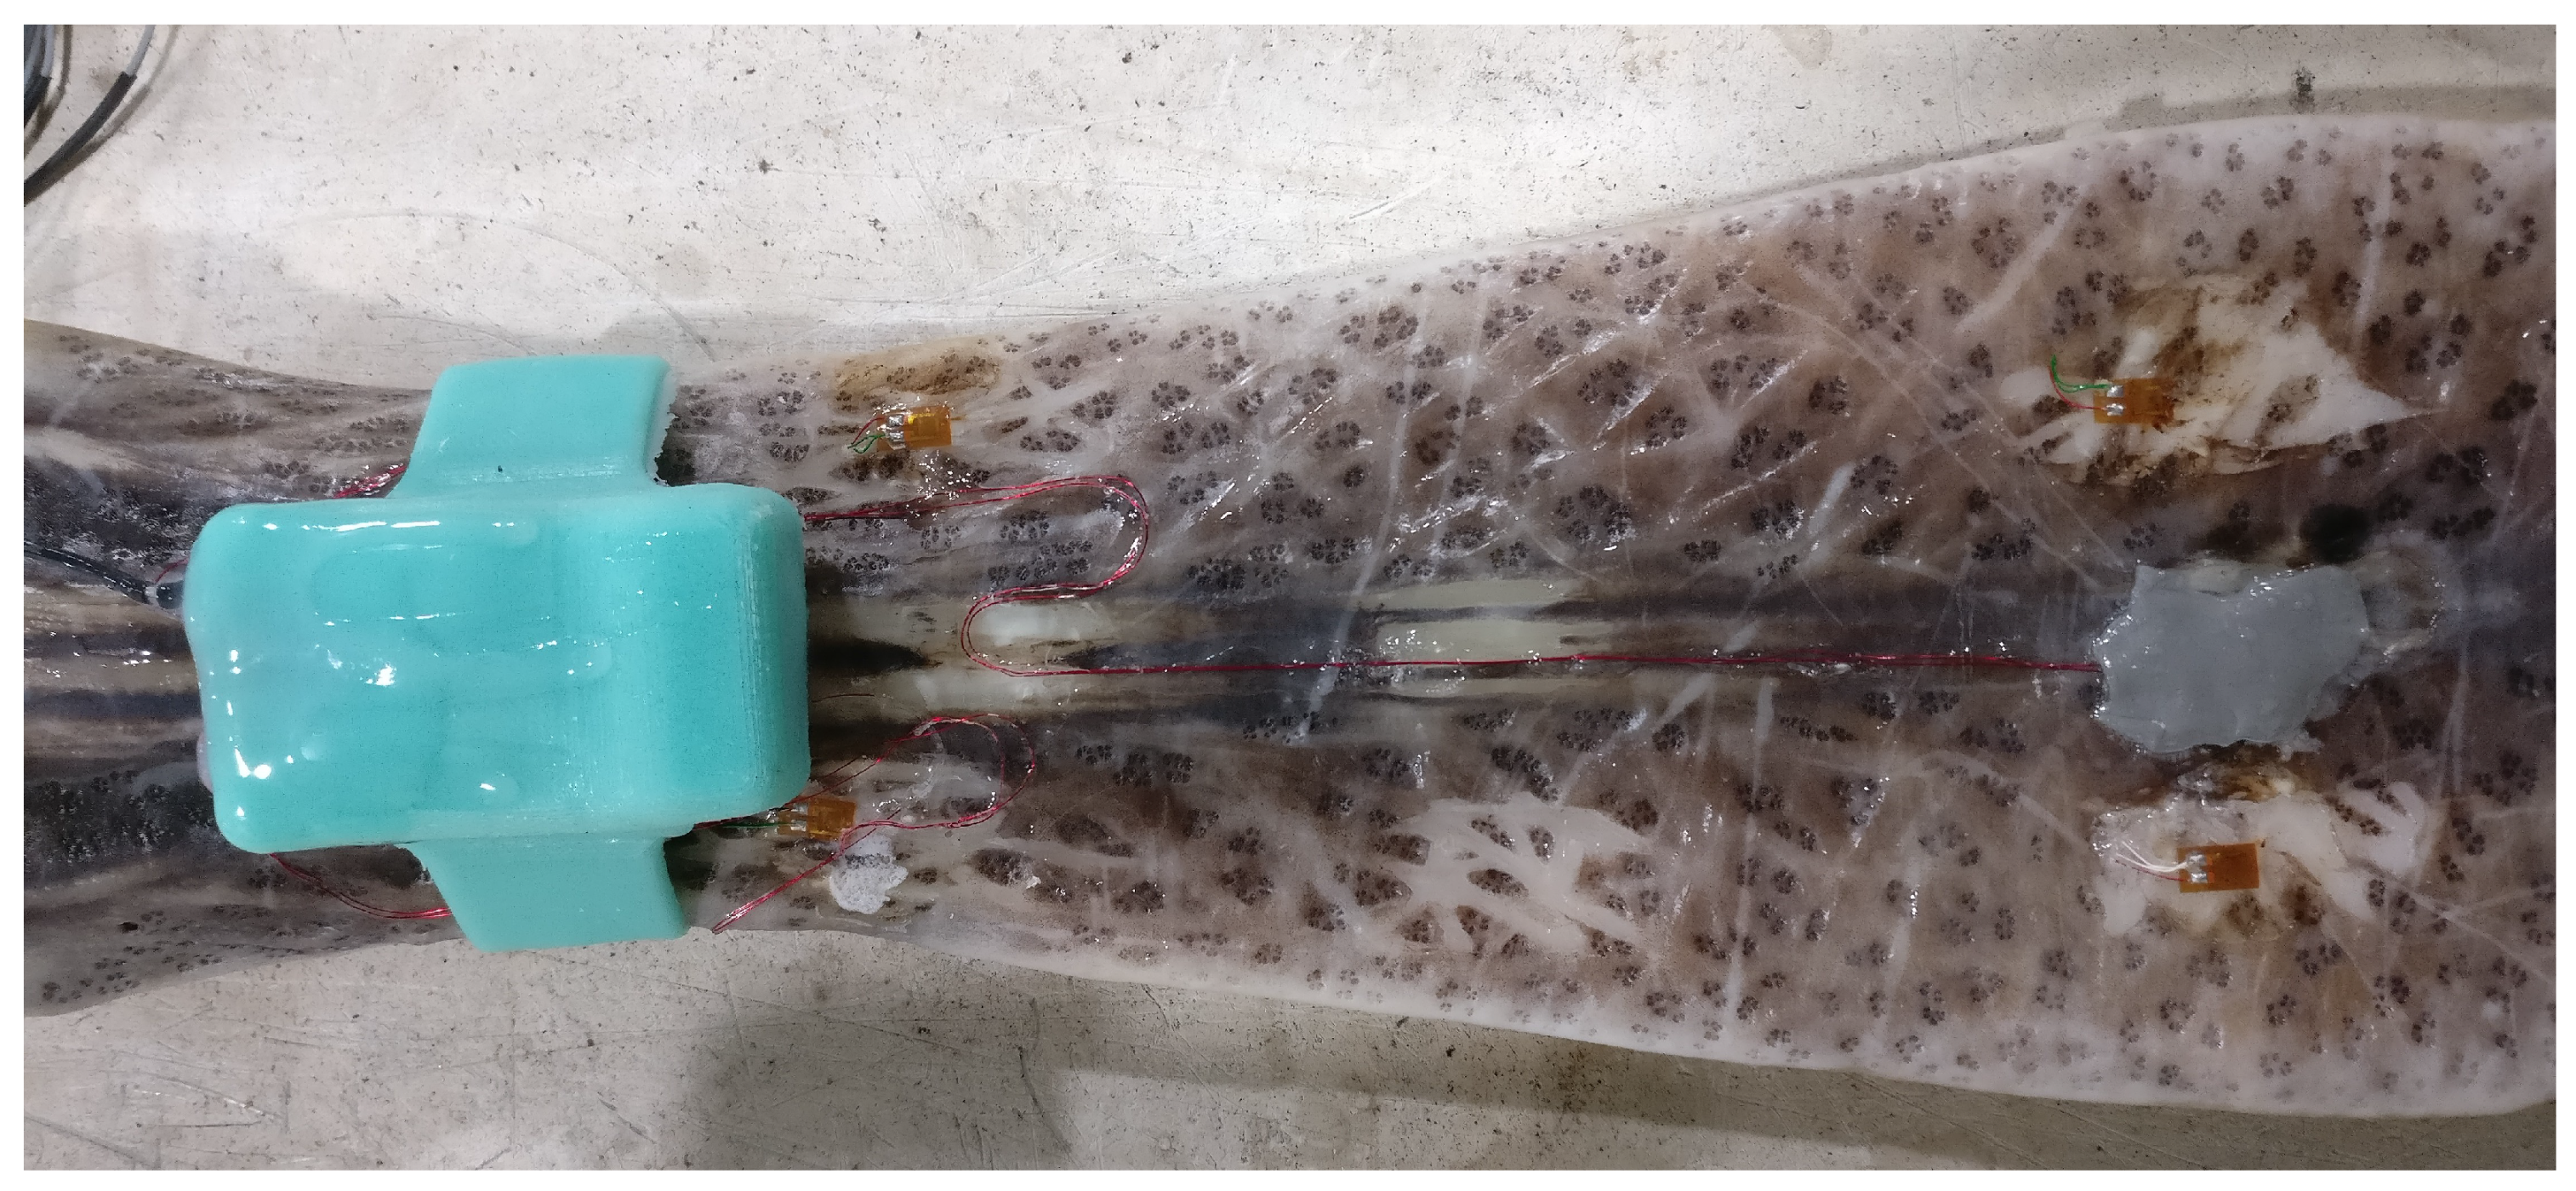
2.2. Device Enclosure and Attachment to the Rostrum
2.3. Techniques for Strain Gage Attachment to Rostrum
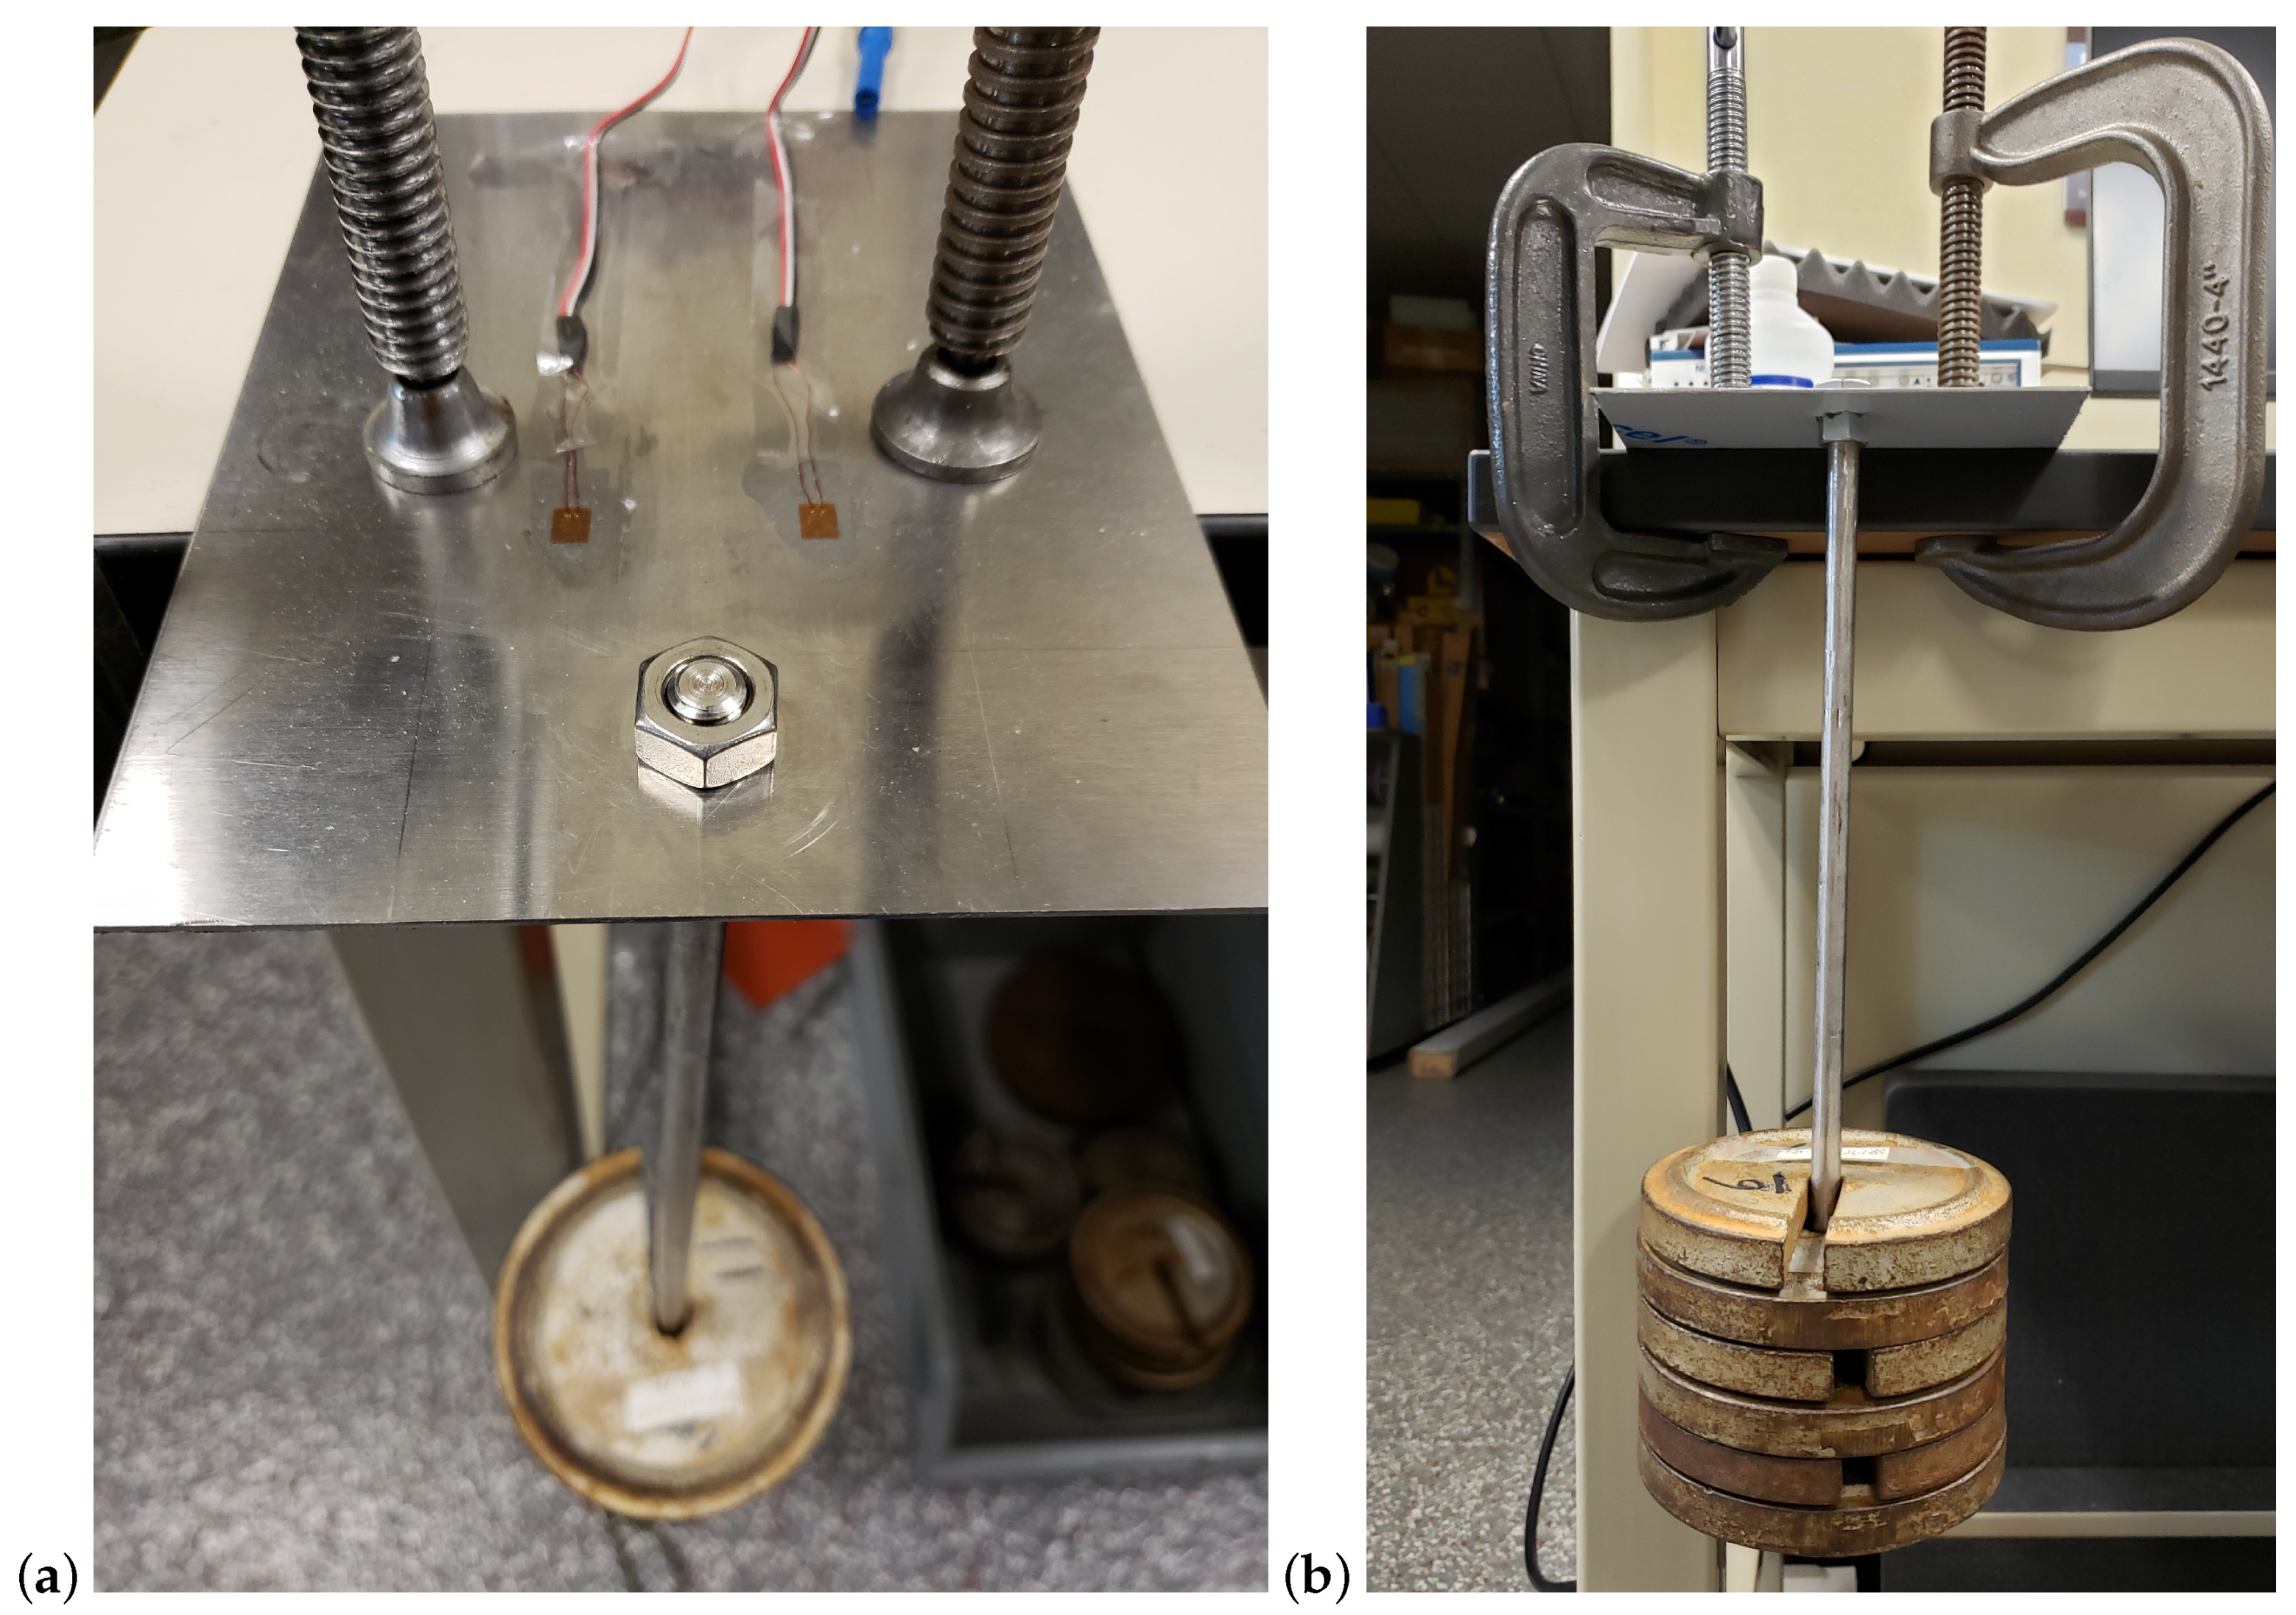
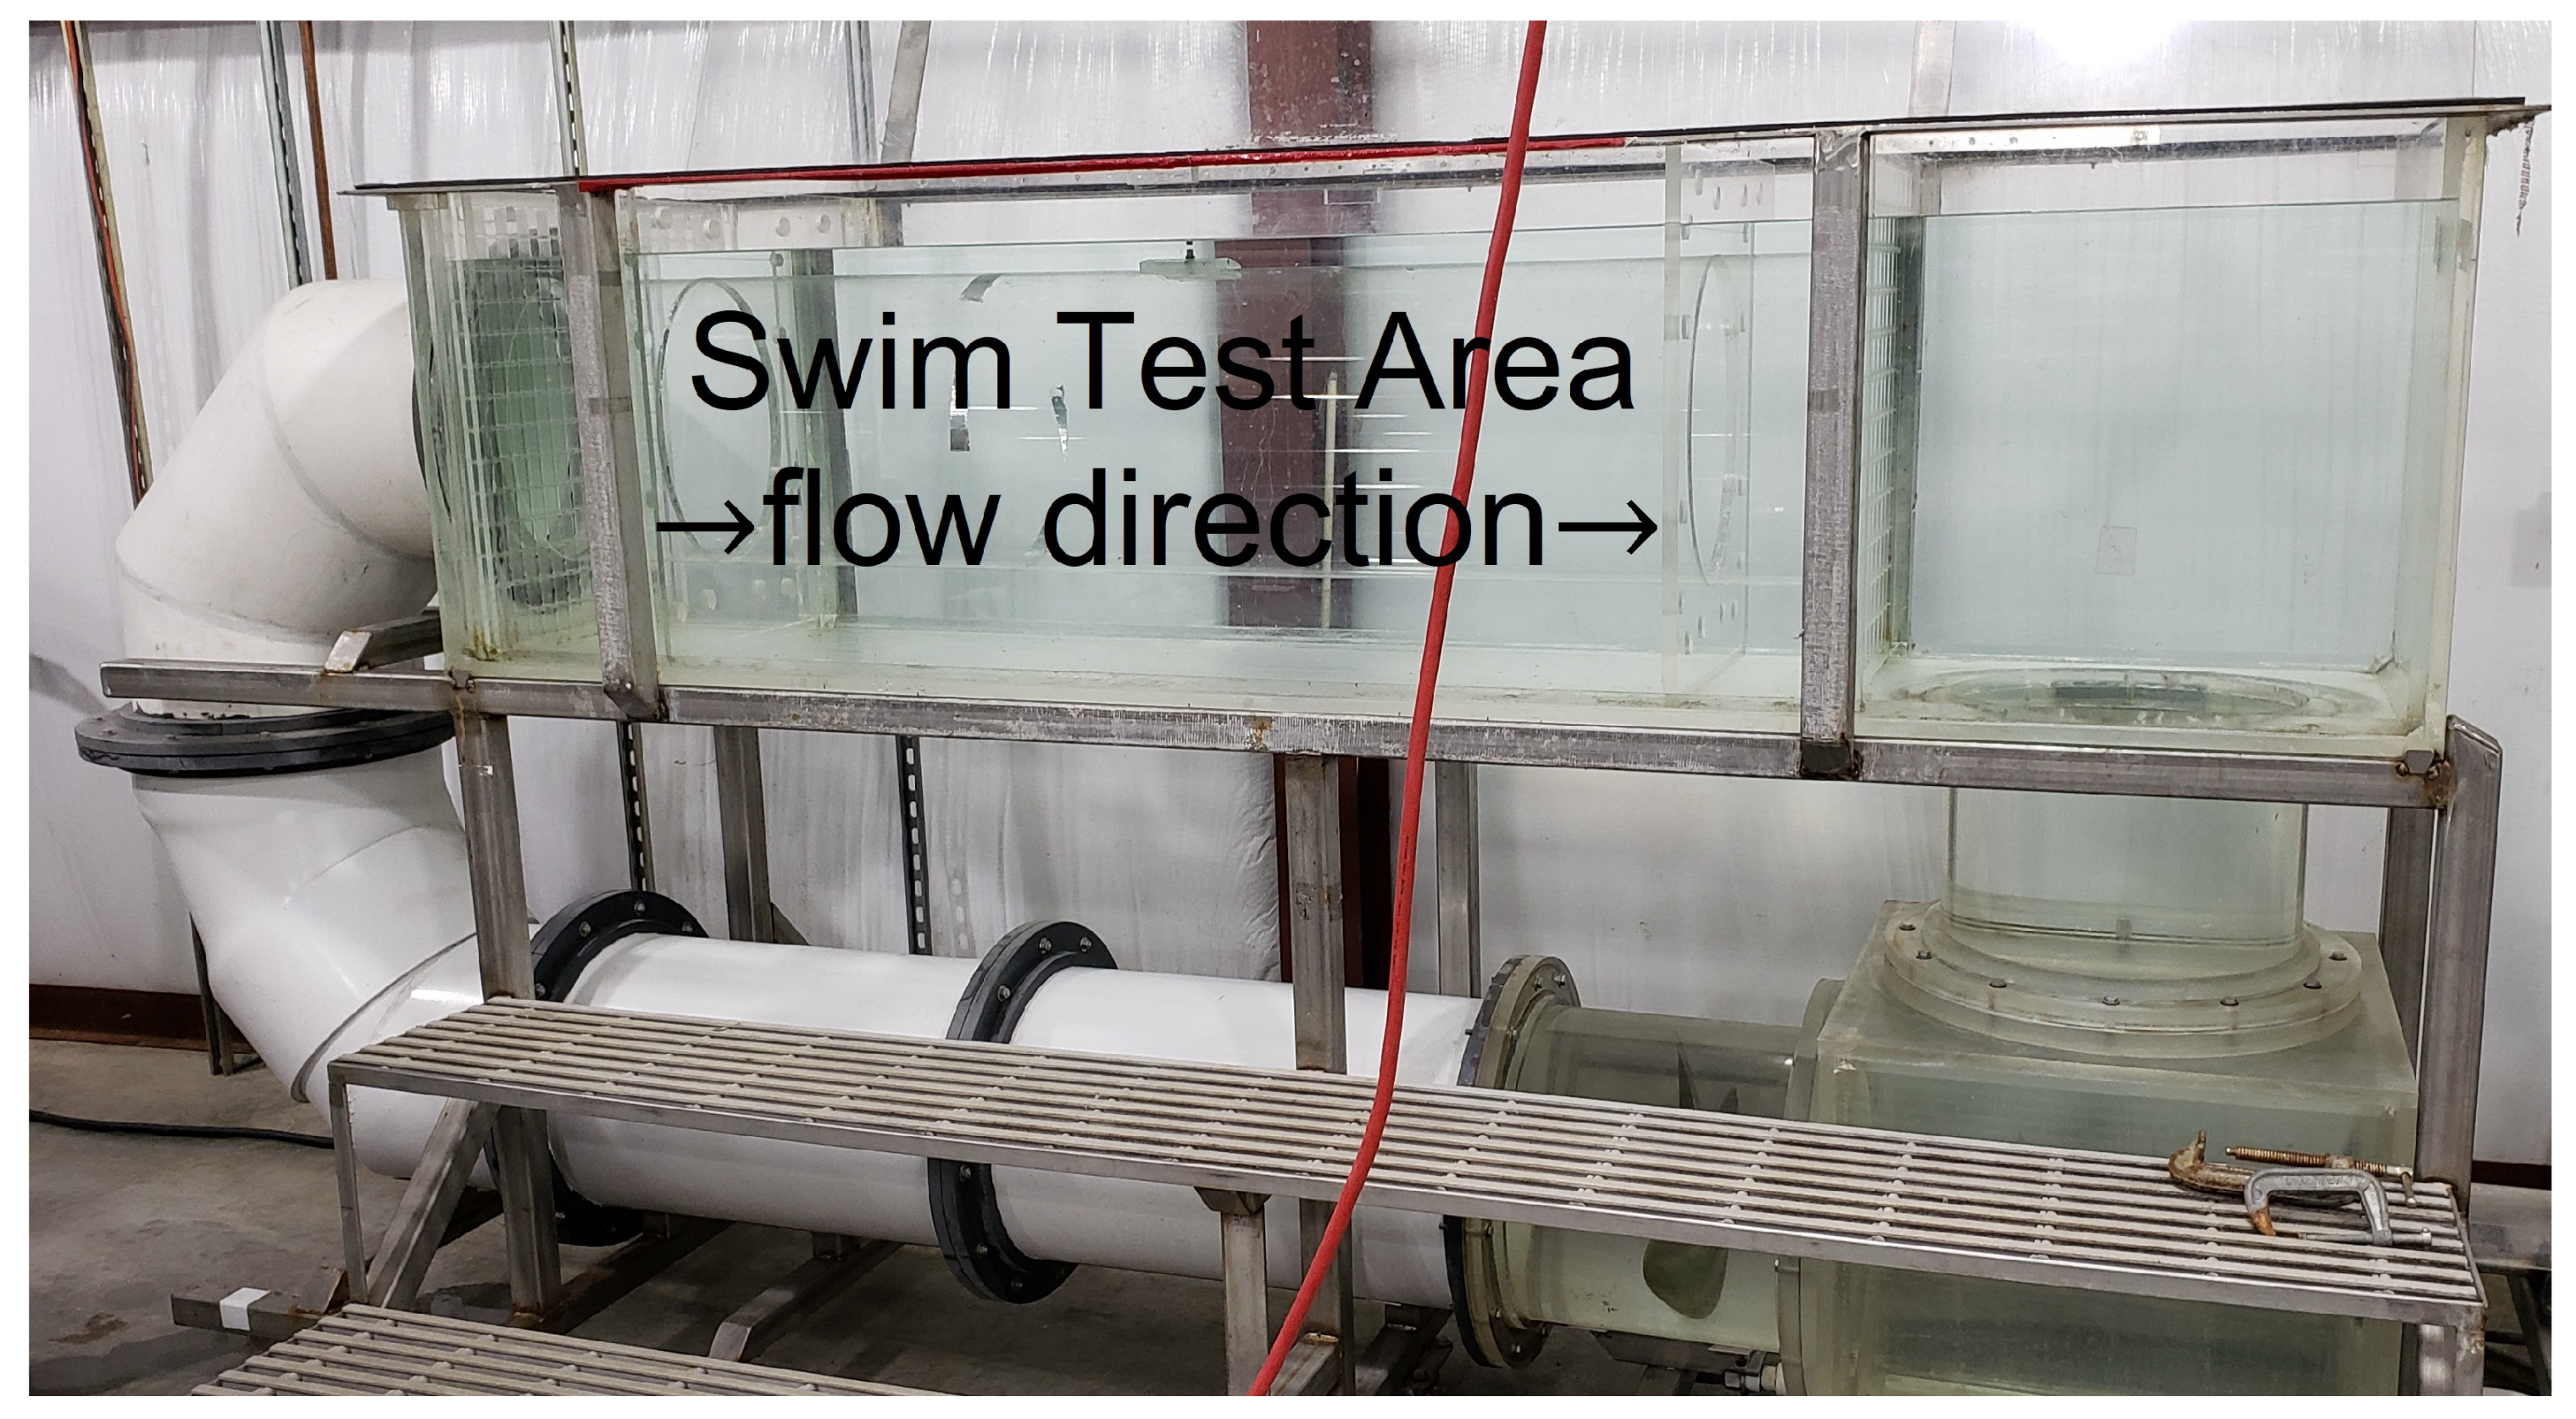
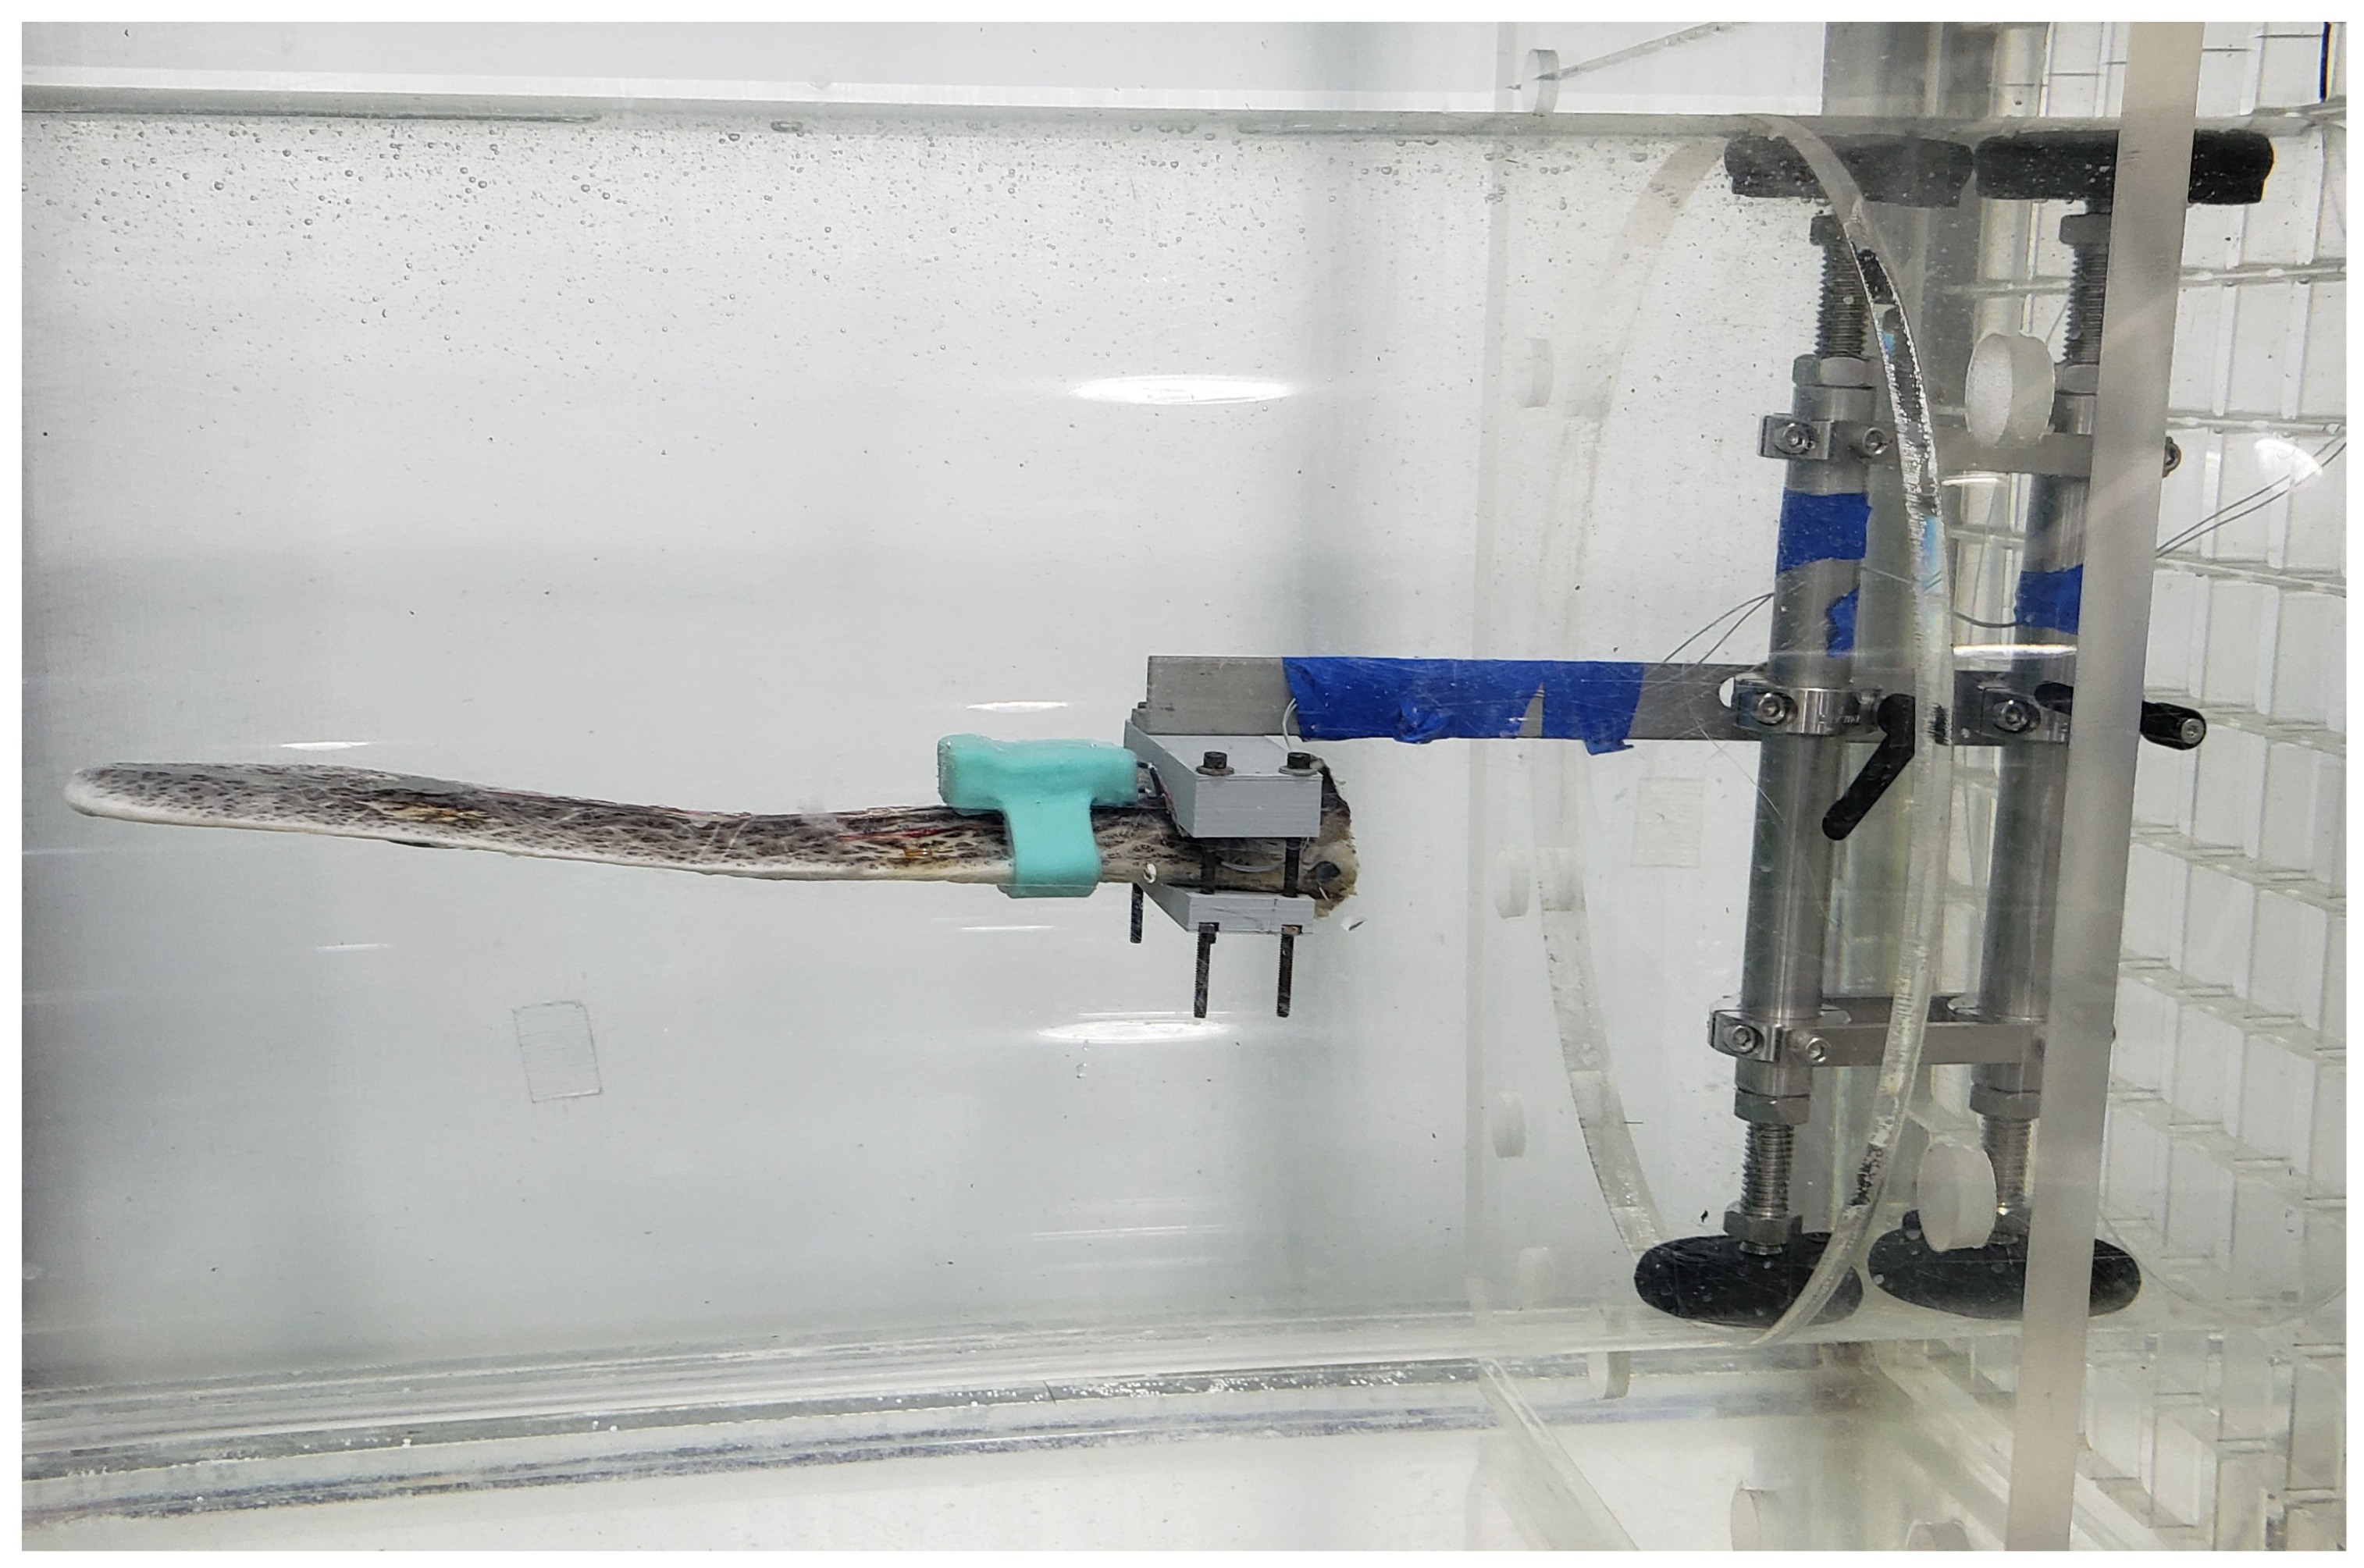
3. System Validation
3.1. Methods and Materials
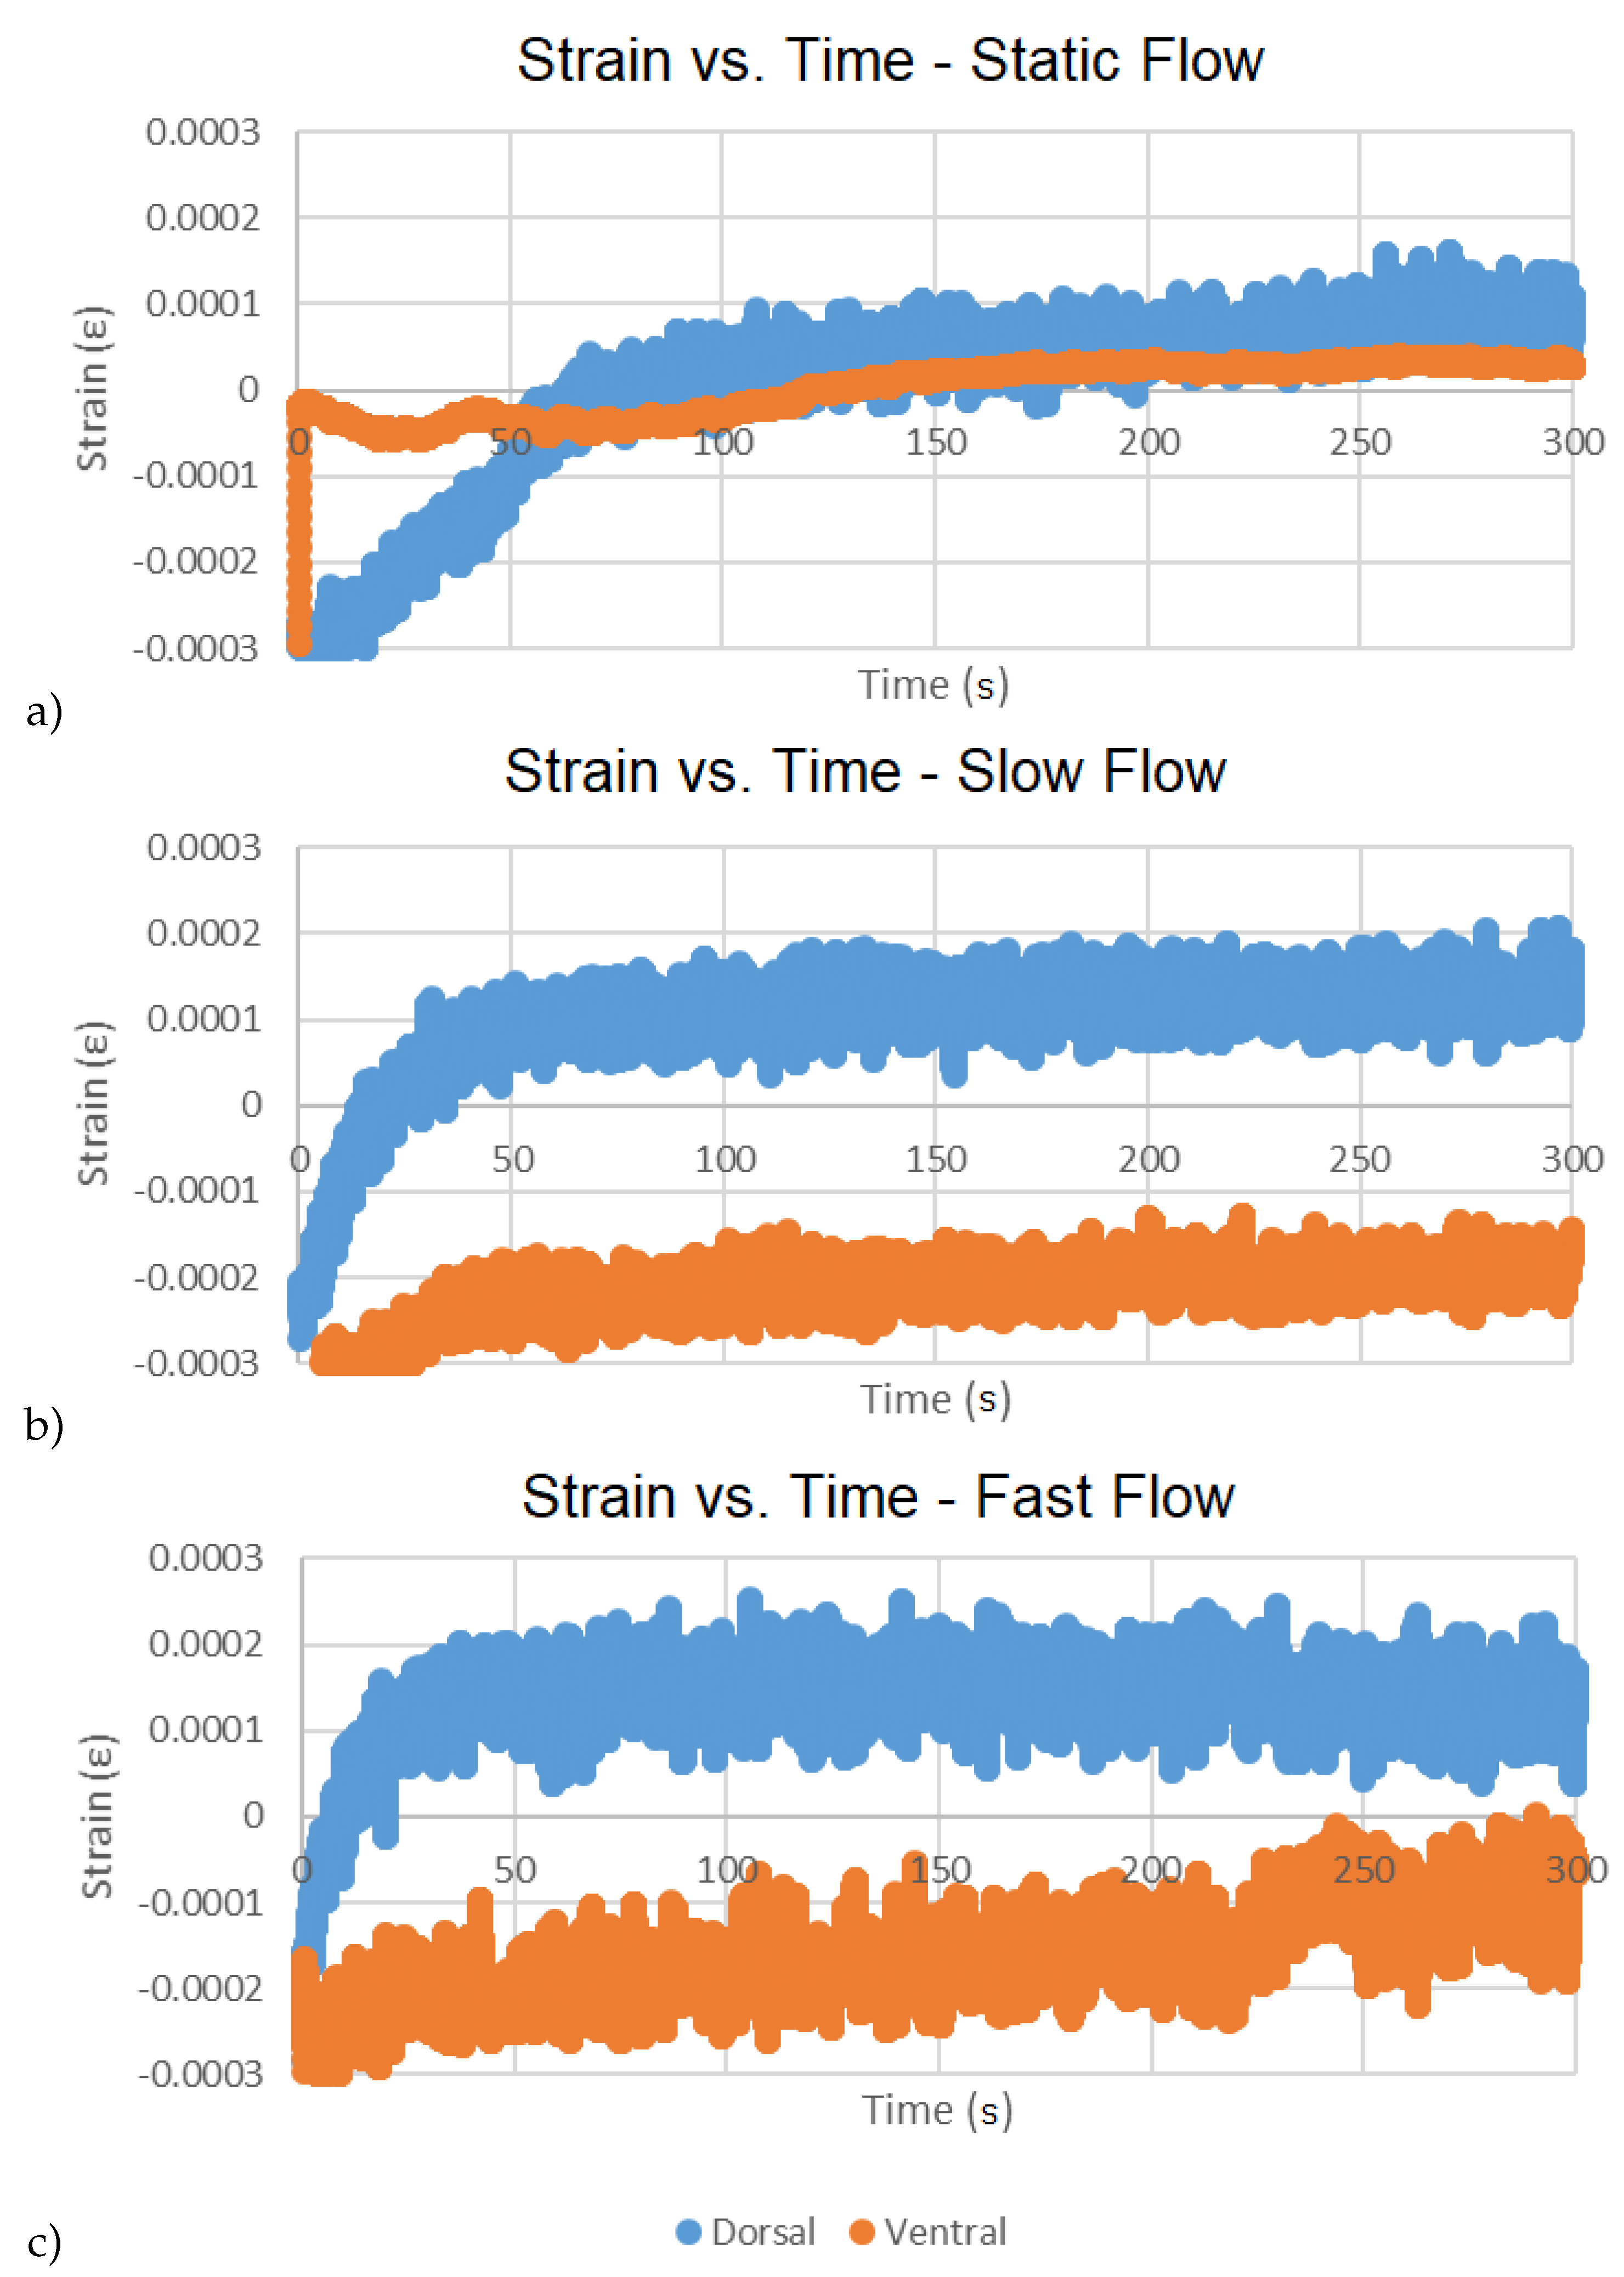
3.2. Results
4. Conclusions
Author Contributions
Funding
Acknowledgments
Conflicts of Interest
References
- Moyle, P.; Cech, J., Jr. Fishes: An Introduction to Ichthyology; Prentice-Hall, Inc.: Upper Saddle River, NJ, USA, 1982; p. 593. [Google Scholar]
- Grande, L.; Bemis, W. Osteology and phylogenetic relationships of fossil and recent paddlefishes (Polyodontidae) with comments on the interrelationships of Acipenseriformes. J. Vertebr. Palaeontol. 1991, 11, 1–121. [Google Scholar] [CrossRef]
- Hoover, J.J.; George, S.G.; Killgore, K.J. Rostrum size of Paddlefish (Polyodon spathula)(Acipenseriformes: Polyodontidae) from the Mississippi delta. Copeia 2000, 2000, 288–290. [Google Scholar] [CrossRef]
- Hoover, J.J.; Boysen, K.A.; Murphy, C.E.; George, S.G. Morphological variation in juvenile Paddlefish. In Paddlefish Management, Propagation, and Conservation in the 21st Century: Building From 20 Years of Research and Management; American Fisheries Society: Bethesda, MD, USA, 2009; pp. 157–171. [Google Scholar]
- Jørgensen, J. The Lorenzian ampullae of Polyodon spathula. Z. FüR Zellforsch. Und Mikrosk. Anat. 1972, 130, 362–377. [Google Scholar] [CrossRef]
- Wilkens, L.; Russell, D.; Pei, X.; Gurgens, C. The Paddlefish rostrum functions as an electrosensory antennae in plankton feeding. Proc. R. Soc. Lond. 1997, 264, 1723–1729. [Google Scholar] [CrossRef]
- Gurgens, C.; Russell, D.; Wilkens, L. Electrosensory avoidance of metal obstacles by the Paddlefish. J. Fish Biol. 2000, 57, 277–290. [Google Scholar] [CrossRef]
- Hoover, J.J.; Turnage, A.; Killgore, K.J. Swimming performance of juvenile Paddlefish: Auantifying risk of entrainment. In Paddlefish Management, Propagation, and Conservation in the 21st Century: Building From 20 Years of Research and Management; American Fisheries Society: Bethesda, MD, USA, 2009; pp. 141–155. [Google Scholar]
- Allen, J.B.; Riveros, G. Hydrodynamic characterization of the Polyodon spathula rostrum using CFD. J. Appl. Math. 2013, 8, 346173. [Google Scholar]
- Scarnecchia, D.; Schooley, J.; Backes, K.; Slominski, A.; Dalbey, S.; Lim, Y. Paddlefish life history: Advances and applications in design of harvest management regulations. In Paddlefish: Ecological, Aquacultural, and Regulatory Challenges of Managing a Global Resource; American Fisheries Society: Bethesda, MD, USA, 2019; pp. 1–27. [Google Scholar]
- Stell, E.G.; Hoover, J.J.; Cage, B.A.; Hardesty, D.; Parsons, G.R. Long-distance movements of four Paddlefish, Polyodon spathula, from a remote oxbow lake in the lower Mississippi River basin. Southeast. Nat. 2018, 17, 230–238. [Google Scholar] [CrossRef]
- Tripp, S.; Brooks, R.; Herzog, D.; Garvey, J. Patterns of fish passage in the upper Mississippi River. River Res. Appl. 2014, 30, 1050–1064. [Google Scholar] [CrossRef]
- Bettoli, P.; Scholten, G.; Ganus, E. Cryptic mortality of Paddlefish. In Paddlefish: Ecological, Aquacultural, and Regulatory Challenges of Managing a Global Resource; American Fisheries Society: Bethesda, MD, USA, 2019; pp. 151–162. [Google Scholar]
- Hoover, J.; Bailey, P.; Januchowski-Hartley, S.; Lyons, J.; Pracheil, B.; Zigler, S. Anthropogenic obstructions to Paddlefish movement and migration. In Paddlefish: Ecological, Aquacultural, and Regulatory Challenges of Managing a Global Resource; American Fisheries Society: Bethesda, MD, USA, 2019; pp. 67–101. [Google Scholar]
- Rhee, H.; Horstemeyer, M.F.; Hwang, Y.; Lim, H.; Kadiri, H.E.; Trim, W. A study on the structure and mechanical behavior of the Terrapene carolina carapace: a pathway to design bio-inspired synthetic composites. Mater. Sci. Eng. 2013, 29, 2333–2339. [Google Scholar] [CrossRef]
- Allison, P.G.; Deang, J.F.; Diaz, A.J.; Poda, A.R.; Hoover, J.J.; Horstemeyer, M.F.; Perkins, E.J. Characterization of paddlefish (Polyodon spathula) rostrum stellate bones. Bioinspired, Biomim. Nanobiomaterials 2014, 3, 63–68. [Google Scholar] [CrossRef]
- Deang, J.F.; Allison, P.G.; Prabhu, R.; Williams, L.N.; Rhee, H.; Whittington, W.R.; Perkins, E.J.; Bruce, S.M.; Horstemeyer, M.F. Constitutive behaviour of paddlefish (Polyodon spathula) cartilage. Bioinspired. Biomim. Nanobiomater. 2017, 6, 236–243. [Google Scholar] [CrossRef]
- Riveros, G.; Patel, R.; Hoover, J. Swimming and Energy Dissipation Enhancement Induced by the Rostrum of the Paddlefish (Polyodon spathula): A Multiphysics, Fluid-Structure Interaction Analysis. In Proceedings of the Materials Research Society Fall Meeting, Boston, MA, USA, 29 November–4 December 2015. [Google Scholar]
- Patel, R.R.; Riveros, G.A.; Thompson, D.S.; Acosta, F.J.; Perkins, E.J.; Hoover, J.J.; Peters, J.F.; Tordesillas, A. Early Detection of Failure Mechanisms in Resilient Biostructures: A Network Flow Study. Available online: https://hdl.handle.net/11681/24960 (accessed on 10 April 2020).
- Patel, R.R.; Valles, D.; Riveros, G.A.; Thompson, D.S.; Perkins, E.J.; Hoover, J.J.; Peters, J.F.; Tordesillas, A. Stress flow analysis of bio-structures using the finite element method and the flow network approach. Finite Elem. Anal. Des. 2018, 152, 46–54. [Google Scholar] [CrossRef]
- Patel, R. Complex Network Analysis for Early Detection of Failure Mechanisms in Resilient Bio-Structures. Ph.D. Thesis, Mississippi State University, Starkville, MS, USA, 2018. [Google Scholar]
- Riveros, G.A.; Acosta, F.J.; Patel, R.R.; Hodo, W. Computational Mechanics of the Paddlefish Rostrum. Available online: https://doi.org/10.1108/EC-12-2018-0567 (accessed on 10 April 2020).
- Patel, R.R.; Riveros, G.A. Towards Development of Innovative Bio-inspired Materials by Analyzing the Hydrodynamic Properties of Polyondon Spathula (Paddlefish) Rostrum. Available online: https://hdl.handle.net/11681/10835 (accessed on 10 April 2020).
- Cage, B.A. Behavior, Energetics, and Swimming Performance of the American Paddlefish, Polyodon spathula, in a Lower Mississippi River Oxbow. Ph.D. Thesis, University of Mississippi, Oxford, MS, USA, 2015. [Google Scholar]
- Bouvier, M. Application of In Vivo Bone Strain Measurement Techniques to Problems of Skeletal Adaptations. Yearb. Phys. Anthropol. 1985, 28, 237–248. [Google Scholar] [CrossRef]
- Milgrom, C.; Finestone, A.; Simkin, A.; Ekenman, I.; Mendelson, S.; Millgram, M.; Nyska, M.; Larsson, E.; Burr, D. In vivo strain measurements to evaluate the strengthening potential of exercises on the tibial bone. Br. Vol. 2000, 82, 591–594. [Google Scholar] [CrossRef]
- Metzger, K.A.; Daniel, W.J.; Ross, C.F. Comparison of Beam Theory and Finite-Element Analysis With In Vivo Bone Strain Data From the Alligator Cranium. Anat. Rec. Part 2005, 283, 331–348. [Google Scholar] [CrossRef] [PubMed]
- Thurmer, C.R.; Ray, J.D.; Klein, J.D.; Bunkley, S.L.; Netchaev, A.; Patel, R.R.; Riveros, G.A.; Perkins, E.J.; Hoover, J.J. Low SWaP, In-Situ Data Logger for Strain Measurement of Paddlefish Rostrums in Motion. In Proceedings of the IEEE 9th Annual Ubiquitous Computing, Electronics & Mobile Communication Conference (UEMCON), New York, NY, USA, 8–10 November 2018. [Google Scholar]
- LTC6081 Single Supply Strain Gauge Amplifier Circuit Collection. Available online: http://www.analog.com/en/design-center/reference-designs/circuitcollections/ltc6081-single-supply-strain-gauge-amplifier.html (accessed on 8 September 2018).
- Adafruit Feather M0 Adalogger. Available online: https://learn.adafruit.com/adafruit-feather-m0-adalogger/overview (accessed on 30 March 2019).
- Liimatta, J. Strain Gage Testing and Calibration. Available online: https://www.youtube.com/watch?v=c9yVK6_bSGE (accessed on 3 April 2019).
- Kreuzer, M. Strain Gage 1/4 Bridge Calibration With Shunt Signals. Available online: https://s3-eu-central-1.amazonaws.com/centaur-wp/theengineer/prod/content/uploads/2013/11/28152000/HBM29.pdf (accessed on 2 April 2019).
- Vishay. Shunt Calibration of Strain Gage Instrumentation TN-514. Available online: http://www.vishaypg.com/docs/11064/tn514.pdf (accessed on 2 April 2019).
- Cheatle, K. Fundamentals of Test Measurement Instrumentation, 1st ed.; Books24x7.com: Nashua, NH, USA, 2005; pp. 263–267. [Google Scholar]
- Analog Devices. Data Sheet ADXL345. Available online: https://www.analog.com/media/en/technical-documentation/data-sheets/ADXL345.pdf (accessed on 2 July 2019).
- Greiman, B. SdFat. Available online: https://github.com/greiman/SdFat (accessed on 2 April 2019).
- Vernier. How Do You Calibrate an Accelerometer? Available online: https://www.vernier.com/til/418/ (accessed on 10 July 2019).
- Gulf Coast Data Concepts, LLC. Calibrating 3-Axis Accelerometers. Available online: http://www.gcdataconcepts.com/calibration.html (accessed on 10 July 2019).
- The Modal Shop. The Basics of Accelerometer Calibration. Available online: http://modalshop.com/filelibrary/Basics%20of%20Calibration.pdf (accessed on 10 July 2019).
- Adafruit Feather M0 Adalogger. Available online: https://cdn-learn.adafruit.com/downloads/pdf/adafruit-feather-m0-adalogger.pdf (accessed on 16 July 2019).
- Divers, S.J.; Boone, S.S.; Hoover, J.J.; Boysen, K.A.; Killgore, K.J.; Murphy, C.E.; George, S.G.; Camus, A.C. NField endoscopy for identifying gender, reproductive stage and gonadal anomalies in free-ranging sturgeon (Scaphirhynchus) from the lower Mississippi River. J. Appl. Ichthyol. 2009, 25, 68–74. [Google Scholar] [CrossRef]
- Divers, S.J.; Boone, S.S.; Berliner, A.; Kurimo, E.A.; Boysen, K.A.; Johnson, D.R.; Killgore, K.J.; George, S.G.; Hoover, J.J. Nonlethal acquisition of large liver samples from free-ranging river sturgeon (Scaphirhynchus) using single-entry endoscopic biopsy forceps. J. Wildl. Dis. 2013, 49, 321–331. [Google Scholar] [CrossRef] [PubMed]
- Hoover, J.J.; Collins, J.; Boysen, K.A.; Katzenmeyer, A.W.; Killgore, K.J. Critical swimming speeds of adult shovelnose sturgeon in rectilinear and boundary-layer flow. J. Appl. Ichthyol. 2011, 27, 226–230. [Google Scholar] [CrossRef]
- Patel, R.; Riveros, G.; Thompson, D.; Perkins, E.; Hoover, J.; Peters, J.; Tordesillas, A. A transdisciplinary approach for analyzing stress patterns in biostructures. Math. Comput. Appl. 2019, 24, 47. [Google Scholar] [CrossRef]
- Mark, R.; Clark, W. Gothic structural experimentation. Sci. Am. 1984, 251, 176–185. [Google Scholar] [CrossRef]


| Dorsal Strain () | Ventral Strain () | |||
|---|---|---|---|---|
| flow | mean () | std.dev. () | mean () | std.dev. () |
| static | 1.46 × 10 | 1.2024 × 10 | 2.24 × 10 | 4.703 × 10 |
| slow | 9.75 × 10 | 8.8432 × 10 | × 10 | 4.9406 × 10 |
| fast | 1.34 × 10 | 7.9761 × 10 | × 10 | 6.4527 × 10 |
| x-Direction (g) | y-Direction (g) | z-Direction (g) | ||||
|---|---|---|---|---|---|---|
| flow | mean () | std.dev. () | mean () | std.dev. () | mean () | std.dev. () |
| static | 2.852 × 10 | 4.10 × 10 | −4.772 × 10 | 3.09 × 10 | −1.00442 | 3.36 × 10 |
| slow | 2.291 × 10 | 3.91 × 10 | −4.702 × 10 | 4.35 × 10 | −1.00441 | 3.46 × 10 |
| fast | 2.65 × 10 | 1.132 × 10 | −4.574 × 10 | 1.319 × 10 | −1.00554 | 1.488 × 10 |
| Dorsal Strain () | Ventral Strain () | |||
|---|---|---|---|---|
| flow | mean () | std.dev. () | mean () | std.dev. () |
| static | 5.83463 × 10 | 2.82712 × 10 | 2.02928 × 10 | 1.50277 × 10 |
| slow | 1.24807 × 10 | 2.21648 × 10 | −2.00395 × 10 | 2.11473 × 10 |
| fast | 1.47701 × 10 | 3.01531 × 10 | −1.43745 × 10 | 4.94369 × 10 |
| Dorsal Strain | Ventral Strain | |||||
|---|---|---|---|---|---|---|
| flow | slope | intercept | r-square | slope | intercept | r-square |
| static | 5 × 10 | 1 × 10 | 0.6806 | 3 × 10 | 7 × 10 | 0.8006 |
| slow | 1 × 10 | 3 × 10 | 0.1652 | 2 × 10 | 3 × 10 | 0.2375 |
| fast | −6 × 10 | 1 × 10 | 0.0202 | 5 × 10 | 9 × 10 | 0.4516 |
© 2020 by the authors. Licensee MDPI, Basel, Switzerland. This article is an open access article distributed under the terms and conditions of the Creative Commons Attribution (CC BY) license (http://creativecommons.org/licenses/by/4.0/).
Share and Cite
Thurmer, C.R.; Patel, R.R.; Riveros, G.A.; Alexander, Q.G.; Ray, J.D.; Netchaev, A.; Brown, R.D.; Leathers, E.G.; Klein, J.D.; Hoover, J.J. Instrumenting Polyodon spathula (Paddlefish) Rostra in Flowing Water with Strain Gages and Accelerometers. Biosensors 2020, 10, 37. https://doi.org/10.3390/bios10040037
Thurmer CR, Patel RR, Riveros GA, Alexander QG, Ray JD, Netchaev A, Brown RD, Leathers EG, Klein JD, Hoover JJ. Instrumenting Polyodon spathula (Paddlefish) Rostra in Flowing Water with Strain Gages and Accelerometers. Biosensors. 2020; 10(4):37. https://doi.org/10.3390/bios10040037
Chicago/Turabian StyleThurmer, Clayton R., Reena R. Patel, Guilermo A. Riveros, Quincy G. Alexander, Jason D. Ray, Anton Netchaev, Richard D. Brown, Emily G. Leathers, Jordan D. Klein, and Jan Jeffrey Hoover. 2020. "Instrumenting Polyodon spathula (Paddlefish) Rostra in Flowing Water with Strain Gages and Accelerometers" Biosensors 10, no. 4: 37. https://doi.org/10.3390/bios10040037
APA StyleThurmer, C. R., Patel, R. R., Riveros, G. A., Alexander, Q. G., Ray, J. D., Netchaev, A., Brown, R. D., Leathers, E. G., Klein, J. D., & Hoover, J. J. (2020). Instrumenting Polyodon spathula (Paddlefish) Rostra in Flowing Water with Strain Gages and Accelerometers. Biosensors, 10(4), 37. https://doi.org/10.3390/bios10040037