Article

Electrochemical Sensing of Serotonin by a Modified MnO2-Graphene Electrode

1
Department of Bioelectronics and Biosensors, Alagappa University, Karaikudi 630003, India
2
Department of Engineering, University of Messina, 98166 Messina, Italy
3
Department of Mathematical and Computational Sciences, Physics and Earth Physics, University of Messina, 98166 Messina, Italy
*
Authors to whom correspondence should be addressed.
Biosensors 2020, 10(4), 33; https://doi.org/10.3390/bios10040033
Submission received: 11 February 2020 / Revised: 23 March 2020 / Accepted: 30 March 2020 / Published: 2 April 2020

Abstract

:
The development of MnO2-graphene (MnO2-GR) composite by microwave irradiation method and its application as an electrode material for the selective determination of serotonin (SE), popularly known as “happy chemical”, is reported. Anchoring MnO2 nanoparticles on graphene, yielded MnO2-GR composite with a large surface area, improved electron transport, high conductivity and numerous channels for rapid diffusion of electrolyte ions. The composite was characterized by X-ray photoelectron spectroscopy (XPS), Raman spectroscopy and scanning electron microscopy (SEM) for assessing the actual composition, structure and morphology. The MnO2-GR composite modified glassy carbon electrode (GCE) exhibited an excellent electrochemical activity towards the detection of SE in phosphate buffer saline (PBS) at physiological pH of 7.0. Under optimum conditions, the modified electrode could be applied to the quantification of serotonin by square wave voltammetry over a wide linear range of 0.1 to 800 µM with the lowest detection limit of 10 nM (S/N = 3). The newly fabricated sensor also exhibited attractive features such as good anti-interference ability, high reproducibility and long-term stability.

1. Introduction

5-hydroxytryptamine (5-HT), also named serotonin (SE), is one of the most important monoamine neurotransmitters that has a popular image as a contributor to feelings of wellbeing and happiness [1]. The level of serotonin in the human physiological system regulates sleeping, eating and digesting [2] and also controls the mood disorders, depression symptoms such as anxiety or depression [3,4,5]. Therefore, accurate detection of SE is of utmost importance for the diagnosis, prognosis and outcome of depressed patients. Currently, various methods like fluorometry, HPLC, coulometry, electrophoresis and ELISA have been proposed to determine the concentration of serotonin [6,7,8,9]. However, these conventional techniques are not appropriate for rapid detection and everyday tests of SE detection in real samples, because they are time-consuming, expensive and need of specialized operators. Hence, the development of simpler and cheaper electrochemical sensors for the determination of SE has received considerable interest last few years [10,11].
Many electrochemical strategies have been therefore reported for selective and simultaneous determination of SE along with several potential biological interferences [12]. For example, ascorbic acid (AA) and dopamine (DA) coexist with SE in physiological samples such as blood and urine as well as in extracellular fluid at a high concentration level. Further, a poor response and great interferences were observed at the conventional electrodes in SE determination due to their almost similar oxidation potential [13]. In order to overcome these limitations, nanostructured metal oxide [14], WO3 [15], Fe3O4-chitosin [16], graphene-polyaniline [17], Au-Ag nano-alloy [18] and carbon nanotube [19] have been used as electrode materials for selective and sensitive detection of SE. These modifiers are generally used to lower overpotential towards the oxidation of serotonin, in comparison with unmodified electrodes. The analytical responses obtained by using modifiers are usually higher and reproducibility of the electrode performance gets improved significantly.
MnO2 is one of the most promising transition metal oxides for electrochemical applications due to its non-toxicity, environmental compatibility and low cost [20,21]. However, its relatively poor electrical conductivity usually demands the addition of conductive supportive matrix (like graphene) to enhance the charge transfer rate. Graphene, as a two-dimensional carbonaceous material, is the most accredited in the field of electrochemical sensors due to its strong interaction and increased contact area which greatly promote the electrocatalyst stability and give a high electrical conductivity [22]. Recently, much research has been focused on coupling of MnO2 with graphene to form hybrid material with enhanced performance as compared to their individual counterparts. Thus, the integration of MnO2 nanoparticles on graphene sheet potentially paves the way to enhance specific surface area, improved electron transport, high conductivity and numerous channels for diffusion of electrolyte ions. Such MnO2-graphene composite has proved its superiority as electrode material in various applications such as solar cells, supercapacitors, and flexible electronic devices [23].
Here, we report an eco-friendly, rapid and economical route to synthesize MnO2-GR composite and its application for the fabrication of electrochemical serotonin sensor. Microwave heating increases the rate of certain chemical reactions by several folds when compared to conventional heating. Moreover, it does not produce any green gas or other side products and the use of solvents in the chemical reaction can also be removed or reduced significantly. In this context, the prepared MnO2-GR composite has more advantages than other nanocomposites [13,14,15,16]. This composite has been used as an electrode material for determination of SE with high sensitivity and selectivity over a wide range (0.1–800 μM) with the lowest detection limit of 10 nM. The sensor exhibits high reproducibility and efficient anti-interference ability in the presence of common interferents such as ascorbic acid and uric acid.

2. Materials and Methods

2.1. Reagents and Materials

Analytical grade KMnO4, H2SO4 and NH4OH were purchased from Fischer Scientific, Mumbai and graphite powder (99.9995% purity), serotonin, dopamine, ascorbic acid, and uric acid were obtained from Sigma Aldrich. 0.1 M phosphate buffer solution (PBS) with different pH values were freshly prepared by adjusting pH with 0.1 M HCl or NaOH. The serotonin solution was prepared daily by dissolving the appropriate amount in PBS.

2.2. Synthesis of Graphene Oxide (GO) and MnO2-Graphene Composite

Graphene oxide was prepared from natural graphite powder according to Hummers method [24]. MnO2-graphene composite was synthesized by microwave irradiation method. Initially, graphene oxide (GO-50 mg) was dispersed in 100 mL of Milli-Q water and ultra sonicated for 30 min and then 0.1 M KMnO4 powder was added into the solution under stirring. Subsequently, the resulting suspension was kept in microwave oven at 600 W for 10 min, and then cooled to room temperature naturally. The sample was centrifuged at 3000 rpm for 30 min and dried for 12 hrs at 100 °C in ambient air after washing with ethanol and deionized water. The pure MnO2 nanoparticles were also prepared without adding GO in the mixture solution.

2.3. MnO2-Graphene Composite Modified Electrode

Prior to the fabrication, glassy carbon electrodes (GCEs) were polished with alumina powders (1.0, 0.5 and 0.3 µm) and then rinsed with ethanol and distilled water and dried at room temperature. An amount of 1 mg of MnO2-GR composite suspension was prepared (1 mg in 1 mL of water) and then 5 μL of the suspension was drop coated on the electrode, to form the MnO2-GR/GCE after during in ambient temperature.

2.4. Instruments and Measurements

Field emission-scanning electron microscope (FE-SEM) images were obtained using a ZEISS 1540XB equipped with an EDX detector. X-ray photoemission spectra (XPS) were performed by a K-α spectrometer equipped with a conventional Al-Kα X-ray source and a concentric hemispherical analyzer with pass energy of 20 eV. During each measurement, the analysis chamber pressure was in the 10−9 mbar range. For all the investigated core levels, the Ag 3d5/2 level was used as a reference (368.0 eV). The relative concentration of manganese, oxygen and carbon atoms were calculated by the areas under the Mn 2p, O 1s and C 1s peaks weighted by the relative sensitivity factors. Raman spectra were analyzed by aXploRA micro-Raman equipment coupled with an Olympus BX40 microscope. The 532 nm line of a diode laser was focused on the samples surface through the 50X objective of the microscope. The scattered signal was analyzed by a monochromator equipped with a 600 line/mm holographic grating and collected by a CCD sensor.
Electrochemical measurements were performed in conventional three-electrode system comprising a glassy carbon electrode (GCE; 3 mm in diameter) coated with MnO2-GR/GCE as the working electrode, a platinum wire as the counter electrode, and an Ag/AgCl (3 M KCl) as the reference electrode using a CHI 900 workstation. Square wave voltammetry (SWV) measurements were carried out in PBS (pH 7.0) in the potential region from 0.1 to 1.0 V with frequency of 10 Hz, an amplitude of 50 mV and a step potential of 5 mV.

3. Results

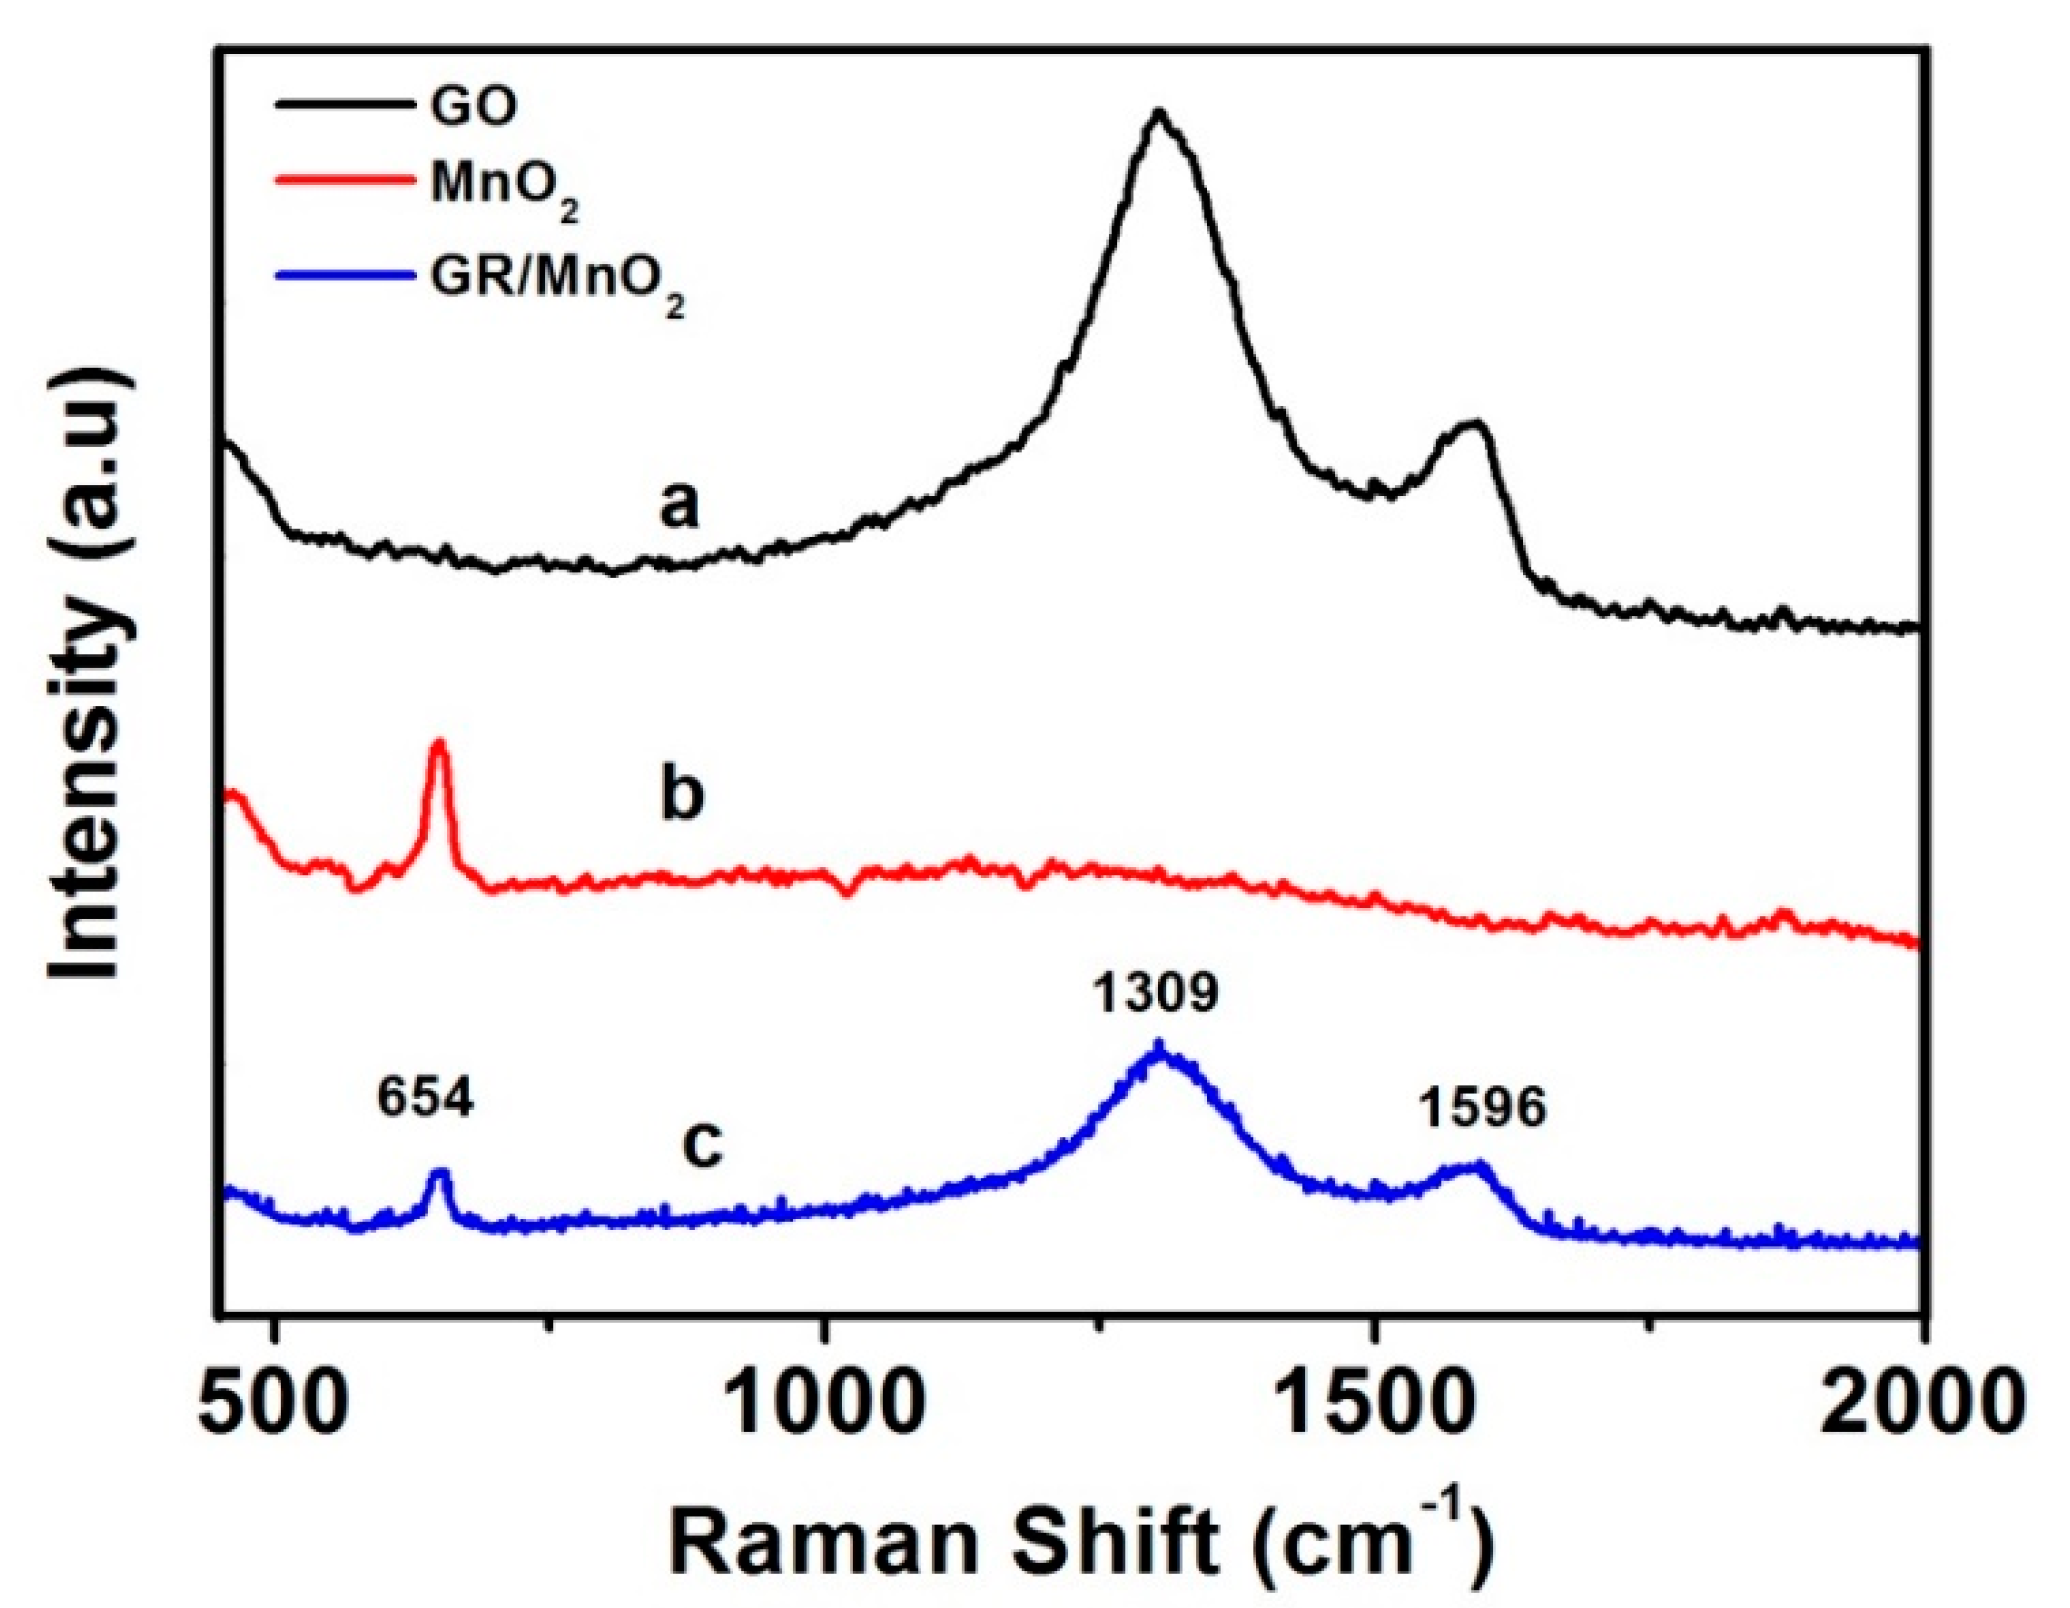
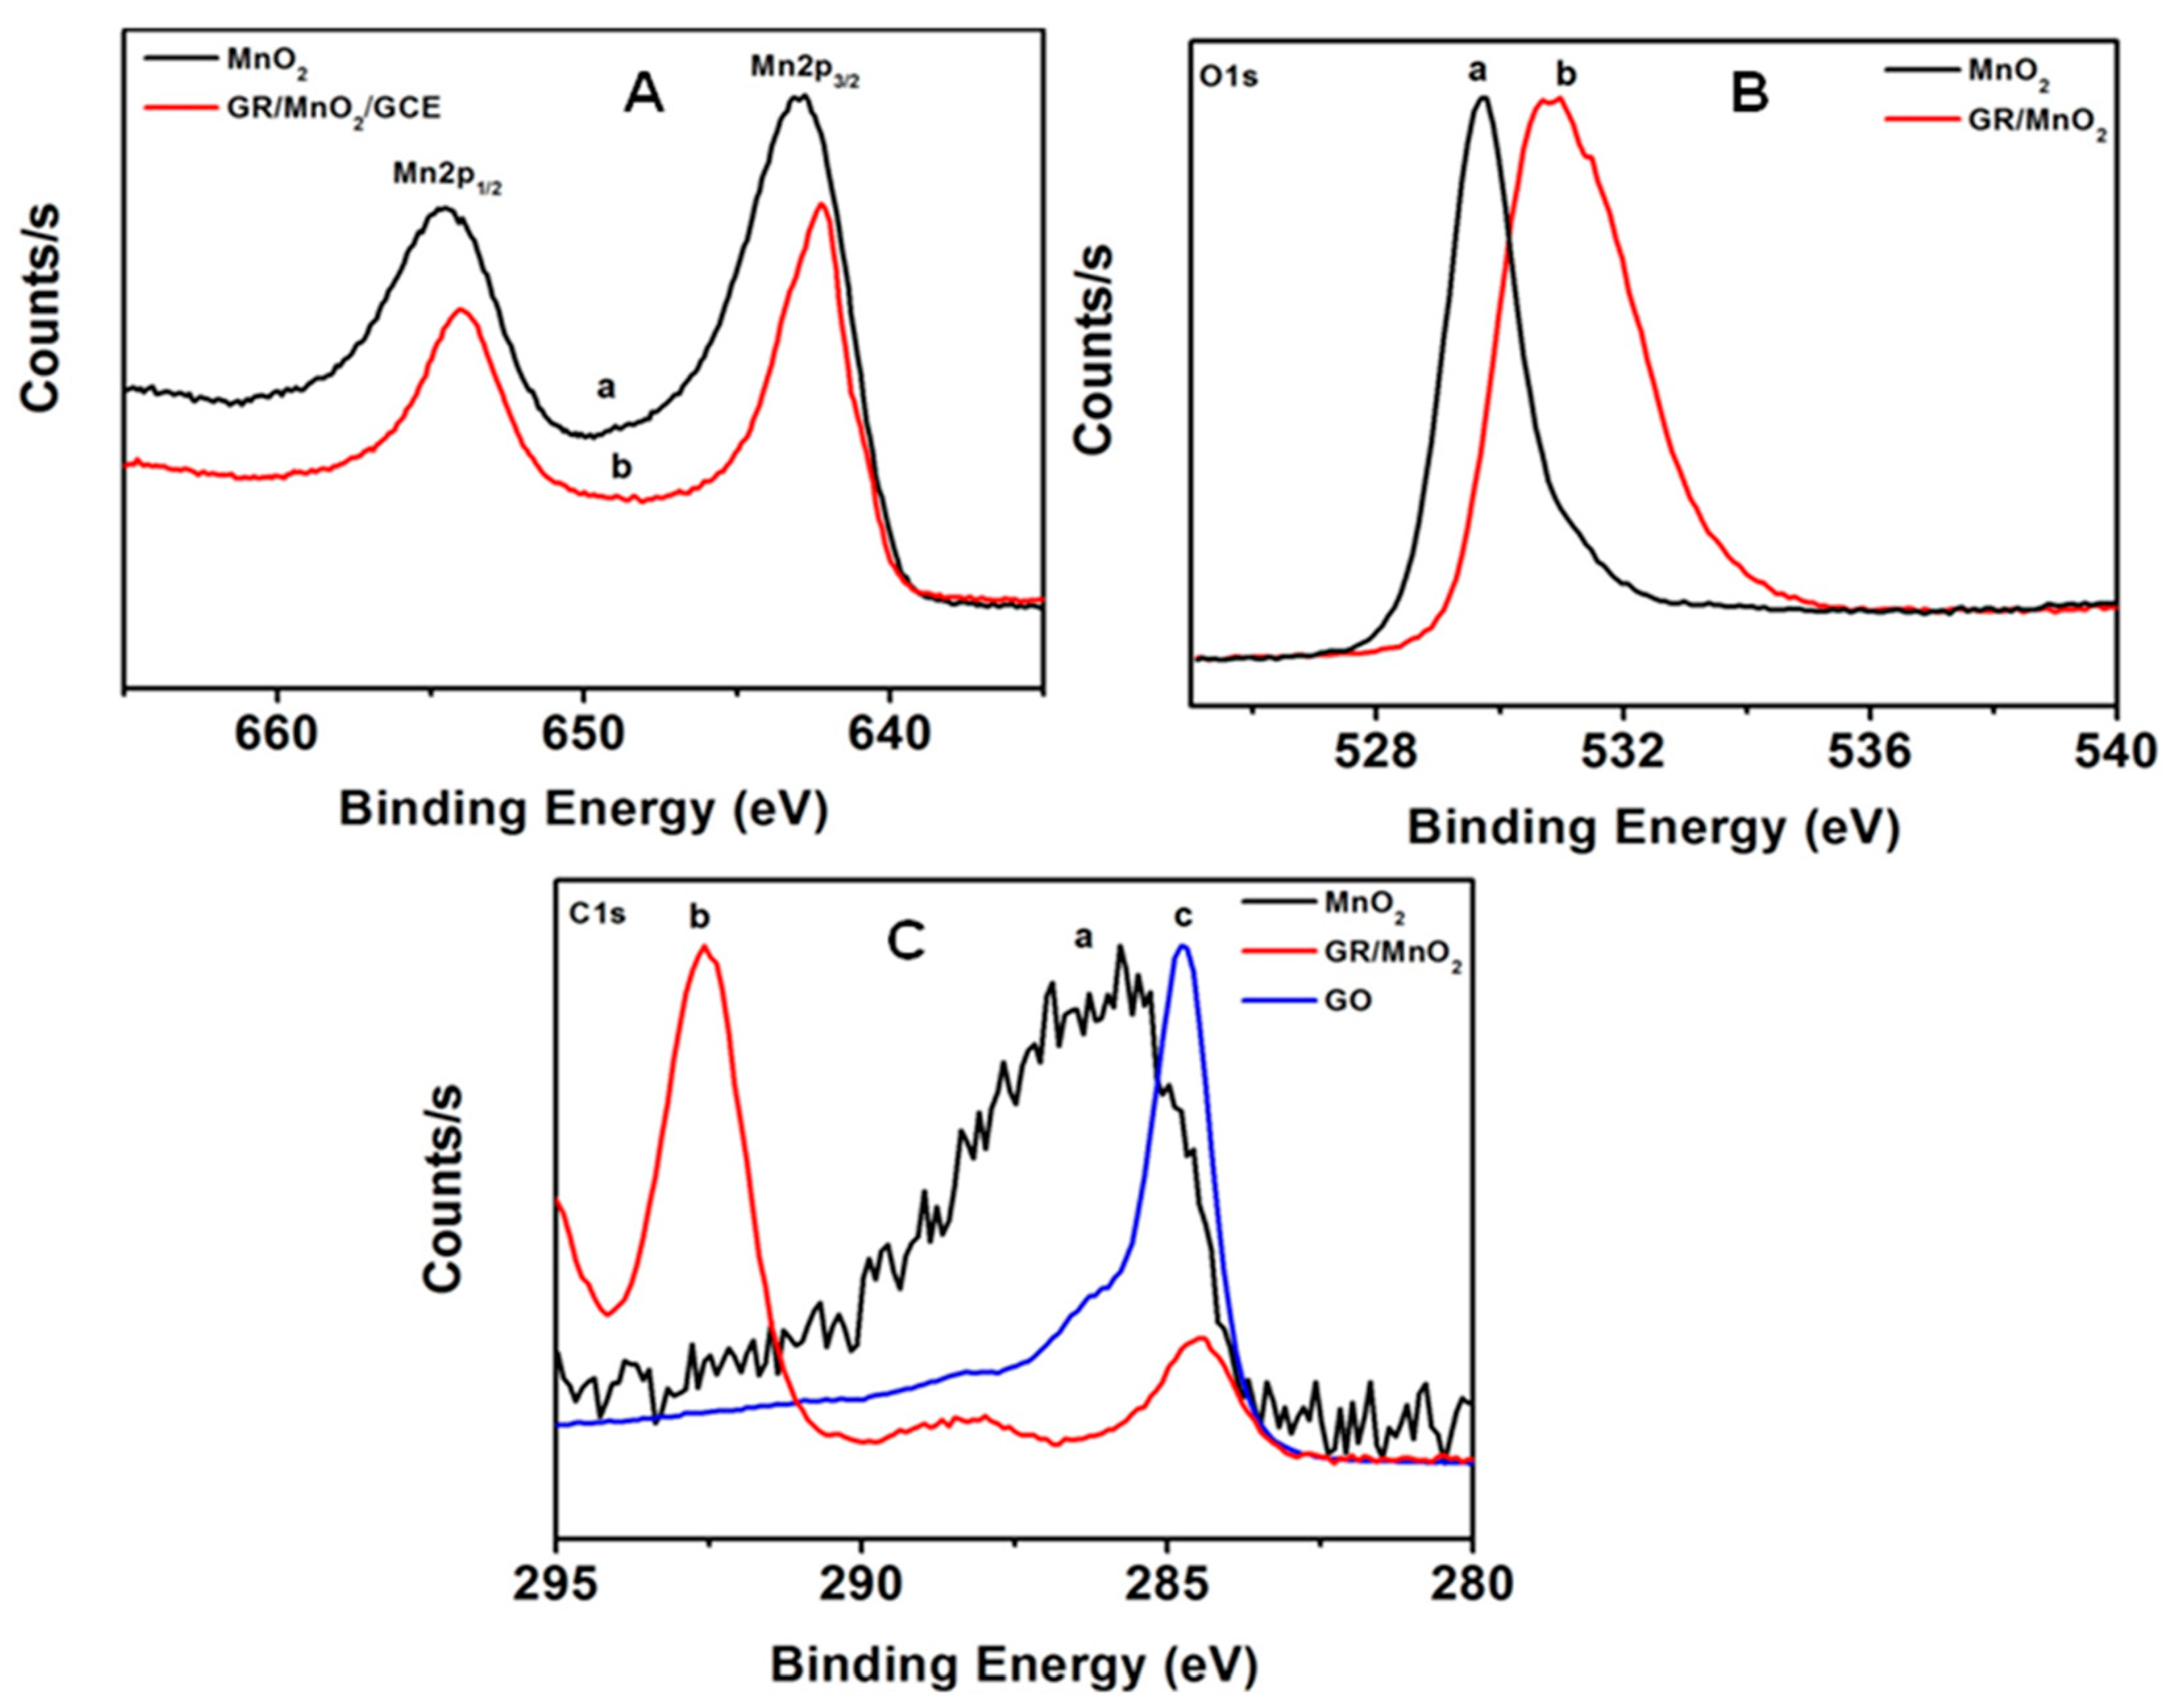
3.1. Morphological, Raman and XPS Studies

The surface morphology of the MnO2-GR composite was examined using FE-SEM. Representative images (Figure 1) show wrinkles and folds with the thin layers of graphene whereas MnO2 appear to self-assemble into a mesh-like structure (Figure 1B). SEM images of the composite (Figure 1C) show that the MnO2 particles are uniformly anchored on graphene sheets, which is a desirable prerequisite for improved electrocatalytic activity.
Figure 2 shows EDAX elemental mappings with a typical SEM image beside the corresponding C, Mn and O maps. The homogeneous distribution of Mn and O elements indicates that the MnO2 is dispersed uniformly on graphene sheets. This wrapped MnO2 on graphene is expected to exhibit a higher electrical conductivity and an improved electrocatalytic activity.
Raman spectra of GO, MnO2 and MnO2-GR composite are shown in Figure 3. The characteristic MnO2 Raman peak centred at 654 cm−1, ascribed to Mn–O symmetric stretching vibration in the basal plane of MnO6 [25], is noted both in MnO2 and MnO2-GR composite. The peak observed for GO at 1596 cm−1, which is attributed to the bond stretching of the pairs of C sp2 atoms (known as E2g phonon mode) and the breathing mode of rings (A1g phonon mode) at 1309 cm−1, are labelled G and D bands, respectively. The ID/IG ratio values of GO and MnO2-GR composite were about 1.21 and 1.09 respectively. It is noteworthy that with the addition of MnO2 on graphene, the ID/IG intensity ratio decreases. As is well known, the ID/IG intensity ratio is a measure of disorder degree, therefore its decrease suggest that the MnO2-GR composite is more ordered than pristine GO. This confirms the transformation of GO sheets into graphene. The reduction of GO to graphene during the preparation of MnO2/graphene composites has been reported also by other authors [26].
The chemical composition and surface bonding configurations were investigated by XPS analysis. The high-resolution Mn 2p XPS spectra of the pristine MnO2 and MnO2-GR nanocomposite are shown in Figure 4. Both the samples are characterized by bands typical of Mn 2p3/2 (642.1 eV) and Mn 2p1/2 (653.7 eV) respectively. Interestingly, in MnO2-GR, these bands are shifted to higher binding energies (BE). Instead, the spin-orbit energy separation was found similar to pristine MnO2 (11.6 eV), which suggests the presence of MnO2 nanostructures in the composite.
In the oxygen region, a broad O 1s band underlies two sub-bands. One is centred at about 530 eV related to oxygen bonded with Mn (Mn-O) in MnO2 crystal lattice [27] and the second, at 531 eV, can be attributed to surface hydroxyl on carbon, respectively). As regards carbon region, C 1s band come from different contributions: C-C bond at 284.5 eV, C-OH (hydroxyl and epoxy groups) bond at 285.8 eV, C-O-C and C=O bonds at 286.6 and 287.7 eV and OH-C=O (carbonyl groups) bond at 288.9 eV. The additional band at 291.0 eV refers to π–π bonds while the aliphatic carbon from the carboxylic acid functionalized graphene bonds are located in the range 292–295 eV.

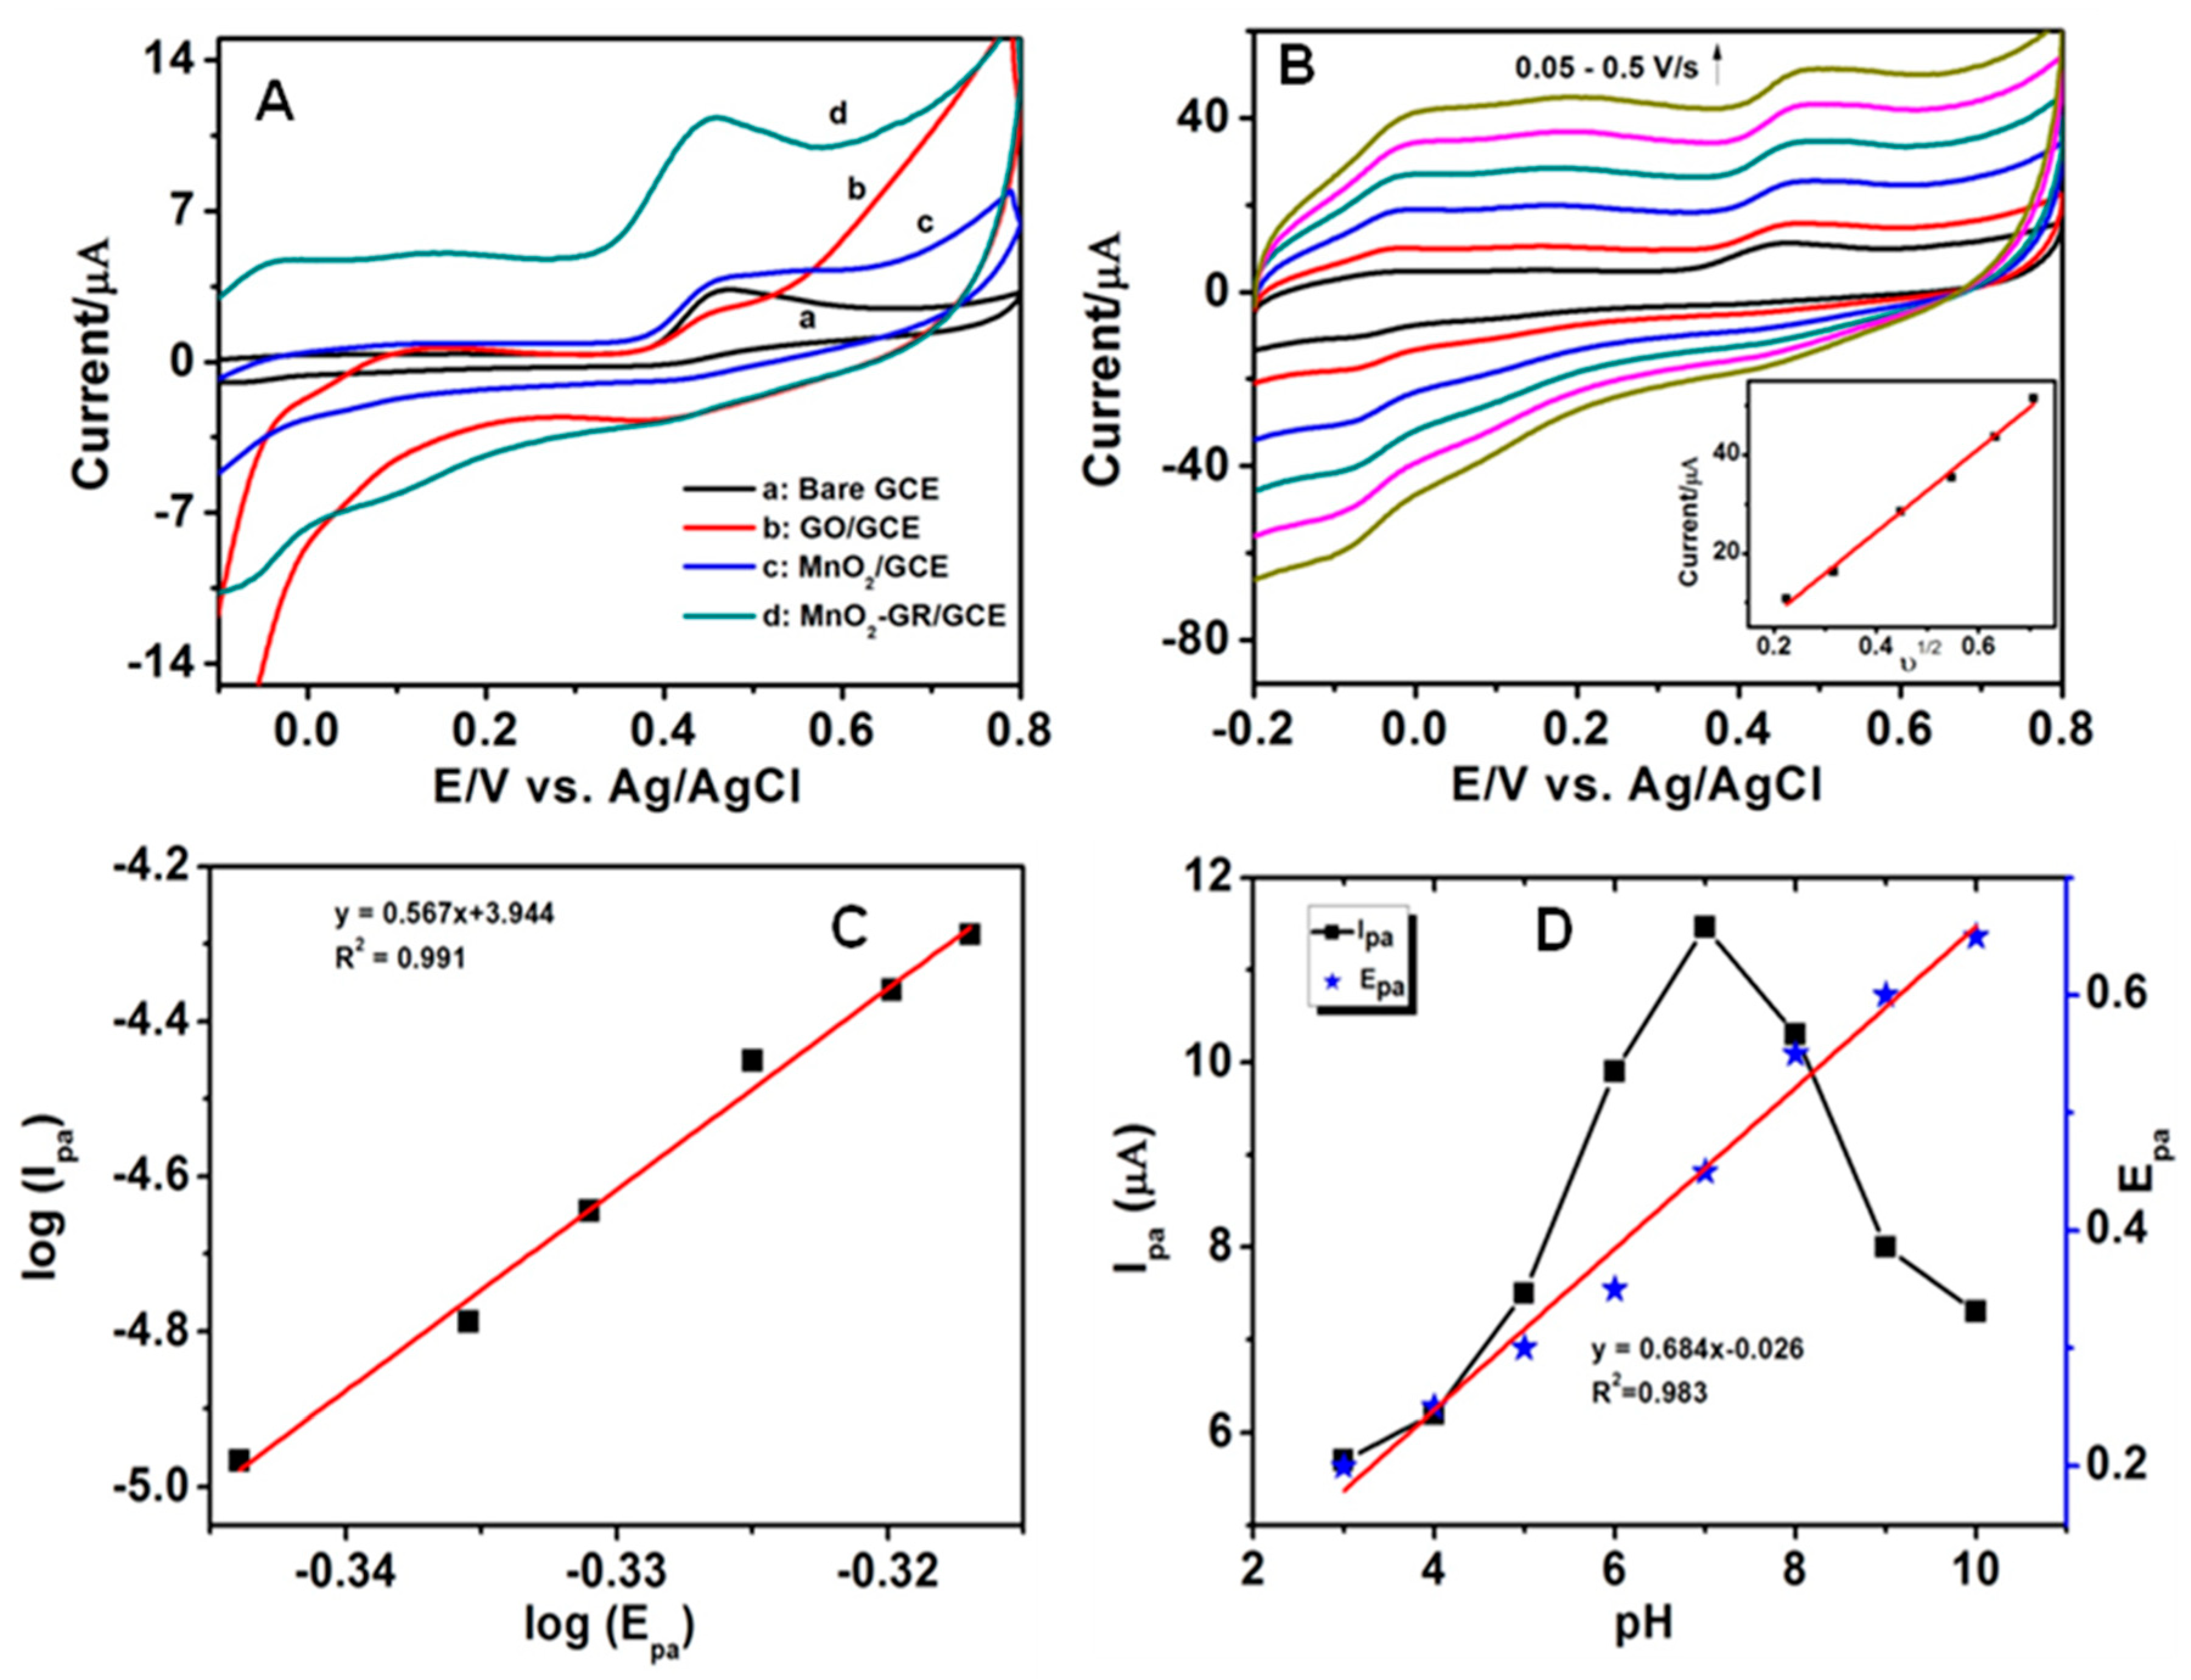
3.2. Electrochemical Behaviour of SE at the MnO2-GR Modified GCE

The electrocatalytic activity of serotonin at different modified electrodes was investigated by cyclic voltammetry (CV). Figure 5A shows the CVs of the bare GCE (a), GO (b), MnO2 (c) and MnO2-GR (d) modified GCEs in 0.1 M PBS (pH 7.0) containing 0.5 mM SE recorded at the scan rate of 50 mVs−1. As can be seen from Figure 5Aa, bare GCE shows weak anodic peak for SE indicating poor electron transfer kinetics at the interface. Compared with the bare electrode and GO/GCE, the electrochemical response of SE at the MnO2 modified GCE was higher with enhanced anodic peak current values of Ipa = 3.91 μA. However, a significantly higher current was noted at the oxidation potential of 0.45 V for the MnO2-GR composite modified GCE (curve d) corresponding to electrochemical oxidation of serotonin. The oxidation peak current (11.26 μA) of SE at MnO2-GR composite was two-fold higher than that of MnO2 and GO modified electrodes which could be mainly due to the synergistic effect of graphene and MnO2 NPs.
The unique physical and chemical properties of the composite significantly improve the oxidation of SE at the modified electrode and greatly improve the current response. Here, the improved surface area of the nanocomposite provides a microenvironment for preserving the adsorbed SE molecules and therefore, MnO2-GR modified GCE was used for further experiments.

3.3. Effect of Scan Rate and Mechanisms for Electrode Reaction of SE

In order to study the plausible mechanism involved in the electrocatalytic oxidation, the effect of scan rate (υ) on the reaction of 100 µM SE at the MnO2-GR modified GCE have been carried out for various scan rates from 50 to 500 mVs−1. As shown in Figure 5B, the oxidation peak current increased linearly and the oxidation peak potential shifted slightly toward positive direction which is a typical characteristic of irreversible process. The plots of peak current as a function of square root of scan rate (υ1/2) for SE is shown in the inset of Figure 5B. It was noted that, the oxidation peak currents increase linearly with square root of the scan rate for various scan rates. The linear regression equation is deduced as ipa (μA) = 8.413 + 3.03υ1/2 (mVs−1) (R2 = 0.993). Thus, the electron transfer kinetics of SE on the MnO2-GR/GCE was deduced. The anodic peak potential (Ep) and log υ showed a linear relationship with the regression equations as Epa(V) = 0.567logυ + 3.944 (R2 = 0.988) for serotonin. The surface concentration of the electroactive species was estimated according to the equation,
Ip = n2F2AΓv/4RT
Here, the peak current is related to the surface concentration of the electroactive species Γ, where n represents the number of electrons involved in the reaction, A is the surface area of the electrode (0.07 cm2) and Γ is the surface coverage and the other symbols have their usual meanings. From the slope of the anodic currents vs. the scan rate, the calculated surface concentration of MnO2-GR/GCE is 1.037 nM cm−2 (n = 2) which seems to be optimum value for improved electron transfer reaction at the interface.

3.4. Effect of pH Value

It is well known that electrochemical reactions occurring at metal oxide electrodes are generally accompanied by the exchange of protons with the solution. The influence of pH on the electrochemical responses of MnO2-GR modified GCE towards the detection of SE has been investigated (Figure 5D) in different pH phosphate buffer saline (range from 4 to 9) at a scan rate of 50 mV/s. As observed in Figure 5D, the anodic peak potential (Epa) shifted negatively with increasing pH values, indicating that the protons participate in the electrochemical reaction of SE. A good linear relationship between Epa and pH was observed with regression equation of Epa (SE) = 0.068 pH + 0.026. The slope value of dEP/dpH plot was found to be close to the theoretical value of 59 mV/pH expected for the 1H+ per electron stoichiometry. Therefore, the reaction of SE at the modified electrode was a two-electron process. On the other hand, the oxidation peak current (Ipa) of SE increased with an increase of pH. The plausible mechanism for the determination of SE at the MnO2/GR modified electrode is shown in Scheme 1. The highest anodic peak current was observed at pH 7.0, which has been chosen for further electrochemical measurements.

3.5. Electrochemical Determination of SE at the MnO2-GR Modified Electrode

Square wave voltammetry (SWV) technique has been used to examine the electrochemical response of MnO2-GR modified GCE by changing the concentration of serotonin in the presence of ascorbic acid (Figure 6). Compared to cyclic voltammetry, the SWV technique has a lot of advantages, such as the increase of sensitivity and resolution, in quantitative analysis of physiological samples where serotonin usually coexists with higher concentrations of ascorbic acid (AA), uric acid (UA) and folic acid (FA) which strongly affects the selectivity and sensitivity [14]. In the present work, the oxidation peak current increased linearly with increasing the concentration of SE from 0.1 to 800 μM at MnO2-GR/GCE. The inset of Figure 6 shows the calibration curve of the modified electrode with good correlation coefficient of 0.991 and the lowest detection limit was calculated as 10 nM. Compared with the other reported sensors [15,28], the proposed electrode works at pH 7.0 without using enzymes or mediators and that the sensor has wide linear response range, low detection limit and high repeatability and stability. Anithaa et al. [15] have reported a significantly high LOD of 0.001 μM and wider linear range for the detection of SE at pH 7.0. However, the authors used gamma ray source for the electrode material modification which is a fairly sophisticated facility requiring trained manpower to operate. Similarly, Lavanya et al. also reported SnO2-SnS2 composite electrode material for SE detection with high accuracy [28]. The disadvantage here is the relatively less stable SnS2 when compared to SnO2. Hence, there was a need to develop a less expensive, more stable electrode material with superior sensing ability for detection of the very important happy chemical serotonin. In this endeavor, we have noted that the present electrode made of MnO2 along with the highly stable graphene exhibited wider concentration of 0.1–150 and 150–800 μM when compared to the other electrodes (Table 1). SWV experiments for the electrochemical determination of SE at the MnO2 and GO modified GCEs individually did not yield the desired results in comparison with that of MnO2-GR composite (results not shown). Hence, it can be concluded that the MnO2-GR modified electrode is more suitable for the determination of SE in both biological samples and pharmaceutical products.

3.6. Selectivity, Stability and Reproducibility of the MnO2-GR/GCE

Selective determination of serotonin is a challenge because its oxidation potential is at the same value as that of other neurotransmitters such as dopamine (DA) and epinephrine (EP). Anithaa et al. found that the oxidation potential of SE (0.39 V) is close to that of DA (0.22 V) and EP (0.20 V) on WO3 nanoparticles [15]. Similar findings have been reported by other authors, with the result of the overlapping of oxidation potentials towards detection of SE in mixed samples [16]. Hence, influence of some potential inorganic ions and organic molecules on the electrochemical determination of SE has been tested in order to evaluate the anti-interference ability of the fabricated sensor (Figure 7). The results indicated that 100 fold concentrations of Na2+, K+, Mg2+ and 10-fold excess dopamine, epinephrine, folic acid, uric acid, ascorbic acid, glucose (500 μM) had no obvious influences on the response of 50 µM serotonin with deviations below ± 5%. Moreover, the oxidation potential of NE (0.6 V) is far from SE (0.4 V), therefore the interferent NE will not influence the detection SE.
Moreover, the stability and reproducibility of the MnO2-GR/GCE were also evaluated in 100 μM SE in PBS. The oxidation peak current of the developed electrode had a relative standard deviation (RSD) of 1.29% after 20 successive scans, indicating the MnO2-GR/GCE has good stability. In addition, it was noted that the modified electrode easily gets regenerated for the next measurement even after using it for a continuous three cycles in 0.1 M PBS, and a RSD value of about 2.3% obtained for the regenerated MnO2-GR/GCE after measurement for 10 times in the same solution. The reproducibility of the developed sensor was studied with six different electrodes and the peak current obtained in the five repeated measurements showed an RSD value of 1.2%. The results clearly indicate that the developed sensor has high selectivity, reproducibility and good stability.

3.7. Real sample Analysis

To evaluate the applicability of the MnO2-GR/GCE, the human blood serum was used for real sample analysis. Abnormal concentrations of SE in serum have been shown to reflect the derailed serotonergic function in central nervous system. As a preliminary application in clinical studies, the developed sensor was used to assess the SE concentration in healthy human serum samples diluted 100 times with a 0.1 M PBS (pH 7.0) before the measurements. Figure 8 shows voltammograms of unspiked and spiked samples. The oxidation peak current at 0.42 V was increased when adding the known concentration of SE. The recovery results are given in Table 2.

4. Conclusions

In this work, MnO2-GR nanocomposite has been synthesized by microwave irradiation method and used as electrode material for the fabrication of novel electrochemical sensor for the determination of serotonin in the presence of ascorbic acid for the first time. The developed electrode showed improved electrocatalytic activity towards the detection of SE when compared to other modified electrodes in phosphate buffer saline at pH 7.0. Moreover, the fabricated sensor exhibited wide linear range from 0.1 to 800 μM for SE with the lowest detection limit of 10 nM with good selectivity, high reproducibility and stability. The analytical application of the developed sensor was examined with human blood serum for quantification of SE and which yielded acceptable results. These results demonstrate that the MnO2-GR nanocomposite has great potential for applications in electrochemical sensors and biosensors design.

Author Contributions

Conceptualization, L.N., S.C. and G.N.; methodology, L.N.; investigation, L.N., E.F., S.G.L., A.B. and F.N.; writing—review and editing, L.N., S.C. and G.N. All authors have read and agreed to the published version of the manuscript.

Funding

This research was funded by Council for Scientific Industry and Research for Research Associate award (CSIR-RA).

Acknowledgments

NL thanks Council for Scientific Industry and Research for Research Associate award (CSIR-RA). CS acknowledges the CSIR (No.03(1419)/18/EMR-II dated:04.06.2018) and MHRD-RUSA 2.0 (No. F.24-51/2014- U, Policy (TNMulti-Gen), dated 09.10.2018) for the financial assistance.

Conflicts of Interest

The authors declare no conflict of interest.

References

  1. Berger, M.; Gray, J.A.; Roth, B.L. The expanded biology of serotonin. Annu. Rev. Med. 2009, 60, 355–366. [Google Scholar] [CrossRef] [PubMed] [Green Version]
  2. Lin, M.T.; Tsay, H.J.; Su, W.H.; Chueh, F.Y. Changes in extracellular serotonin in rat hypothalamus affect thermoregulatory function. Am. J. Phys. 1998, 274, 1260–1267. [Google Scholar] [CrossRef] [PubMed]
  3. Jacobs, B.L.; Azmitia, E.C. Structure and function of the brain serotonin system. Physiol. Rev. 1992, 72, 165–229. [Google Scholar] [CrossRef] [Green Version]
  4. Bin, H.-H.; Keattch, O.; Yeoman, M.; Covill, D.; Patel, B. Three-dimensional-printed electrochemical sensor for simultaneous dual monitoring of serotonin overflow and circular muscle contraction. Anal. Chem. 2018, 18, 12014–12020. [Google Scholar]
  5. Samaranayake, S.; Abdalla, A.; Robke, R.; Nijhout, H.F.; Reed, M.-C.; Best, F.; Hashem, P. voltammetric and mathematical analysis of histaminergic modulation of serotonin in the mouse hypothalamus. J. Neurochem. 2016, 138, 374–383. [Google Scholar] [CrossRef] [Green Version]
  6. Mumtaz, M.; Narasimhachari, N.; Friedel, R.O.; Pandey, G.N.; Davis, J.M. Evaluation of fluorometric assay methods for serotonin in platelets. Plasma and whole blood samples by comparison with GC–MS-SIM technique. Res. Commun. Chem. Pathol. Pharm. 1982, 36, 45–60. [Google Scholar]
  7. Umeda, S.; Stagliano, G.W.; Borenstein, M.R.; Raffa, R.B. A reverse-phase HPLC and fluorescence detection method for measurement of 5-hydroxytryptamine (serotonin) in planaria. J. Pharm. Toxicol. Methods 2005, 51, 73–76. [Google Scholar] [CrossRef]
  8. Peterson, Z.D.; Lee, M.L.; Graves, S.W. Determination of serotonin and its precursors in human plasma by capillary electrophoresis-electrospray ionization-time-of-flight mass spectrometry. J. Chromatogr. B Anal. Technol. Biomed. Life Sci. 2004, 810, 101–110. [Google Scholar] [CrossRef]
  9. Chauveau, J.; Fert, V.; Morel, A.M.; Delagee, M.A. Rapid and specific enzyme immunoassay of serotonin. Clin. Chem. 1991, 37, 1178–1184. [Google Scholar] [CrossRef]
  10. De Irazu, S.; Unceta, N.; Carmen Sampedro, M.; Aranzazu Goicolea, M.; Barrio, R.J. Multimembrane carbon fiber microelectrodes for amperometric determination of serotonin in human urine. Analyst 2001, 126, 495–500. [Google Scholar] [CrossRef]
  11. Manciu, F.S.; Manciu, M.; Ciubuc, J.D.; Sundin, E.M.; Ochoa, K.; Eastman, M.; Durrer, W.G.; Guerrero, J.; Lopez, B.; Subedi, M.; et al. Simultaneous detection of dopamine and serotonin—A comparative experimental and theoretical study of neurotransmitter interactions. Biosensors 2019, 9, 3. [Google Scholar] [CrossRef] [PubMed] [Green Version]
  12. Mahato, K.; Purohit, B.; Bhardwaj, K.; Jaiswal, A.; Chandra, P. Novel electrochemical biosensor for serotonin detection based on gold nanoparticles decorated reduced graphene oxide in biological fluids and in vitro model. Biosens. Bioelectron. 2019, 142, 111502. [Google Scholar] [CrossRef] [PubMed]
  13. Han, H.-S.; Lee, K.-L.; You, J.-M.; Jeong, H.; Jeon, S. Electrochemical biosensor for simultaneous determination of dopamine and serotonin based on electrochemically reduced GO porphyrin, Sens. Actuators 2014, 190, 886. [Google Scholar] [CrossRef]
  14. Fayemi, O.E.; Adekunle, A.S.; Ebenso, E.E. Electrochemical determination of serotonin in urine samples based on metal oxide nanoparticles/MWCNT on modified glassy carbon electrode. Sens. Bio Sens. Res. 2017, 13, 17–27. [Google Scholar] [CrossRef]
  15. Anithaa, A.C.; Asokan, K.; Sekar, C. Highly sensitive and selective serotonin sensor based on gamma ray irradiated tungsten trioxide nanoparticles. Sens. Actuators B Chem. 2017, 238, 667–675. [Google Scholar] [CrossRef]
  16. Ran, G.; Chen, X. Xia, Electrochemical detection of serotonin based on a poly(bromocresol green) film and Fe3O4 nanoparticles in a chitosan matrix. RSC Adv. 2017, 7, 184. [Google Scholar] [CrossRef] [Green Version]
  17. Xue, C.; Wang, X.; Zhu, W.; Han, Q.; Zhu, C.; Hong, J.; Zhou, X.; Jiang, H. Electrochemical serotonin sensing interface based on double-layered membrane of reduced graphene oxide/polyaniline nanocomposites and molecularly imprinted polymers embedded with gold nanoparticles. Sens. Actuators B Chem. 2014, 196, 57–63. [Google Scholar] [CrossRef]
  18. Thanh, T.-D.; Balamurugan, J.; Hien, H.-V.; Kim, N.-H.; Lee, J.-H. A Novel sensitive sensor for serotonin based on high-quality of Au-Ag nanoalloy encapsulated graphene electrocatalyst. Biosen. Bioelectron. 2017, 96, 186–193. [Google Scholar] [CrossRef]
  19. Kumara Swamy, B.-E.; Venton, B.-J. Carbon nanotube-modified microelectrodes for simultaneous detection of dopamine and serotonin in vivo. Analyst 2007, 132, 876–884. [Google Scholar] [CrossRef]
  20. Shen, M.; Zhu, S.J.; Liu, X.; Fu, X.; Huo, W.C.; Liu, X.L.; Chen, Y.X.; Shan, Q.Y.; Yao, H.-C.; Zhang, Y.X. Phase and morphology controlled polymorphic MnO2 nanostructures for electrochemical energy storage. Cryst. Eng. Comm. 2019, 21, 5322–5331. [Google Scholar] [CrossRef]
  21. Qu, Q.T.; Zhang, P.; Wang, B.; Chen, Y.H.; Tian, S.; Wu, Y.P.; Holze, R. Electrochemical performance of MnO2 nanorods in neutral aqueous electrolytes as a cathode for asymmetric supercapacitors. J. Phys. Chem. C 2009, 113, 14020. [Google Scholar] [CrossRef]
  22. Sudhan, N.; Lavanya, N.; Leonardi, S.G.; Neri, G.; Sekar, C. Monitoring of chemical risk factors for Sudden Infant Death Syndrome (SIDS) by hydroxyapatite-graphene-MWCNT composite-based sensors. Sensors 2019, 19, 3437. [Google Scholar] [CrossRef] [PubMed] [Green Version]
  23. Jin, P.; Zhang, Z.; Zhen, M.; Wang, F. MnO2 nanotubes with graphene assistance as low cost counter electrode materials in dye sensitized solar cells. RSC Adv. 2016, 13, 10938. [Google Scholar] [CrossRef]
  24. Lavanya, N.; Fazio, E.; Neri, F.; Bonavita, A.; Leonardi, S.G.; Neri, G.; Sekar, C. Simultaneous electrochemical determination of epinephrine and uric acid in the presence of ascorbic acid using SnO2/graphene nanocomposite modified glassy carbon electrode. Sens. Actuators B Chem. 2015, 221, 1412–1422. [Google Scholar] [CrossRef]
  25. Yan, J.; Fan, Z.; Wei, T.; Qian, W.; Zhang, M.; Wei, F. Fast and reversible surface redox reaction of graphene–MnO2 composites as supercapacitor electrodes. Carbon 2010, 48, 3825–3833. [Google Scholar] [CrossRef]
  26. Xiang, Q.J.; Yu, J.; Jaroniec, M. Preparation and enhanced visible-light photocatalytic H2-production activity of graphene/C3N4 composites. J. Phys. Chem. C 2011, 115, 7355–7363. [Google Scholar] [CrossRef]
  27. Feng, X.; Yan, Z.; Chen, N.; Zhang, Y.; Ma, Y.; Liu, X.; Fan, Q.; Wang, L.; Huang, W. The synthesis of shape-controlled MnO2/graphene composites via a facile one-step hydrothermal method and their application in supercapacitors. J. Mater. Chem. A 2013, 1, 1281. [Google Scholar] [CrossRef]
  28. Lavanya, N.; Sekar, C. SnO2-SnS2 nanocomposite as electrocatalyst for simultaneous determination of depression biomarkers serotonin and tryptophan. J. Electroana. Chem. 2019, 840, 1–9. [Google Scholar]
  29. Jin, G.; Lin, X.; Gong, J. Novel choline and acetylcholine modified glassy carbon electrodes for simultaneous determination of dopamine, serotonin and ascorbic acid. J. Electroanal. Chem. 2004, 569, 135–142. [Google Scholar] [CrossRef]
  30. Kim, S.-K.; Kim, D.; Jeon, S. Electrochemical determination of serotonin on glassy carbon electrode modified with various graphene nanoparticles. Sens. Actuators 2012, 174, 285. [Google Scholar] [CrossRef]
Figure 1. Images of (A) GO; (B) MnO2 and (C) MnO2-GR nanocomposite.
Biosensors 10 00033 g001
Figure 2. SEM-EDAX mapping of the surface of MnO2-GR modified electrode; (A) SEM image of MnO2-GR nanocomposite and EDAX mapping of the distribution of main elements (B) O; (C) Mn; (D) C.
Biosensors 10 00033 g002
Figure 3. Raman spectra (a) GO, (b) MnO2 and (c) MnO2-GR nanocomposite.
Biosensors 10 00033 g003
Figure 4. High-resolution XPS spectra of MnO2-GR composite (A) Mn 2p; (B) O 1s and (C) C 1s.
Biosensors 10 00033 g004
Figure 5. (A) CVs of (a) bare GCE, (b) GO/GCE, (c) MnO2/GCE and (d) MnO2-GR modified GCE in 100 μM SE; (B) CVs of MnO2-GR/GCE in the presence of SE at scan rates of 50–500 mV/s (C) log Epa vs. log Ipa and (D) pH effect on the anodic peak current and peak potential of SE.
Biosensors 10 00033 g005
Scheme 1. Plausible mechanism of SE detection at MnO2-GR/GCE.
Biosensors 10 00033 sch001
Figure 6. SWVs obtained for various concentrations of SE at MnO2-GR/GCE in 0.1 M PBS; inset shows corresponding calibration curve of SE (0.1–150 and 150–800 μM).
Biosensors 10 00033 g006
Figure 7. Amperometric response of the MnO2-GR modified GCE for the addition of 50 µM SE and successive addition of interferents 500 μM each in the sequence of (a) dopamine, (b) epinephrine, (c) folic acid, (d) uric acid, (e) ascorbic acid, (f) glucose (g) Na2+, (h) K+, and (i) Mg2+ in 0.1 M PBS.
Biosensors 10 00033 g007
Figure 8. SWVs obtained for blood serum (green line) and after successive addition of SE concentrations to blood serum at the MnO2-GR/GCE in 0.1 M PBS.
Biosensors 10 00033 g008
Table 1. Comparison of previous electrodes for the determination of SE with MnO2-GR/GCE.
ElectrodeMethodLinear Range (μM)LOD (μM)Ref.
a WO3/GCEDPV0.01–6000.001[15]
b Fe2O3-CHI/GCEDPV0.1–1000.08[16]
c GR-PANI/GCEDPV0.2–100.011[17]
d Au-Ag/GCEDPV0.002–4.80.0016[18]
e SnO2-SnS2/GCESWV0.1–7000.045[28]
g Acetylcholine/GCEDPV0.8–2000.8[29]
f GR-NS/GCEDPV1-1000.038[30]
h MnO2-GR/GCESWV0.1–8000.01This work
a γ-WO3 nanoparticles modified glassy carbon electrode; b Fe2O3-Chitosan modified glassy carbon electrode; c Graphene polyaniline modified glassy carbon electrode; d Ag-Au modified glassy carbon electrode; e SnO2-SnS2 modified glassy carbon electrode; f Graphene nanosheet modified glassy carbon electrode; g Acetylcholine modified glassy carbon electrode, h MnO2-Graphene modified glassy carbon electrode.
Table 2. Determination of SE in human blood serum sample using MnO2-GR/GCE.
SampleSE Concentration (μM)Recovery (n = 3) (%)
AddedFound
110.9101.3
255.297.9
31010.398.3
41514.6102.6
52020.3101.8

