The Impact of Nylon-3 Copolymer Composition on the Efficiency of siRNA Delivery to Glioblastoma Cells


 , ,
, , 

Abstract
: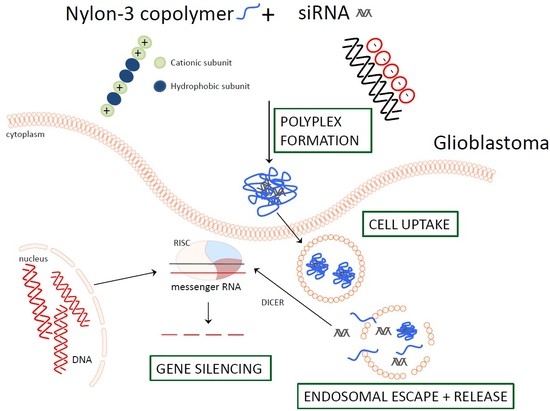
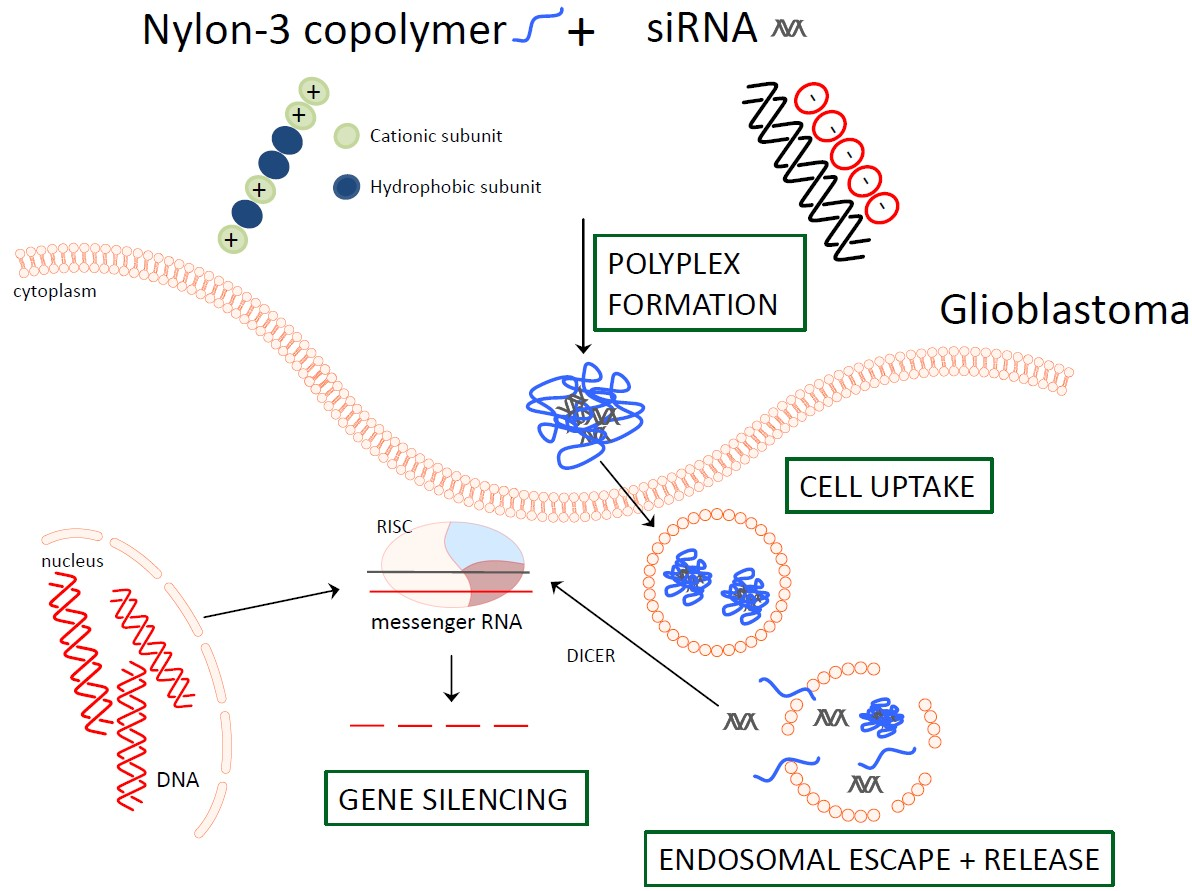
1. Introduction
2. Materials and Methods
2.1. Materials
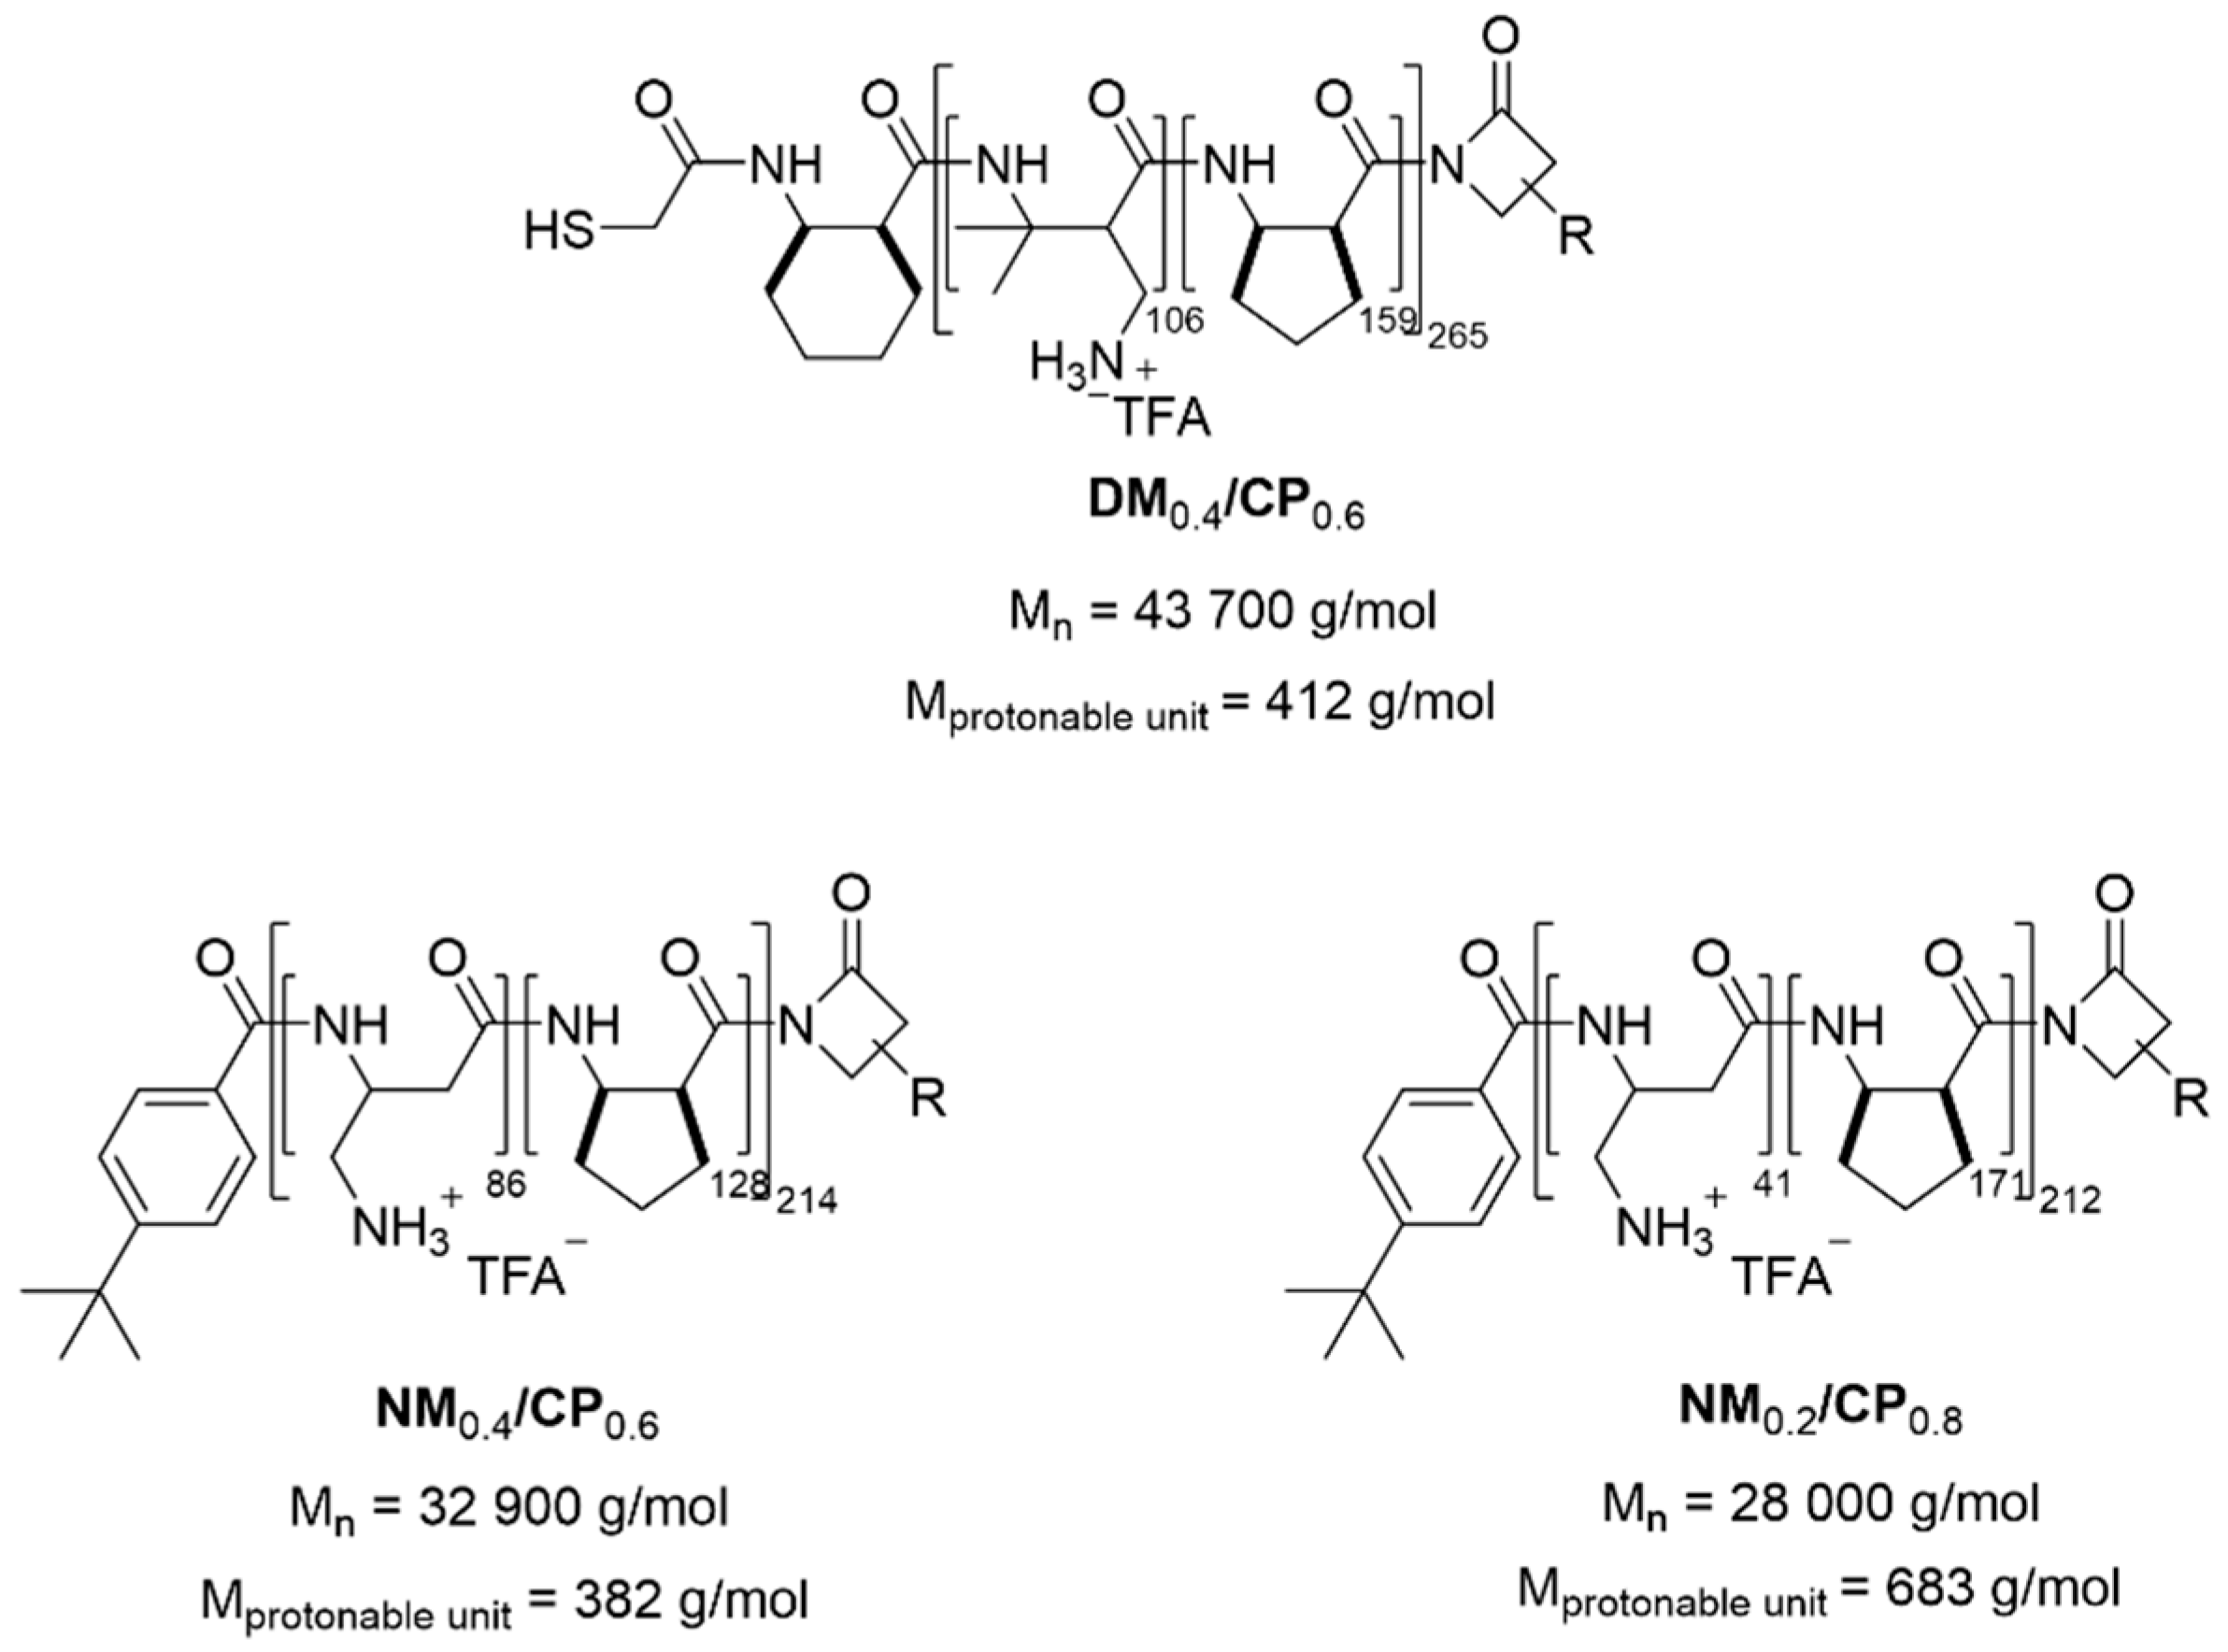
2.2. Synthesis and Characterization of Nylon-3 Random Copolymers
2.3. Preparation of Polyplexes
2.4. siRNA Encapsulation Assay by SYBR Gold Assay
2.5. Size and Zeta (ζ)-Potential Analysis by Dynamic Light Scattering and Laser Doppler Anemometry
2.6. Size Measurements by Tunable Resistive Pulse Sensing
2.7. Polyplex Morphology by Scanning Transmission Electron Microscopy Coupled with Energy-Dispersive X-ray Spectroscopy
2.8. Cells and Cell Culture
2.9. Quantification of Cellular Uptake by Flow Cytometry
2.10. Route of cellular Uptake
2.11. siRNA Release by Heparin Competition Assay
2.12. In Vitro eGFP Knockdown by Flow Cytometry
2.13. Cytotoxicity
2.13.1. MTT Assay
2.13.2. LDH Assay
2.14. Confocal Laser Scanning Microscopy
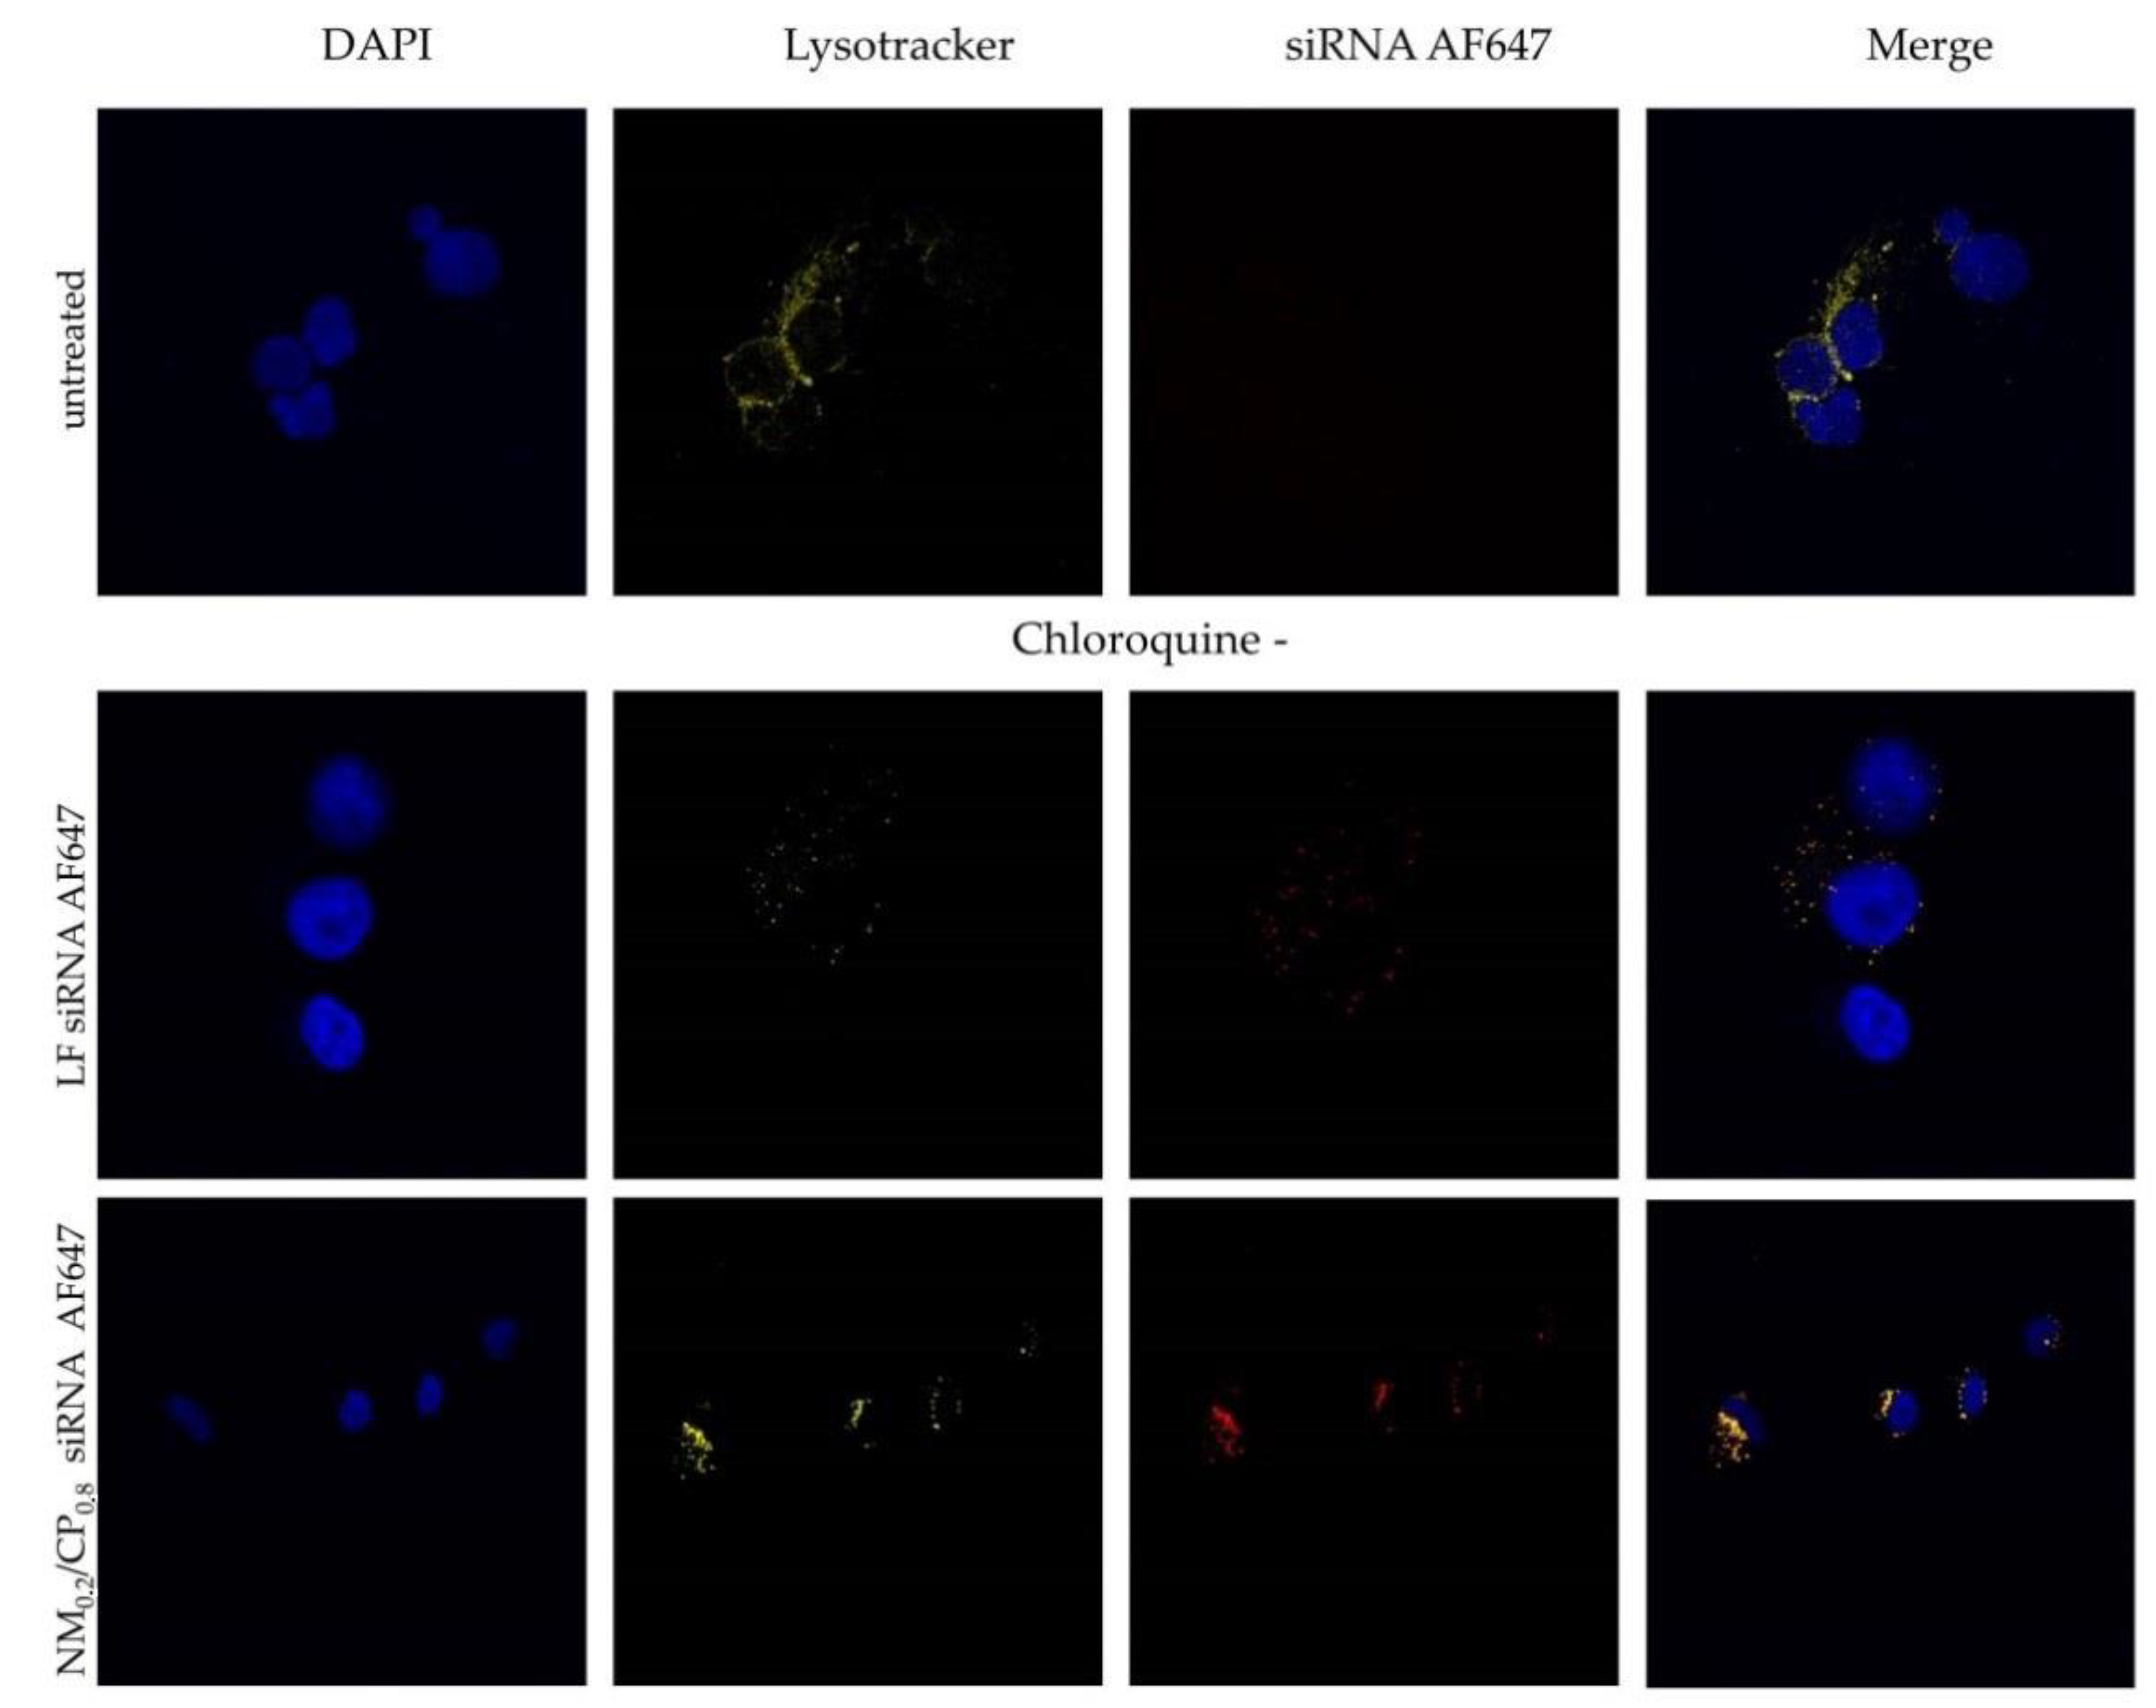
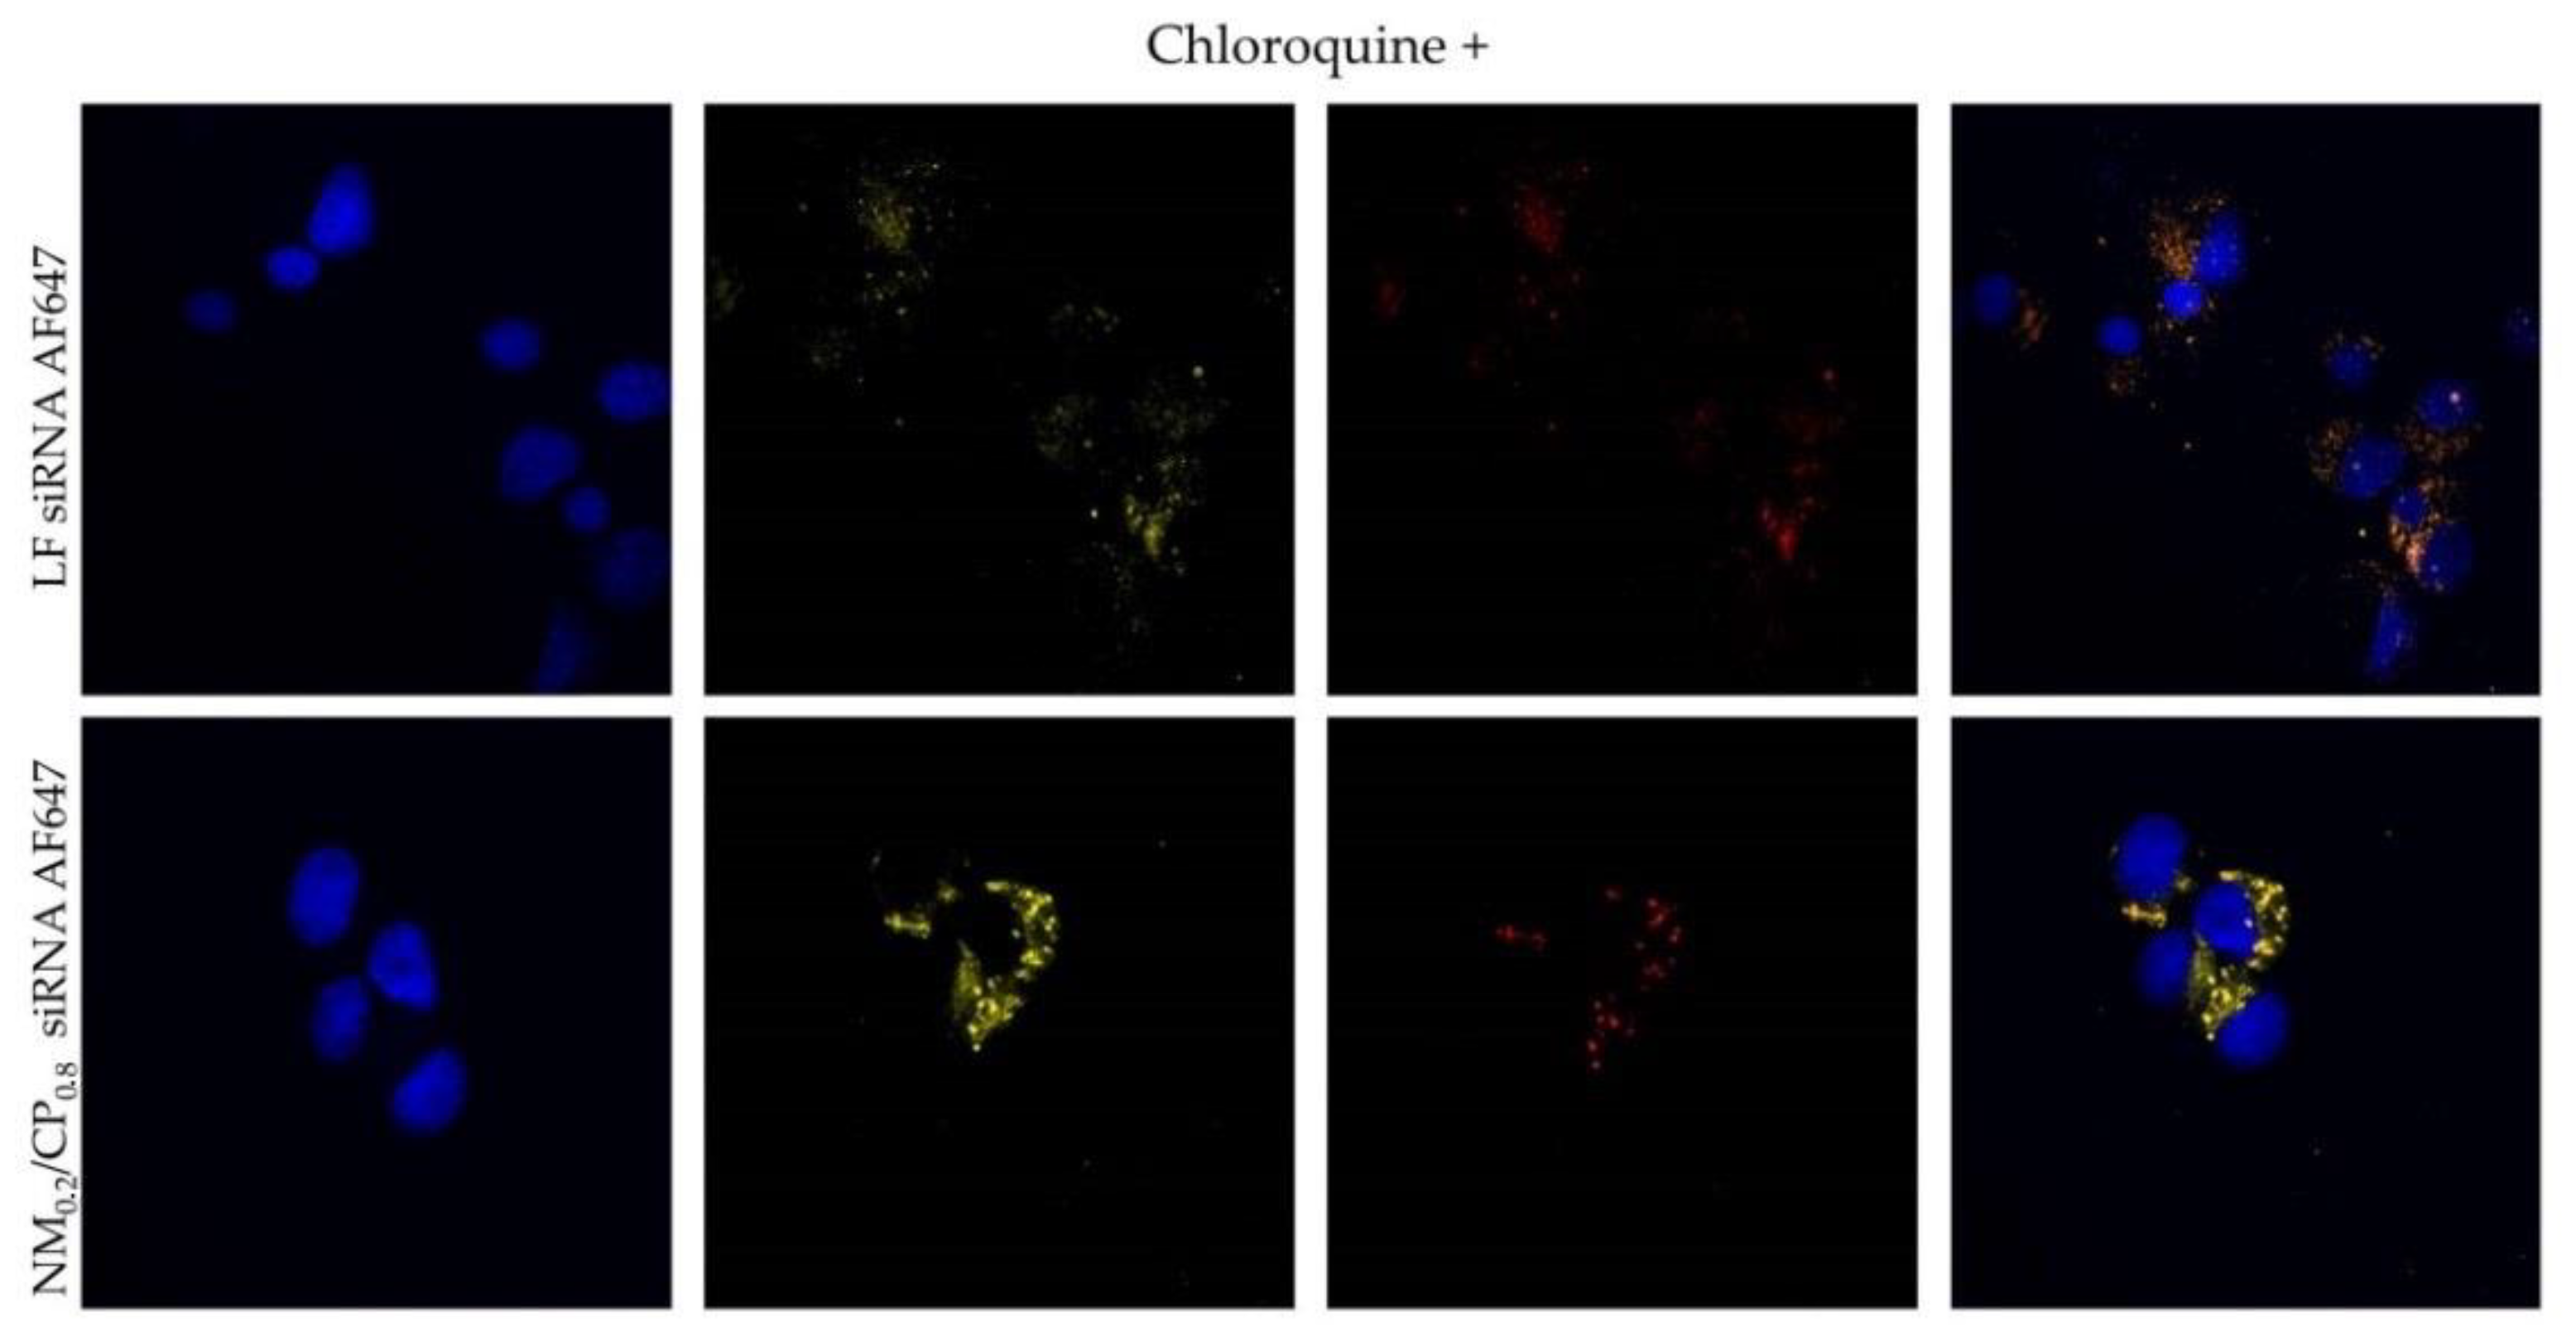
2.14.1. Endosomal Entrapment
2.14.2. In Vitro eGFP Knockdown
2.15. Statistics
3. Results and Discussion
3.1. Polymer Synthesis and Characterization
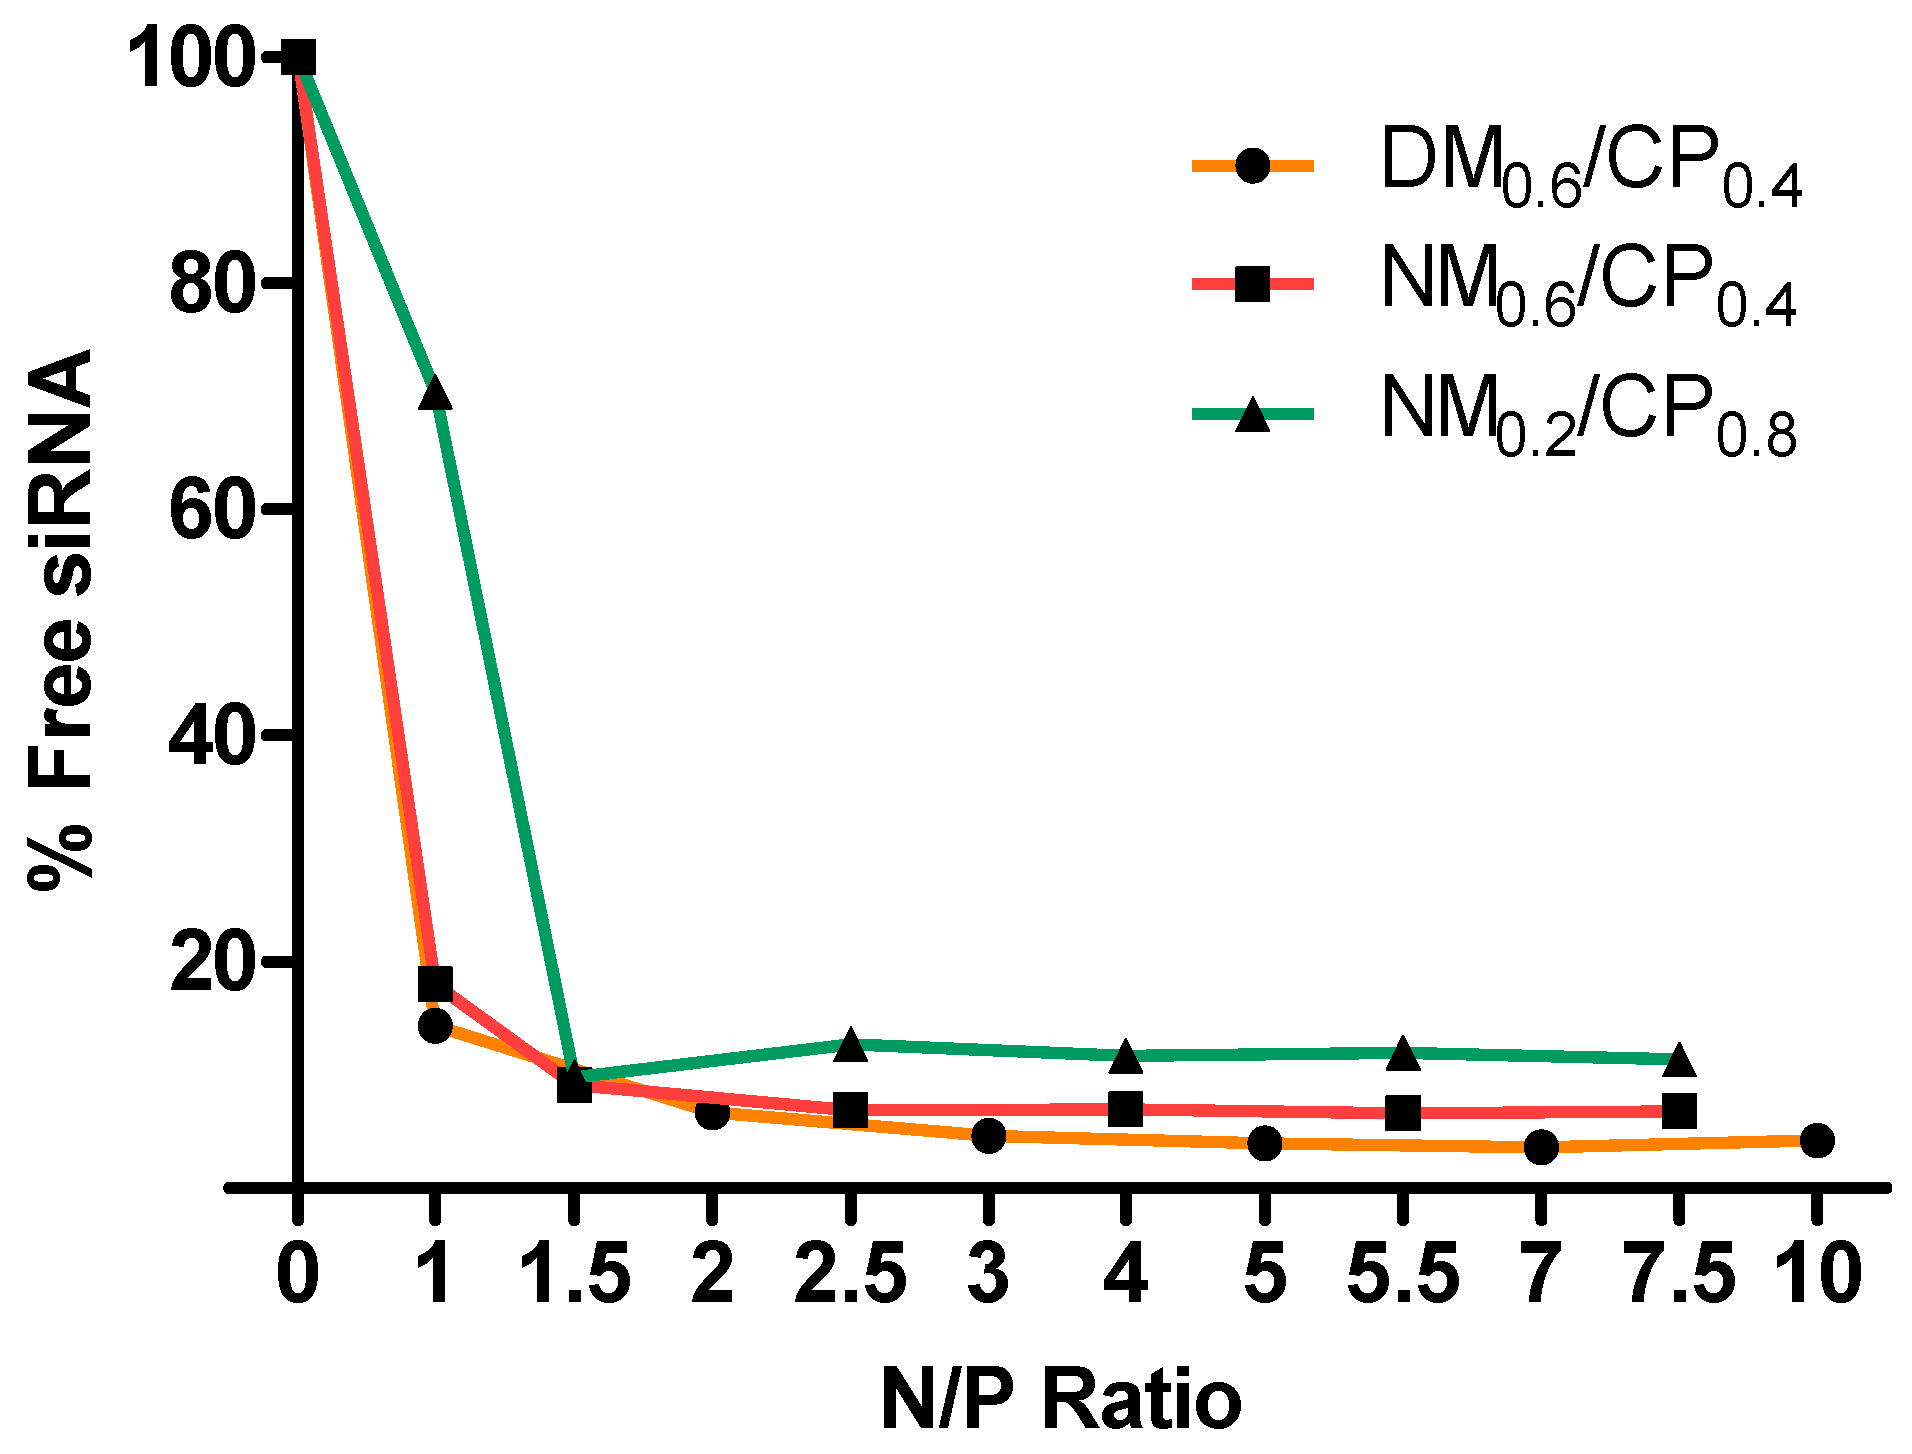
3.2. siRNA Encapsulation Assay
3.3. Particle Characterization
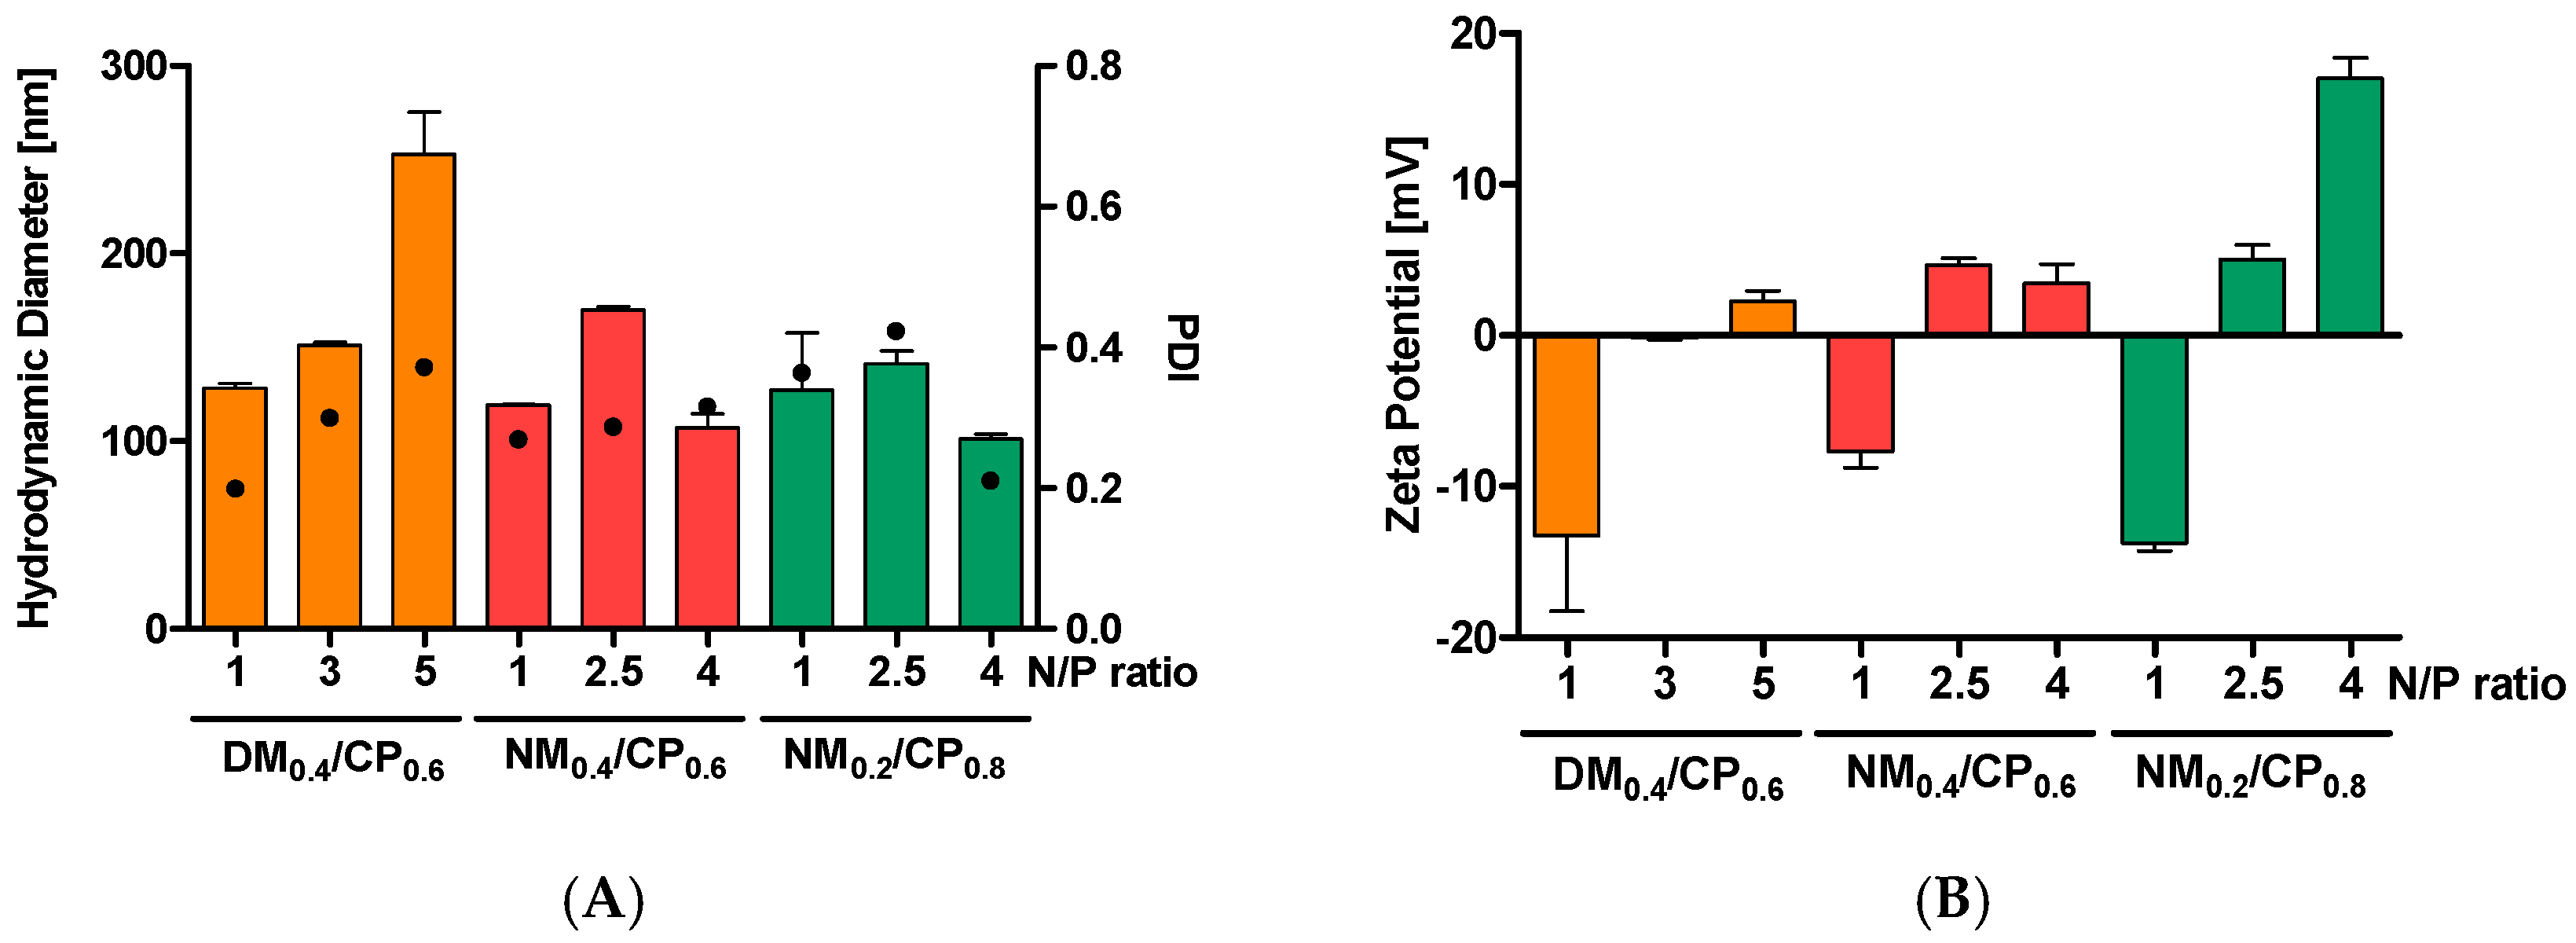
3.3.1. Size and Zeta (ζ)-Potential Analysis by Dynamic Light Scattering and Laser Doppler Anemometry
3.3.2. Size Measurements by Tunable Resistive Pulse Sensing
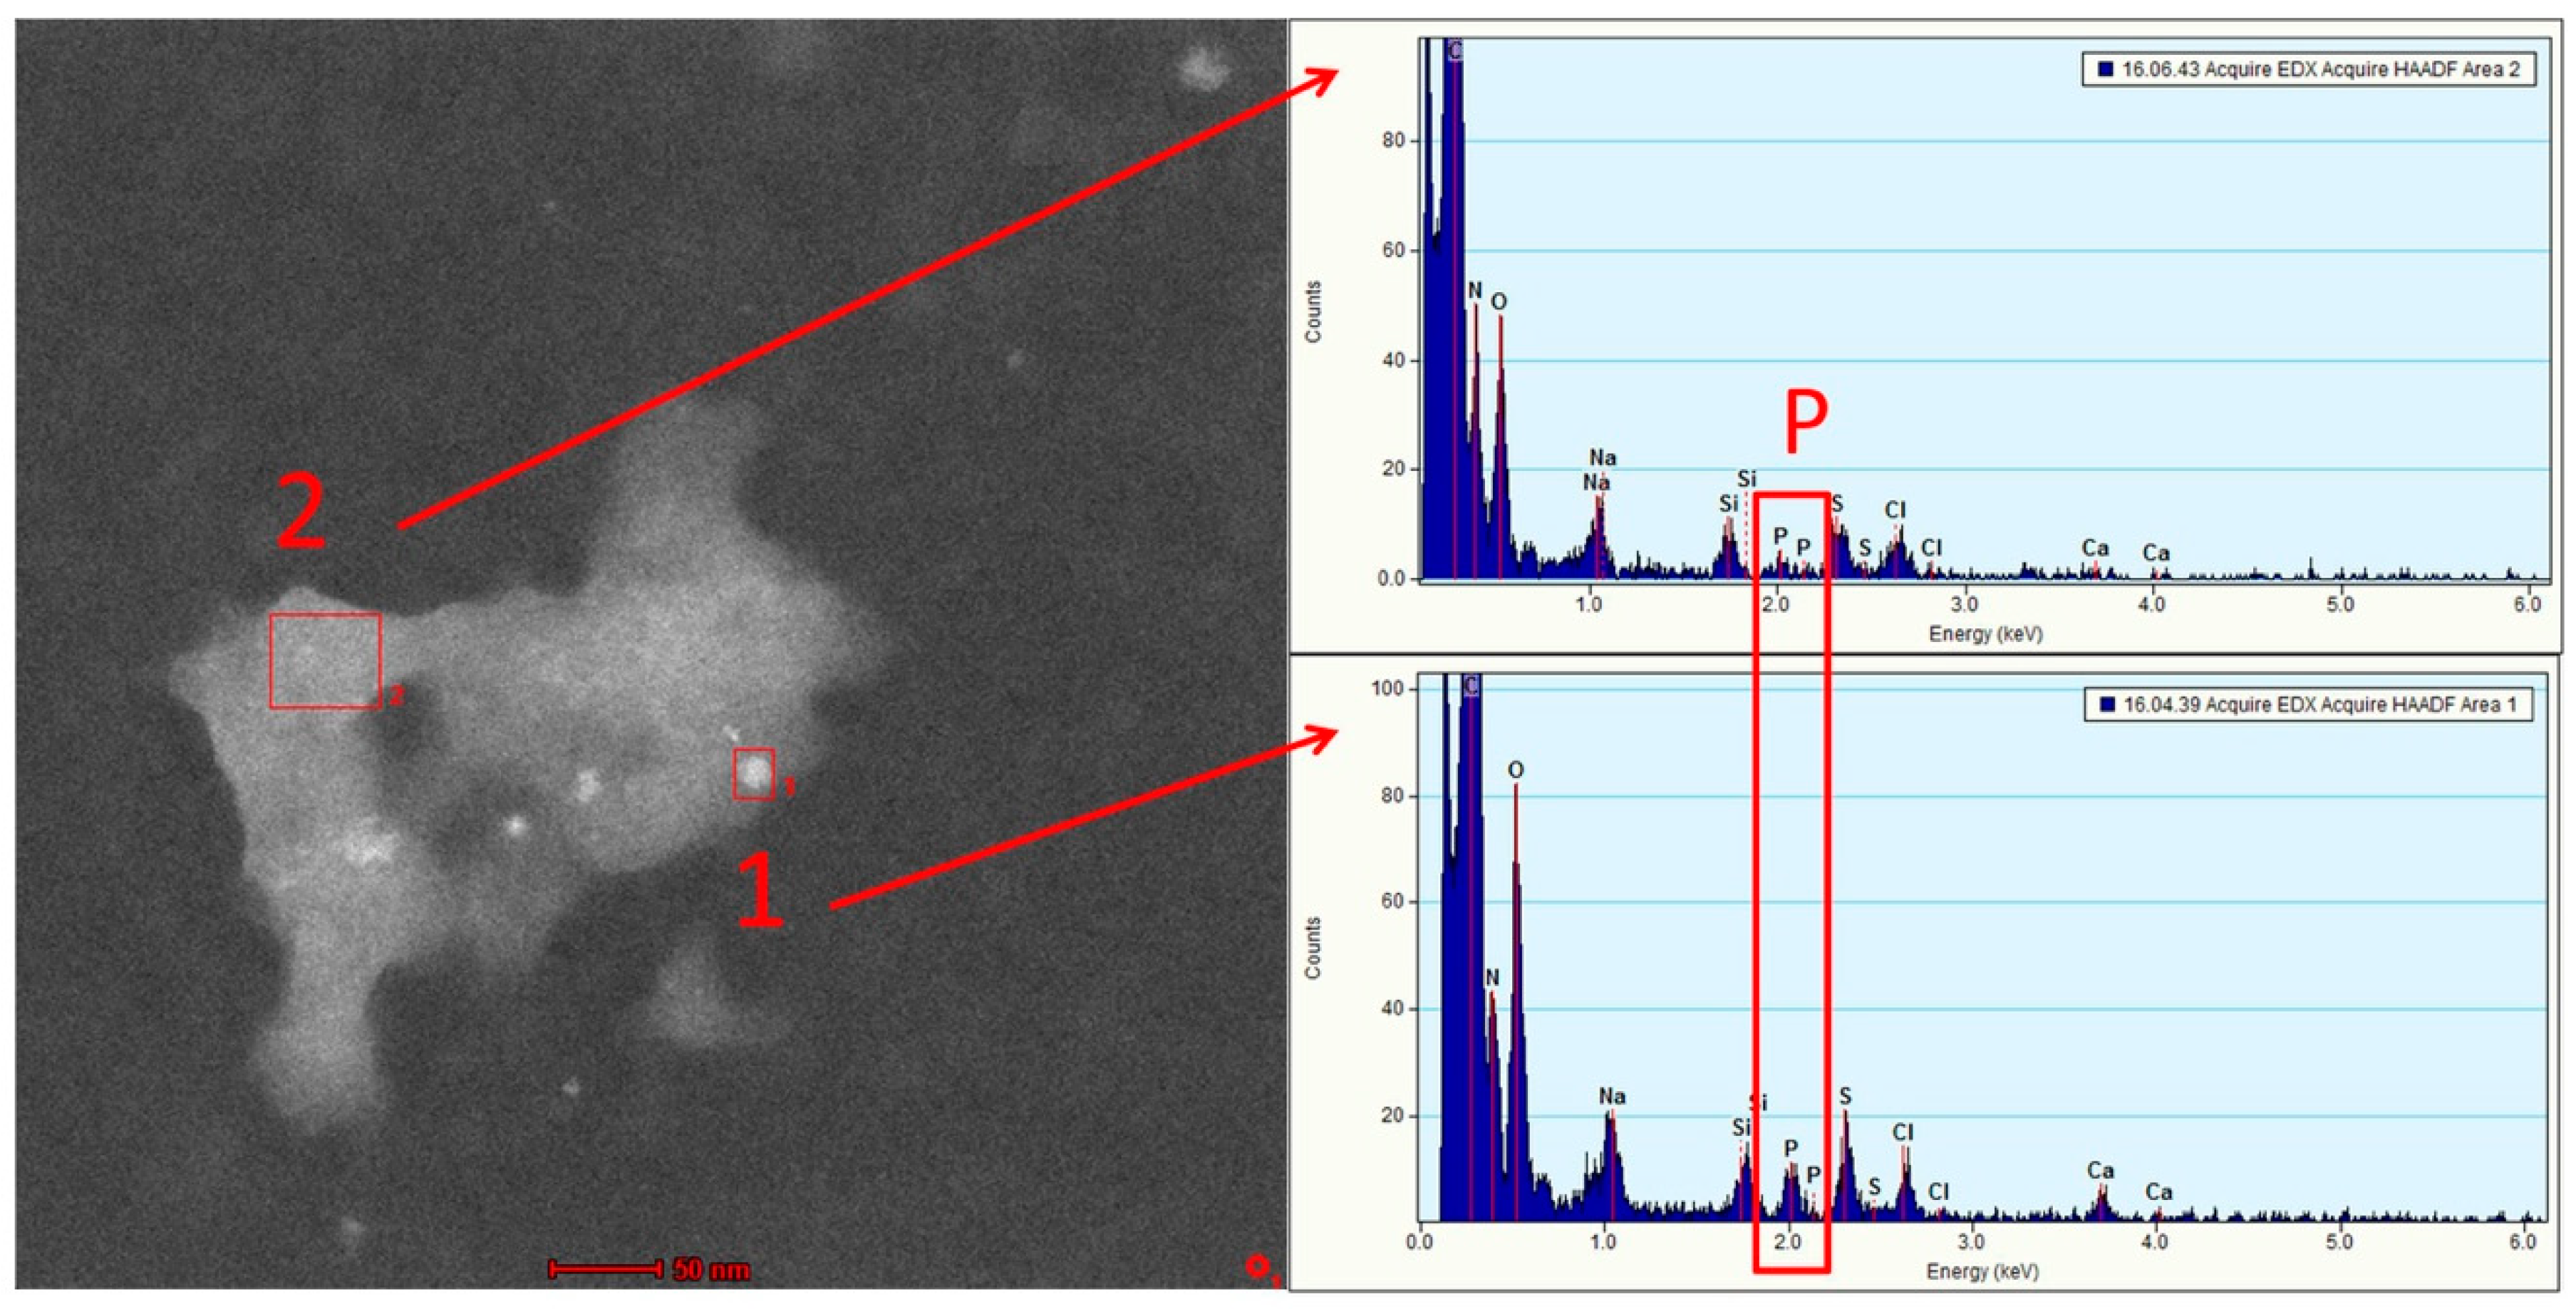
3.3.3. Polyplex Morphology
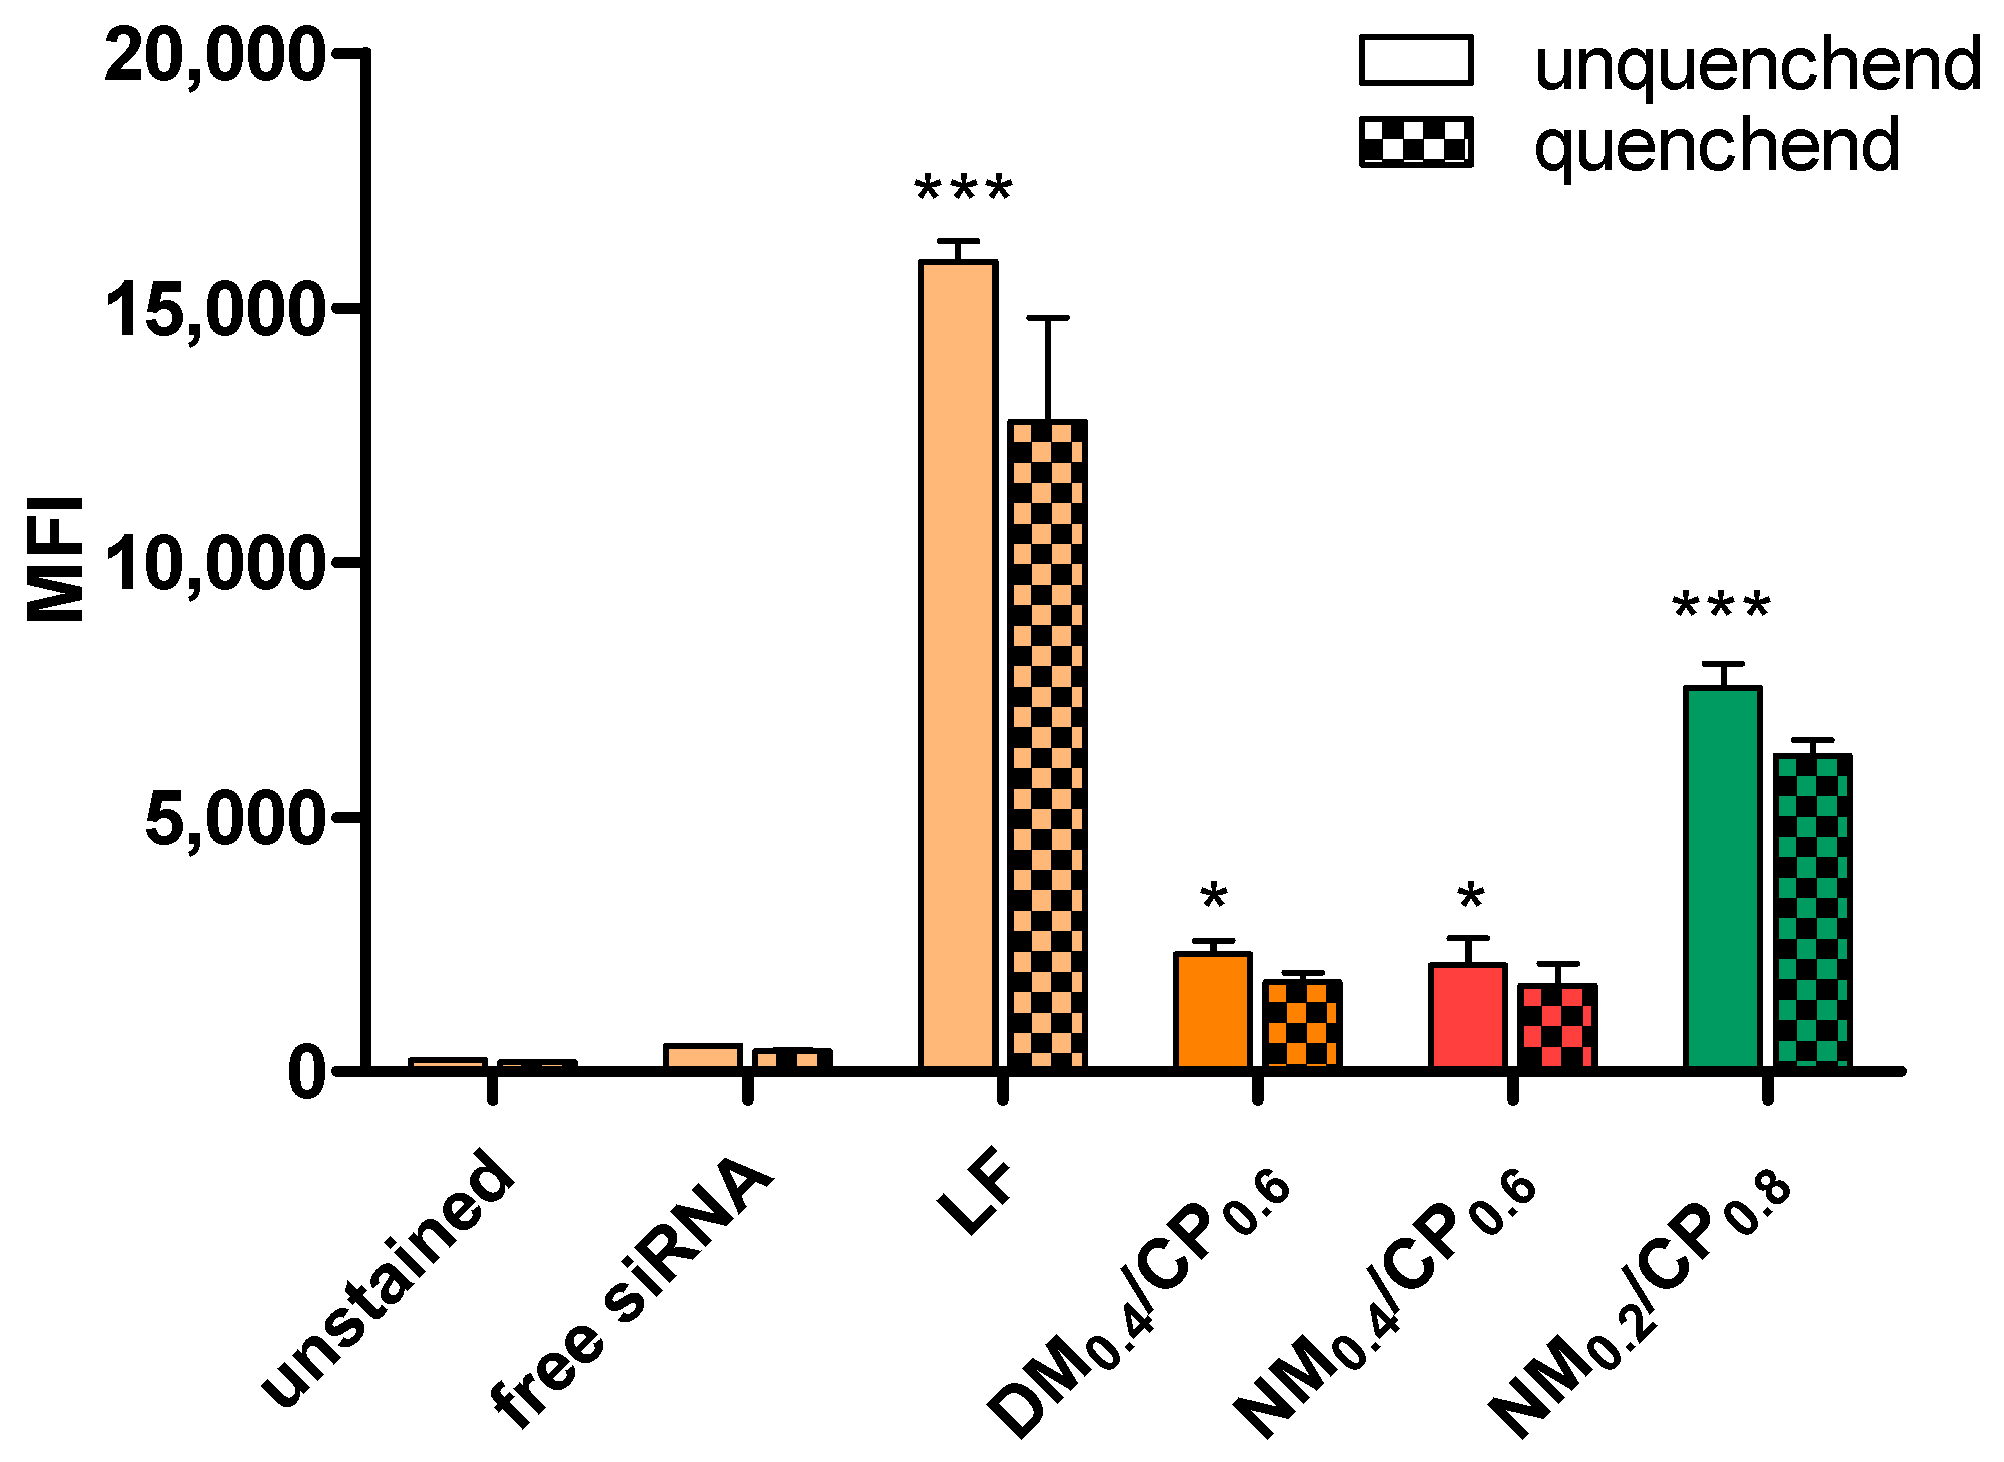
3.4. Quantification of Cellular Uptake by Flow Cytometry
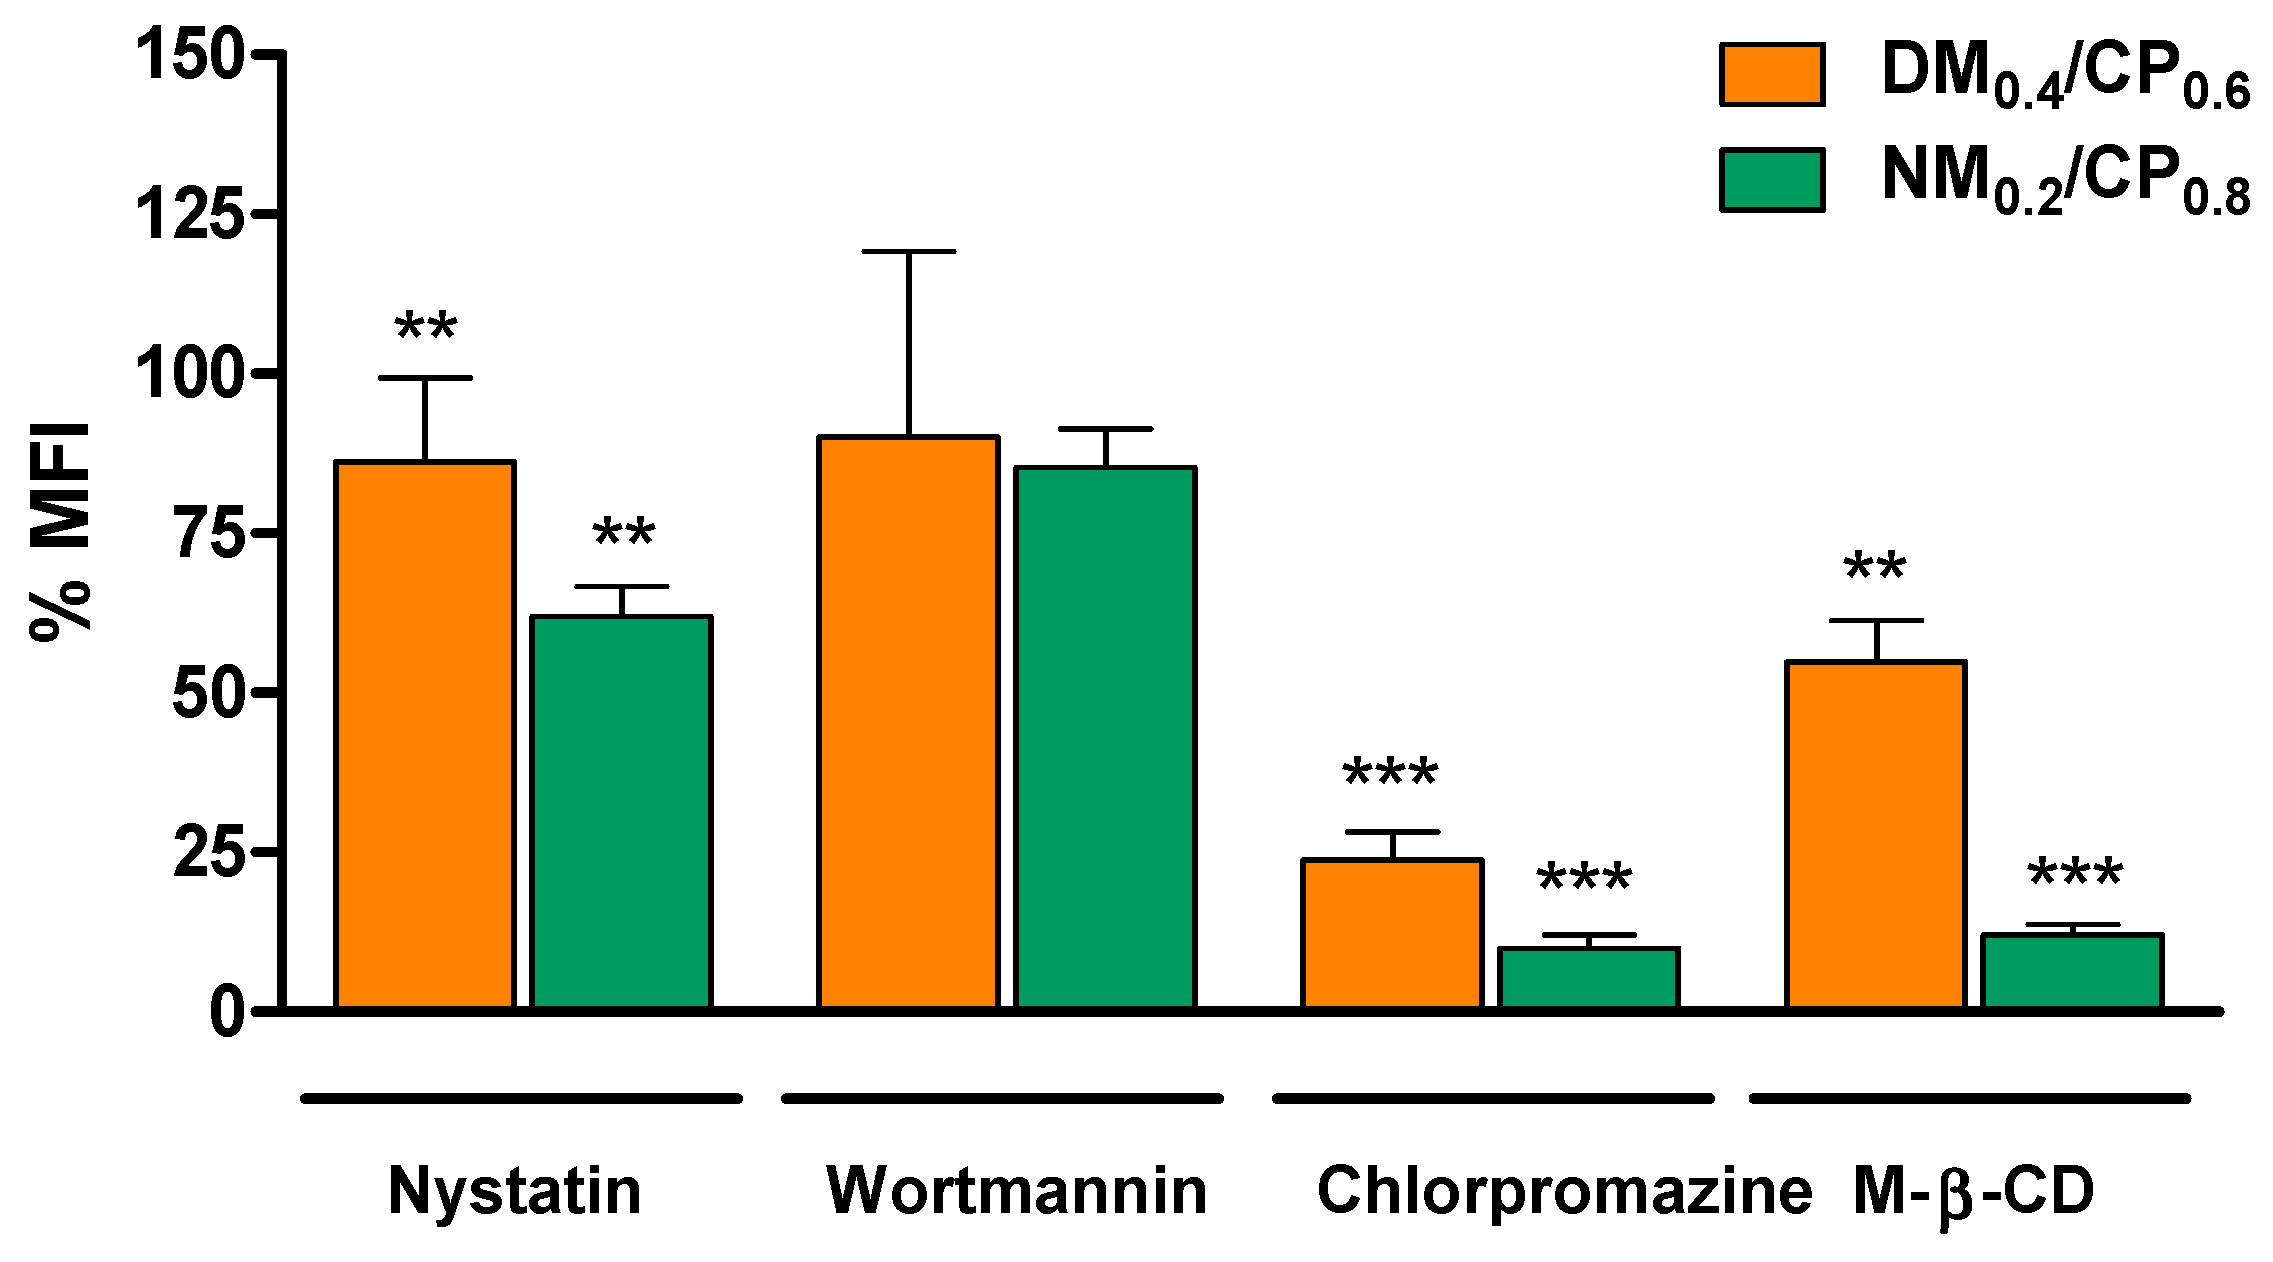
3.5. Route of Cellular Uptake
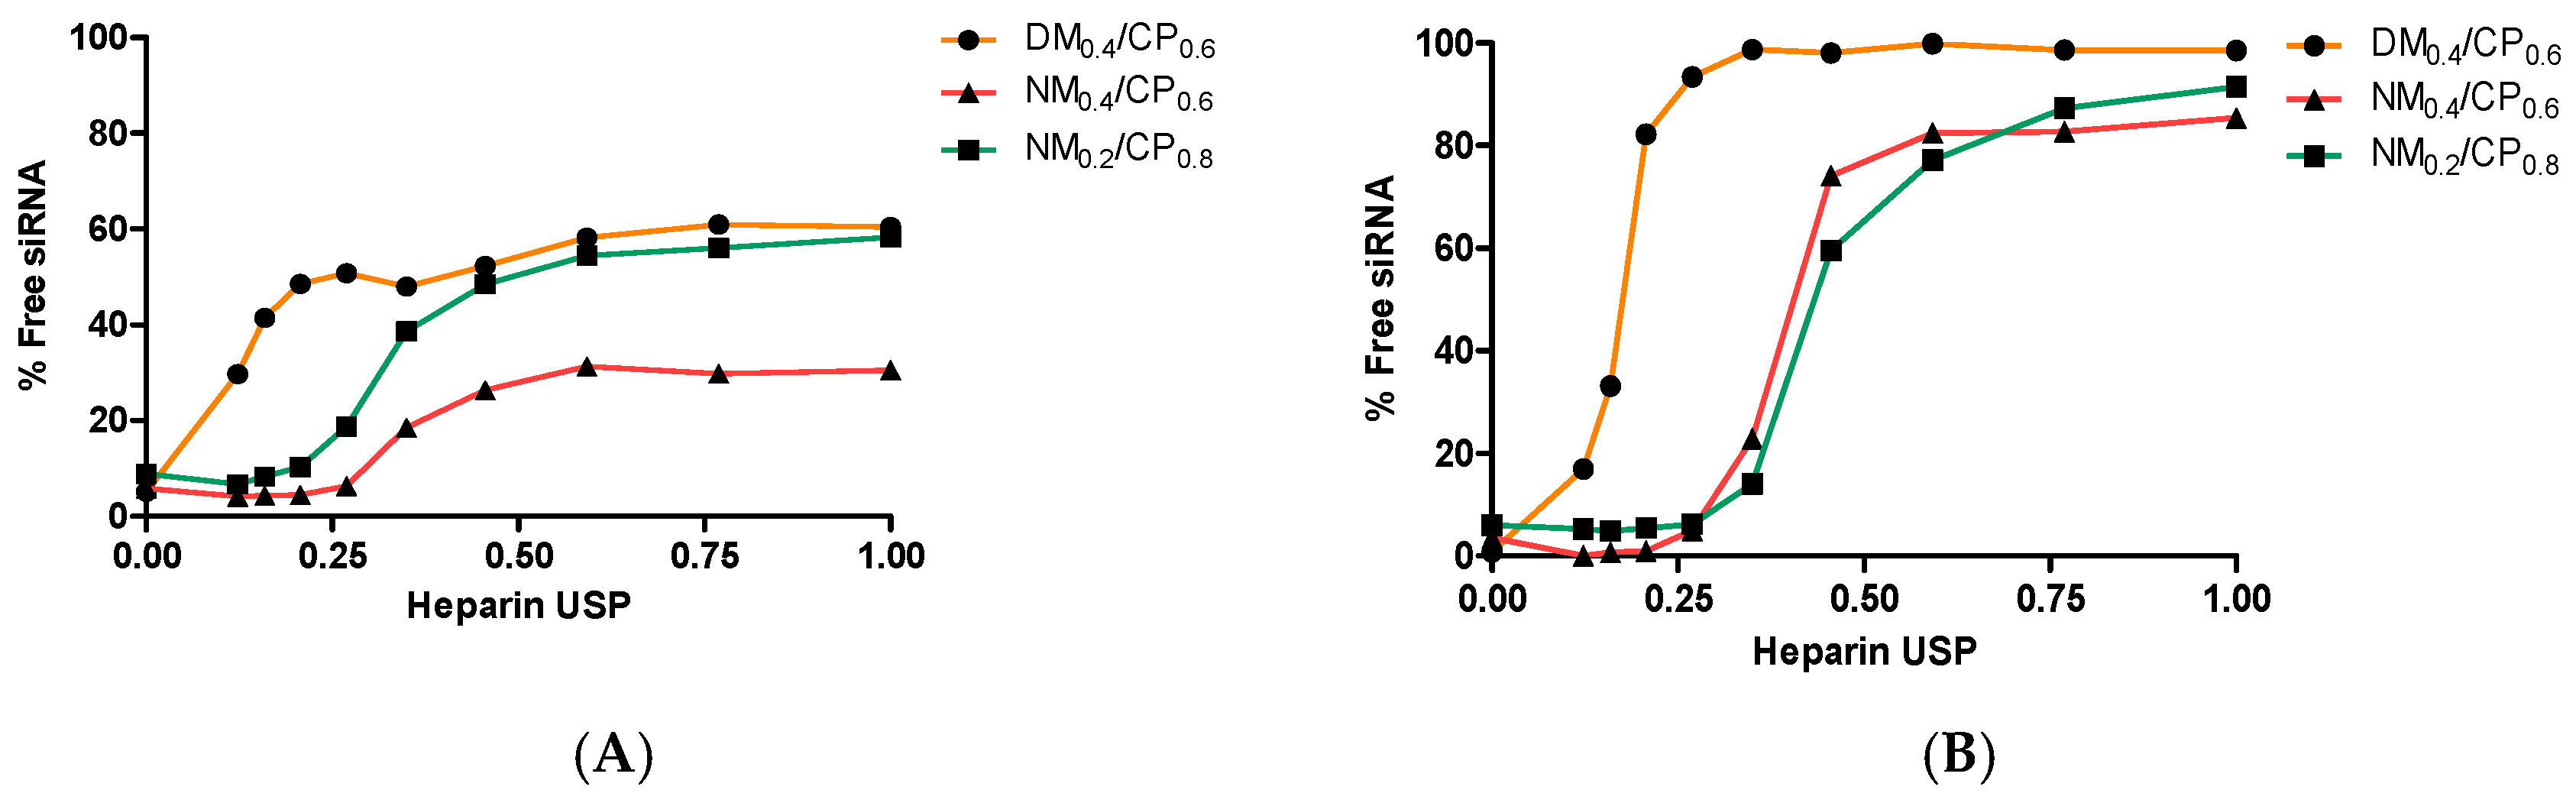
3.6. siRNA Release Assay
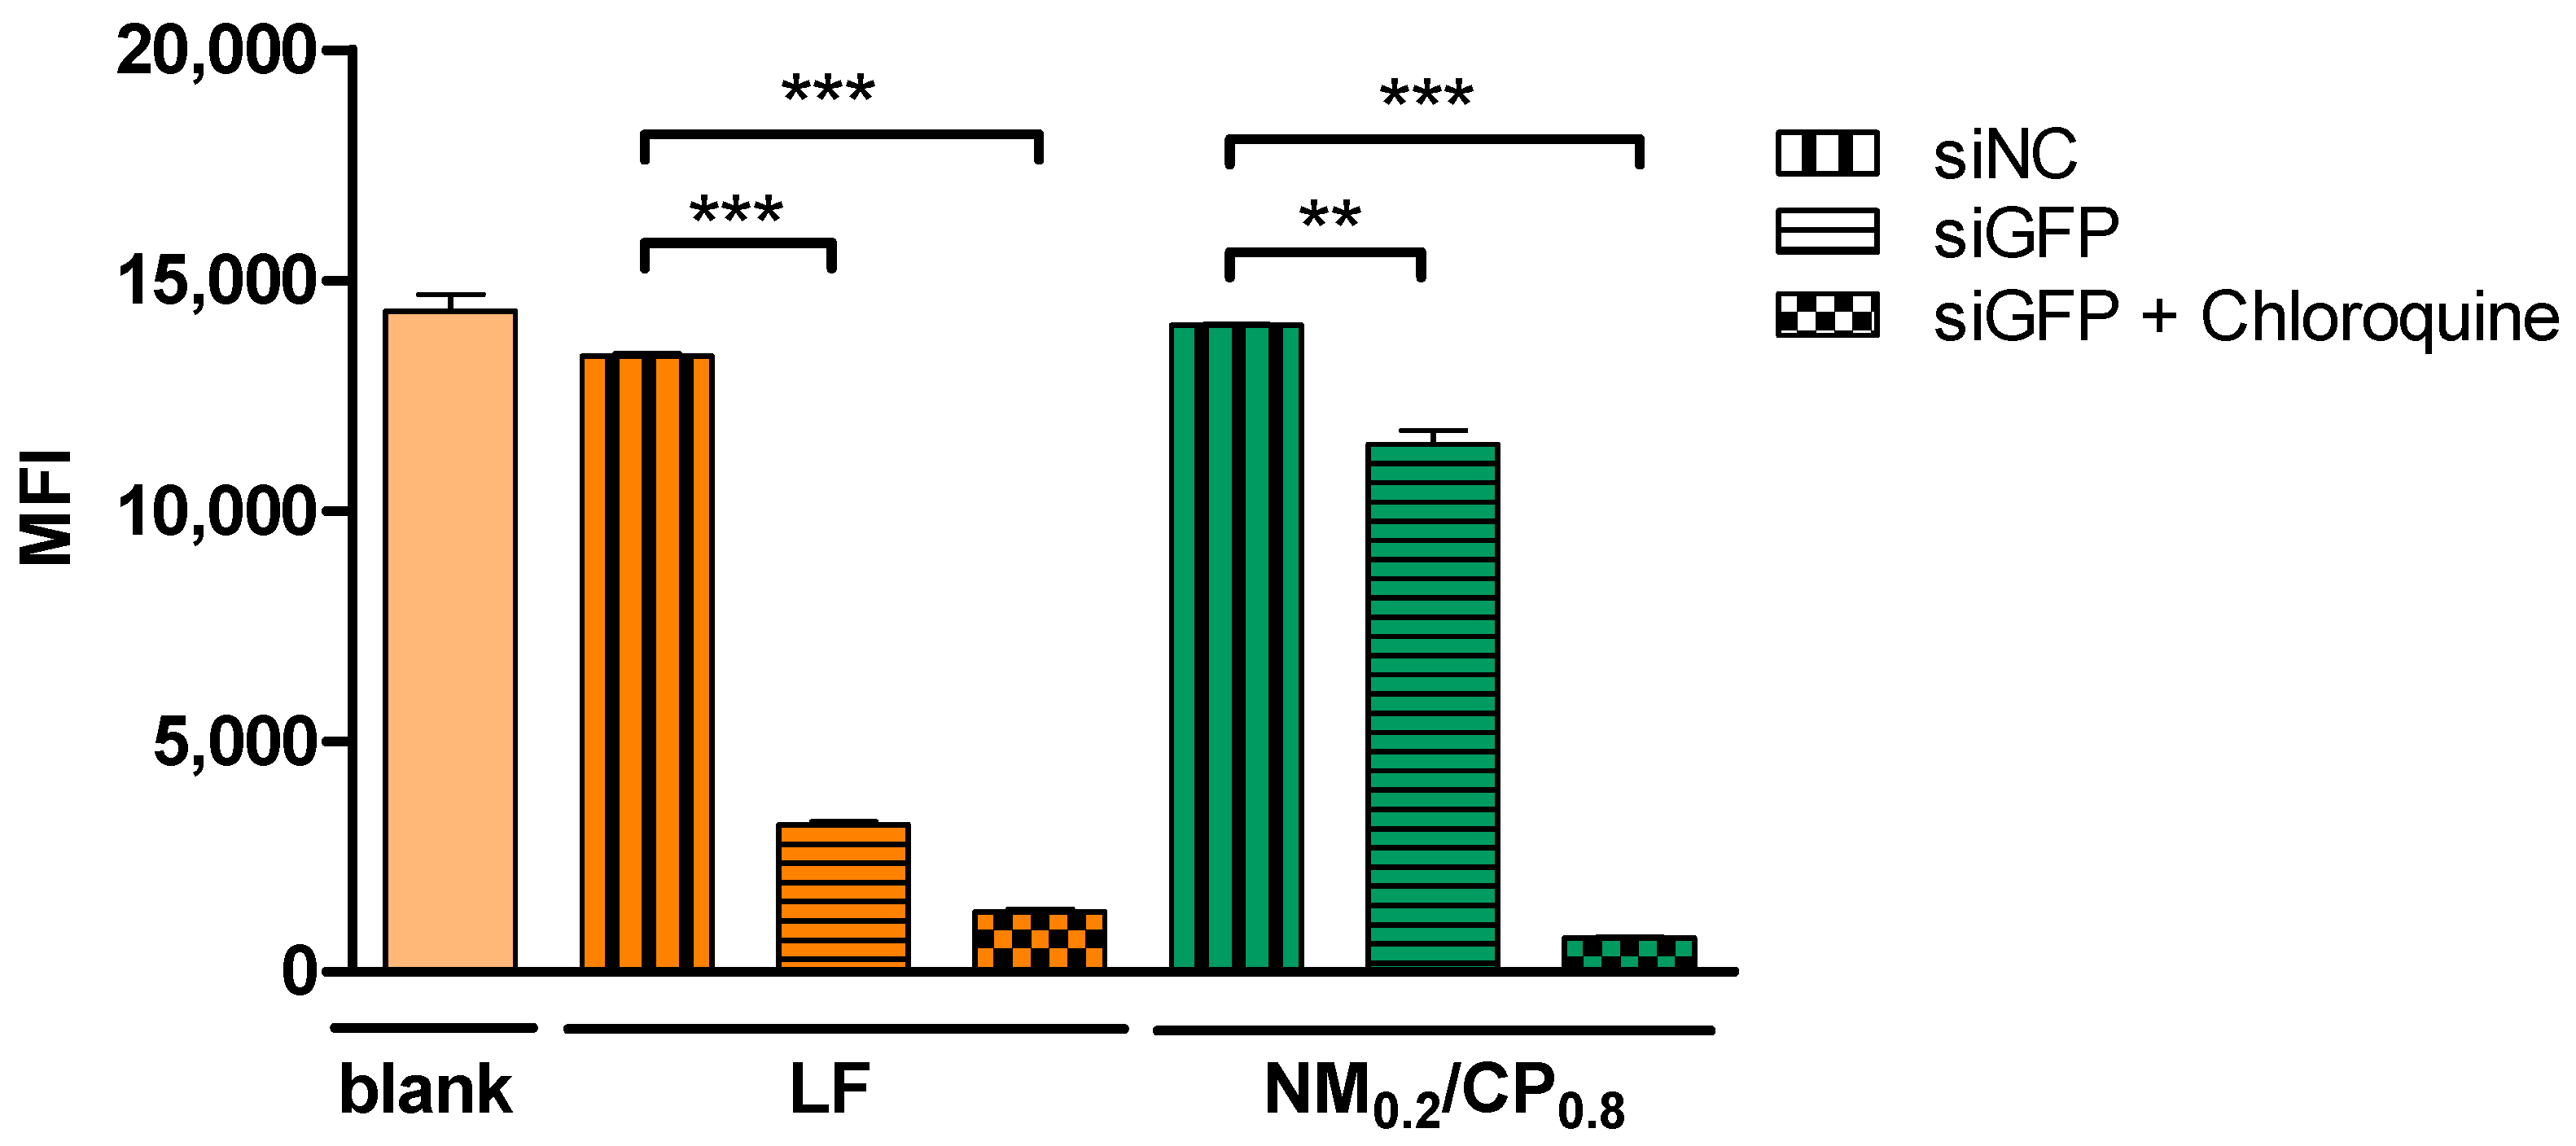
3.7. In Vitro eGFP Knockdown
3.8. Cytotoxicity
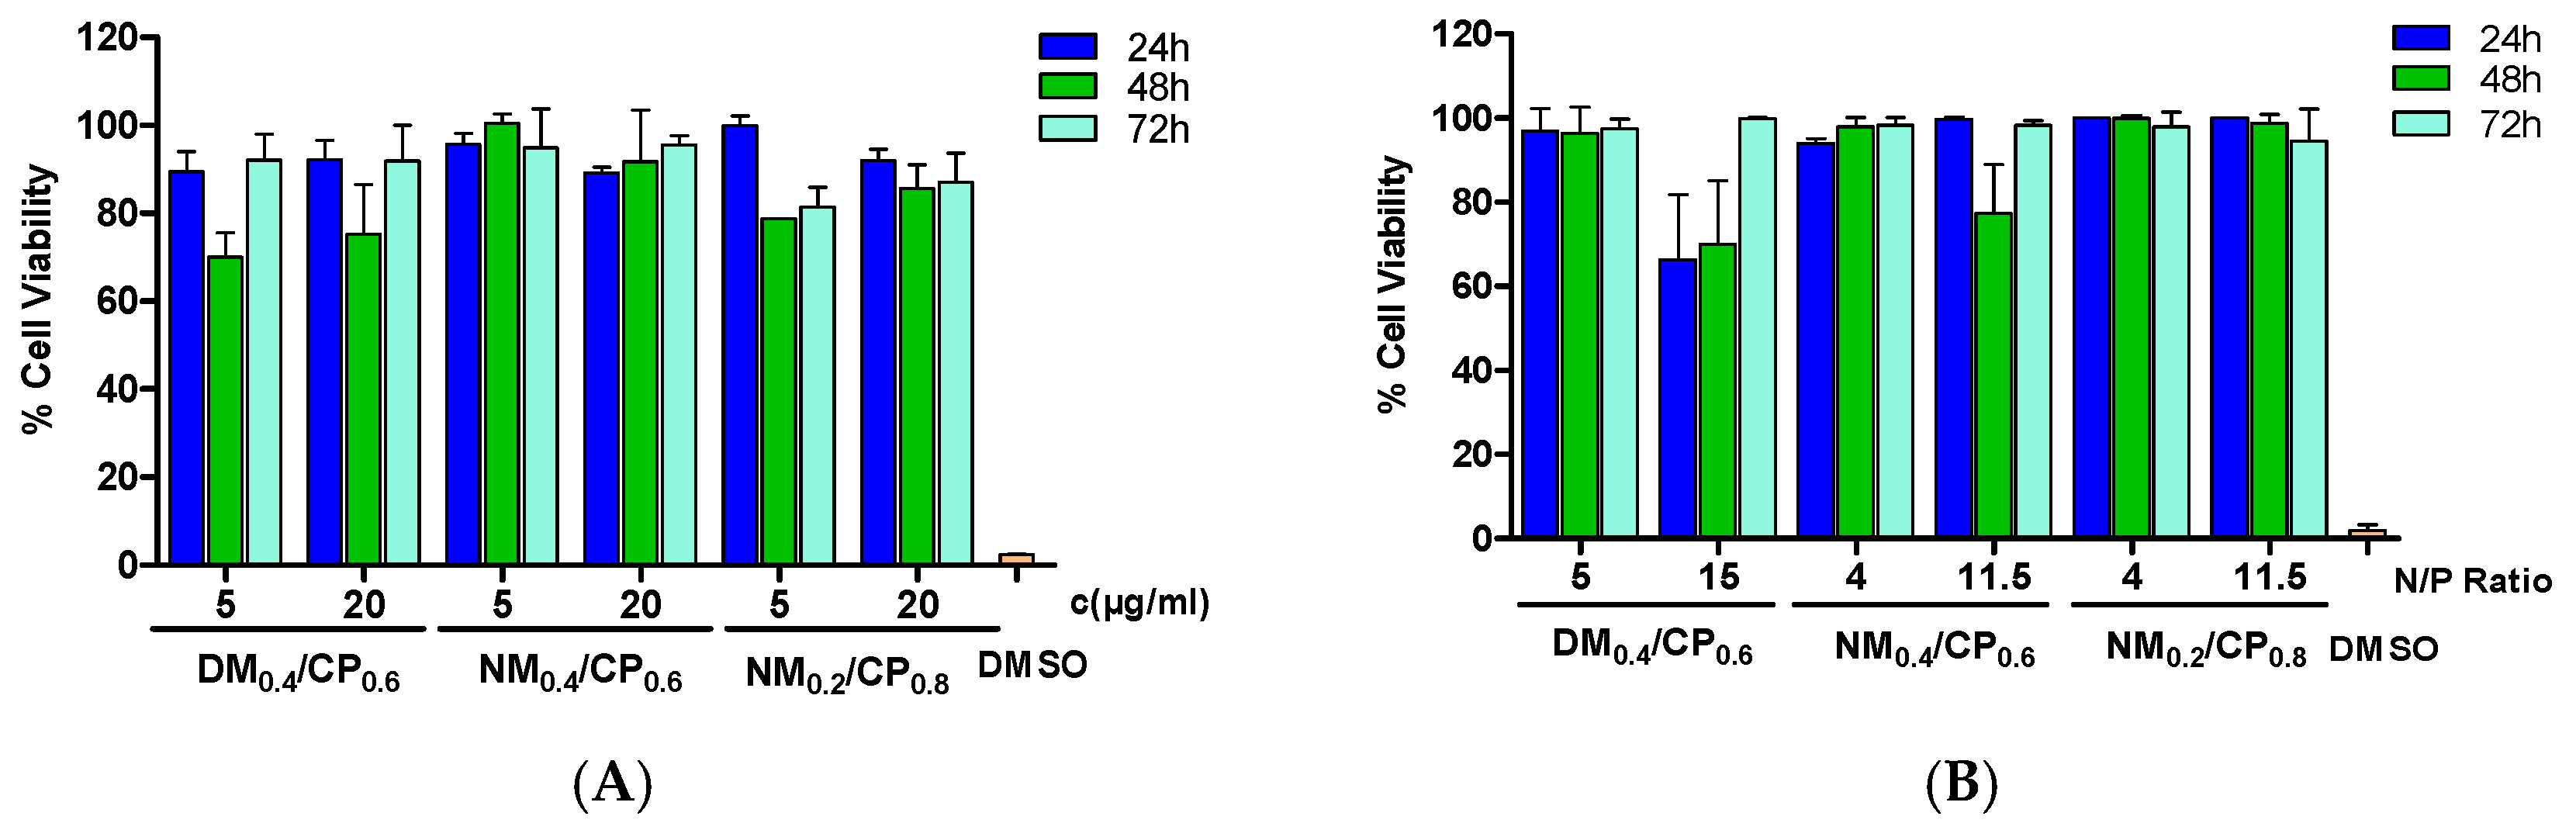
3.8.1. MTT Assay
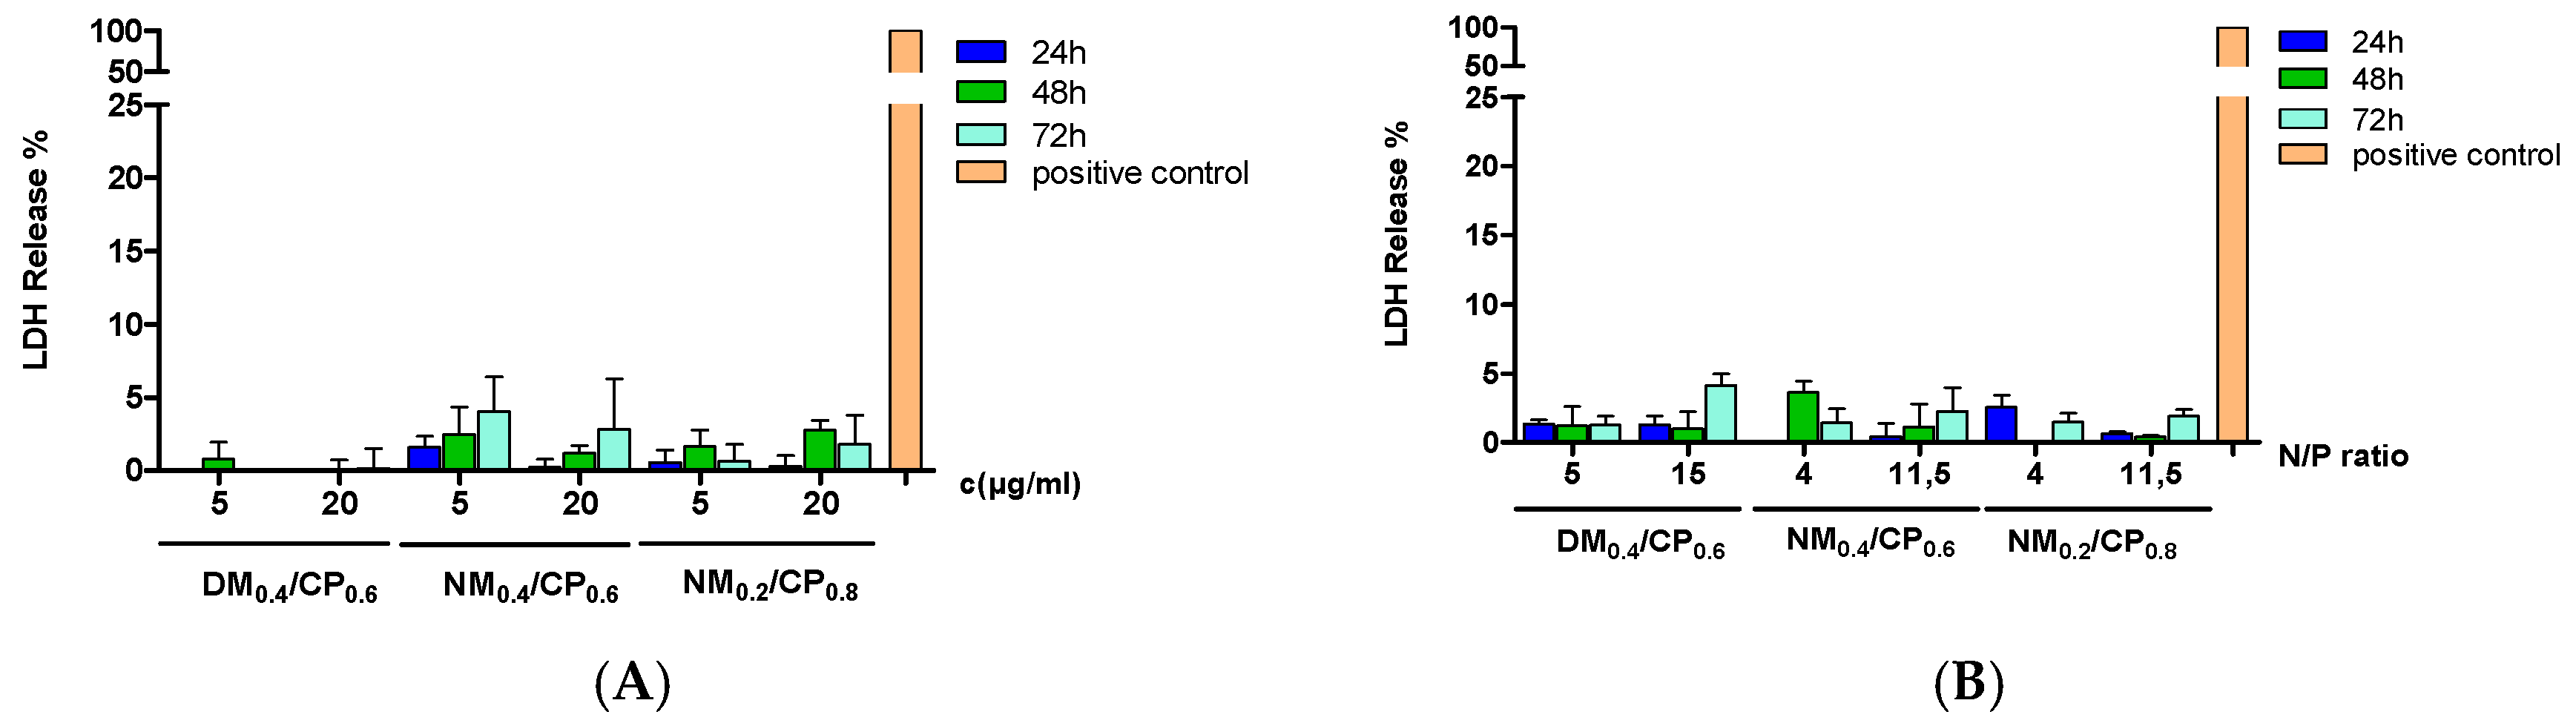
3.8.2. LDH Assay
3.9. Confocal Laser Scanning Microscopy
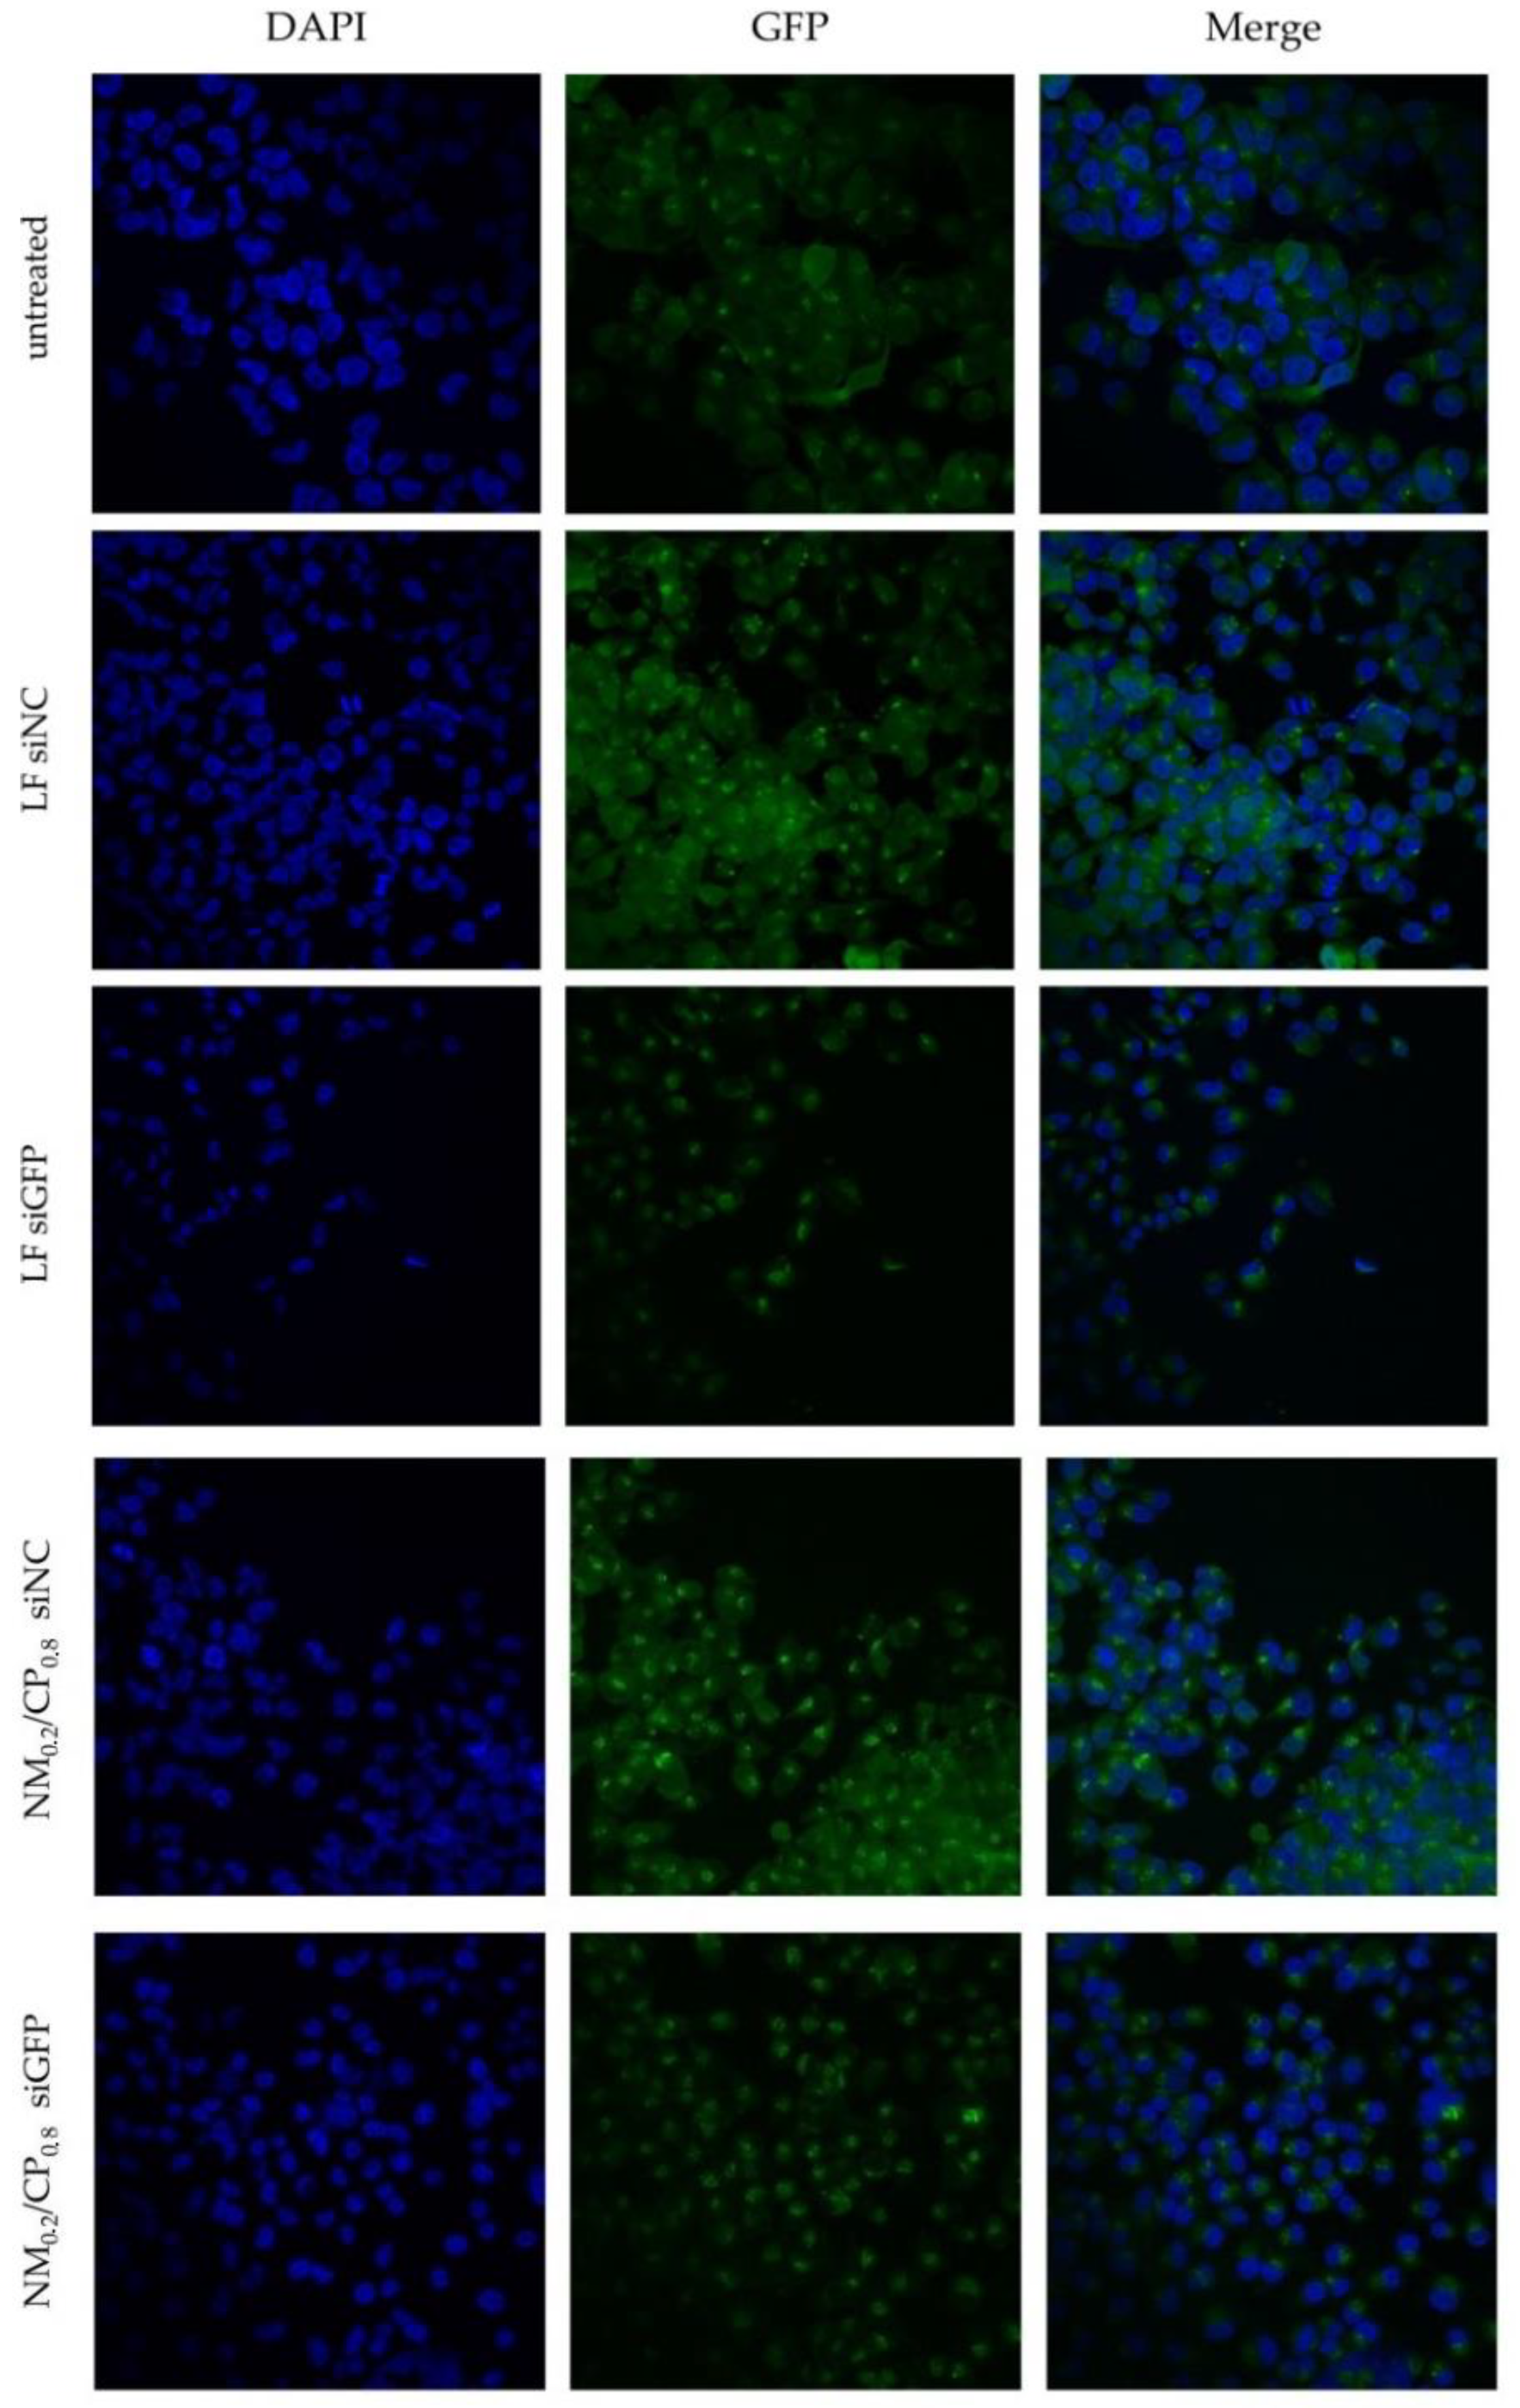
3.9.1. In Vitro eGFP Knockdown
3.9.2. Endosomal Entrapment
4. Conclusions
Supplementary Materials
Author Contributions
Funding
Acknowledgments
Conflicts of Interest
References
- Hottinger, A.F.; Stupp, R.; Homicsko, K. Standards of care and novel approaches in the management of glioblastoma multiforme. Chin. J. Cancer 2014, 33, 32–39. [Google Scholar] [CrossRef] [PubMed] [Green Version]
- Thakkar, J.P.; Dolecek, T.; Horbinski, T.A.; Ostrom, Q.T.; Lightner, D.D.; Barnholtz-Sloan, J.S.; Villano, J.L. Epidemiologic and molecular prognostic review of glioblastoma. Cancer Epidemiol. Biomark. Prev. 2014, 23, 1985–1996. [Google Scholar] [CrossRef]
- Jinek, M.; Doudna, J.A. A three-dimensional view of the molecular machinery of RNA interferenc. Nature 2009, 457, 405–412. [Google Scholar] [CrossRef] [PubMed]
- Davis, M.E.; Zuckermann, J.E.; Choi, C.H.J.; Seligson, D.; Tolcher, A.; Alabi, A.; Yen, Y.; Heidel, J.D.; Ribas, A. Evidence of RNAi in humans from systemically administered siRNA via targeted nanoparticles. Nature 2010, 464, 1067–1070. [Google Scholar] [CrossRef]
- Coelho, T.; Adams, D.; Silva, A.; Lozeron, P.; Hawkins, P.N.; Mant, T.; Perez, J.; Chiesa, J.; Warrington, S.; Tranter, E.; et al. Safety and Efficacy of RNAi Therapy for Transthyretin Amyloidosis. N. Engl. J. Med. 2013, 369, 819–829. [Google Scholar] [CrossRef]
- Zimmermann, T.; Karsten, V.; Harrop, J.; Chan, A.; Chiesa, J.; Peters, G.; Falzone, R.; Cehelsky, J.; Nochur, S.; Vaishnaw, A.; et al. Phase I First-in-Humans Trial of ALN-TTRsc, a Novel RNA Interference Therapeutic for the Treatment of Familial Amyloidotic Cardiomyopathy (FAC). J. Card. Fail. 2013, 19, S66. [Google Scholar] [CrossRef]
- Kim, M.G.; Jo, S.D.; Yhee, J.Y.; Lee, B.S.; Lee, S.J.; Park, S.G.; Kang, S.W.; Kim, S.H.; Jeong, J.H. Synergistic anti-tumor effects of bevacizumab and tumor targeted polymerized VEGF siRNA nanoparticles. Biochem. Biophys. Res. Commun. 2017, 489, 35–41. [Google Scholar] [CrossRef]
- Grzelinski, M.; Urban-Klein, B.; Martens, T.; Lamszus, K.; Bakowsky, U.; Hobel, S.; Czubayko, F.; Aigner, A. RNA Interference-Mediated Gene Silencing of Pleiotrophin Through Polyethylenimine-Complexed Small Interfering RNAs In Vivo Exerts Antitumoral Effects in Glioblastoma Xenografts. Hum. Gene Ther. 2006, 17. [Google Scholar] [CrossRef]
- Zukiel, R.; Nowak, S.; Wyszko, E.; Rolle, K.; Gawronska, I.; Barciszewska, M.Z.; Barciszewski, J. Suppression of human brain tumor with interference RNA specific for tenascin-C. Cancer Biol. Ther. 2006, 5, 1002–1007. [Google Scholar] [CrossRef]
- Bruun, J.; Larsen, T.B.; Jølck, R.I.; Eliasen, R.; Holm, R.; Gjetting, T.; Andresen, T.L. Investigation of enzyme-sensitive lipid nanoparticles for delivery of siRNA to blood–brain barrier and glioma cells. Int. J. Nanomed. 2015, 10, 5995–6008. [Google Scholar]
- Qiu, J.; Kong, L.; Cao, X.; Li, A.; Wei, P.; Wang, L.; Mignani, S.; Caminade, A.-M.; Majoral, J.-P.; Shi, X. Enhanced Delivery of Therapeutic siRNA into Glioblastoma Cells Using Dendrimer-Entrapped Gold Nanoparticles Conjugated with β-Cyclodextrin. Nanomaterials 2018, 8, 131. [Google Scholar] [CrossRef] [PubMed]
- Kong, L.; Qiu, J.; Sun, W.; Yang, J.; Shen, M.; Wang, L.; Shi, X. Multifunctional PEI-entrapped gold nanoparticles enable efficient delivery of therapeutic siRNA into glioblastoma cells. Biomater. Sci. 2017, 5, 258–266. [Google Scholar] [CrossRef] [PubMed]
- Wan, Y.; Moyle, P.M.; Christie, M.P.; Toth, I.; Wan, Y.; Moyle, P.M.; Christie, P.M. DNA delivery systems: Optimization of endosome escape activity. Nanomedicine 2016, 11, 907–919. [Google Scholar] [CrossRef] [PubMed]
- Rettig, G.R.; Behlke, M.A. Progress toward in vivo use of siRNAs-II. Mol. Ther. 2012, 20, 483–512. [Google Scholar] [CrossRef] [PubMed]
- Moghimi, S.M.; Symonds, P.; Murray, J.C.; Hunter, A.C.; Debska, G.; Szewczyk, A. Two-Stage Poly(ethylenimine)-Mediated Cytotoxicity: Implications for Gene Transfer/Therapy. Mol. Ther. 2005, 11, 990–995. [Google Scholar] [CrossRef] [PubMed]
- Navarro, G.; Essex, S.; Sawant, R.R.; Biswas, S.; Nagesha, D.; Sridhar, S.; de ILarduya, C.T.; Torchilin, V.P. Phospholipid-modified polyethylenimine-based nanopreparations for siRNA-mediated gene silencing: Implications for transfection and the role of lipid components. Nanomed. Nanotechnol. Biol. Med. 2014, 10, 411–419. [Google Scholar] [CrossRef] [PubMed]
- Bielinska, A.; Kukowska-Latallo, J.F.; Johnson, J.; Tomalia, D.A.; Baker, J.R. Regulation of in vitro gene expression using antisense oligonucleotides or antisense expression plasmids transfected using starburst PAMAM dendrimers. Nucleic Acids Res. 1996, 24, 2176–2182. [Google Scholar] [CrossRef] [PubMed] [Green Version]
- Liu, L.; Zheng, M.; Librizzi, D.; Renette, T.; Merkel, O.M.; Kissel, T. Efficient and Tumor Targeted siRNA Delivery by Polyethylenimine-graft-polycaprolactone-block-poly(ethylene glycol)-folate (PEI–PCL–PEG–Fol). Mol. Pharm. 2016, 13, 134–143. [Google Scholar] [CrossRef]
- Navarro, G.; Pan, J.; Torchilin, V.P. Micelle-like nanoparticles as carriers for DNA and siRNA. Mol. Pharm. 2015, 12, 301–313. [Google Scholar] [CrossRef]
- Mowery, B.P.; Lee, S.E.; Kissounko, D.A.; Epand, R.F.; Epand, R.M.; Weisblum, B.; Stahl, S.S.; Gellman, S.H. Mimicry of antimicrobial host-defense peptides by random copolymers. J. Am. Chem. Soc. 2007, 129, 15474–15476. [Google Scholar] [CrossRef]
- Dohm, M.T.; Mowery, B.P.; Czyzewski, A.M.; Stahl, S.S.; Gellman, S.H.; Barron, A.E. Biophysical mimicry of lung surfactant protein B by random nylon-3 copolymers. J. Am. Chem. Soc. 2010, 132, 7957–7967. [Google Scholar] [CrossRef] [PubMed]
- Dane, E.L.; Grinstaff, M.W. Poly-amido-saccharides: Synthesis via Anionic Polymerization of a β-Lactam Sugar Monomer. J. Am. Chem. Soc. 2012, 134, 16255–16264. [Google Scholar] [CrossRef] [PubMed]
- Lee, M.R.; Stahl, S.S.; Gellman, S.H.; Masters, K.S. Nylon-3 copolymers that generate cell-adhesive surfaces identified by library screening. J. Am. Chem. Soc. 2009, 131, 16779–16789. [Google Scholar] [CrossRef] [PubMed]
- Nadithe, V.; Liu, R.; Killinger, B.A.; Movassaghian, S.; Kim, N.H.; Moszczynska, A.B.; Masters, K.S.; Gellman, S.H.; Merkel, O.M. Screening nylon-3 polymers, a new class of cationic amphiphiles, for siRNA delivery. Mol. Pharm. 2015, 12, 362–374. [Google Scholar] [CrossRef] [PubMed]
- Liu, R.; Masters, K.S.; Gellman, S.H. Polymer chain length effects on fibroblast attachment on nylon-3-modified surfaces. Biomacromolecules 2012, 13, 1100–1105. [Google Scholar] [CrossRef] [PubMed]
- Liu, R.; Chen, X.; Hayouka, Z.; Chakraborty, S.; Falk, S.P.; Weisblum, B.; Masters, K.S.; Gellman, S.H. Nylon-3 polymers with selective antifungal activity. J. Am. Chem. Soc. 2013, 135, 5270–5273. [Google Scholar] [CrossRef]
- Liu, R.; Chen, X.; Falk, S.P.; Mowery, B.P.; Karlsson, A.J.; Weisblum, B.; Palecek, S.P.; Masters, K.S.; Gellman, S.H. Structure-activity relationships among antifungal nylon-3 polymers: Identification of materials active against drug-resistant strains of Candida albicans. J. Am. Chem. Soc. 2014, 136, 4333–4342. [Google Scholar] [CrossRef] [PubMed]
- Zhang, J.; Kissounko, D.A.; Lee, S.E.; Gellman, S.H.; Stahl, S.S. Access to poly-β-peptides with functionalized side chains and end groups via controlled ring-opening polymerization of β-lactams. J. Am. Chem. Soc. 2009, 131, 1589–1597. [Google Scholar] [CrossRef] [PubMed]
- Elsayed, M.; Corrand, V.; Kolhatkar, V.; Xie, Y.; Kim, N.H.; Kolhatkar, R.; Merkel, O.M. Influence of oligospermines architecture on their suitability for siRNA delivery. Biomacromolecules 2014, 15, 1299–1310. [Google Scholar] [CrossRef]
- Merkel, O.M.; Librizzi, D.; Pfestroff, A.; Schurrat, T.; Béhé, M.; Kissel, T. In Vivo SPECT and real-time gamma camera imaging of biodistribution and pharmacokinetics of siRNA delivery using an optimized radiolabeling and purification procedure. Bioconjug. Chem. 2009, 20, 174–182. [Google Scholar] [CrossRef] [PubMed]
- Benfer, M.; Kissel, T. Cellular uptake mechanism and knockdown activity of siRNA-loaded biodegradable DEAPA-PVA-g-PLGA nanoparticles. Eur. J. Pharm. Biopharm. 2012, 80, 247–256. [Google Scholar] [CrossRef] [PubMed]
- Liu, Y.; Peterson, D.; Hideo, K.; David, S. Mechanism of cellular 3-(4,5-dimethylthiazol-2-yl)-2,5-diphenyltetrazolium bromide (MTT) reduction. J. Neurochem. 1997, 69, 581–593. [Google Scholar] [CrossRef] [PubMed]
- Han, X.; Gelein, R.; Corson, N.; Wade-Mercer, P.; Jiang, J.; Biswas, P.; Finkelstein, J.N.; Elder, A.; Oberdörster, G. Validation of an LDH assay for assessing nanoparticle toxicity. Toxicology 2011, 287, 99–104. [Google Scholar] [CrossRef] [PubMed] [Green Version]
- Guo, D.; Wang, B.; Han, F.; Lei, T. RNA interference therapy for glioblastoma. Expert Opin. Biol. Ther. 2010, 10, 927–936. [Google Scholar] [CrossRef] [PubMed]
- De Martimprey, H.; Vauthier, C.; Malvy, C.; Couvreur, P. Polymer nanocarriers for the delivery of small fragments of nucleic acids: Oligonucleotides and siRNA. Eur. J. Pharm. Biopharm. 2009, 71, 490–504. [Google Scholar] [CrossRef] [PubMed]
- Jones, S.K.; Lizzio, V.; Merkel, O.M. Folate Receptor Targeted Delivery of siRNA and Paclitaxel to Ovarian Cancer Cells via Folate Conjugated Triblock Copolymer to Overcome TLR4 Driven Chemotherapy Resistance. Biomacromolecules 2016, 17, 76–87. [Google Scholar] [CrossRef] [PubMed]
- Aigner, A.; Kögel, D. Nanoparticle/siRNA-based therapy strategies in glioma: Which nanoparticles, which siRNAs ? Nanomedicine 2018, 13. [Google Scholar] [CrossRef] [PubMed]
- Zheng, M.; Pavan, G.M.; Neeb, M.; Schaper, A.K.; Danani, A.; Klebe, G.; Merkel, O.M.; Kissel, T. Tageting the blind spot of polycationic nanocarrier based siRNA Delivery. ACS Nano 2012, 6, 9447–9454. [Google Scholar] [CrossRef]
- Weatherall, E.; Willmott, G.R. Applications of tunable resistive pulse sensing. Analyst 2015, 140, 3318–3334. [Google Scholar] [CrossRef]
- Kabanov, A.V.; Kabanov, V.A. Interpolyelectrolyte and block ionomer complexes for gene delivery: Physico-chemical aspects. Adv. Drug Deliv. Rev. 1998, 30, 49–60. [Google Scholar] [CrossRef]
- Rejman, J.; Bragonzi, A.; Conese, M. Role of clathrin- and caveolae-mediated endocytosis in gene transfer mediated by lipo- and polyplexes. Mol. Ther. 2005, 12, 468–474. [Google Scholar] [CrossRef] [PubMed]
- Ruponen, M.; Ylä-Herttuala, S.; Urtti, A. Interactions of polymeric and liposomal gene delivery systems with extracellular glycosaminoglycans: Physicochemical and transfection studies. Biochim. Biophys. Acta Biomembr. 1999, 1415, 331–341. [Google Scholar] [CrossRef]
- Samuel, J.; Lavasanifar, A.; Alshamsan, A.; Uludağ, H.; Haddadi, A.; Incani, V. Formulation and delivery of siRNA by oleic acid and stearic acid modified polyethylenimine. Mol. Pharm. 2009, 6, 121–133. [Google Scholar]
- Biswas, S.; Deshpande, P.P.; Navarro, G.; Dodwadkar, N.S.; Torchilin, V.P. Lipid modified triblock PAMAM-based nanocarriers for siRNA drug co-delivery. Biomaterials 2013, 34, 1289–1301. [Google Scholar] [CrossRef] [PubMed] [Green Version]
- Win, K.Y.; Feng, S. Effects of particle size and surface coating on cellular uptake of polymeric nanoparticles for oral delivery of anticancer drugs. Biomaterials 2005, 26, 2713–2722. [Google Scholar] [CrossRef]
- Ivanov, A.I. Pharmacological Inhibition of Endocytic Pathways: Is it Specific Enough to be Useful? In Methods in Molecular Biology; Ivanov, A.I., Ed.; Humana Press: New York, NY, USA, 2008; pp. 15–33. [Google Scholar]
- Wang, L.H.; Rothberg, K.G.; Anderson, R.G.W. Mis-assembly of clathrin lattices on endosomes reveals a regulatory switch for coated pit formation. J. Cell Biol. 1993, 123, 1107–1117. [Google Scholar] [CrossRef] [PubMed]
- Rodal, S.K.; Skretting, G.; Garred, O.; Vilhardt, F.; van Deurs, B.; Sandvig, K. Extraction of Cholesterol with Methyl-beta-Cyclodextrin Perturbs Formation of Clathrin-coated Endocytic Vesicles. Mol. Biol. Cell 1999, 10, 961–974. [Google Scholar] [CrossRef]
- Lu, J.J.; Langer, R.; Chen, J. A novel mechanism is involved in cationic lipid-mediated functional siRNA delivery. Mol. Pharm. 2009, 6, 763–771. [Google Scholar] [CrossRef]
- Merkel, O.M.; Librizzi, D.; Pfestroff, A.; Schurrat, T.; Buyens, K.; Sanders, N.N.; De Smedt, S.C.; Béhé, M.; Kissel, T. Stability of siRNA polyplexes from poly(ethylenimine) and poly(ethylenimine)-g-poly(ethylene glycol) under in vivo conditions: Effects on pharmacokinetics and biodistribution measured by Fluorescence Fluctuation Spectroscopy and Single Photon Emission Com. J. Control. Release 2009, 138, 148–159. [Google Scholar] [CrossRef]
- Martens, T.F.; Remaut, K.; Demeester, J.; De Smedt, S.C.; Braeckmans, K. Intracellular delivery of nanomaterials: How to catch endosomal escape in the act. Nano Today 2014, 9, 344–364. [Google Scholar] [CrossRef] [Green Version]
- Nguyen, J.; Szoka, F.C. Nucleic acid delivery: The missing pieces of the puzzle? Acc. Chem. Res. 2012, 45, 1153–1162. [Google Scholar] [CrossRef] [PubMed]
- Merkel, O.M.; Mintzer, M.A.; Librizzi, D.; Samsonova, O.; Dicke, T.; Sproat, B.; Garn, H.; Barth, P.J.; Simanek, E.E.; Kissel, T. Triazine dendrimers as nonviral vectors for in vitro and in vivo RNAi: The effects of peripheral groups and core structure on biological activity. Mol. Pharm. 2010, 7, 969–983. [Google Scholar] [CrossRef] [PubMed]
- Xu, Y.; Szoka, F.C. Mechanism of DNA release from cationic liposome/DNA complexes used in cell transfection. Biochemistry 1996, 35, 5616–5623. [Google Scholar] [CrossRef] [PubMed]
- Shete, H.K.; Prabhu, R.H.; Patravale, V.B. Formation and intracellular trafficking of lipoplexes and polyplexes. Mol. Ther. 2005, 11, 336–347. [Google Scholar]
- Shete, H.K.; Prabhu, R.H. Endosomal Escape: A Bottleneck in Intracellular Delivery. J. Nanosci. Nanotechnol. 2014, 14, 460–474. [Google Scholar] [CrossRef]
- Urban-Klein, B.; Werth, S.; Abuharbeid, S.; Czubayko, F.; Aigner, A. RNAi-mediated gene-targeting through systemic application of polyethylenimine (PEI)-complexed siRNA in vivo. Gene Ther. 2005, 12, 461–466. [Google Scholar] [CrossRef]
- Merkel, O.M.; Kissel, T. Quo vadis polyplex? J. Control. Release 2014, 190, 415–423. [Google Scholar] [CrossRef]


| N/P Ratio | DLS (Mean Size ± SD) [nm] | TRPS (Mean Size ± SD) [nm] |
|---|---|---|
| 4 | 158.00 ± 5.18 | 177.00 ± 15.56 |
| 5.5 | 133.37 ± 1.79 | 100.50 ± 0.71 |
| 7.5 | 144.30 ± 1.76 | 164.00 ± 22.63 |
| 11.5 | 164.00 ± 3.8 | 193.00 ± 5.66 |
© 2019 by the authors. Licensee MDPI, Basel, Switzerland. This article is an open access article distributed under the terms and conditions of the Creative Commons Attribution (CC BY) license (http://creativecommons.org/licenses/by/4.0/).
Share and Cite
Hartl, N.; Adams, F.; Costabile, G.; Isert, L.; Döblinger, M.; Xiao, X.; Liu, R.; Merkel, O.M. The Impact of Nylon-3 Copolymer Composition on the Efficiency of siRNA Delivery to Glioblastoma Cells. Nanomaterials 2019, 9, 986. https://doi.org/10.3390/nano9070986
Hartl N, Adams F, Costabile G, Isert L, Döblinger M, Xiao X, Liu R, Merkel OM. The Impact of Nylon-3 Copolymer Composition on the Efficiency of siRNA Delivery to Glioblastoma Cells. Nanomaterials. 2019; 9(7):986. https://doi.org/10.3390/nano9070986
Chicago/Turabian StyleHartl, Natascha, Friederike Adams, Gabriella Costabile, Lorenz Isert, Markus Döblinger, Ximian Xiao, Runhui Liu, and Olivia M. Merkel. 2019. "The Impact of Nylon-3 Copolymer Composition on the Efficiency of siRNA Delivery to Glioblastoma Cells" Nanomaterials 9, no. 7: 986. https://doi.org/10.3390/nano9070986
APA StyleHartl, N., Adams, F., Costabile, G., Isert, L., Döblinger, M., Xiao, X., Liu, R., & Merkel, O. M. (2019). The Impact of Nylon-3 Copolymer Composition on the Efficiency of siRNA Delivery to Glioblastoma Cells. Nanomaterials, 9(7), 986. https://doi.org/10.3390/nano9070986