Targeted Gold Nanoparticle–Oligonucleotide Contrast Agents in Combination with a New Local Voxel-Wise MRI Analysis Algorithm for In Vitro Imaging of Triple-Negative Breast Cancer

 ,
, 
Abstract
1. Introduction
2. Materials and Methods
2.1. Materials
2.2. Chemical Synthesis of 4-nm Gold Nanoparticles (GNPs)
2.3. Chemical Synthesis of Gadolinium (III) DO3A-SH (Gd(III)-DO3A-SH)
2.4. Preparation of AS1411/CRO/CTR for Conjugation to GNP
2.5. Chemical Synthesis of GNP-Gd(III)-DO3A-SH-Oligonucleotide
2.6. Oligonucleotides Quantification
2.7. Transmission Electron Microscopy
2.8. Confirmation of Oligonucleotide Coating via Fluorescence
2.9. Gadolinium Quantification with Energy-Dispersive X-Ray Analysis (EDAX)
2.10. Gadolinium Quantification with Xylenol Orange Titration
2.11. Cell Culture
2.12. Magnetic Resonance Imaging (MRI) Agarose Phantoms
2.13. Magnetic Resonance (MR) Imaging
2.14. Determination of GNP-Gd(III)-DO3A-SH-Oligonucleotide Cellular Uptake Using Live MDA-MB-231 and MCF-10A
2.15. T1-Weighted Image Analysis Algorithm
2.16. Statistical Comparison of VNMRJ and Algorithm Contrast Measurements
3. Results and Discussion
4. Conclusions
Supplementary Materials
Author Contributions
Funding
Conflicts of Interest
References
- Iyer, A.K.; Khaled, G.; Fang, J.; Maeda, H. Exploiting the enhanced permeability and retention effect for tumor targeting. Drug Discov. Today 2006, 11, 812–818. [Google Scholar] [CrossRef] [PubMed]
- Lee, J.; Chatterjee, D.K.; Lee, M.H.; Krishnan, S. Gold nanoparticles in breast cancer treatment: Promise and potential pitfalls. Cancer Lett. 2014, 347, 46–53. [Google Scholar] [CrossRef] [PubMed]
- Ai, J.; Xu, Y.; Lou, B.; Li, D.; Wang, E. Multifunctional as1411-functionalized fluorescent gold nanoparticles for targeted cancer cell imaging and efficient photodynamic therapy. Talanta 2014, 118, 54–60. [Google Scholar] [CrossRef] [PubMed]
- Shiao, Y.-S.; Chiu, H.-H.; Wu, P.-H.; Huang, Y.-F. Aptamer-functionalized gold nanoparticles as photoresponsive nanoplatform for co-drug delivery. ACS Appl. Mater. Interfaces 2014, 6, 21832–21841. [Google Scholar] [CrossRef]
- Song, Y.; Xu, X.; MacRenaris, K.W.; Zhang, X.-Q.; Mirkin, C.A.; Meade, T.J. Multimodal gadolinium-enriched DNA gold nanoparticle conjugates for cellular imaging. Angew. Chem. Int. Ed. 2009, 48, 9143–9147. [Google Scholar] [CrossRef] [PubMed]
- Li, J.-L.; Wang, L.; Liu, X.-Y.; Zhang, Z.-P.; Guo, H.-C.; Liu, W.-M.; Tang, S.-H. In vitro cancer cell imaging and therapy using transferrin-conjugated gold nanoparticles. Cancer Lett. 2009, 274, 319–326. [Google Scholar] [CrossRef] [PubMed]
- Kodiha, M.; Wang, Y.M.; Hutter, E.; Maysinger, D.; Stochaj, U. Off to the organelles - killing cancer cells with targeted gold nanoparticles. Theranostics 2015, 5, 357–370. [Google Scholar] [CrossRef]
- Malik, M.T.; O’Toole, M.G.; Casson, L.K.; Thomas, S.D.; Bardi, G.T.; Reyes-Reyes, E.M.; Ng, C.K.; Kang, K.A.; Bates, P.J. As1411-conjugated gold nanospheres and their potential for breast cancer therapy. Oncotarget 2015, 6, 22270–22281. [Google Scholar] [CrossRef]
- Bates, P.J.; Kahlon, J.B.; Thomas, S.D.; Trent, J.O.; Miller, D.M. Antiproliferative activity of g-rich oligonucleotides correlates with protein binding. Int. J. Biol. Chem. 1999, 274, 26369–26377. [Google Scholar] [CrossRef]
- Bates, P.J.; Laber, D.A.; Miller, D.M.; Thomas, S.D.; Trent, J.O. Discovery and development of the g-rich oligonucleotide as1411 as a novel treatment for cancer. Exp. Mol. Pathol. 2009, 86, 151–164. [Google Scholar] [CrossRef]
- Christian, S.; Pilch, J.; Akerman, M.E.; Porkka, K.; Laakkonen, P.; Ruoslahti, E. Nucleolin expressed at the cell surface is a marker of endothelial cells in angiogenic blood vessels. J. Cell Biol. 2003, 163, 871–878. [Google Scholar] [CrossRef]
- Abdelmohsen, K.; Gorospe, M. Rna-binding protein nucleolin in disease. RNA Biol. 2012, 9, 799–808. [Google Scholar] [CrossRef] [PubMed]
- Zhou, Z.; Lu, Z.-R. Gadolinium-based contrast agents for magnetic resonance cancer imaging. Wiley Interdiscip. Rev. Nanomed. Nanobiotechnol. 2013, 5, 1–18. [Google Scholar] [CrossRef] [PubMed]
- Pais, A. Characterization of estrogen-receptor-targeted contrast-agents in solution. Magn. Reson. Med. 2013, 70, 193–206. [Google Scholar] [CrossRef] [PubMed]
- Runge, V.M. Gadolinium chelate contrast agents in MRI: Clinical applications. In eMagRes; John Wiley & Sons, Ltd: Hoboken, NJ, USA, 2007. [Google Scholar]
- Maravilla, K.R.; Smith, M.P.; Vymazal, J.; Goyal, M.; Herman, M.; Baima, J.J.; Babbel, R.; Vaneckova, M.; Žižka, J.; Colosimo, C.; et al. Are there differences between macrocyclic gadolinium contrast agents for brain tumor imaging? Results of a multicenter intraindividual crossover comparison of gadobutrol with gadoteridol (the truth study). Am. J. Neuroradiol. 2015, 36, 14–23. [Google Scholar] [CrossRef] [PubMed]
- Vaneckova, M.; Herman, M.; Smith, M.P.; Mechl, M.; Maravilla, K.R.; Weichet, J.; Spampinato, M.V.; Žižka, J.; Wippold, F.J.; Baima, J.J.; et al. The benefits of high relaxivity for brain tumor imaging: Results of a multicenter intraindividual crossover comparison of gadobenate dimeglumine with gadoterate meglumine (the benefit study). Am. J. Neuroradiol. 2015, 36, 1589–1598. [Google Scholar] [CrossRef]
- Caravan, P.; Ellison, J.J.; McMurry, T.J.; Lauffer, R.B. Gadolinium(iii) chelates as mri contrast agents: Structure, dynamics, and applications. Chem. Rev. 1999, 99, 2293–2352. [Google Scholar] [CrossRef] [PubMed]
- Adam, G.; Guenther, R.; Muehler, A.; Platzek, J.; Schmitt-Willich, H. Use of polymeric contrast agents of medium molecular weight for differentiating between benign and malignant tumours using modern imaging techniques. Patent No. WO1996035456A3, 5 November 1995. [Google Scholar]
- Sarin, H.; Kanevsky, A.S.; Wu, H.; Sousa, A.A.; Wilson, C.M.; Aronova, M.A.; Griffiths, G.L.; Leapman, R.D.; Vo, H.Q. Physiologic upper limit of pore size in the blood-tumor barrier of malignant solid tumors. J. Transl. Med. 2009, 7, 51. [Google Scholar] [CrossRef]
- Uzgiris, E. Tumor microvasculature: Endothelial leakiness and endothelial pore size distribution in a breast cancer model. Breast Cancer Basic Clin. Res. 2008, 1, 83–90. [Google Scholar] [CrossRef]
- Que, E.L.; Chang, C.J. Responsive magnetic resonance imaging contrast agents as chemical sensors for metals in biology and medicine. Chem. Soc. Rev. 2010, 39, 51–60. [Google Scholar] [CrossRef]
- Hingorani, D.V.; Bernstein, A.S.; Pagel, M.D. A review of responsive mri contrast agents: 2005–2014. Contrast Media Mol. Imaging 2015, 10, 245–265. [Google Scholar] [CrossRef]
- Nakamura, T.; Kawano, K.; Shiraishi, K.; Yokoyama, M.; Maitani, Y. Folate-targeted gadolinium-lipid-based nanoparticles as a bimodal contrast agent for tumor fluorescent and magnetic resonance imaging. Biol. Pharm. Bull. 2014, 37, 521–527. [Google Scholar] [CrossRef]
- Caravan, P. Protein-targeted gadolinium-based magnetic resonance imaging (mri) contrast agents: Design and mechanism of action. Acc. Chem. Res. 2009, 42, 851–862. [Google Scholar] [CrossRef]
- Bates, P.J.; Reyes-Reyes, E.M.; Malik, M.T.; Murphy, E.M.; O’Toole, M.G.; Trent, J.O. G-quadruplex oligonucleotide as1411 as a cancer-targeting agent: Uses and mechanisms. Biochim. Biophys. Acta 2017, 1861, 1414–1428. [Google Scholar] [CrossRef]
- Swanson, S.D.; Kukowska-Latallo, J.F.; Patri, A.K.; Chen, C.; Ge, S.; Cao, Z.; Kotlyar, A.; East, A.T.; Baker, J.R. Targeted gadolinium-loaded dendrimer nanoparticles for tumor-specific magnetic resonance contrast enhancement. Int. J. Nanomed. 2008, 3, 201–210. [Google Scholar]
- Ghaghada, K.B.; Ravoori, M.; Sabapathy, D.; Bankson, J.; Kundra, V.; Annapragada, A. New dual mode gadolinium nanoparticle contrast agent for magnetic resonance imaging. PLoS ONE 2009, 4, e7628. [Google Scholar] [CrossRef]
- Umashankar, M.S.; Sachdeva, R.K.; Gulati, M. Aquasomes: A promising carrier for peptides and protein delivery. Nanomed. Nanotechnol. Biol. Med. 2010, 6, 419–426. [Google Scholar] [CrossRef]
- Alric, C.; Taleb, J.; Duc, G.L.; Mandon, C.; Billotey, C.; Meur-Herland, A.L.; Brochard, T.; Vocanson, F.; Janier, M.; Perriat, P.; et al. Gadolinium chelate coated gold nanoparticles as contrast agents for both x-Ray computed tomography and magnetic resonance imaging. J. Am. Chem. Soc. 2008, 130, 5908–5915. [Google Scholar] [CrossRef] [PubMed]
- Boisselier, E.; Astruc, D. Gold nanoparticles in nanomedicine: Preparations, imaging, diagnostics, therapies and toxicity. Chem. Soc. Rev. 2009, 38, 1759–1782. [Google Scholar] [CrossRef] [PubMed]
- Chen, Q.; Li, K.; Wen, S.; Liu, H.; Peng, C.; Cai, H.; Shen, M.; Zhang, G.; Shi, X. Targeted ct/mr dual mode imaging of tumors using multifunctional dendrimer-entrapped gold nanoparticles. Biomaterials 2013, 34, 5200–5209. [Google Scholar] [CrossRef]
- Dong, W.; Li, Y.; Niu, D.; Ma, Z.; Liu, X.; Gu, J.; Zhao, W.; Zheng, Y.; Shi, J. A simple route to prepare monodisperse au np-decorated, dye-doped, superparamagnetic nanocomposites for optical, mr, and ct trimodal imaging. Small 2013, 9, 2500–2508. [Google Scholar] [CrossRef] [PubMed]
- Popovtzer, R.; Agrawal, A.; Kotov, N.A.; Popovtzer, A.; Balter, J.; Carey, T.E.; Kopelman, R. Targeted gold nanoparticles enable molecular ct imaging of cancer. Nano Letters 2008, 8, 4593–4596. [Google Scholar] [CrossRef] [PubMed]
- Xi, D.; Dong, S.; Meng, X.; Lu, Q.; Meng, L.; Ye, J. Gold nanoparticles as computerized tomography (ct) contrast agents. RSC Adv. 2012, 2, 12515–12524. [Google Scholar] [CrossRef]
- Stirrat, J.; Rajchl, M.; Bergin, L.; Patton, D.J.; Peters, T.; White, J.A. High-resolution 3-dimensional late gadolinium enhancement scar imaging in surgically corrected tetralogy of fallot: Clinical feasibility of volumetric quantification and visualization. J. Cardiovasc. Magn. Reson. 2014, 16, 76. [Google Scholar] [CrossRef]
- Daducci, A.; Canales-Rodrı´guez, E.J.; Descoteaux, M.; Garyfallidis, E.; Gur, Y.; Lin, Y.C.; Mani, M.; Merlet, S.; Paquette, M.; Ramirez-Manzanares, A.; et al. Quantitative comparison of reconstruction methods for intra-voxel fiber recovery from diffusion mri. IEEE Trans. Med. Imaging 2014, 33, 384–399. [Google Scholar] [CrossRef]
- Kassubek, J.; Huppertz, H.-J.; Spreer, J.; Schulze-Bonhage, A. Detection and localization of focal cortical dysplasia by voxel-based 3-d mri analysis. Epilepsia 2002, 43, 596–602. [Google Scholar] [CrossRef]
- Daducci, A.; Gerhard, S.; Griffa, A.; Lemkaddem, A.; Cammoun, L.; Gigandet, X.; Meuli, R.; Hagmann, P.; Thiran, J.-P. The connectome mapper: An open-source processing pipeline to map connectomes with mri. PLoS ONE 2012, 7, e48121. [Google Scholar] [CrossRef]
- Khanal, B.; Lorenzi, M.; Ayache, N.; Pennec, X. A biophysical model of brain deformation to simulate and analyze longitudinal mris of patients with alzheimer’s disease. NeuroImage 2016, 134, 35–52. [Google Scholar] [CrossRef]
- Beheshti, I.; Demirel, H. Probability distribution function-based classification of structural mri for the detection of alzheimer’s disease. Comput. Biol. Med. 2015, 64, 208–216. [Google Scholar] [CrossRef]
- Martino, M.E.; de Villoria, J.G.; Lacalle-Aurioles, M.; Olazarán, J.; Cruz, I.; Navarro, E.; García-Vázquez, V.; Carreras, J.L.; Desco, M. Comparison of different methods of spatial normalization of fdg-pet brain images in the voxel-wise analysis of mci patients and controls. Ann. Nucl. Med. 2013, 27, 600–609. [Google Scholar] [CrossRef]
- Dawsey, A.C.; Hathaway, K.L.; Kim, S.; Williams, T.J. Introductory chemistry: A molar relaxivity experiment in the high school classroom. J. Chem. Educ. 2013, 90, 922–925. [Google Scholar] [CrossRef] [PubMed]
- Baglieri, A.; Marino, M.A.; Morabito, R.; Di Lorenzo, G.; Bramanti, P.; Marino, S. Differences between conventional and non-conventional mri techniques in parkinson’s disease. Funct. Neurol. 2013, 28, 73–82. [Google Scholar]
- Traboulsee, A.; Li, D.K.B.; Zhao, G.; Paty, D.W. Conventional mri techniques in multiple sclerosis. In Mr Imaging in White Matter Diseases of the Brain and Spinal Cord; Filippi, M., De Stefano, N., Dousset, V., McGowan, J.C., Eds.; Springer: Berlin/Heidelberg, Germany, 2005; pp. 211–223. [Google Scholar]
- Jana, N.R.; Gearheart, L.; Murphy, C.J. Wet chemical synthesis of high aspect ratio cylindrical gold nanorods. J. Phys. Chem. B 2001, 105, 4065–4067. [Google Scholar] [CrossRef]
- Masitas, R.A.; Zamborini, F.P. Oxidation of highly unstable <4 nm diameter gold nanoparticles 850 mv negative of the bulk oxidation potential. J. Am. Chem. Soc. 2012, 134, 5014–5017. [Google Scholar]
- Haiss, W.; Thanh, N.T.K.; Aveyard, J.; Fernig, D.G. Determination of size and concentration of gold nanoparticles from uv−vis spectra. Anal. Chem. 2007, 79, 4215–4221. [Google Scholar] [CrossRef] [PubMed]
- Lebduskova, P.; Hermann, P.; Helm, L.; Toth, E.; Kotek, J.; Binnemans, K.; Rudovsky, J.; Lukes, I.; Merbach, A.E. Gadolinium(iii) complexes of mono- and diethyl esters of monophosphonic acid analogue of dota as potential mri contrast agents: Solution structures and relaxometric studies. Dalton Trans. 2007, 493–501. [Google Scholar] [CrossRef]
- Lacerda, S.; Campello, M.P.; Marques, F.; Gano, L.; Kubicek, V.; Fouskova, P.; Toth, E.; Santos, I. A novel tetraazamacrocycle bearing a thiol pendant arm for labeling biomolecules with radiolanthanides. Dalton Trans. 2009, 4509–4518. [Google Scholar] [CrossRef] [PubMed]
- Chang, T.-C.; Yu, S.J. Microwave-assisted catalytic acetylation of alcohols by gold-nanoparticle–supported gadolinium complex. Synth. Commun. 2015, 45, 651–662. [Google Scholar] [CrossRef]
- Hurst, S.J.; Lytton-Jean, A.K.R.; Mirkin, C.A. Maximizing DNA loading on a range of gold nanoparticle sizes. Anal. Chem. 2006, 78, 8313–8318. [Google Scholar] [CrossRef] [PubMed]
- Warsi, M.F.; Chechik, V. Strategies for increasing relaxivity of gold nanoparticle based mri contrast agents. Phys. Chem. Chem. Phys. 2011, 13, 9812–9817. [Google Scholar] [CrossRef] [PubMed]
- Barge, A.; Cravotto, G.; Gianolio, E.; Fedeli, F. How to determine free gd and free ligand in solution of gd chelates. A technical note. Contrast Media Mol. Imaging 2006, 1, 184–188. [Google Scholar] [CrossRef]
- Su, Y.; Tan, M.L.; Lim, C.W.; Teo, S.K.; Selvaraj, S.K.; Wan, M.; Zhong, L.; Tan, R.S. Automatic correction of motion artifacts in 4d left ventricle model reconstructed from mri. Comput. Cardiol. 2014, 41, 705–708. [Google Scholar]
- Bruckman, M.A.; Yu, X.; Steinmetz, N.F. Engineering gd-loaded nanoparticles to enhance mri sensitivity via t(1) shortening. Nanotechnology 2013, 24, 462001. [Google Scholar] [CrossRef] [PubMed]
- Hartwig, V.; Giovannetti, G.; Vanello, N.; Lombardi, M.; Landini, L.; Simi, S. Biological effects and safety in magnetic resonance imaging: A review. Int. J. Environ. Res. Public Health 2009, 6, 1778–1798. [Google Scholar] [CrossRef] [PubMed]
- Zhang, H. Trisodium-[(2-(r)-[(4,4-diphenylcyclohexyl)phosphono-oxymethyl]-diethylenetriamine pentaacetato)(aquo)gadolinium(iii) gadofosveset. In Molecular Imaging and Contrast Agent Database (MICAD) [Internet]; National Center for Biotechnology Information: Bethesda, MD, USA, 2007. [Google Scholar]
- Jacques, V.; Dumas, S.; Sun, W.C.; Troughton, J.S.; Greenfield, M.T.; Caravan, P. High relaxivity mri contrast agents part 2: Optimization of inner- and second-sphere relaxivity. Investig. Radiol. 2010, 45, 613–624. [Google Scholar] [CrossRef]


| Sample | Hydrodynamic Size (nm) | TEM (nm) | Zeta Potential | Quantification of Functionalization Agents | |
|---|---|---|---|---|---|
| * Gd | ** Oligonucleotide | ||||
| GNP-Gd(III)-DO3A-SH AS1411 | 13.5 ± 2.1 | 3.4 ± 0.6 | −20.9 ± 1.1 | 23.23 ± 0.93 | 10 ± 2 |
| GNP-Gd(III)-DO3A-SH CRO | 19.3 ± 2.5 | 3.3 ± 0.6 | −57.6 ± 1.0 | 19.21 ± 5.57 | 9 ± 2 |
| GNP-Gd(III)-DO3A-SH CTR | 9.83 ± 1.45 | 5.45 ± 1.42 | −42.67 ± 4.15 | 13.95 ± 0.73 | |
| GNP Citrate | 4.88 ± 0.51 | 4.0 ± 0.7 | −16.25 ± 2.30 | ||
| T1 Contrast Enhancement (VNMRJ: Region of Interest (ROI)Analysis) | ||||||||||||||||
|---|---|---|---|---|---|---|---|---|---|---|---|---|---|---|---|---|
| Time (Hours) | 96 | 72 | 48 | 24 | ||||||||||||
| Cell Lines (type) with GNP Concentration (nM) | * GNP-Gd(III)-DO3A-SH-Oligonucleotide | ** M | * GNP-Gd(III)-DO3A-SH-Oligonucleotide | ** M | * GNP-Gd(III)-DO3A-SH-Oligonucleotide | ** M | * GNP-Gd(III)-DO3A-SH-Oligonucleotide | ** M | ||||||||
| A | B | C | A | B | C | A | B | C | A | B | C | |||||
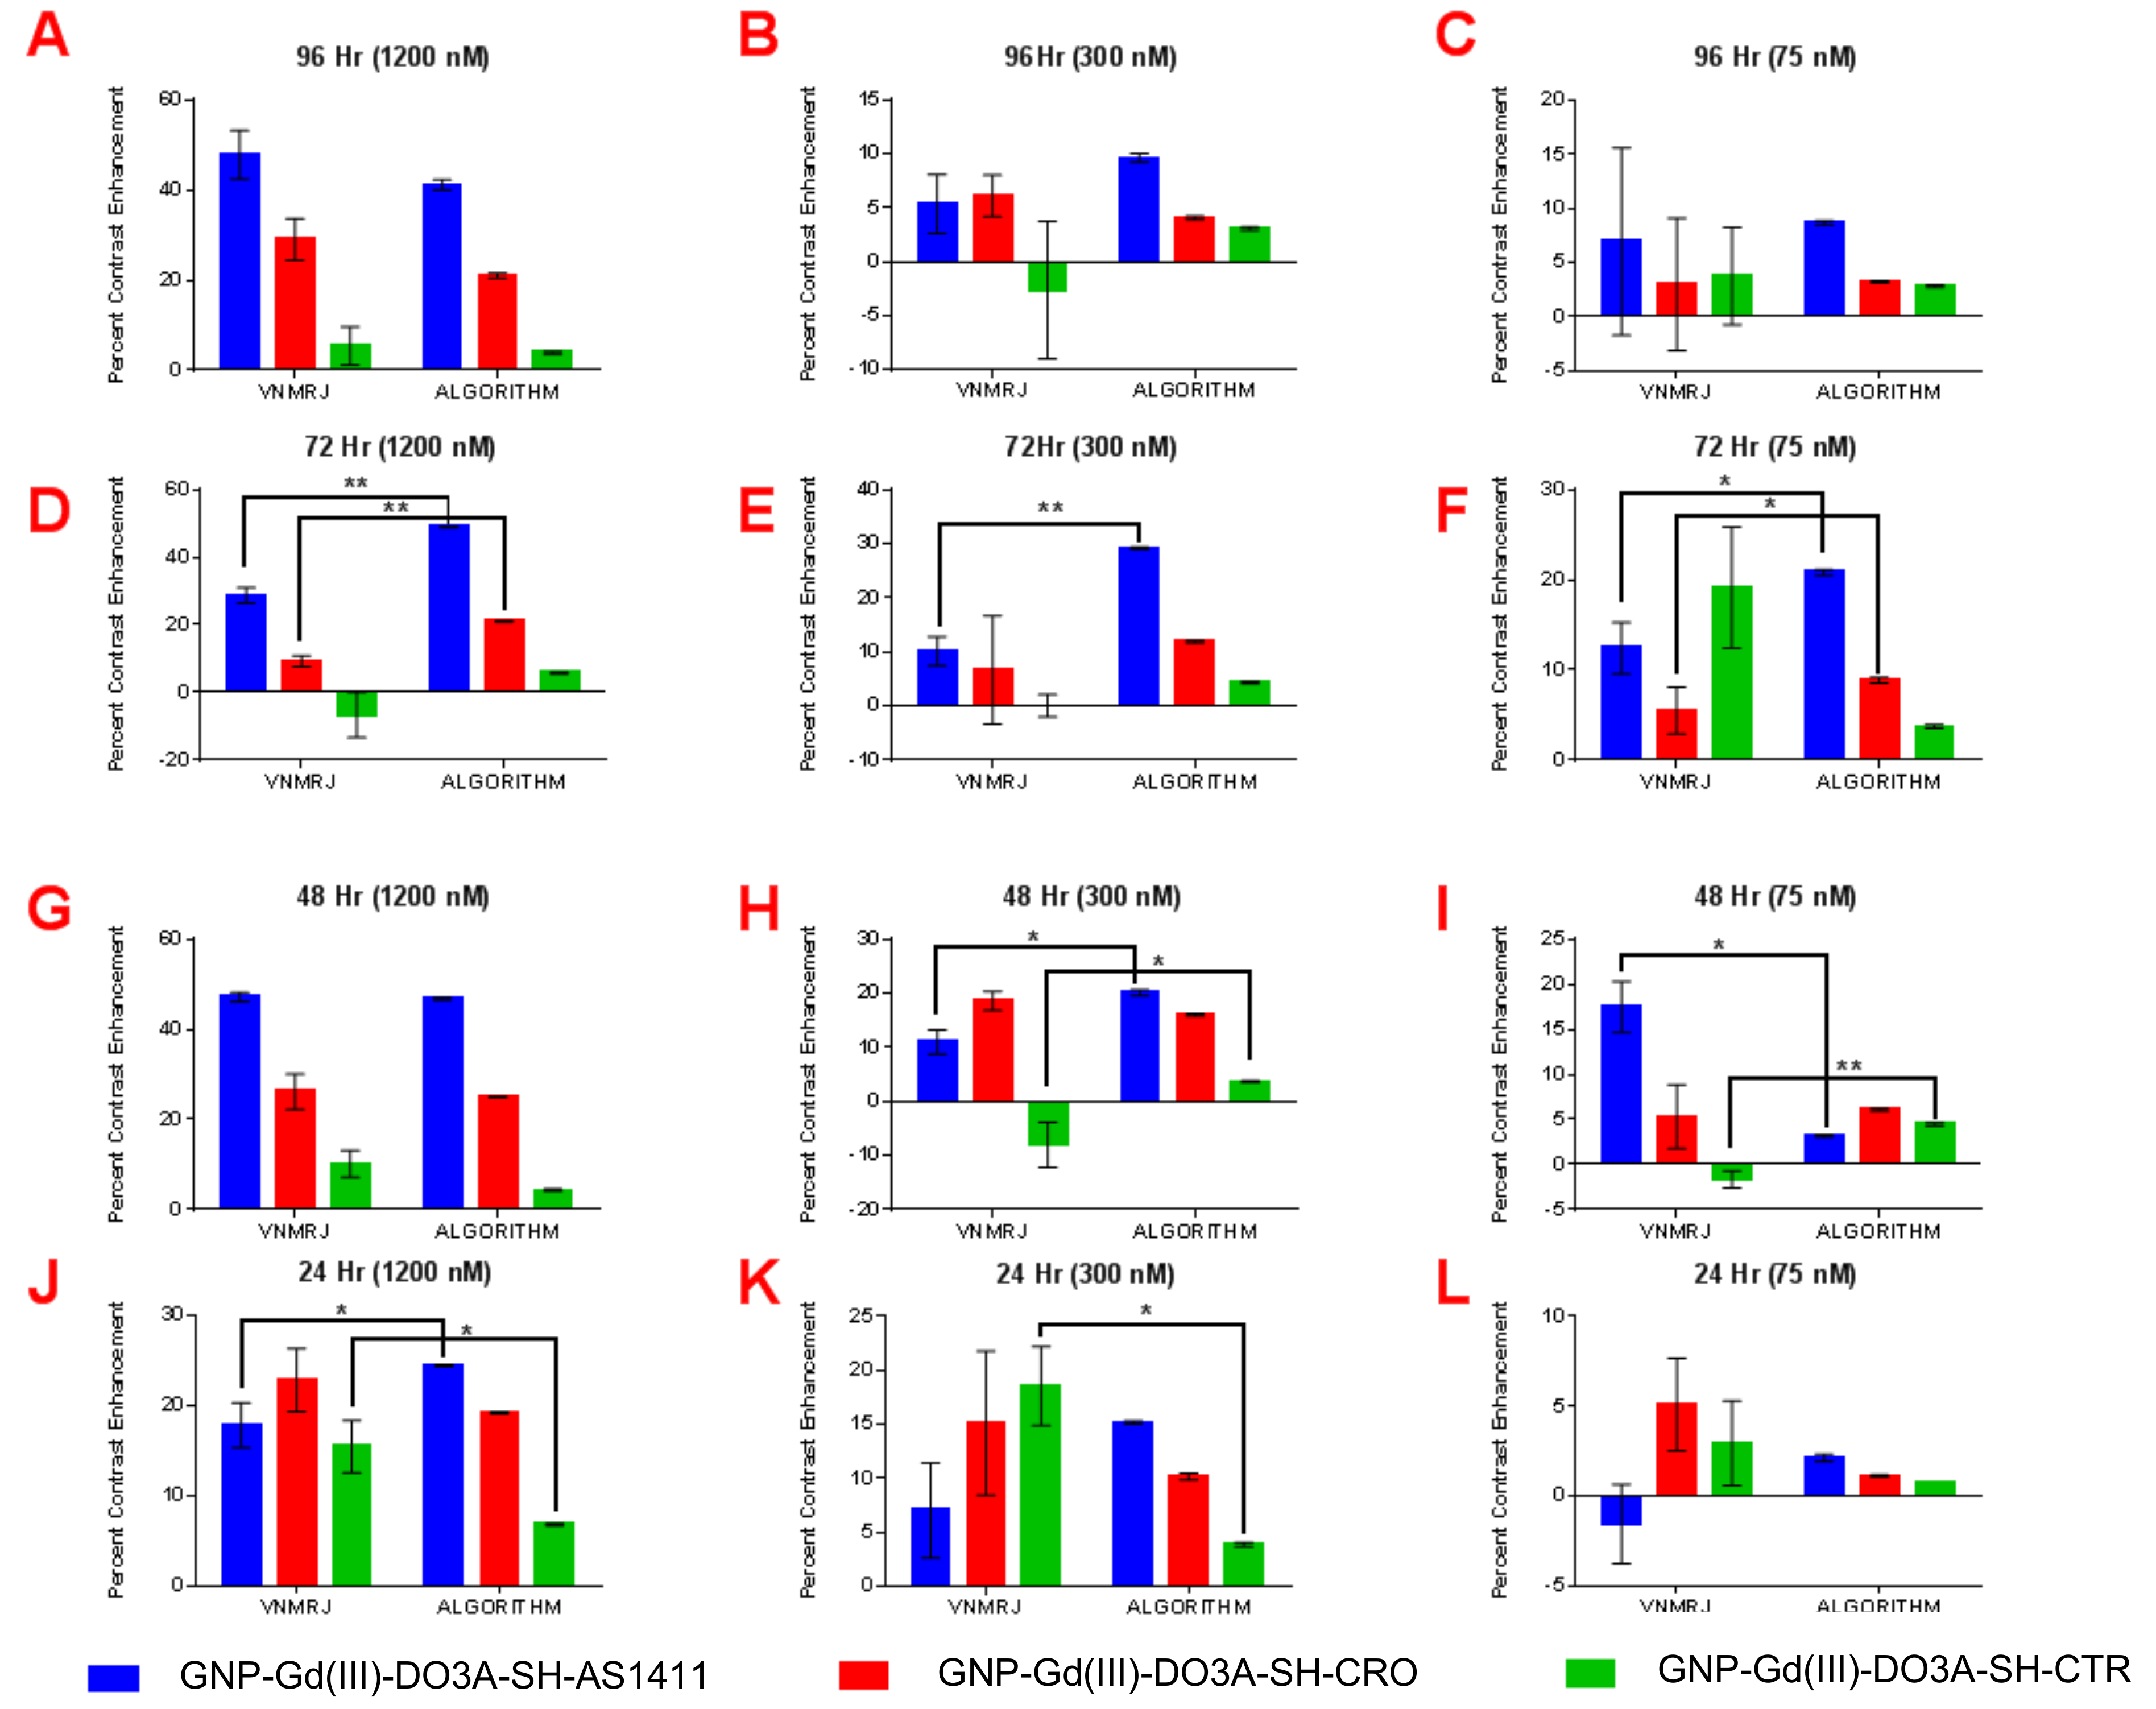
| MDA-MB-231 (1200 nM) | 31.2 | 23.2 | 8.6 | 13.9 | 35.7 | 26.9 | 15.9 | 11.7 | 35.5 | 29 | 17.1 | 11.7 | 16.5 | 21.2 | 6.9 | 17.6 |
| MDA-MB-231 (300 nM) | 15.4 | 10.0 | 3.3 | 9.3 | 24.9 | 22.5 | 13.3 | 16.1 | 14.4 | 26.9 | 13.6 | 18.3 | 3.1 | 11.3 | 10.2 | 26.4 |
| MDA-MB-231 (75 nM) | 0.83 | 4.7 | 1.3 | 3.4 | 16.4 | 15.4 | 18.7 | 10.4 | 7.8 | 16.9 | 6.7 | 11.8 | 0.1 | 0.0 | 0.0 | 15.0 |
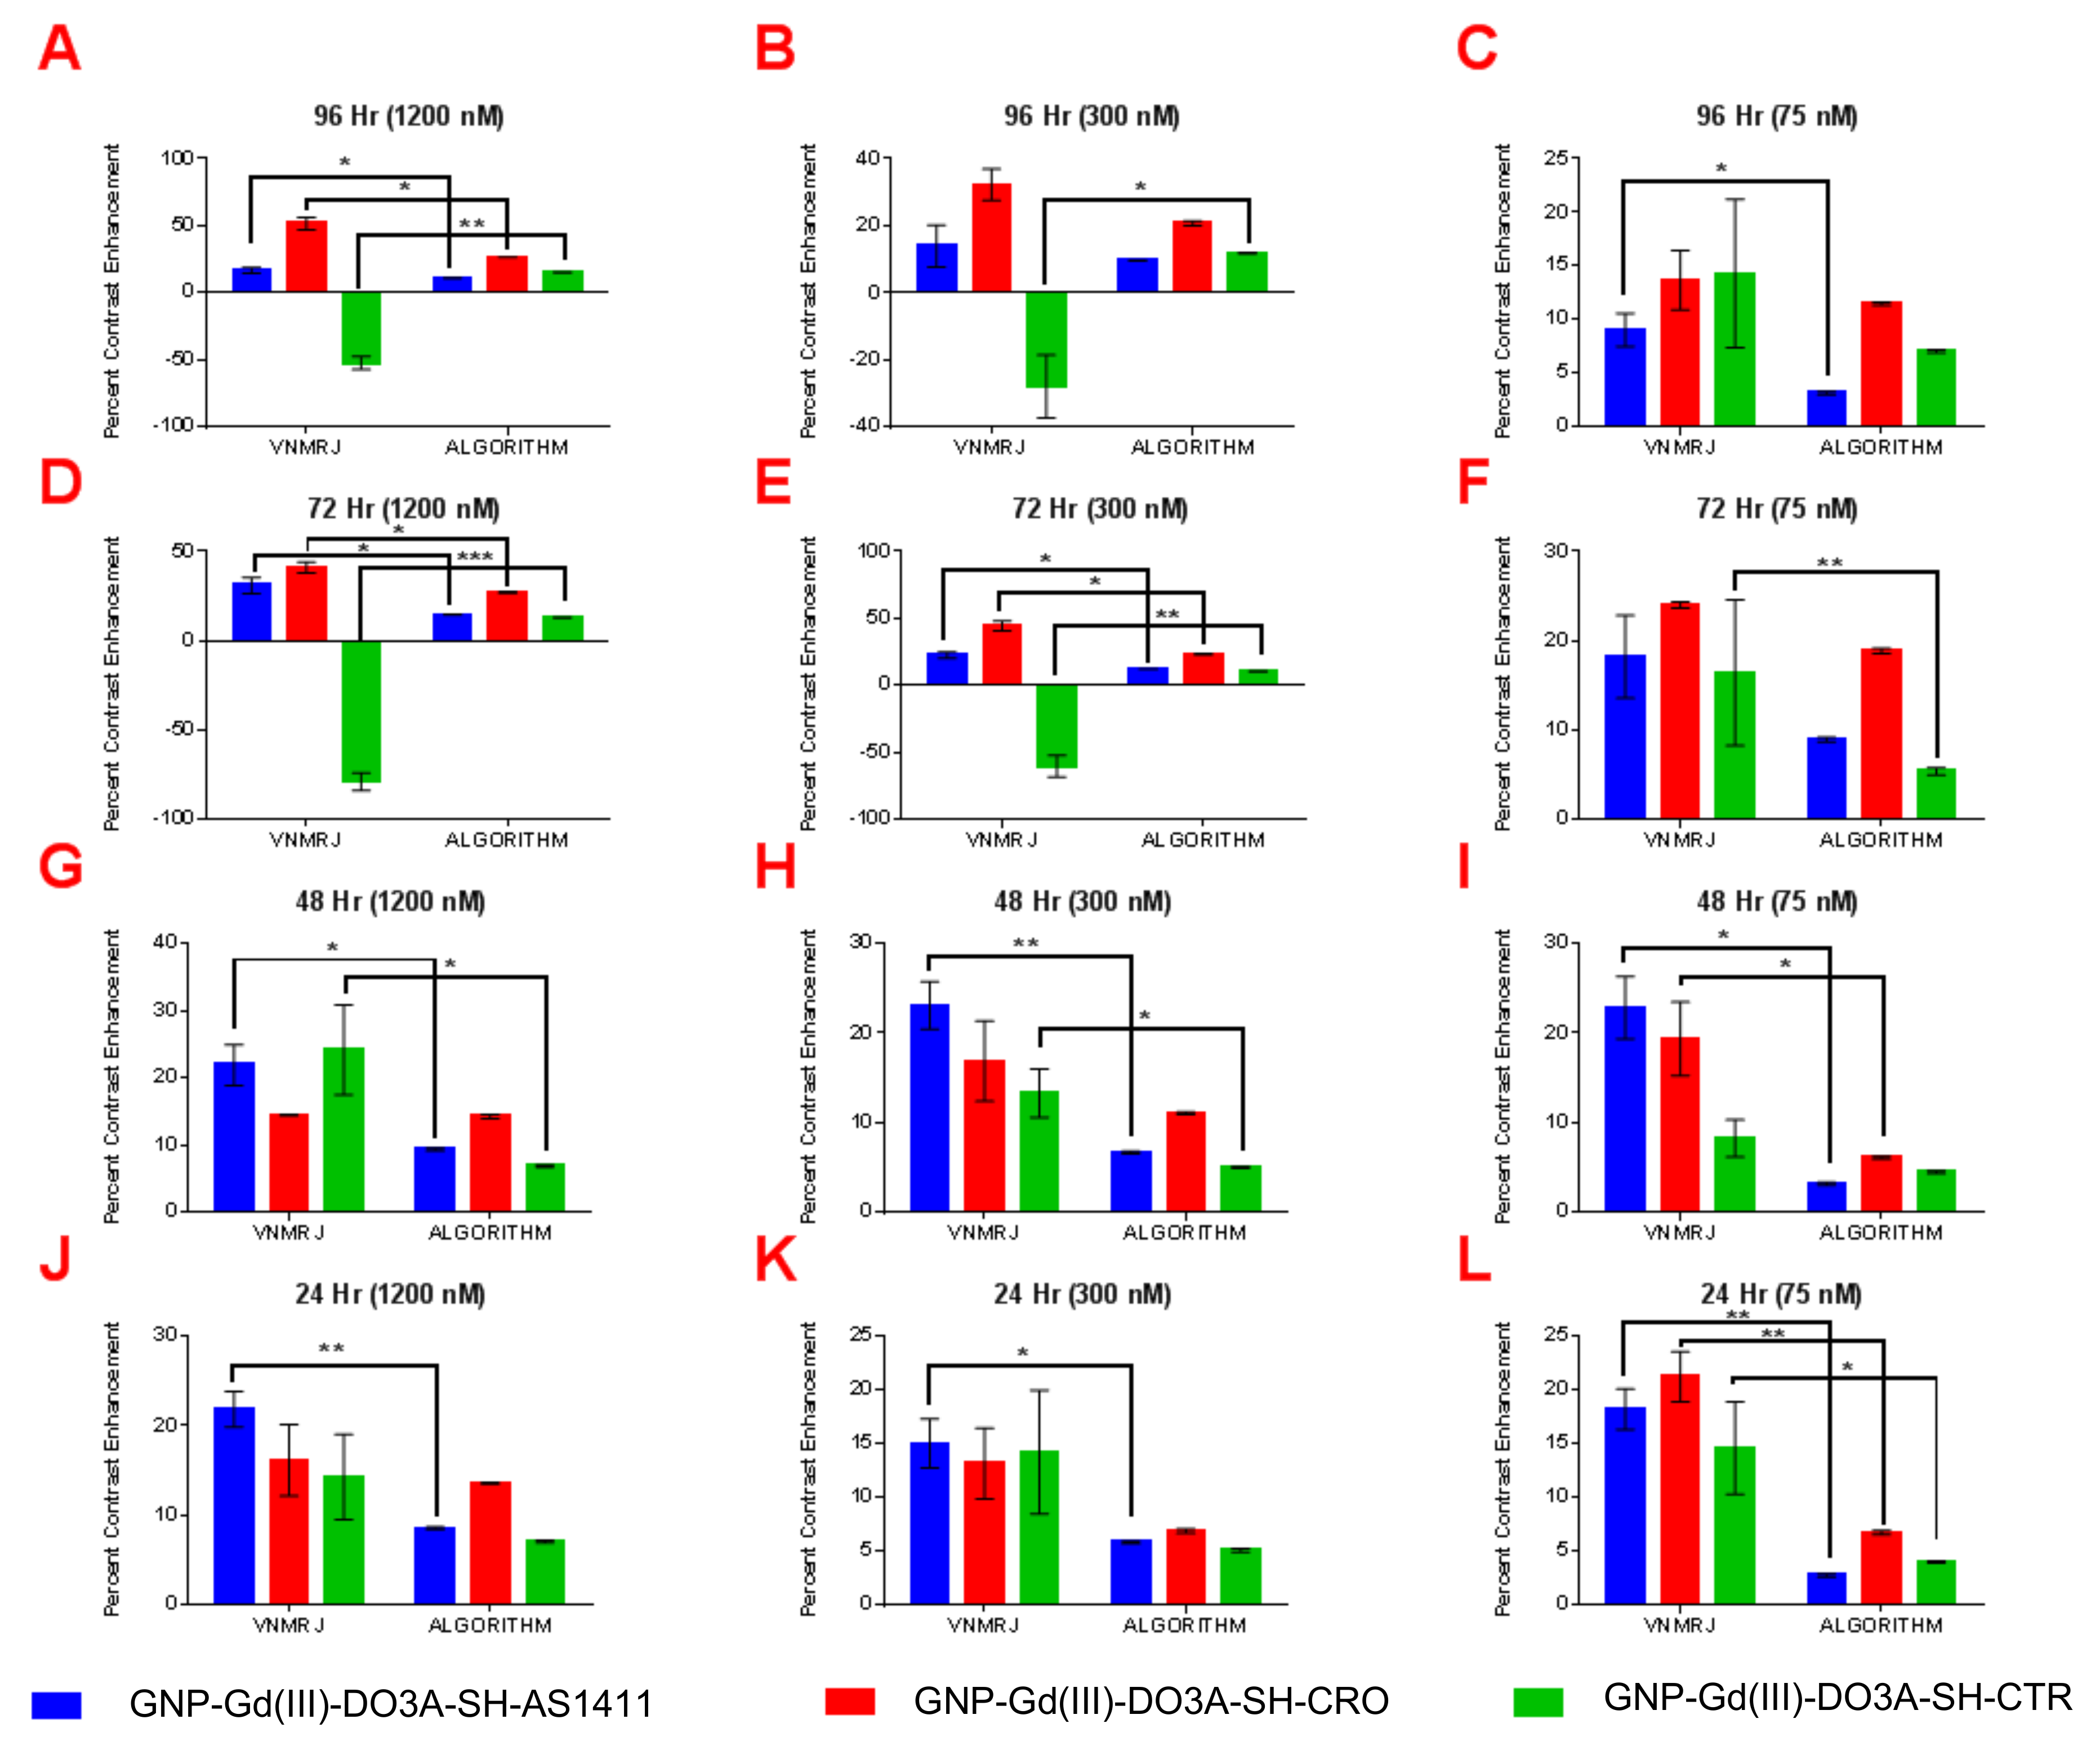
| MCF-10A (1200 nM) | 23.4 | 72.8 | 15.4 | 37.8 | 68.5 | 38.0 | 15.2 | 16.6 | 18.8 | 15.1 | 16.1 | 20.4 | ||||
| MCF-10A (300 nM) | 21.5 | 39.9 | 11.9 | 30.8 | 53.4 | 27.6 | 20.1 | 22.0 | 17.5 | 12.8 | 16.4 | 19.6 | ||||
| MCF-10A (75 nM) | 7.3 | 11.5 | 7.0 | 20.7 | 20.4 | 23.5 | 12.3 | 15.4 | 8.3 | 7.2 | 10.9 | 15.6 | ||||
| T1-Weighted Contrast Enhancement (VNMRJ: Region of Interest (ROI) Analysis) | ||||||||||||||||
|---|---|---|---|---|---|---|---|---|---|---|---|---|---|---|---|---|
| Time (Hours) | 96 | 72 | 48 | 24 | ||||||||||||
| Cell Lines (type) with GNP Concentration (nM) | * GNP-Gd(III)-DO3A-SH- Oligonucleotide | ** M | * GNP-Gd(III)-DO3A-SH- Oligonucleotide | ** M | * GNP-Gd(III)-DO3A-SH- Oligonucleotide | ** M | * GNP-Gd(III)-DO3A-SH- Oligonucleotide | ** M | ||||||||
| A | B | C | A | B | C | A | B | C | A | B | C | |||||
| MDA-MB-231 (1200 nM) | 51.2 ± 6.1 | 27.4 ± 4.0 | 6.3 ± 3.5 | 4.7 ± 6.7 | 30.1 ± 2.5 | 11.4 ± 3.6 | −4.9 ± 6.7 | 12.7 ± 4.8 | 46.8 ± 1.7 | 27.8 ± 4.6 | 8.3 ± 4.4 | 5.1 ± 10.9 | 20.2 ± 5.1 | 25 ± 4.56 | 13.0 ± 4.2 | 9.9 ± 4.6 |
| MDA-MB-231 (300 nM) | 7.6 ± 3.6 | 4.1 ± 7.6 | −1.3 ± 5.9 | 8.1 ± 3.5 | 6.9 ± 4.9 | 6.9 ± 7.2 | 1.7 ± 3.3 | 16.4 ± 2.8 | 6.9 ± 5.9 | 21.0 ± 3.5 | −7.6 ± 3.0 | 4.6 ± 4.6 | 7.0 ± 3.2 | 15.1 ± 4.7 | 18.9 ± 4.6 | 10.2 ±6.4 |
| MDA-MB-231 (75 nM) | 6.9 ± 8.7 | 3.0 ± 6.1 | 3.7 ± 4.5 | 7.3 ± 6.1 | 10.4 ± 3.5 | 6.1 ± 4.9 | 20.7 ± 5.7 | 5.9 ± 1.8 | 8.9 ± 12.4 | 6.3 ± 3.2 | −2.0 ± 2.7 | 8.4 ± 5.4 | −2.2 ± 1.9 | 4.7 ± 1.9 | 0.3 ± 5.9 | 2.0 ± 4.4 |
| MCF-10A (1200 nM) | 21.3 ± 2.3 | 16.0 ± 4.8 | 16.0 ± 4.2 | 31.2 ± 4.2 | 41.7 ± 2.4 | −83.33 ± 7.2 | 22.6 ± 3.8 | 17.6 ± 4.5 | 23.2 ± 9.3 | 19.4 ± 7.2 | 50.9 ± 3.5 | −48.6 ± 6.2 | ||||
| MCF-10A (300 nM) | 13.7 ± 3.2 | 13.5 ± 2.4 | 15.7 ± 4.6 | 19.8 ± 4.9 | 46.8 ± 4.5 | −59.1 ± 6.9 | 24.8 ± 3.2 | 18.8 ± 4.2 | 12.2 ± 4.5 | 15.7 ± 5.2 | 31.5 ± 5.8 | −29.4 ± 7.2 | ||||
| MCF-10A (75 nM) | 18.2 ± 2.6 | 22.2 ± 2.2 | 18.0 ± 5.8 | 13.8 ± 6.9 | 24.3 ± 1.4 | 10.8 ± 9.9 | 22.8 ± 3.5 | 19.6 ± 3.1 | 6.9 ± 2.7 | 8.6 ± 1.2 | 13.0 ± 2.3 | 12.8 ± 5.9 | ||||
| T1-Weighted Contrast Enhancement (Algorithm) | ||||||||||||||||
|---|---|---|---|---|---|---|---|---|---|---|---|---|---|---|---|---|
| Time (Hours) | 96 | 72 | 48 | 24 | ||||||||||||
| Cell Lines (type) with GNP Concentration (nM) | * GNP-Gd(III)-DO3A-SH- Oligonucleotide | ** M | * GNP-Gd(III)-DO3A-SH- Oligonucleotide | ** M | * GNP-Gd(III)-DO3A-SH- Oligonucleotide | ** M | * GNP-Gd(III)-DO3A-SH- Oligonucleotide | ** M | ||||||||
| A | B | C | A | B | C | A | B | C | A | B | C | |||||
| MDA-MB-231 (1200 nM) | 41.2 | 21.1 | 3.9 | 4.3 | 49.1 | 21.0 | 5.7 | 6.7 | 46.8 | 25.0 | 4.3 | 6.9 | 24.4 | 19.2 | 6.8 | 7.3 |
| MDA-MB-231 (300 nM) | 9.6 | 4.1 | 3.1 | 2.9 | 29.2 | 11.9 | 4.3 | 5.1 | 20.1 | 16.0 | 3.7 | 5.8 | 15.2 | 10.2 | 3.9 | 6.1 |
| MDA-MB-231 (75 nM) | 8.7 | 3.2 | 2.8 | 0.8 | 20.8 | 8.8 | 3.7 | 1.6 | 9.0 | 8.0 | 3.4 | 4.9 | 2.1 | 1.1 | 0.7 | 5.4 |
| MCF-10A (1200 nM) | 11.0 | 26.4 | 15.1 | 14.5 | 26.9 | 12.9 | 9.3 | 14.3 | 6.9 | 8.5 | 13.6 | 7.0 | ||||
| MCF-10A (300 nM) | 9.6 | 20.7 | 11.9 | 12.1 | 23.3 | 10.3 | 6.7 | 11.1 | 5.0 | 5.8 | 6.9 | 5.1 | ||||
| MCF-10A (75 nM) | 11.5 | 7.0 | 8.9 | 18.8 | 5.4 | 3.2 | 6.1 | 4.5 | 2.7 | 6.7 | 4.1 | |||||
| Samples | Relaxivity (mM−1s−1) at 9.4 T |
|---|---|
| GNP-(Gd(III)-DO3-SH)-AS1411 | 24.83 |
| GNP-(Gd(III)-DO3A-SH)-CRO | 15.67 |
| GNP-(Gd(III)-DO3A-SH)-CTR | 8.38 |
| GNP-(Gd(III)-DO3A-SH) | 5.56 |
| Gd(III)-DO3A-SH | 2.29 |
| Multihance (gadobenate dimeglumine) | 3.75 |
© 2019 by the authors. Licensee MDPI, Basel, Switzerland. This article is an open access article distributed under the terms and conditions of the Creative Commons Attribution (CC BY) license (http://creativecommons.org/licenses/by/4.0/).
Share and Cite
Chauhan, R.; El-Baz, N.; Keynton, R.S.; James, K.T.; Malik, D.A.; Zhu, M.; El-Baz, A.; Ng, C.K.; Bates, P.J.; Malik, M.T.; et al. Targeted Gold Nanoparticle–Oligonucleotide Contrast Agents in Combination with a New Local Voxel-Wise MRI Analysis Algorithm for In Vitro Imaging of Triple-Negative Breast Cancer. Nanomaterials 2019, 9, 709. https://doi.org/10.3390/nano9050709
Chauhan R, El-Baz N, Keynton RS, James KT, Malik DA, Zhu M, El-Baz A, Ng CK, Bates PJ, Malik MT, et al. Targeted Gold Nanoparticle–Oligonucleotide Contrast Agents in Combination with a New Local Voxel-Wise MRI Analysis Algorithm for In Vitro Imaging of Triple-Negative Breast Cancer. Nanomaterials. 2019; 9(5):709. https://doi.org/10.3390/nano9050709
Chicago/Turabian StyleChauhan, Rajat, Nagwa El-Baz, Robert S. Keynton, Kurtis T. James, Danial A. Malik, Mingming Zhu, Ayman El-Baz, Chin K. Ng, Paula J. Bates, Mohammad Tariq Malik, and et al. 2019. "Targeted Gold Nanoparticle–Oligonucleotide Contrast Agents in Combination with a New Local Voxel-Wise MRI Analysis Algorithm for In Vitro Imaging of Triple-Negative Breast Cancer" Nanomaterials 9, no. 5: 709. https://doi.org/10.3390/nano9050709
APA StyleChauhan, R., El-Baz, N., Keynton, R. S., James, K. T., Malik, D. A., Zhu, M., El-Baz, A., Ng, C. K., Bates, P. J., Malik, M. T., & O’Toole, M. G. (2019). Targeted Gold Nanoparticle–Oligonucleotide Contrast Agents in Combination with a New Local Voxel-Wise MRI Analysis Algorithm for In Vitro Imaging of Triple-Negative Breast Cancer. Nanomaterials, 9(5), 709. https://doi.org/10.3390/nano9050709