Article

Spectroscopic Study of the Salicyladazine Derivative–UO22+ Complex and Its Immobilization to Mesoporous Silica

1
Department of Chemistry and Research Institute of Natural Sciences, Gyeongsang National University, Jinju 52828, Korea
2
Department of Chemistry and Biochemistry, The University of Kitakyushu, Hibikino, Kitakyushu 808-0135, Japan
*
Authors to whom correspondence should be addressed.
Nanomaterials 2019, 9(5), 688; https://doi.org/10.3390/nano9050688
Submission received: 2 April 2019 / Revised: 19 April 2019 / Accepted: 26 April 2019 / Published: 2 May 2019
(This article belongs to the Special Issue Nanotechnology for Environmental and Biomedical Research)

Abstract

:
Uranyl ion, the most soluble toxic uranium species, is recognized as an important index for monitoring nuclear wastewater quality. The United States Environmental Protection Agency (US EPA) and the World Health Organization (WHO) prescribed 30 ppb as the allowable concentration of uranyl ion in drinking water. This paper reports on a nanohybrid material that can detect uranyl ions spectroscopically and act as a uranyl ion absorbent in an aqueous system. Compound 1, possessing a salicyladazine core and four acetic acid groups, was synthesized and the spectroscopic properties of its UO22+ complex were studied. Compound 1 had a strong blue emission when irradiated with UV light in the absence of UO22+ that was quenched in the presence of UO22+. According to the Job’s plot, Compound 1 formed a 1:2 complex with UO22+. When immobilized onto mesoporous silica, a small dose (0.3 wt %) of this hybrid material could remove 96% of UO22+ from 1 mL of a 100-ppb UO22+ aqueous solution.

Graphical Abstract

1. Introduction

The development of nuclear technology leads to new environmental concerns, such as radiation exposure and accidents resulting therefrom. Of special concern is the uranyl cation (UO22+), a highly toxic neurotoxin that is very mutable in biological systems and can cause radioactive poisoning if proper containment rules are violated [1,2,3,4]. Therefore, the development of technologies that can measure the exact amount of UO22+ exposed to the environment is an important safety priority.
Several studies on UO22+ sensors have been reported to date [5,6,7,8,9,10]. L. S. Natrajan et al. reported a method for detecting UO22+ via a unique fluorescence energy transfer process to a water-soluble europium (III) lanthanide complex triggered by UO22+ [11]. Yi Lu et al. developed colorimetric uranium sensors based on a UO22+-specific DNAzyme and gold nanoparticles using both labeled and label-free methods [12]. Julius Rebek Jr. et al. investigated a tripodal receptor capable of extracting uranyl ion from aqueous solutions. In their system, at a uranyl concentration of 400 ppm, the developed ligand extracted approximately 59% of the UO22+ into the organic phase [13].
While various detection methods for UO22+ have been developed based on fluorogenic and colorimetric methods, studies on UO22+ adsorbents have received much less attention. We aim to synthesize an adsorbent, or uranyl-capture agent based on an organic–inorganic hybrid material because such compounds tend to have higher stability and controllable homogenous pore sizes. Therefore, we designed and synthesized compound 1 (Figure 1). Compound 1 possesses four acetic acid groups as ligands for UO22+. The spectroscopic properties of compound 1 were observed upon adding UO22+ via fluorometry, IR spectroscopy, and 1H NMR spectroscopy. Furthermore, compound 1 was immobilized to MPS (mesoporous silica nanoparticles) to create an adsorbent for UO22+. Herein, we report the spectroscopic properties of the compound 1–UO22+ complex and the adsorption capacity of mesoporous silica nanoparticles loaded with compound 1 for UO22+ capture.

2. Materials and Methods

2.1. Reagents and Instruments

All reagents were purchased from Sigma-Aldrich (Buchs, Switzerland) and Tokyo chemical industry (Fukaya, Japan). The solvent was purchased from Samchun Pure Chemicals (Pyeongkaek, Korea) and used with further purification. 1H and 13C NMR spectra were obtained with a Bruker DRX 300 apparatus (Rheinstetten, Germany). The IR spectra were measured on a Shimadzu FT-IR 8400S instrument (Kyoto, Japan) by KBr pellet method in the range of 4000−1000 cm−1. A JEOL JMS-700 mass spectrometer (Kyoto, Japan) was used to obtain the mass spectra. The UV−vis absorption and fluorescence spectra were obtained at 298 K with a Thermo Evolution 600 spectrophotometer (Waltham, MA, USA) and a RF-5301PC spectrophotometer (Kyoto, Japan), respectively. A PerkinElmer 2400 series (Waltham, MA, USA) was employed for the elemental analyses. The quantitative analysis was performed using ICP-DRC-MS (ELAN DRC II, PerkinElmer, Waltham, MA, USA). The morphological images were observed using a TEM (TECNAI G2 F30, FEI, Hillsboro, OR, USA).

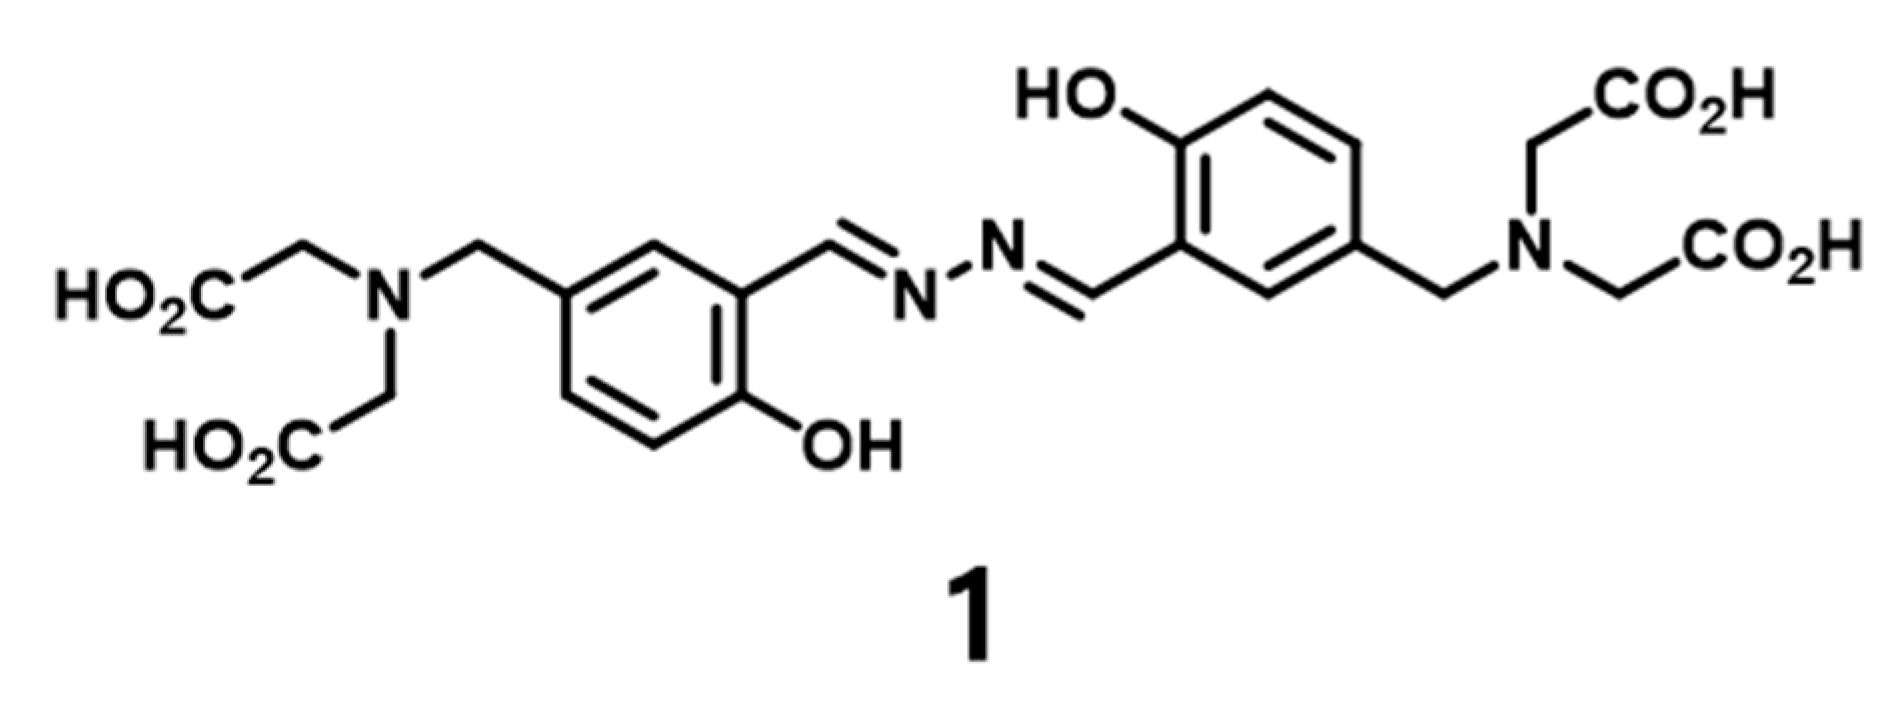
2.2. Synthesis of Compound 1

The compounds 14 were synthesized according to the reported method (Scheme S1) [14,15]. Compound 2 (2.56 mg, 0.4 mmol) was dissolved in THF (10 mL), followed by the addition of sodium hydroxide solution (10 mL, 0.8 M). The mixture was stirred at room temperature for 2 h. After completion of the reaction, the mixture was added to aq HCl solution (1 wt %) to give yellow precipitation, which was filtered off and dried under vacuum to yield compound 1 (121 mg, 57%). IR (KBr pellet) cm−1 3424, 3014, 1728, 1495 1629, 1389, 1277, 1164; 1H NMR (300 MHz, DMSO-d6) δ 12.25 (s, 4H), 11.07 (s, 2H), 8.98 (s, 2H), 7.63 (d, J = 2.2 Hz, 2H), 7.40 (dd, J = 8.5, 2.2 Hz, 2H), 6.96 (d, J = 8.4 Hz, 2H), 3.78 (s, 4H), 3.42 (s, 8H); 13C NMR (75 MHz, DMSO-d6) δ 172.74, 162.82, 158.30, 134.37, 131.08, 130.12, 118.33, 116.99, 56.80, 53.96.; ESI-MS: calculated for C24H26N4O10, [M − H] 529.16; found, 529.15; Anal. calcd for C24H26N4O10: C, 54.34; H, 4.94; N, 10.56; found: C 54.31, H 4.97, N 10.51.

2.3. Preparation of MPS

The MPS was synthesized according to the reported method [16]. 8.2 g of (1-Hexadecyl) trimethyl-ammonium bromide was dissolved in H2O (600 mL). After stirring for 10 min, 1.6 mL of triethanolamine was added and the reaction mixture was heated. When the reaction temperature reached 80 °C, TEOS (tetra ethyl ortho silicate) (60 mL) was added and stirred for 1 h. The solvent of the reaction was removed by rotary evaporator and the resulting solid (including some water) was heated at 500 °C for 5 h by using a furnace.

2.4. Preparation of MPS-1

0.1 g of compound 1 and 1 g of MPS in of acetonitrile (20 mL) were stirred for 10 min. The reaction mixture was refluxed at 80 °C for 24 h. After the reaction mixture was cooled to room temperature, the solid product was filtered and washed with 200 mL acetonitrile.

2.5. Photophysical Studies

The UV−vis absorption and fluorescence spectra were determined over the range 200−800 nm. The samples were prepared by dispersion in H2O solution. The concentration of standard UO22+ solution was 100 ppb.

2.6. NMR Measurement

Compound 1 (2.65 mg, 0.005 mmol) and uranyl acetate (8.48 mg, 0.02 mmol) were dissolved in 0.5 mL and 0.1 mL of of DMSO-d6 (0.5 mL) in DMSO-d6 (0.1 mL), respectively. To NMR titration, the different amount of the uranyl acetate solution (12.5 μL, 25 μL, 37.5 μL, 50 μL) was added to compound 1 of DMSO-d6 (0.5 mL).

2.7. ICP-MS

MPS-1 (1 mg, 3 mg, and 5 mg) were dispersed in aqueous solution containing UO22+, Na+, Mg2+, Ca2+, Cu2+, Ag+, Co2+, Ni2+, Mn2+ and Pb2+ (100 ppb) for 10 min. Mixture was added to H2O (4 mL). The mixture solution was centrifuged and the supernatant solution was filtrated with syringe filter (PTFE, 0.45 μm). The collected solution was measured 3 times by ICP-MS.

3. Results and Discussion

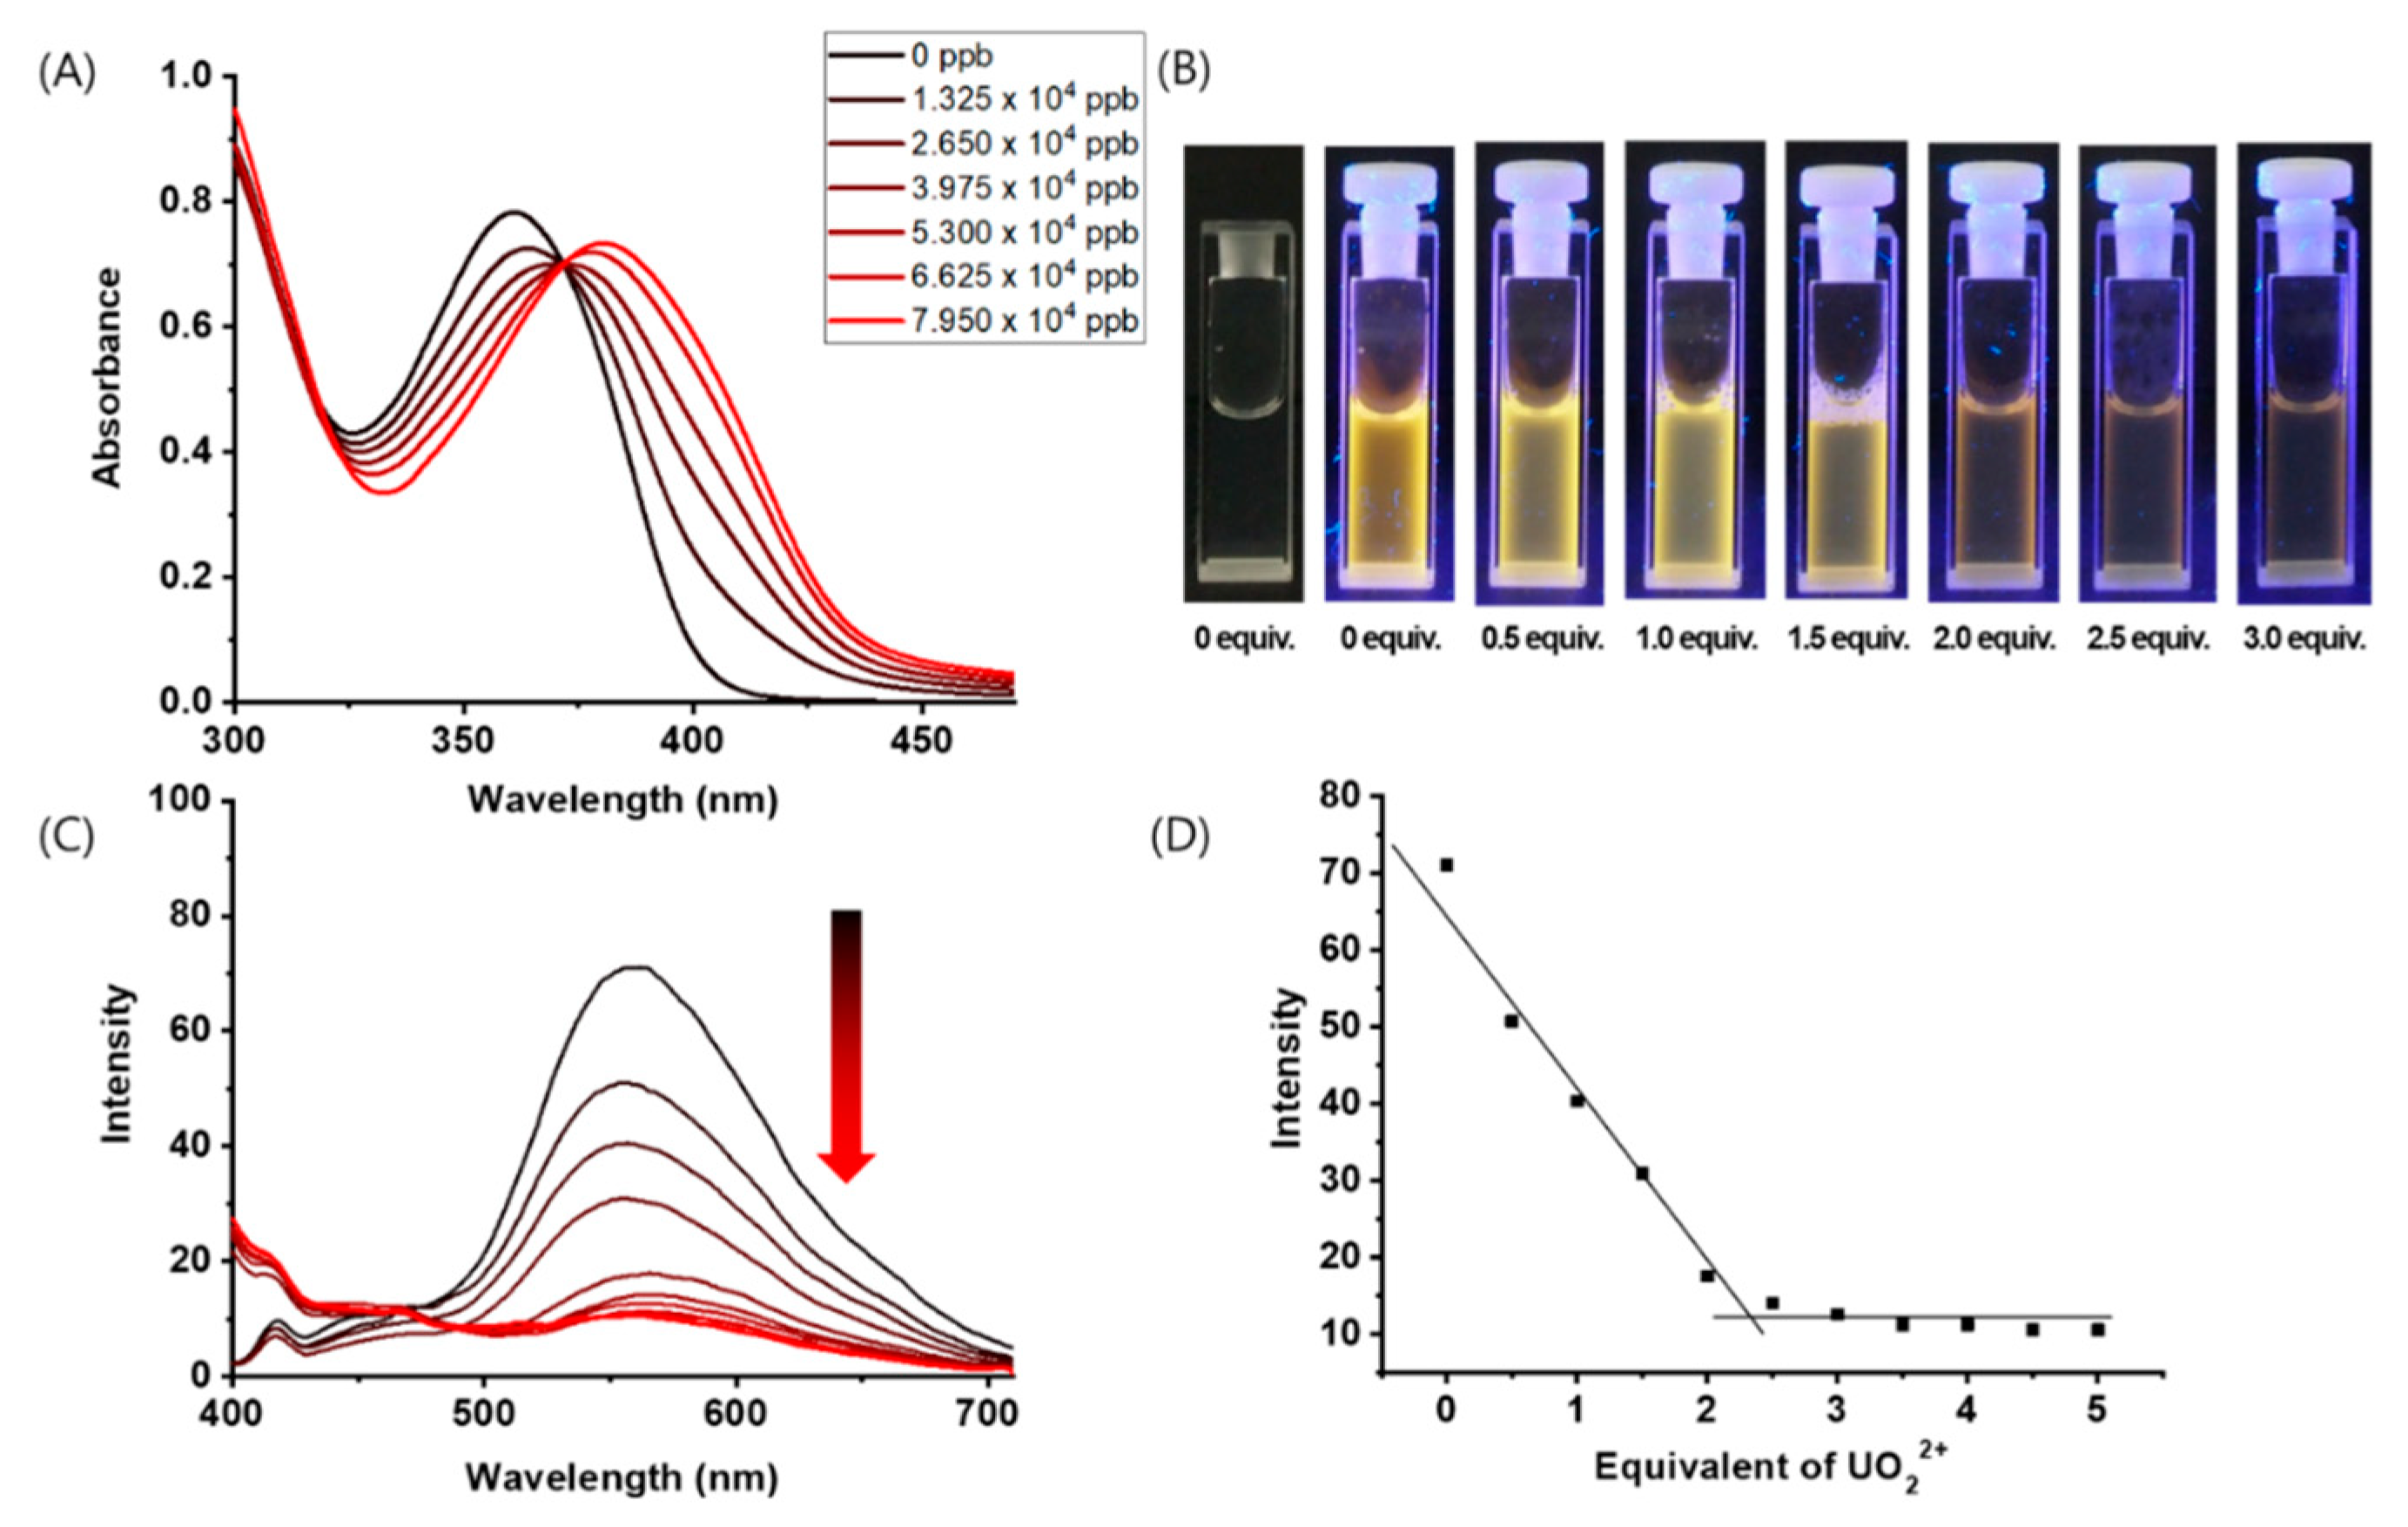
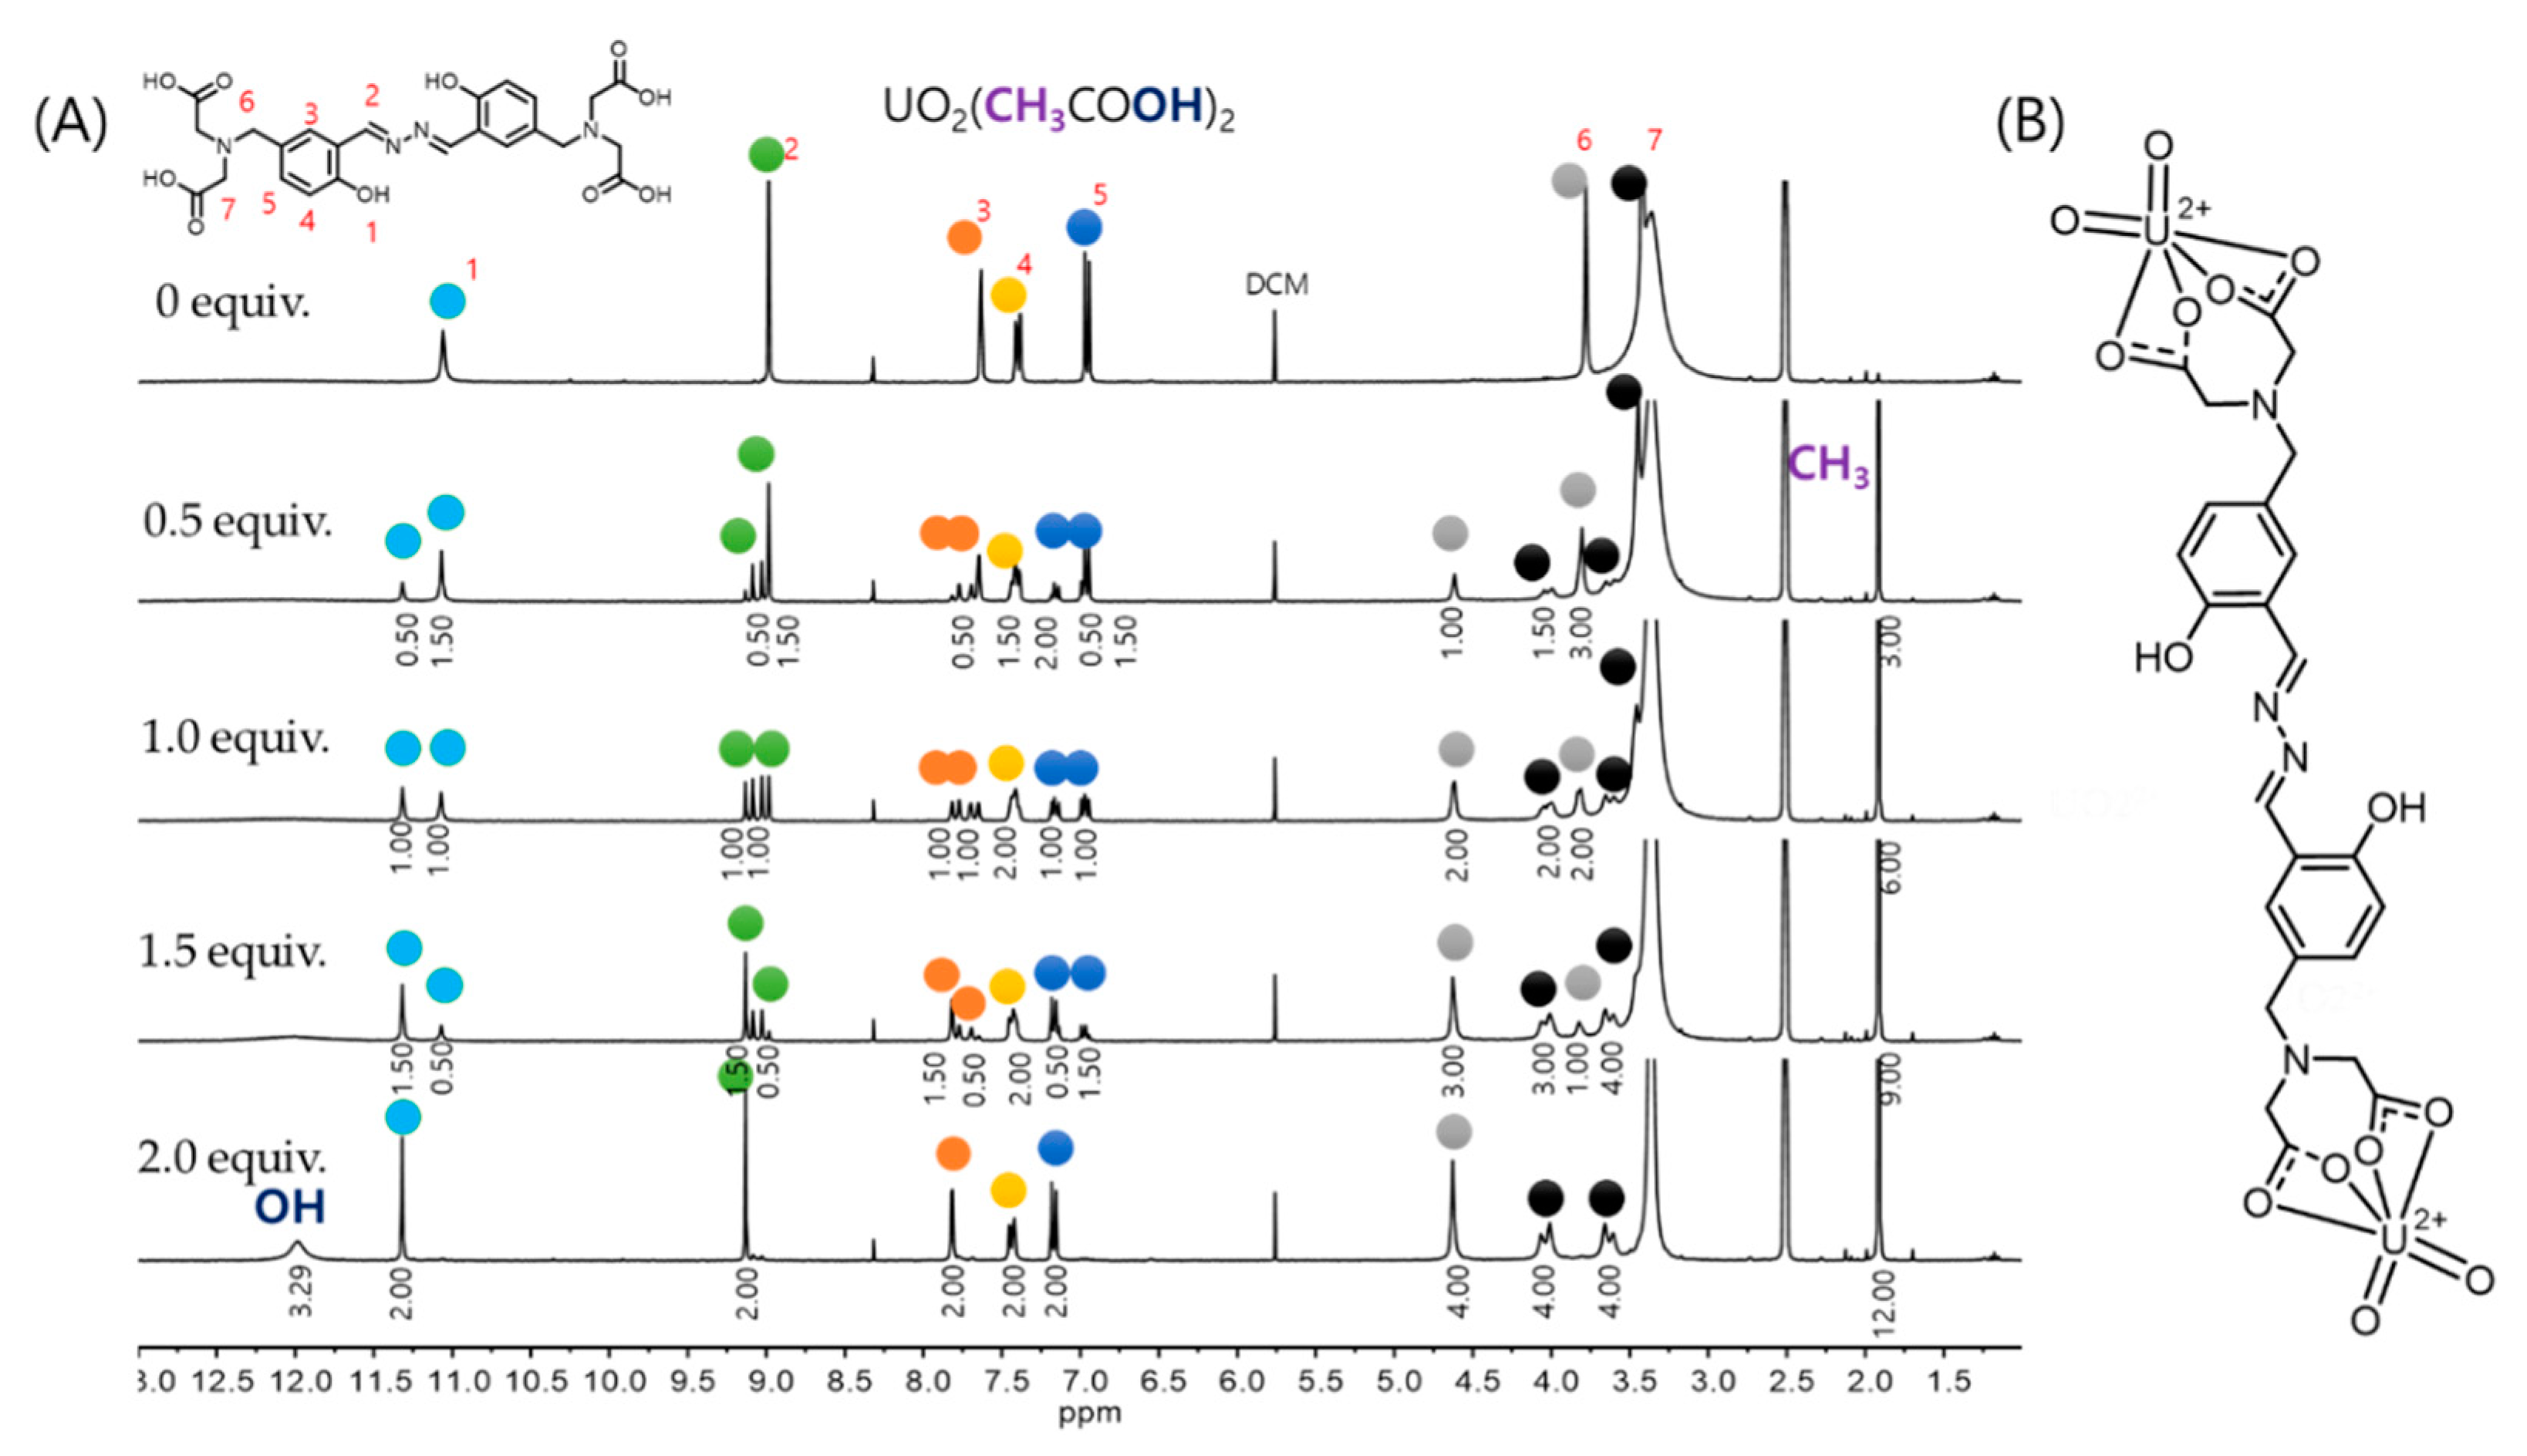
3.1. Spectroscopic Properties of Complex 1 with UO22+

Binding between UO22+ and specific ligands, such as cyclic peptides [17,18], porphyrins [19,20], and naphthobipyrrole [21,22], is well known. We prepared a salicyladazine derivative as a ligand for UO22+. The salicyladazine derivative was synthesized starting from 2-hydroxybenzaldehyde. The diethyl 2,2′-azanediyldiacetate groups were designed on both sides of the compound to create a symmetric structure. As the final step, hydrochloric acid treatment of the precursor yielded the desired compound 1. Compound 1 contains the acetic acid end group (–CH2COOH) to form the binding site for UO22+ and was characterized via FT IR, 1H and 13C NMR, mass spectrometry, and elemental analysis (Figures S1, S2 and S3 in Supplementary Materials).
UV–vis spectroscopy was performed to confirm that a coordination bond between compound 1 and UO22+ resulted in a colorimetric change. Compound 1 was dissolved in an aqueous solution containing 1% of DMSO, and the UV–vis absorption spectrum was measured (Figure 2A). Before adding UO22+, the π–π * absorption band of compound 1 appeared at around 300–350 nm. When UO22+ (from 0.5 to 3 equivalents in 0.5 equivalent steps) was added to compound 1, the absorption peak intensities at 300 and 350 nm decreased until up to 2 equivalents of UO22+ were added. At 2.5 or more equivalents of UO22+, the ligand-to-metal charge transfer absorption wavelength between compound 1 and UO22+ was observed at around 365–380 nm [23].
Figure 2B shows the photographs of the cuvettes used when UO22+ was added to compound 1 and irradiated under UV light. The change in fluorescence after more than 2 equivalents of UO22+ were added was visible to the naked eye. Compound 1 yielded an emission wavelength around 560 nm (excitation = 365 nm). When 0.5 equivalents of UO22+ were added to compound 1, the fluorescence intensity decreased. The decrease in fluorescence was noticeable from 0.5 to 2 equivalents of UO22+; however, the fluorescence intensity remained constant thereafter (Figure 2C). Figure 2D presents a plot of the fluorescence intensity vs. amount of UO22+ added. To determine the stoichiometric ratio between compound 1 and UO22+, we constructed a Job’s plot using the fluorescence data and found a 1:2 binding ratio for compound 1:UO22+ (Figure S4 ).
To investigate the chemical interactions between compound 1 and UO22+, we used nuclear magnetic resonance (NMR) spectroscopy. We measured the 1H NMR signal of compound 1 in DMSO-d6 while increasing the UO22+ content (Figure 3). When 0.5 equivalent of UO22+ was added to compound 1 in DMSO-d6, the proton peak (aromatic OH: 11.08 ppm) of compound 1 decreased and multiple new peaks were observed. When we added 1 equivalent of UO22+, the ratio of the proton peaks of compound 1 and the resulting complex was 1:1. Because compound 1 has C2 symmetry, coordination of UO22+ occurs on one side of compound 1 (bound to two acetic acid ligands) and no coordination occurs on the other side of compound 1. Upon additional UO22+ input (over 2 equivalents), all the peaks representing free compound 1 disappeared entirely. Therefore, compound 1 has a binding capacity of two UO22+ molecules in DMSO-d6 (forms a 1:2 complex). This result is consistent with the Job’s plot.
The carbonyl oxygen (C=O) of the end group of acetic acids (–CH2COOH) in compound 1 is well known to bind strongly to a radionuclide ion such as UO22+ by supplying electrons [23,24]. IR spectroscopy was used to classify the complex formation of compound 1 with UO22+. As shown in Figure S5, the oxygen of the carboxylic acid carbonyl (C=O) in compound 1 before the addition of UO22+ produced a peak at 1728 cm−1, whereas the C=O peak after the addition of UO22+ was shifted to 1557 cm−1. This shift to a lower wavenumber is indicative of the C=O in compound 1 providing electrons in a dative bond to UO22+ and confirms that the carboxylic acid groups are employed in complex formation with UO22+.

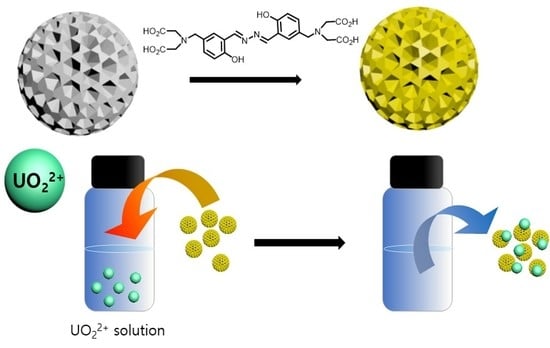
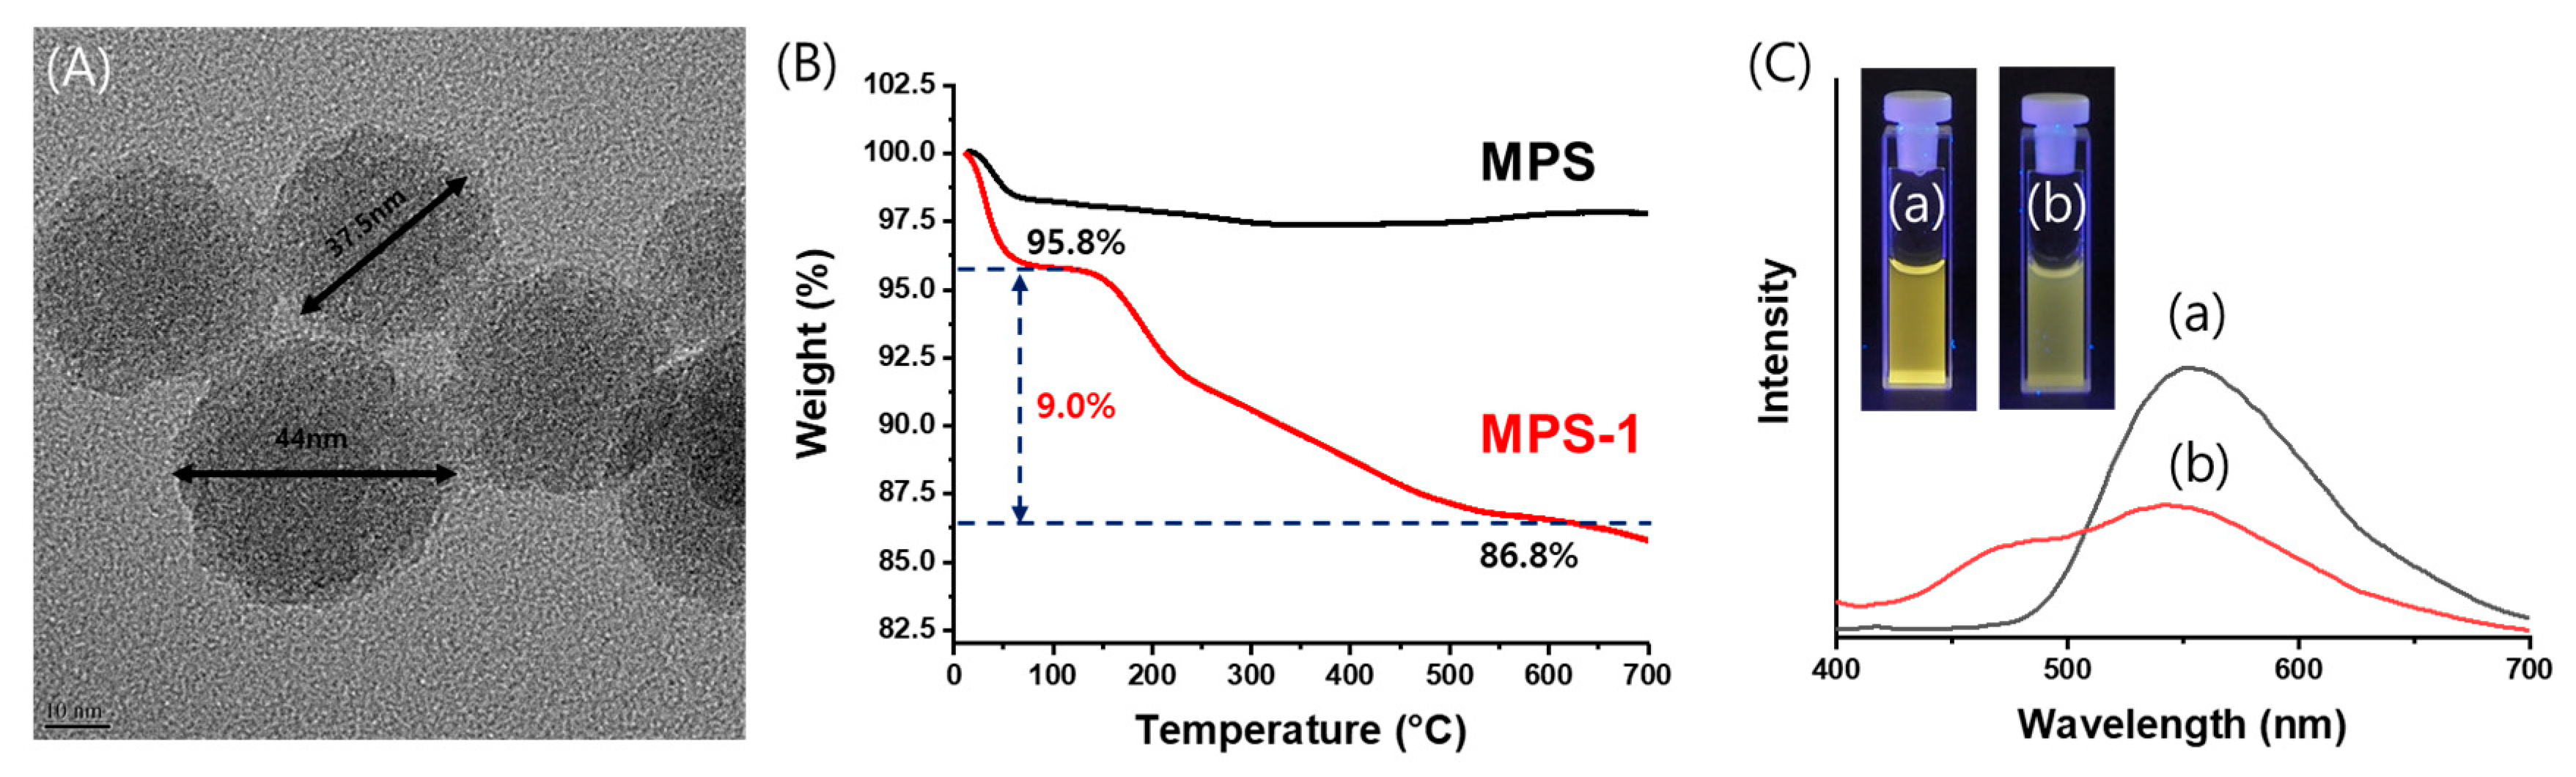
3.2. Immobilization of Compound 1 to Mesoporous Silica Nanoparticles

The morphology of mesoporous silica nanoparticle immobilized with 1 (MPS-1) was observed via transmission electron microscopy (TEM). The TEM image of MPS-1 revealed a spherical structure with a narrow size distribution (circa 40 nm) (Figure 4A). Thermogravimetry analysis (TGA) was performed to determine the amount of compound 1 immobilized onto MPS-1 (Figure 4B). At approximately 150 °C, the weight of MPS-1 decreased by 4.2%. This mass reduction was attributed to moisture. At ~500 °C, compound 1 was pyrolyzed and the weight of MPS-1 decreased to 86.8% (Figure S6). Thus, the amount of compound 1 introduced into MPS-1 was 9% by weight (Figure 4B). Figure S7 presents the IR spectra of MPS and MPS-1; a C-H vibration peak of 2940 cm−1 was confirmed. This further supported the presence of compound 1 on the surface of the mesoporous silica nanoparticles. Under UV light irradiation, the filtered silica nanoparticles fluoresced blue, indicating that compound 1 was present on the mesoporous silica nanoparticle surface. Fluorescence spectra of MPS-1 (2 mg) in water (2 mL) and MPS-1 (2 mg) in 100 ppb UO22+ solution (2 mL) were also measured. (Figure 4C). In 3.5% NaCl aqueous solution of 2mL, we measured the fluorescence spectra of MPS-1 (2 mg) and MPS-1 (2 mg) in 100 ppb UO22+ solution, respectively (Figure S8). Fluorescence changes of MPS-1 in the present of 100 ppb UO22+ in water or 3.5% NaCl aqueous solution were shown similar results. This means that MPS-1 can bind UO22+ not only in water but also NaCl aqueous solution.

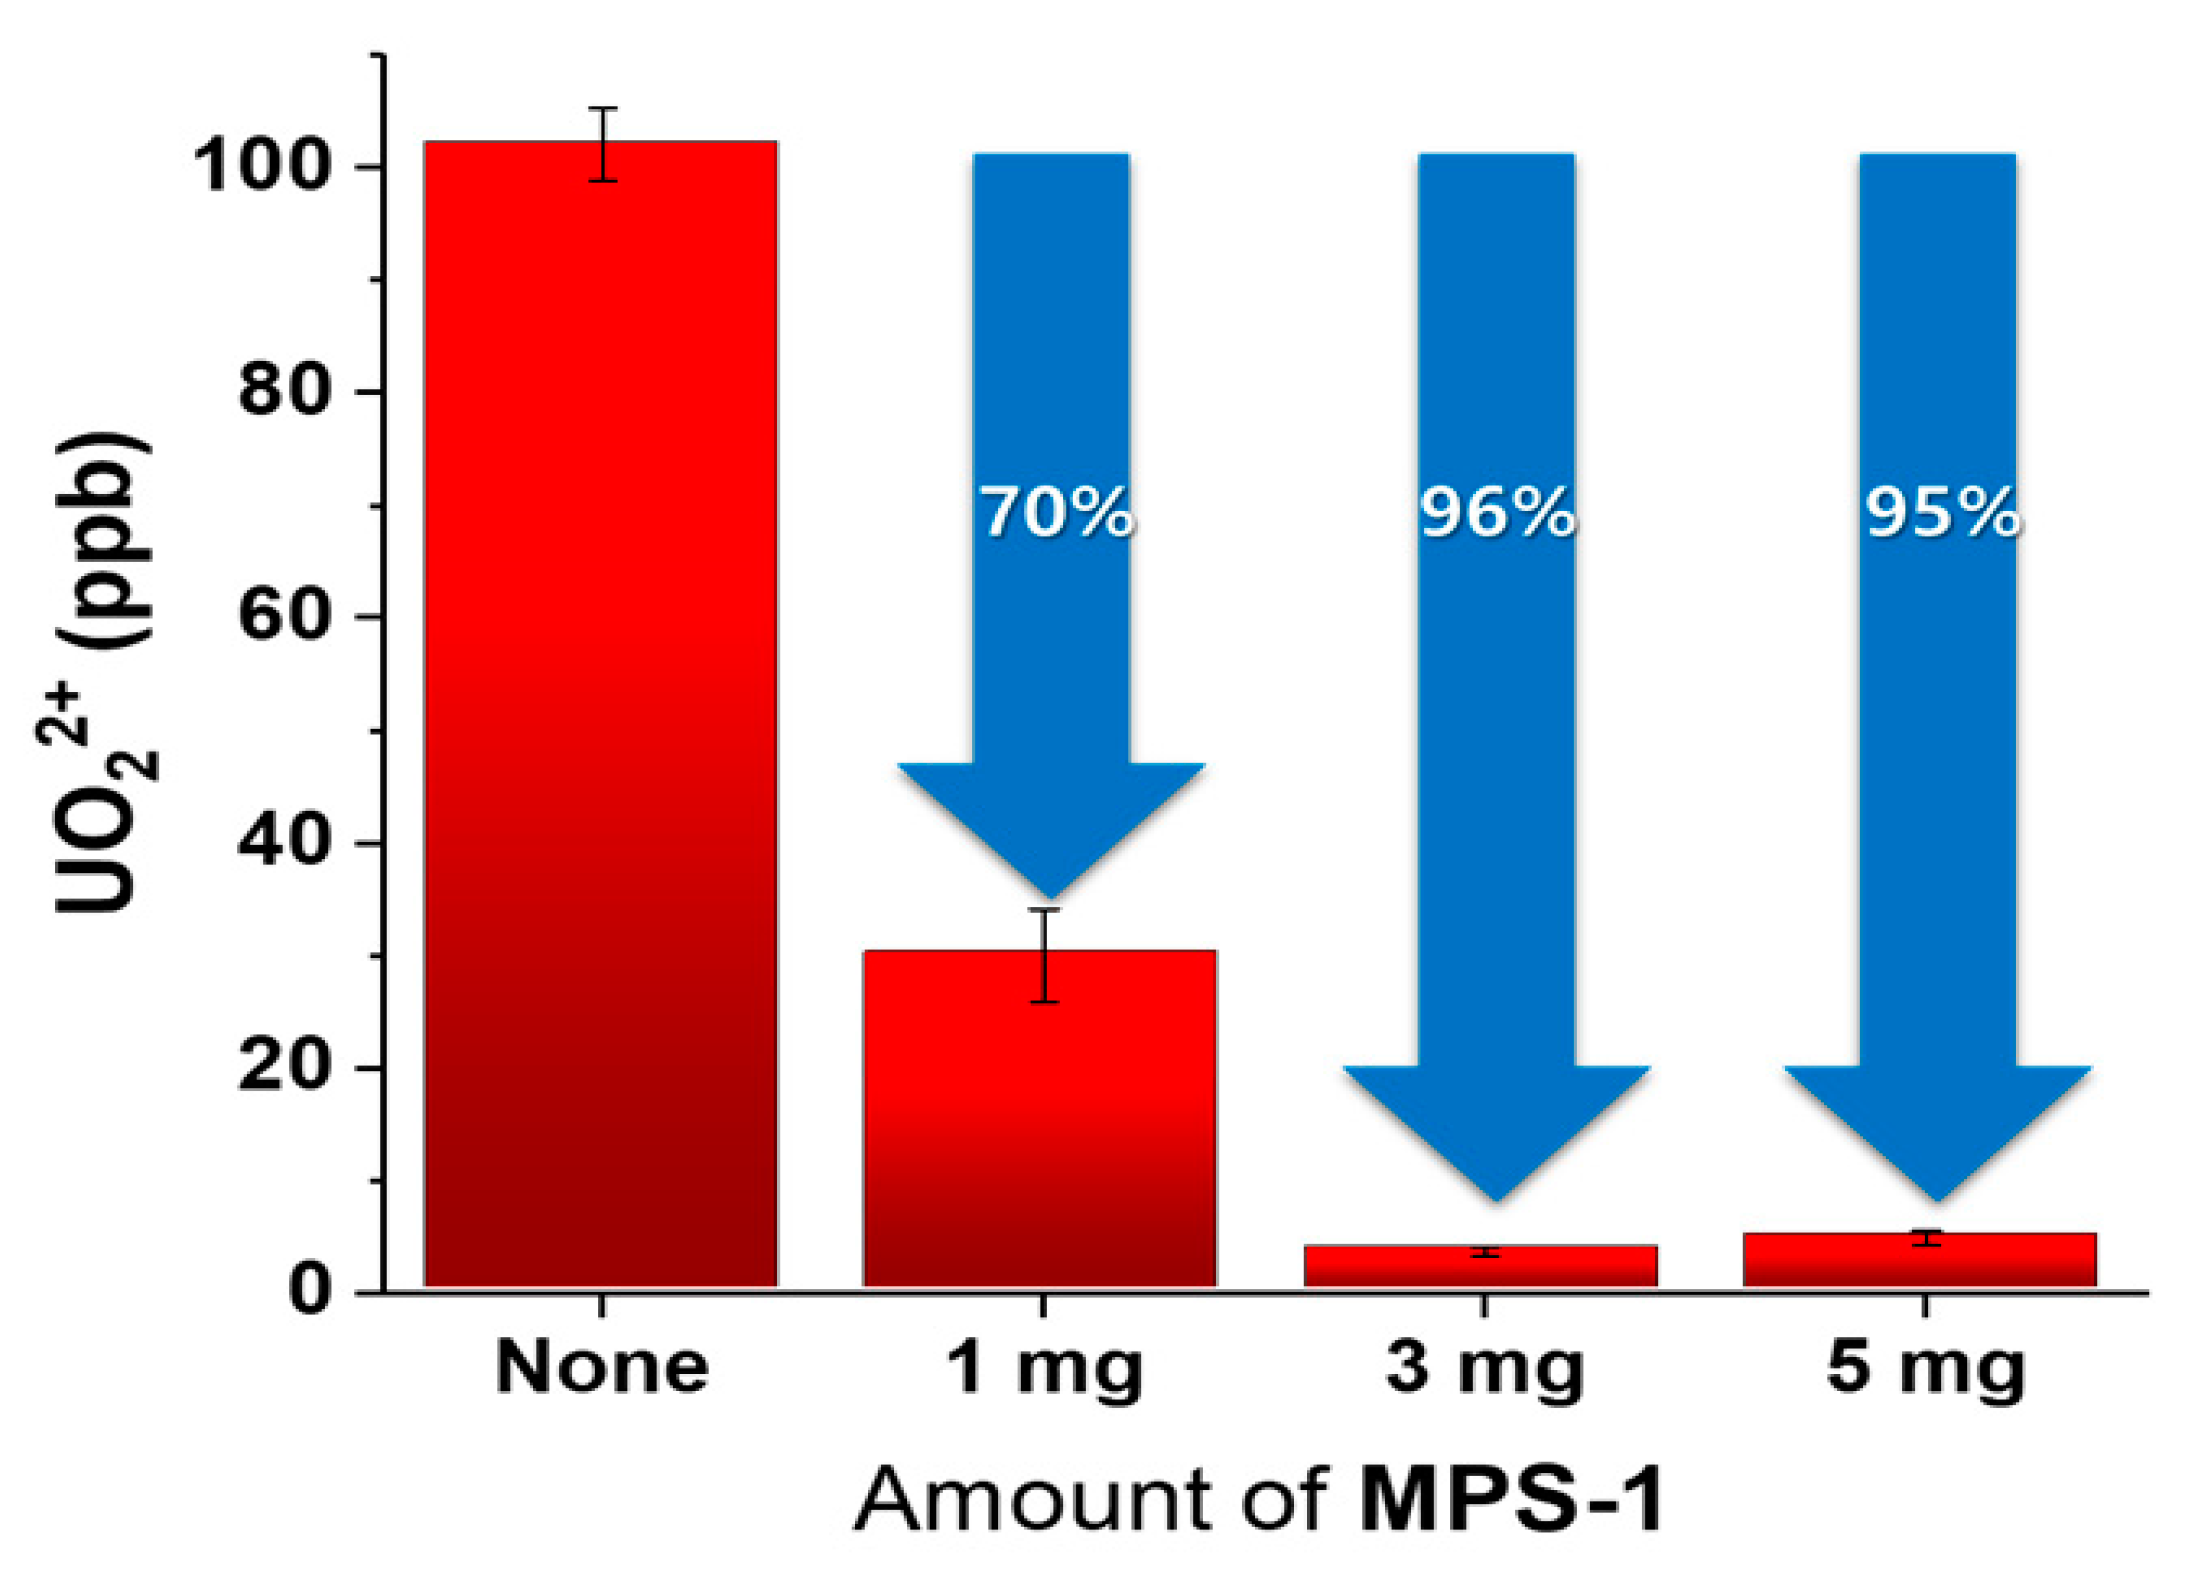
3.3. The Adsorption Capacity of MPS-1 for UO22+

The United States Environmental Protection Agency (US EPA) and the World Health Organization (WHO) have prescribed safe limits of UO22+ in drinking water at 30 ppb [25,26]. The adsorption capacity of MPS-1 was tested by adding 1, 3, and 5 mg of MPS-1 to 1 mL of 100 ppb UO22+ solution. After standing for 10 min, the solution was filtered through a 0.45-μm syringe filler and the UO22+ levels were determined by ICP-MS (experiment performed in triplicate). Calibration curves were obtained with dilute UO22+ solutions (0.1, 1, 10, 50, and 100 ng/L), and the linearity of the calibration curve was confirmed (correlation coefficient was 0.9974) (Figure S9). Figure 5 and Table S1 present the results of the UO22+ adsorption experiment using various amounts of MPS-1. The percentage of UO22+ removed was 70%, 96%, and 95% for 1, 3, and 5 mg of MPS-1, respectively (RSD values all less than 15%). 1 mg of MPS-1 was not sufficient for absorbing 100 ppb UO22+. Using 3 or 5 mg of MPS-1 removed 95% or more of the UO22+; there was no statistically significant difference between the two absorbent dose amounts. In conclusion, MPS-1 (even a small amount: 0.3 wt %) could reduce 100 ppb of UO22+ <5 ppb of UO22+; this result would satisfy both EPA and WHO drinking water standards.

3.4. Adsorption of UO22+ and Other Cations onto MPS-1

The elemental analysis of MPS, MPS-1, and UO22+-adsorbed MPS-1 was performed via TEM dispersive X-ray spectroscopy (EDX) (Figure S10). Nitrogen was observed in the EDX spectrum of MPS-1, thus providing evidence for the presence of compound 1 in MPS-1. In the EDX spectrum of UO22+-adsorbed MPS-1, uranium was detected. This confirms our rationale in designing this adsorbent: UO22+ was bound to the compound 1 attached onto the surface of MPS.
We also confirmed the adsorption capacity of MPS-1 (5 mg) for other metal ions, such as Na+, Mg2+, Ca2+, Cu2+, Ag+, Co2+, Ni2+, Mn2+, and Pb2+ (100 ppb) under the same conditions. Among the metal ions tested, 42.3% of Ca2+ was adsorbed onto the surface of MPS-1; for the remaining metal ions, <30% were adsorbed (Table S2). These findings suggest that MPS-1 would be useful as an adsorbent for UO22+.

4. Conclusions

We synthesized the salicyladazine-based compound 1, designed to be a uranyl ion capture ligand. Compound 1 formed a 1:2 complex with UO22+ as confirmed by the Job’s plot. A fluorescence change was observed when UO22+ was bound to compound 1. IR and NMR measurements were performed to identify compound 1 and the two UO22+ coordination sites. Compound 1 was immobilized into mesoporous silica (MPS-1); the resulting sorbent could remove 96% of the UO22+ from 1 mL of a 100-ppb UO22+ aqueous solution. A material was successfully developed that was capable of simultaneously absorbing uranyl ions and detecting their presence by fluorescence. We believe that this organic–inorganic hybrid material paradigm for detecting UO22+ will have a broad impact for the study on porous materials and their application.

Supplementary Materials

The following are available online at https://www.mdpi.com/2079-4991/9/5/688/s1. Scheme S1. Synthesis route of compound 1; Figure S1. FT-IR spectrum of compound 1; Figure S2. 1H NMR spectrum of compound 1 in DMSO-d6; Figure S3. 13C NMR spectrum of compound 1 in DMSO-d6; Figure S4. Job’s plot for complex formed between compound 1 and UO22+; Figure S5. FT-IR spectra of 1 and 1 with UO22+; Figure S6. TGA thermogram of compound 1; Figure S7. FT-IR spectra of (A) MPS and (B) MPS-1; Figure S8. Fluorescence spectra of (a) MPS-1 (2 mg) in 3.5% NaCl solution (2mL) and (b) MPS-1 (2 mg) with UO22+ solution (100 ppb) in 3.5% NaCl (2 mL); Figure S9. Linear equation of various concentrations of UO22+; Figure S10. TEM EDX mapping of (A) MPS (B) MPS-1 and (C) MPS-1 with UO22+; Table S1. Adsorption Capacities of MPS-1 for UO22+ (100 ppb) solution; Table S2. Adsorption Capacities of MPS-1 (5 mg) with various metal ions (100 ppb) solution.

Author Contributions

Conceptualization, S.P. and J.P.; Data curation, S.P.; Formal analysis, S.P. and J.P.; Investigation, S.P. and J.P.; Methodology, J.P.; Project administration, J.H.L. and J.H.J.; Supervision, J.H.L., M.Y.C. and J.H.J.; Writing—Original draft, J.H.L.; Writing—Review & editing, J.H.L., M.Y.C. and J.H.J.

Funding

This research was supported by the NRF (2018R1A2B2003637, 2017M2B2A9A02049940 and 2017R1A4A1014595) supported by the Ministry of Education, Science and Technology, Korea. In addition, this work was partially supported by a grant from the Next-Generation BioGreen 21 Program (SSAC, Grant no. PJ013186052019), Rural Development Administration, Korea.

Conflicts of Interest

The authors declare no conflict of interest.

References

  1. O’Loughlin, E.J.; Kelly, S.D.; Cook, R.E.; Csencsits, R.; Kemner, K.M. Reduction of Uranium(VI) by Mixed Iron(II)/Iron(III) Hydroxide (Green Rust):  Formation of UO2 Nanoparticles. Environ. Sci. Technol. 2003, 37, 721–727. [Google Scholar] [CrossRef] [PubMed]
  2. Feng, M.-L.; Sarma, D.; Qi, X.-H.; Du, K.-Z.; Huang, X.-Y.; Kanatzidis, M.G. Efficient Removal and Recovery of Uranium by a Layered Organic–Inorganic Hybrid Thiostannate. J. Am. Chem. Soc. 2016, 138, 12578–12585. [Google Scholar] [CrossRef] [PubMed]
  3. Asiabi, H.; Yamini, Y.; Shamsayei, M. Highly efficient capture and recovery of uranium by reusable layered double hydroxide intercalated with 2-mercaptoethanesulfonate. Chem. Eng. J. 2018, 337, 609–615. [Google Scholar] [CrossRef]
  4. Wu, P.; Hwang, K.; Lan, T.; Lu, Y. A DNAzyme-Gold Nanoparticle Probe for Uranyl Ion in Living Cells. J. Am. Chem. Soc. 2013, 135, 5254–5257. [Google Scholar] [CrossRef]
  5. Cao, X.-H.; Zhang, H.-Y.; Ma, R.-C.; Yang, Q.; Zhang, Z.-B.; Liu, Y.-H. Visual colorimetric detection of UO22+ using o-phosphorylethanolamine-functionalized gold nanoparticles. Sens. Actuators B 2015, 218, 67–72. [Google Scholar] [CrossRef]
  6. Elabd, A.A.; Attia, M.S. A new thin film optical sensor for assessment of UO22+ based on the fluorescence quenching of Trimetazidine doped in sol gel matrix. J. Lumin. 2015, 165, 179–184. [Google Scholar] [CrossRef]
  7. Xiao, S.J.; Zuo, J.; Zhu, Z.Q.; Ouyang, Y.Z.; Zhang, X.L.; Chen, H.W.; Zhang, L. Highly sensitive DNAzyme sensor for selective detection of trace uranium in ore and natural water samples. Sens. Actuators B 2015, 210, 656–660. [Google Scholar] [CrossRef]
  8. Elabd, A.A.; Attia, M.S. Spectrofluorimetric assessment of UO22+ by the quenching of the fluorescence intensity of Clopidogrel embedded in PMMA matrix. J. Lumin. 2016, 169, 313–318. [Google Scholar] [CrossRef]
  9. Zheng, S.; Wang, H.; Hu, Q.; Wang, Y.; Hu, J.; Zhou, F.; Liu, P. “Turn-On” fluorescent chemosensor based on β-diketone for detecting Th4+ ions in Aqueous Solution and application in living cell imaging. Sens. Actuators B 2017, 253, 766–772. [Google Scholar] [CrossRef]
  10. Wen, J.; Huang, Z.; Hu, S.; Li, S.; Li, W.; Wang, X. Aggregation-induced emission active tetraphenylethene-based sensor for uranyl ion detection. J. Hazard. Mater. 2016, 318, 363–370. [Google Scholar] [CrossRef]
  11. Harvey, P.; Nonat, A.; Platas-Iglesias, C.; Natrajan, L.S.; Charbonniere, L.J. Sensing Uranyl(VI) Ions by Coordination and Energy Transfer to a Luminescent Europium(III) Complex. Angew. Chem. Int. Ed. 2018, 57, 9921–9924. [Google Scholar] [CrossRef]
  12. Lee, J.H.; Wang, Z.; Liu, J.; Lu, Y. Highly sensitive and selective colorimetric sensors for uranyl (UO22+): Development and comparison of labeled and label-free DNAzyme-gold nanoparticle systems. J. Am. Chem. Soc. 2008, 130, 14217–14226. [Google Scholar] [CrossRef]
  13. Sather, A.C.; Berryman, O.B.; Rebek, J. Selective recognition and extraction of the uranyl ion from aqueous solutions with a recyclable chelating resin. Chem. Sci. 2013, 4, 3601–3605. [Google Scholar] [CrossRef]
  14. Zhang, S.; Sun, M.; Yan, Y.; Yu, H.; Yu, T.; Jiang, H.; Zhang, K.; Wang, S. A turn-on fluorescence probe for the selective and sensitive detection of fluoride ions. Anal. Bioanal. Chem. 2017, 409, 2075–2081. [Google Scholar] [CrossRef] [PubMed]
  15. Gao, M.; Li, Y.; Chen, X.; Li, S.; Ren, L.; Tang, B.Z. Aggregation-Induced Emission Probe for Light-Up and in Situ Detection of Calcium Ions at High Concentration. ACS Appl. Mater. Interfaces 2018, 10, 14410–14417. [Google Scholar] [CrossRef]
  16. Zhang, K.; Xu, L.L.; Jiang, J.G.; Calin, N.; Lam, K.F.; Zhang, S.J.; Wu, H.H.; Wu, G.D.; Albela, B.; Bonneviot, L.; et al. Facile large-scale synthesis of monodisperse mesoporous silica nanospheres with tunable pore structure. J. Am. Chem. Soc. 2013, 135, 2427–2430. [Google Scholar] [CrossRef] [PubMed]
  17. Yang, C.-T.; Han, J.; Gu, M.; Liu, J.; Li, Y.; Huang, Z.; Yu, H.-Z.; Hu, S.; Wang, X. Fluorescent recognition of uranyl ions by a phosphorylated cyclic peptide. Chem. Commun. 2015, 51, 11769–11772. [Google Scholar] [CrossRef] [PubMed]
  18. Starck, M.; Sisommay, N.; Laporte, F.A.; Oros, S.; Lebrun, C.; Delangle, P. Preorganized Peptide Scaffolds as Mimics of Phosphorylated Proteins Binding Sites with a High Affinity for Uranyl. Inorg. Chem. 2015, 54, 11557–11562. [Google Scholar] [CrossRef] [PubMed]
  19. Sessler, J.L.; Seidel, D.; Vivian, A.E.; Lynch, V.; Scott, B.L.; Keogh, D.W. Hexaphyrin(1.0.1.0.0.0): An Expanded Porphyrin Ligand for the Actinide Cations Uranyl (UO22+) and Neptunyl (NpO2+). Angew. Chem. Int. Ed. 2001, 40, 591–594. [Google Scholar] [CrossRef]
  20. Sessler, J.L.; Gorden, A.E.V.; Seidel, D.; Hannah, S.; Lynch, V.; Gordon, P.L.; Donohoe, R.J.; Drew Tait, C.; Webster Keogh, D. Characterization of the interactions between neptunyl and plutonyl cations and expanded porphyrins. Inorg. Chim. Acta 2002, 341, 54–70. [Google Scholar] [CrossRef]
  21. Anguera, G.; Brewster, J.T.; Moore, M.D.; Lee, J.; Vargas-Zúñiga, G.I.; Zafar, H.; Lynch, V.M.; Sessler, J.L. Naphthylbipyrrole-Containing Amethyrin Analogue: A New Ligand for the Uranyl (UO22+) Cation. Inorg. Chem. 2017, 56, 9409–9412. [Google Scholar] [CrossRef]
  22. Brewster, J.T.; He, Q.; Anguera, G.; Moore, M.D.; Ke, X.-S.; Lynch, V.M.; Sessler, J.L. Synthesis and characterization of a dipyriamethyrin–uranyl complex. Chem. Commun. 2017, 53, 4981–4984. [Google Scholar] [CrossRef] [PubMed]
  23. Marten-Ramos, P.; Costa, A.L.; Silva, M.R.; Pereira, L.C.J.; Pereira da Silva, P.S.; Seixas de Melo, J.S.; Martin-Gil, J. Luminescent properties of [UO2(TFA)2(DMSO)3], a promising material for sensing and monitoring the uranyl ion. Mater. Res. 2016, 19, 328–332. [Google Scholar] [CrossRef]
  24. Du, N.; Song, J.; Li, S.; Chi, Y.-X.; Bai, F.-Y.; Xing, Y.-H. A Highly Stable 3D Luminescent Indium-Polycarboxylic Framework for the Turn-off Detection of UO2(2+), Ru(3+), and Biomolecule Thiamines. ACS Appl. Mater. Interfaces 2016, 8, 28718–28726. [Google Scholar] [CrossRef] [PubMed]
  25. 2018 Drinking Water Standards and Advisory Tables. Available online: https://www.epa.gov/dwstandardsregulations/2018-drinking-water-standards-and-advisory-tables (accessed on 29 April 2019).
  26. Guidelines for Drinking-Water Quality, 4th ed. Available online: https://www.who.int/water_sanitation_health/publications/2011/dwq_guidelines/en/ (accessed on 29 April 2019).
Figure 1. Chemical structure of compound 1.
Nanomaterials 09 00688 g001
Figure 2. (A) UV–vis spectra of compound 1 (2.65 × 10⁴ ppb) in DMSO/H2O (1:99 v/v) containing various amounts of UO22+. (B) Photographed cuvettes from (A) under UV light irradiation. (C) Fluorescence spectra of compound 1 (2.65 × 10⁴ ppb) in DMSO/H2O (1:99 v/v) containing various amounts of UO22+ (0–5 equivalents). (D) Plot of fluorescence intensity of (C) vs. amount of UO22+.
Nanomaterials 09 00688 g002
Figure 3. (A) 1H nuclear magnetic resonance (NMR) spectra of compound 1 (10 mM) in DMSO-d6 containing various equivalents of uranyl acetate. (B) Proposed structure of complex 1 with UO22+.
Nanomaterials 09 00688 g003
Figure 4. (A) Transmission electron microscopy (TEM) image of mesoporous silica (MPS-1) and (B) thermogravimetry analysis (TGA) thermogram of MPS (black) and MPS-1 (red). (C) The photograph and the Fluorescence spectra of (a) MPS-1 (2 mg) in water (2 mL) and (b) MPS-1 (2 mg) in 100 ppb UO22+ solution (2 mL).
Nanomaterials 09 00688 g004
Figure 5. Result of UO22+ adsorption of MPS-1 in 100 ppb UO22+ solution.
Nanomaterials 09 00688 g005

