Achieving Ultrahigh Hardness in Electrodeposited Nanograined Ni-Based Binary Alloys


Abstract
1. Introduction
2. Materials and Methods
3. Results
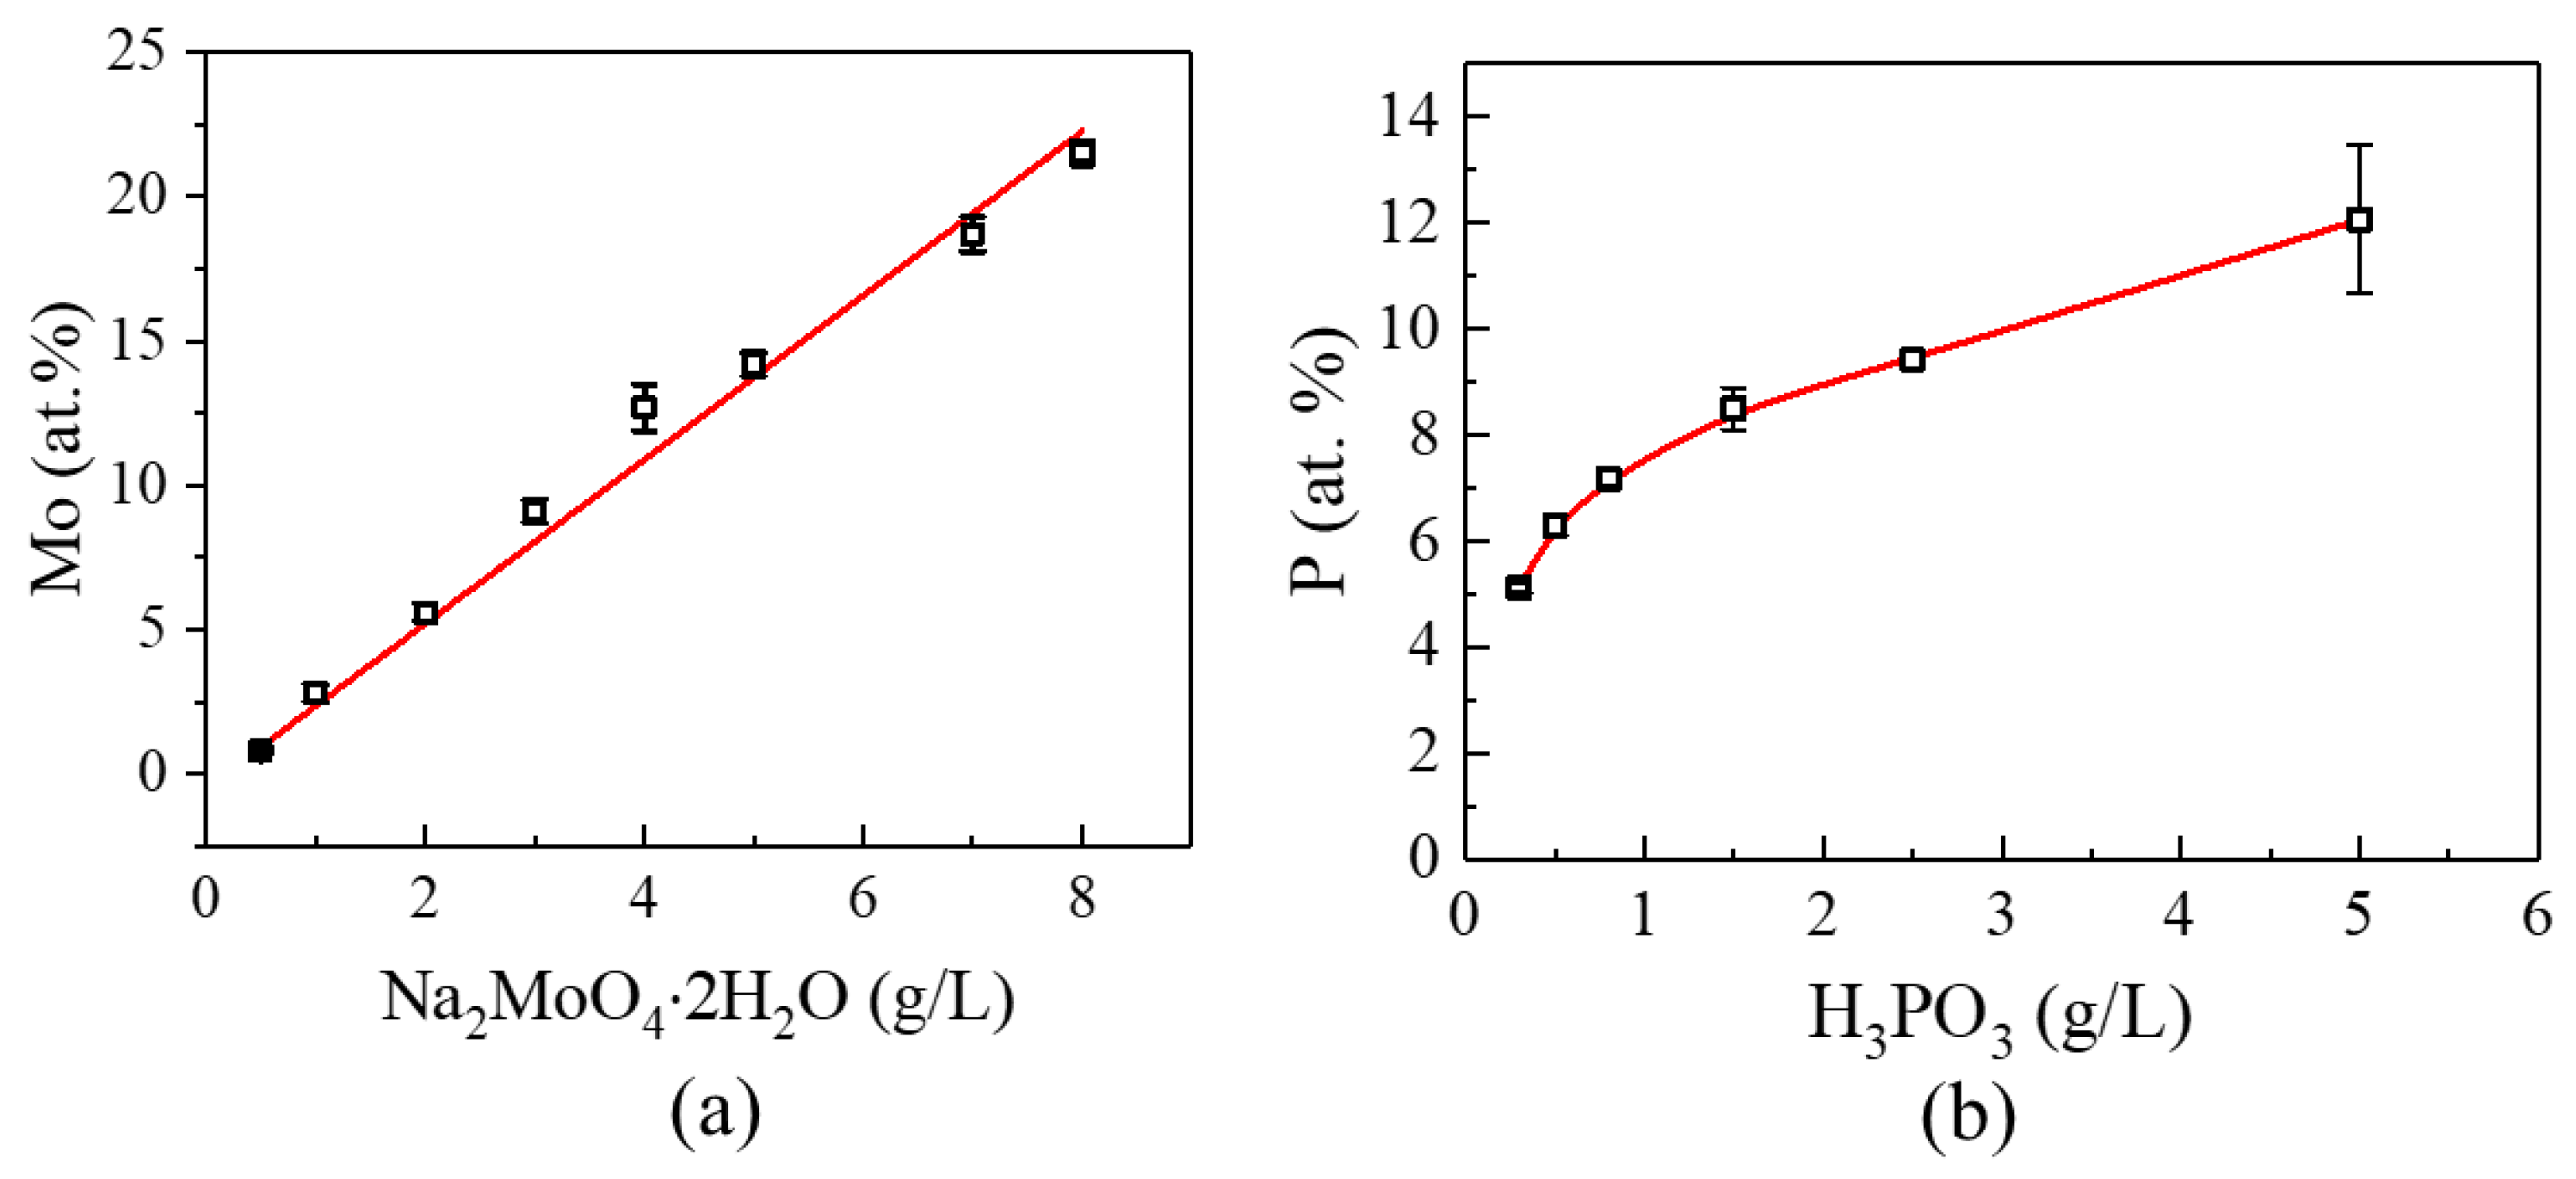
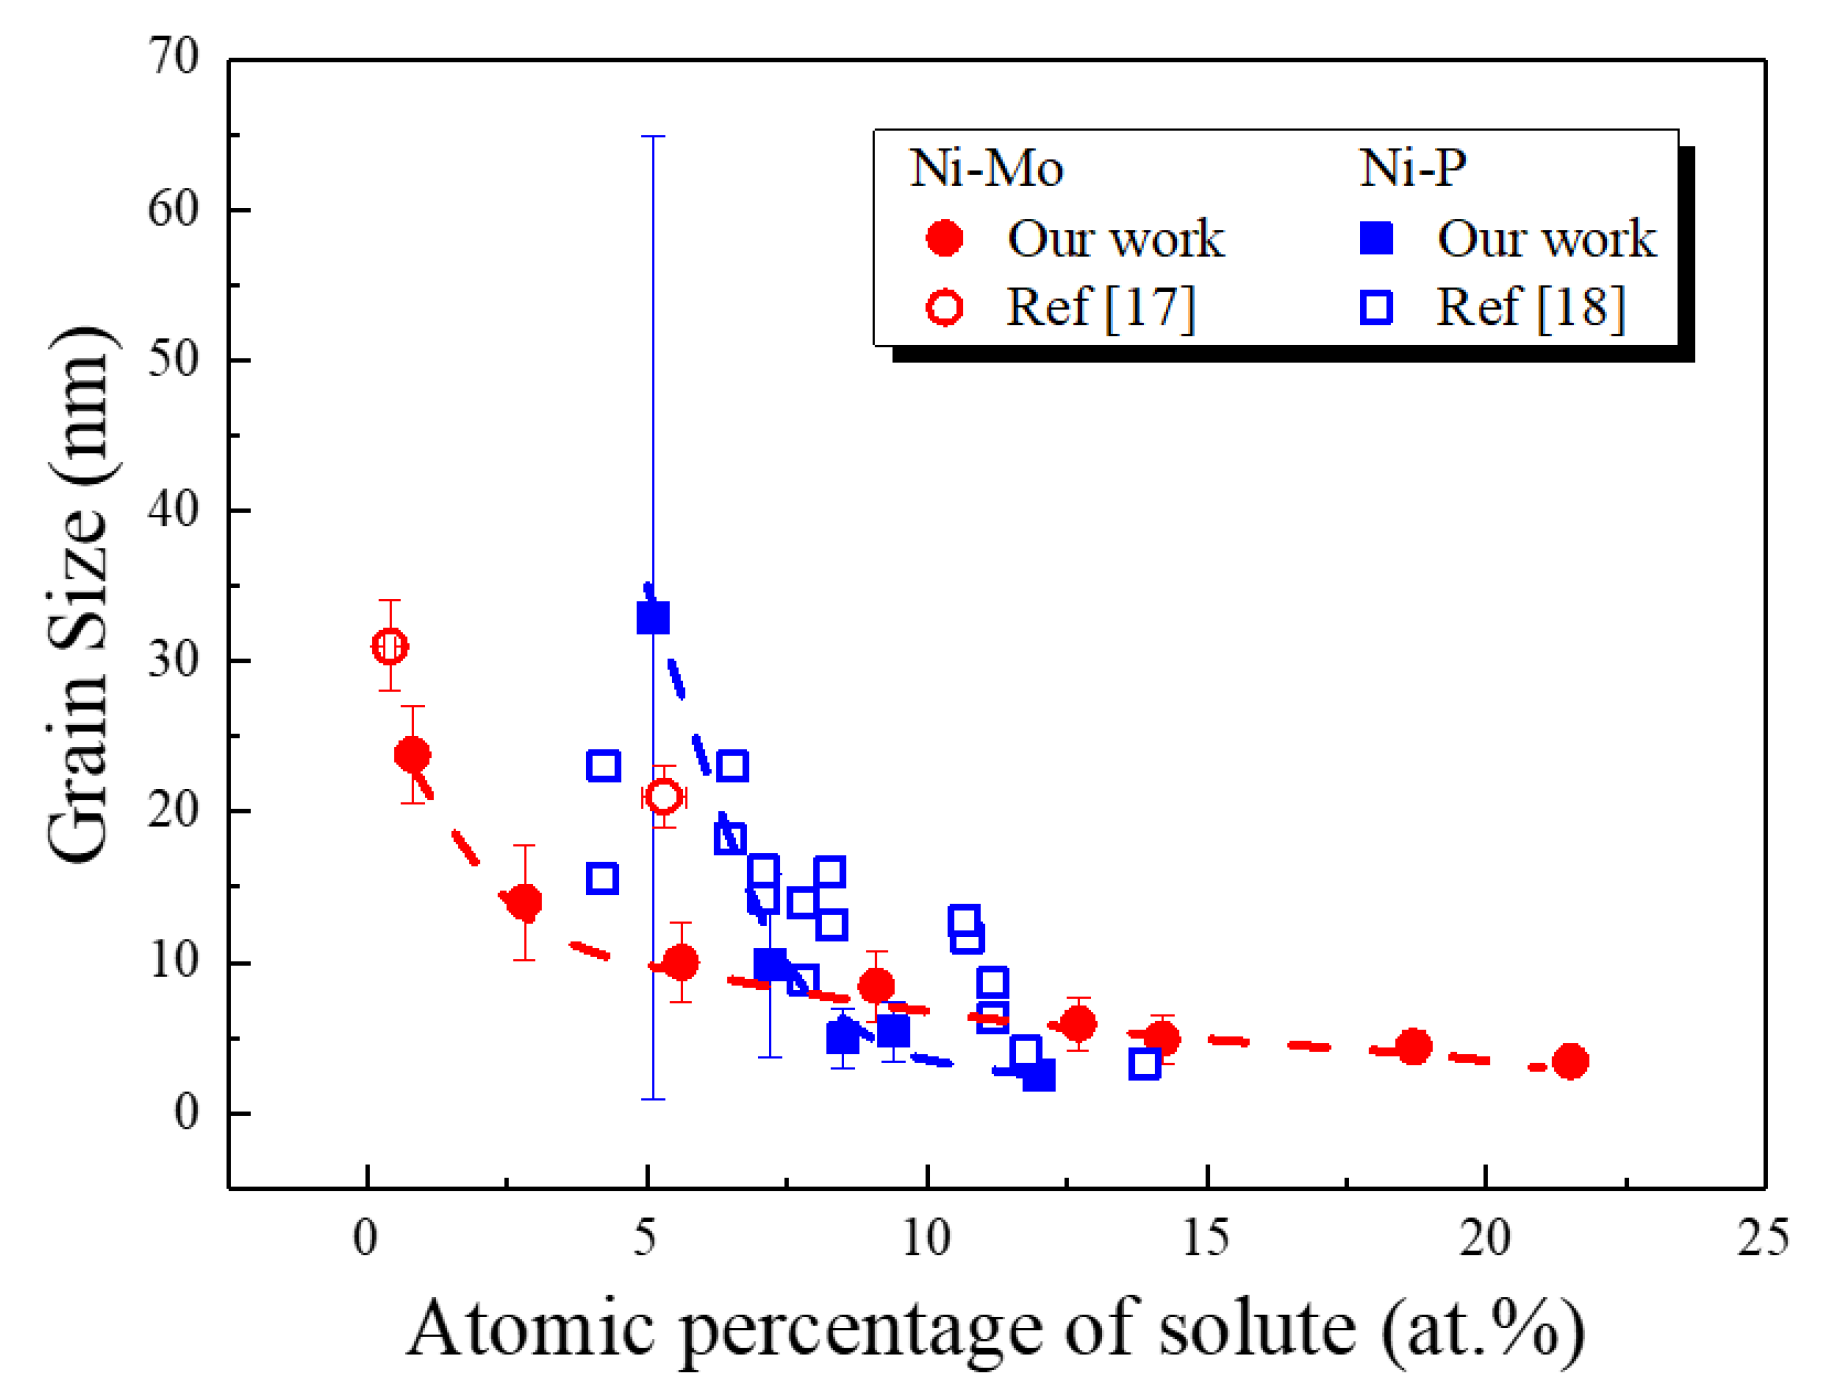
3.1. Synthesis
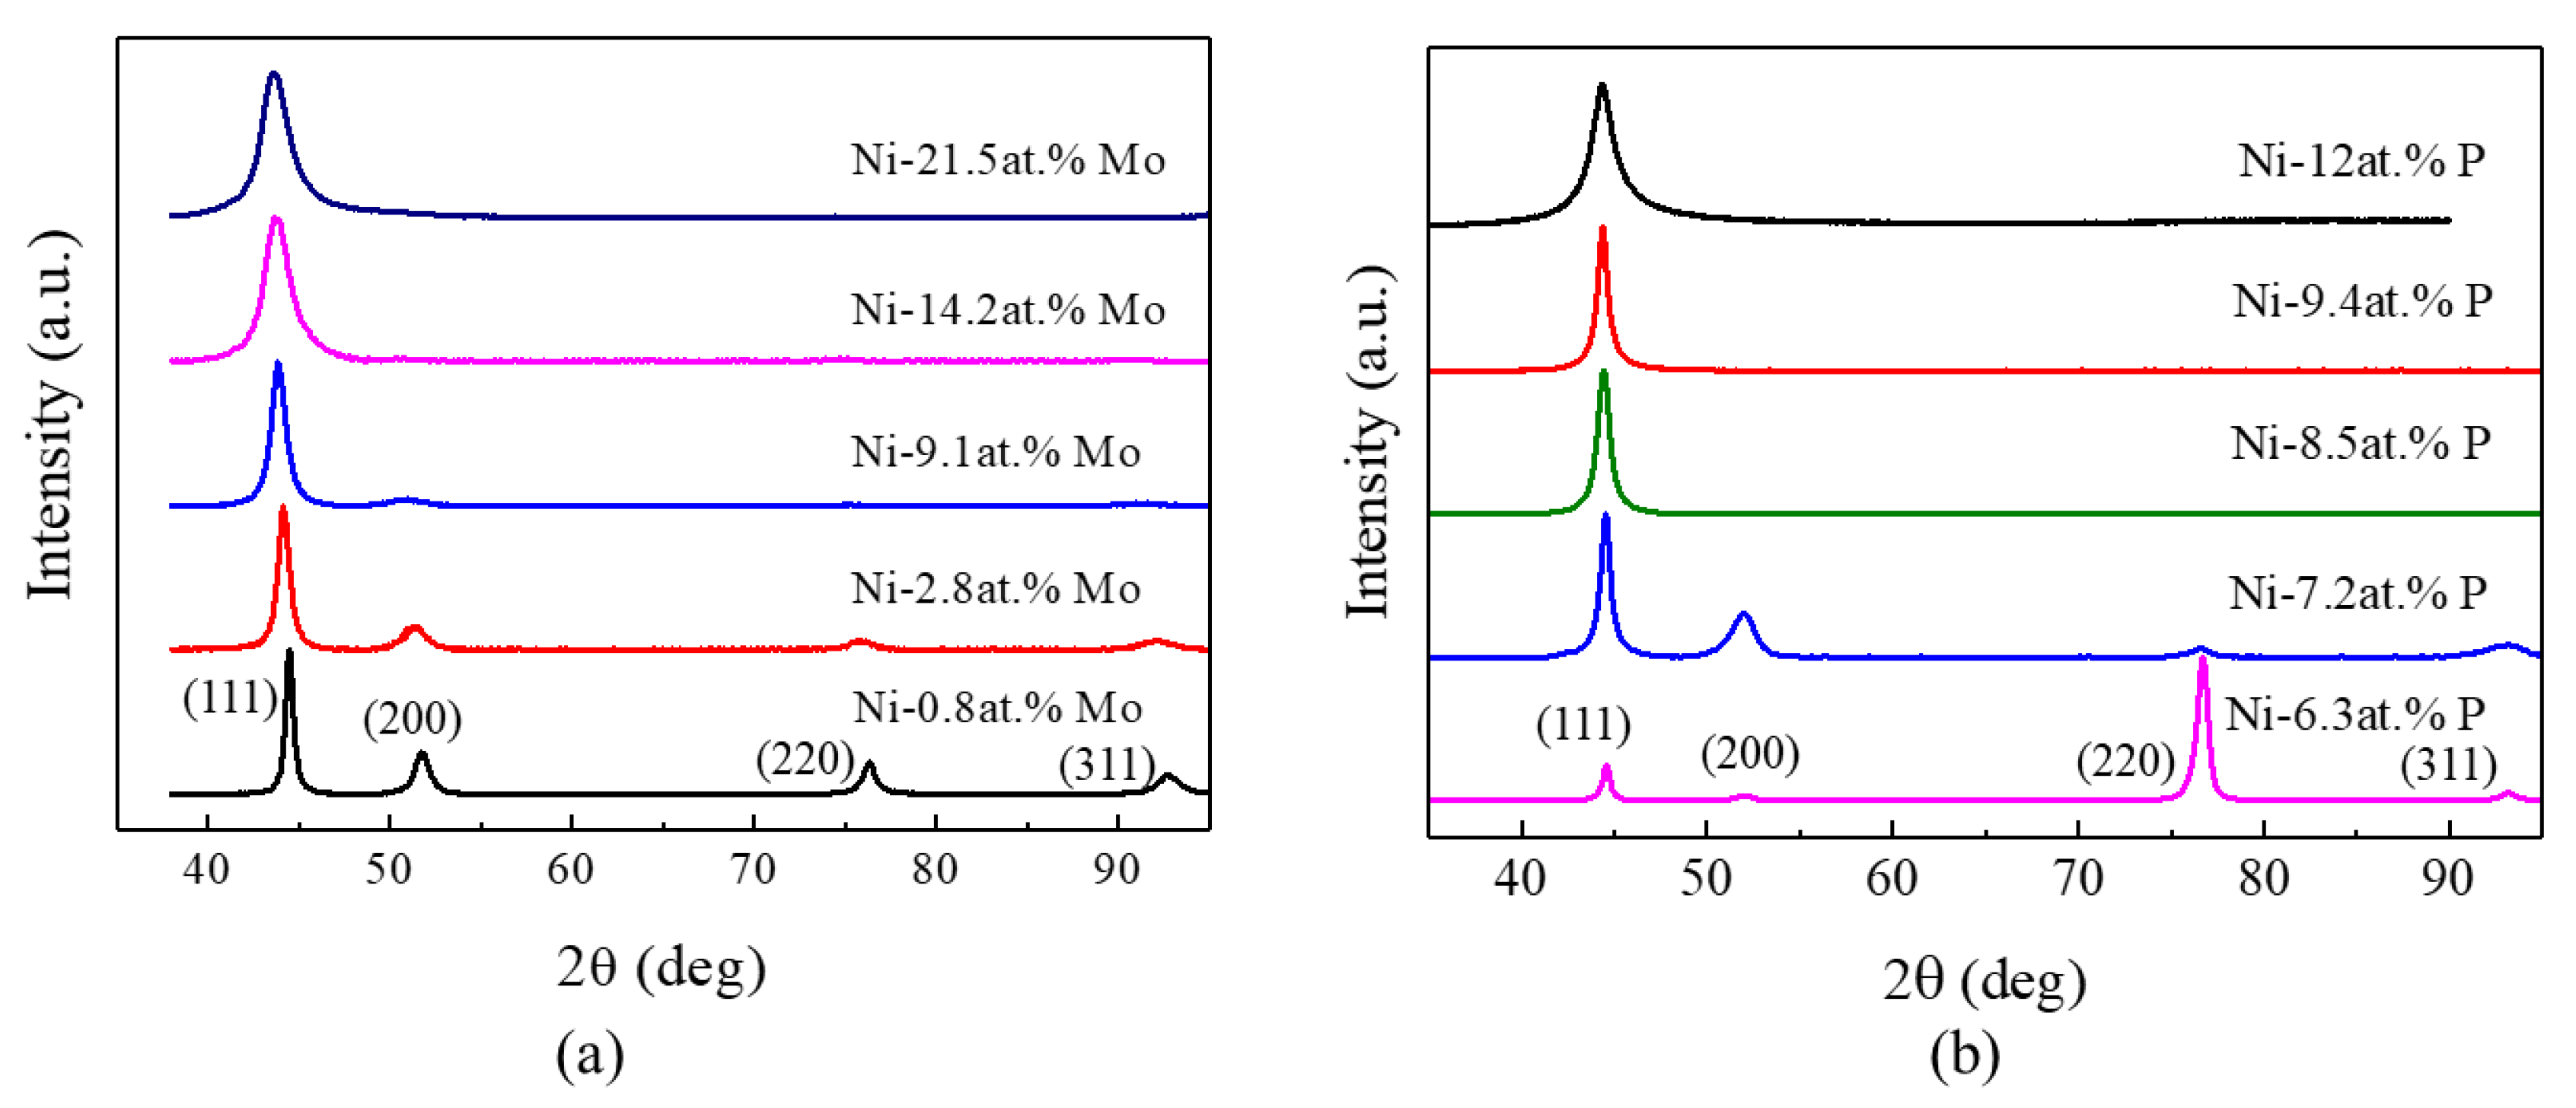
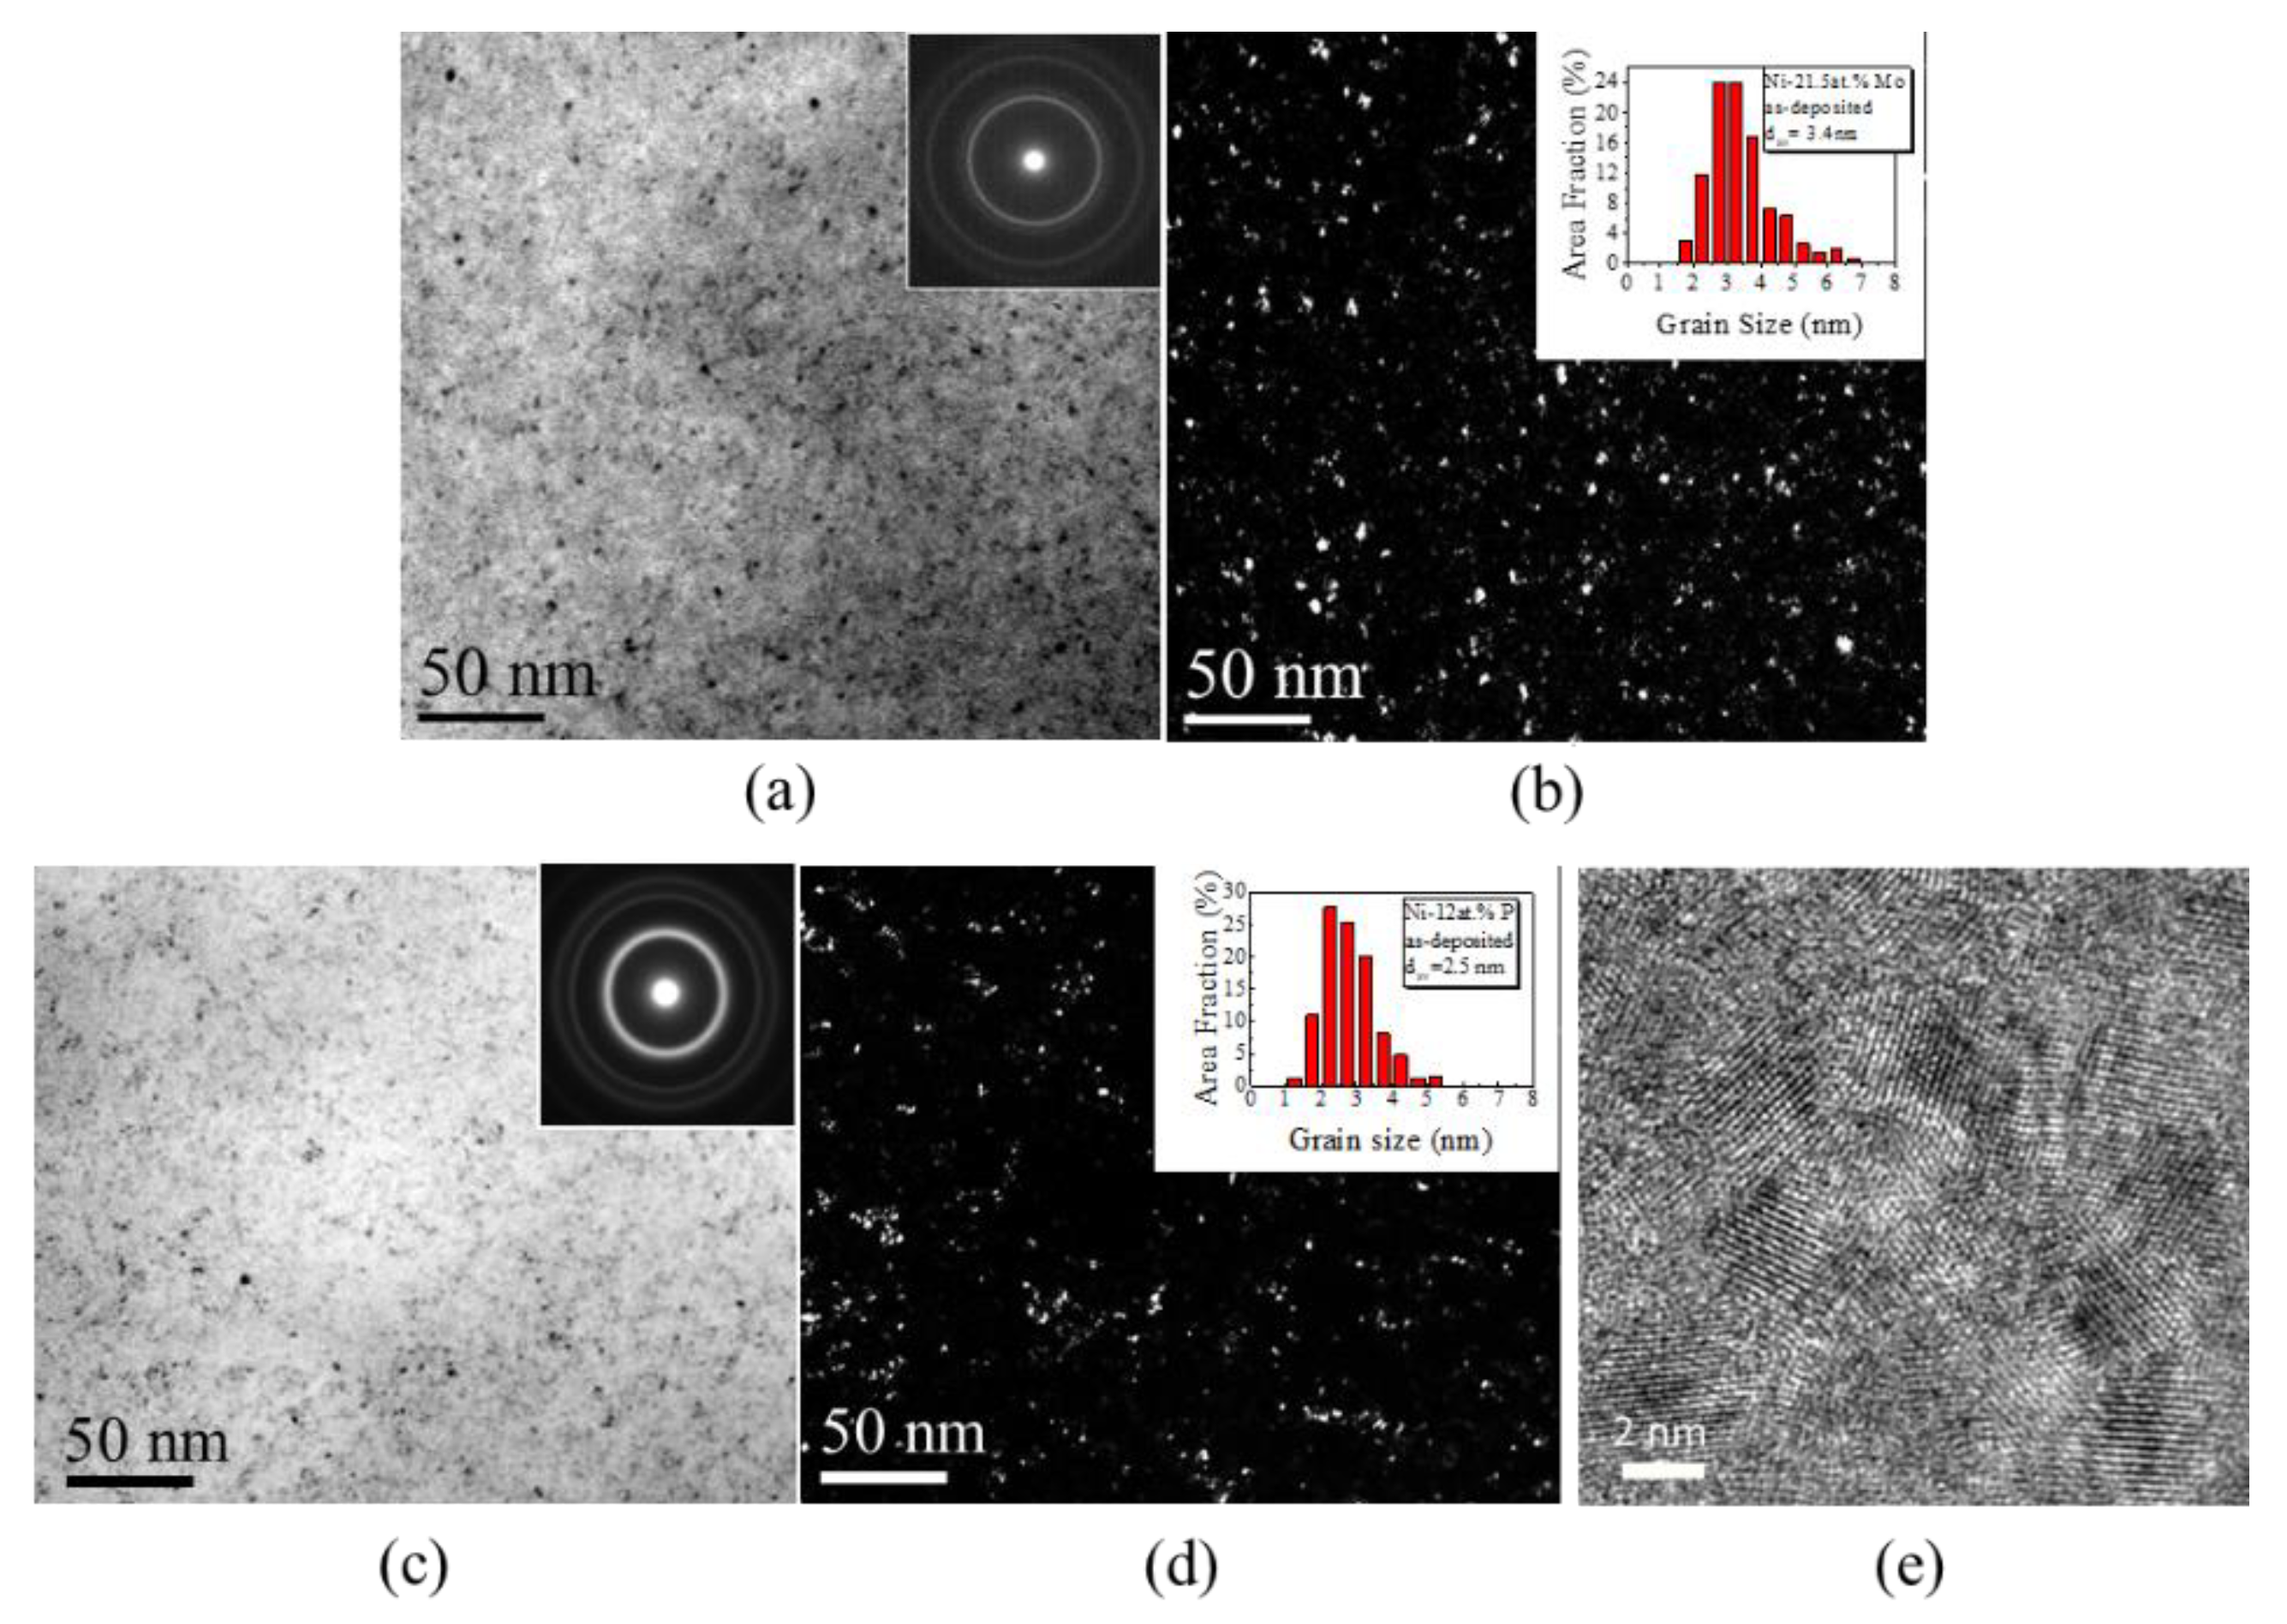
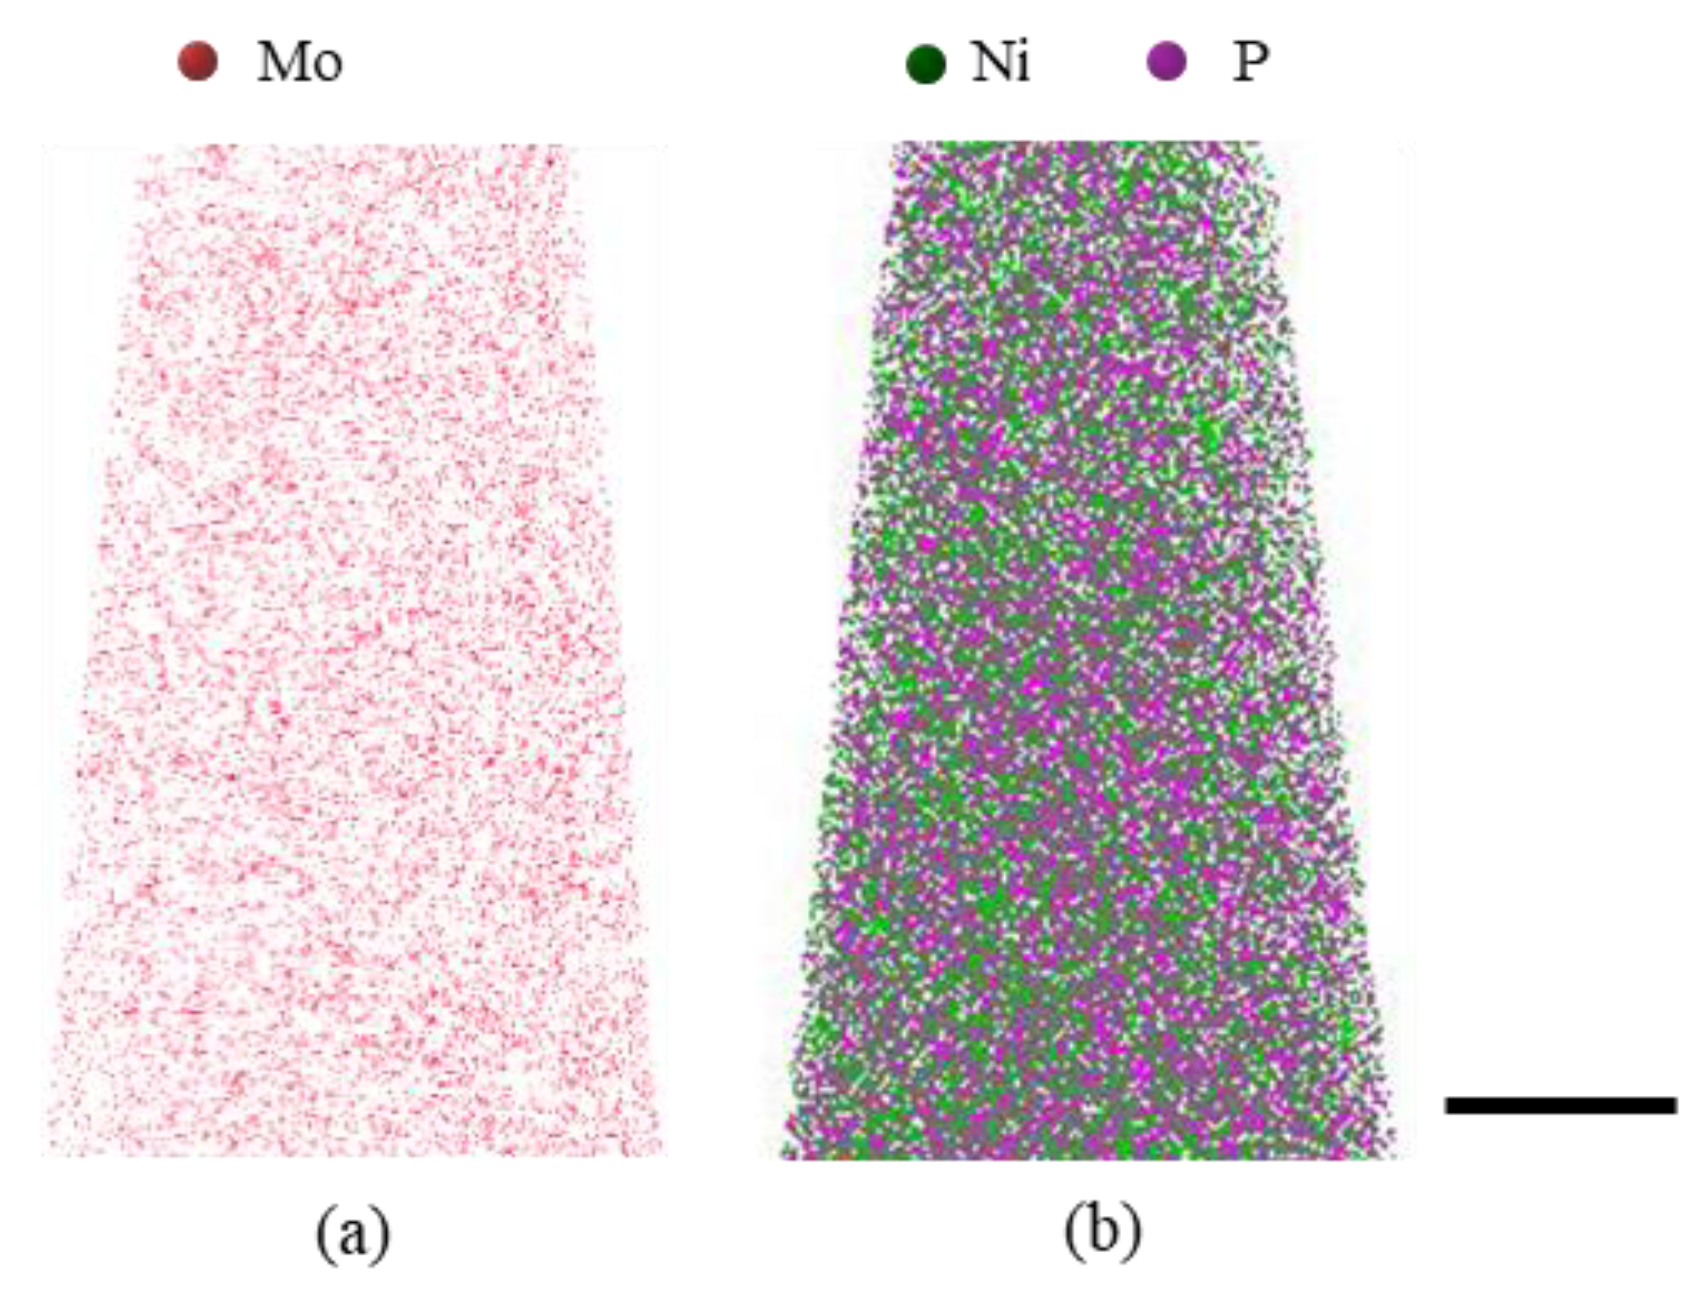
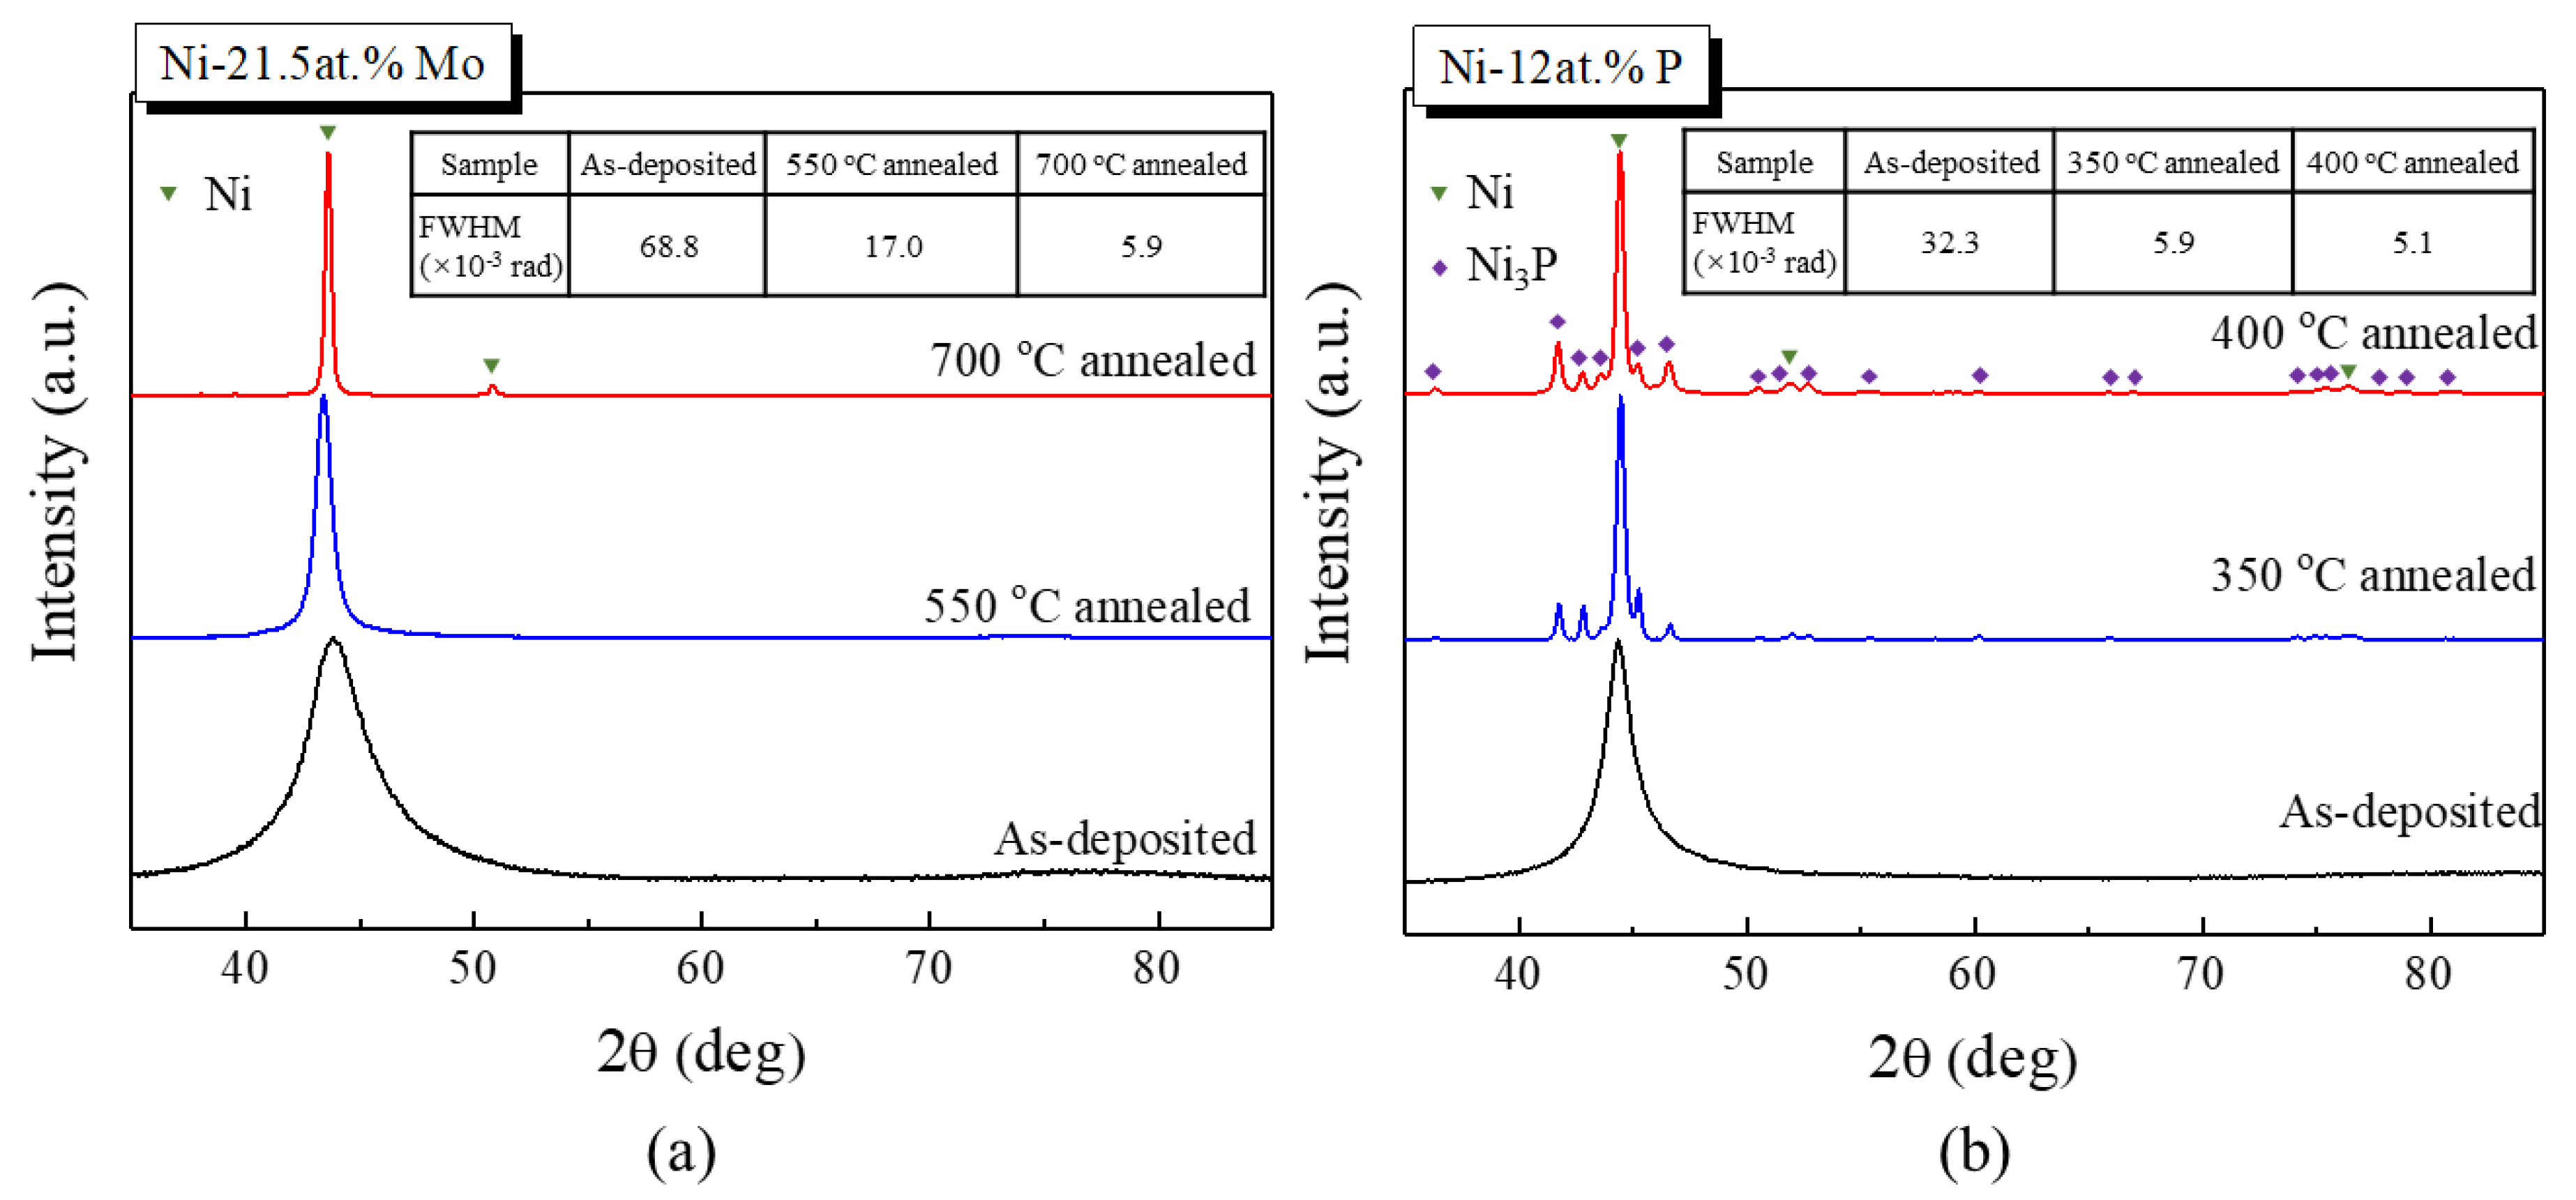
3.2. Structural and Chemical Characterization
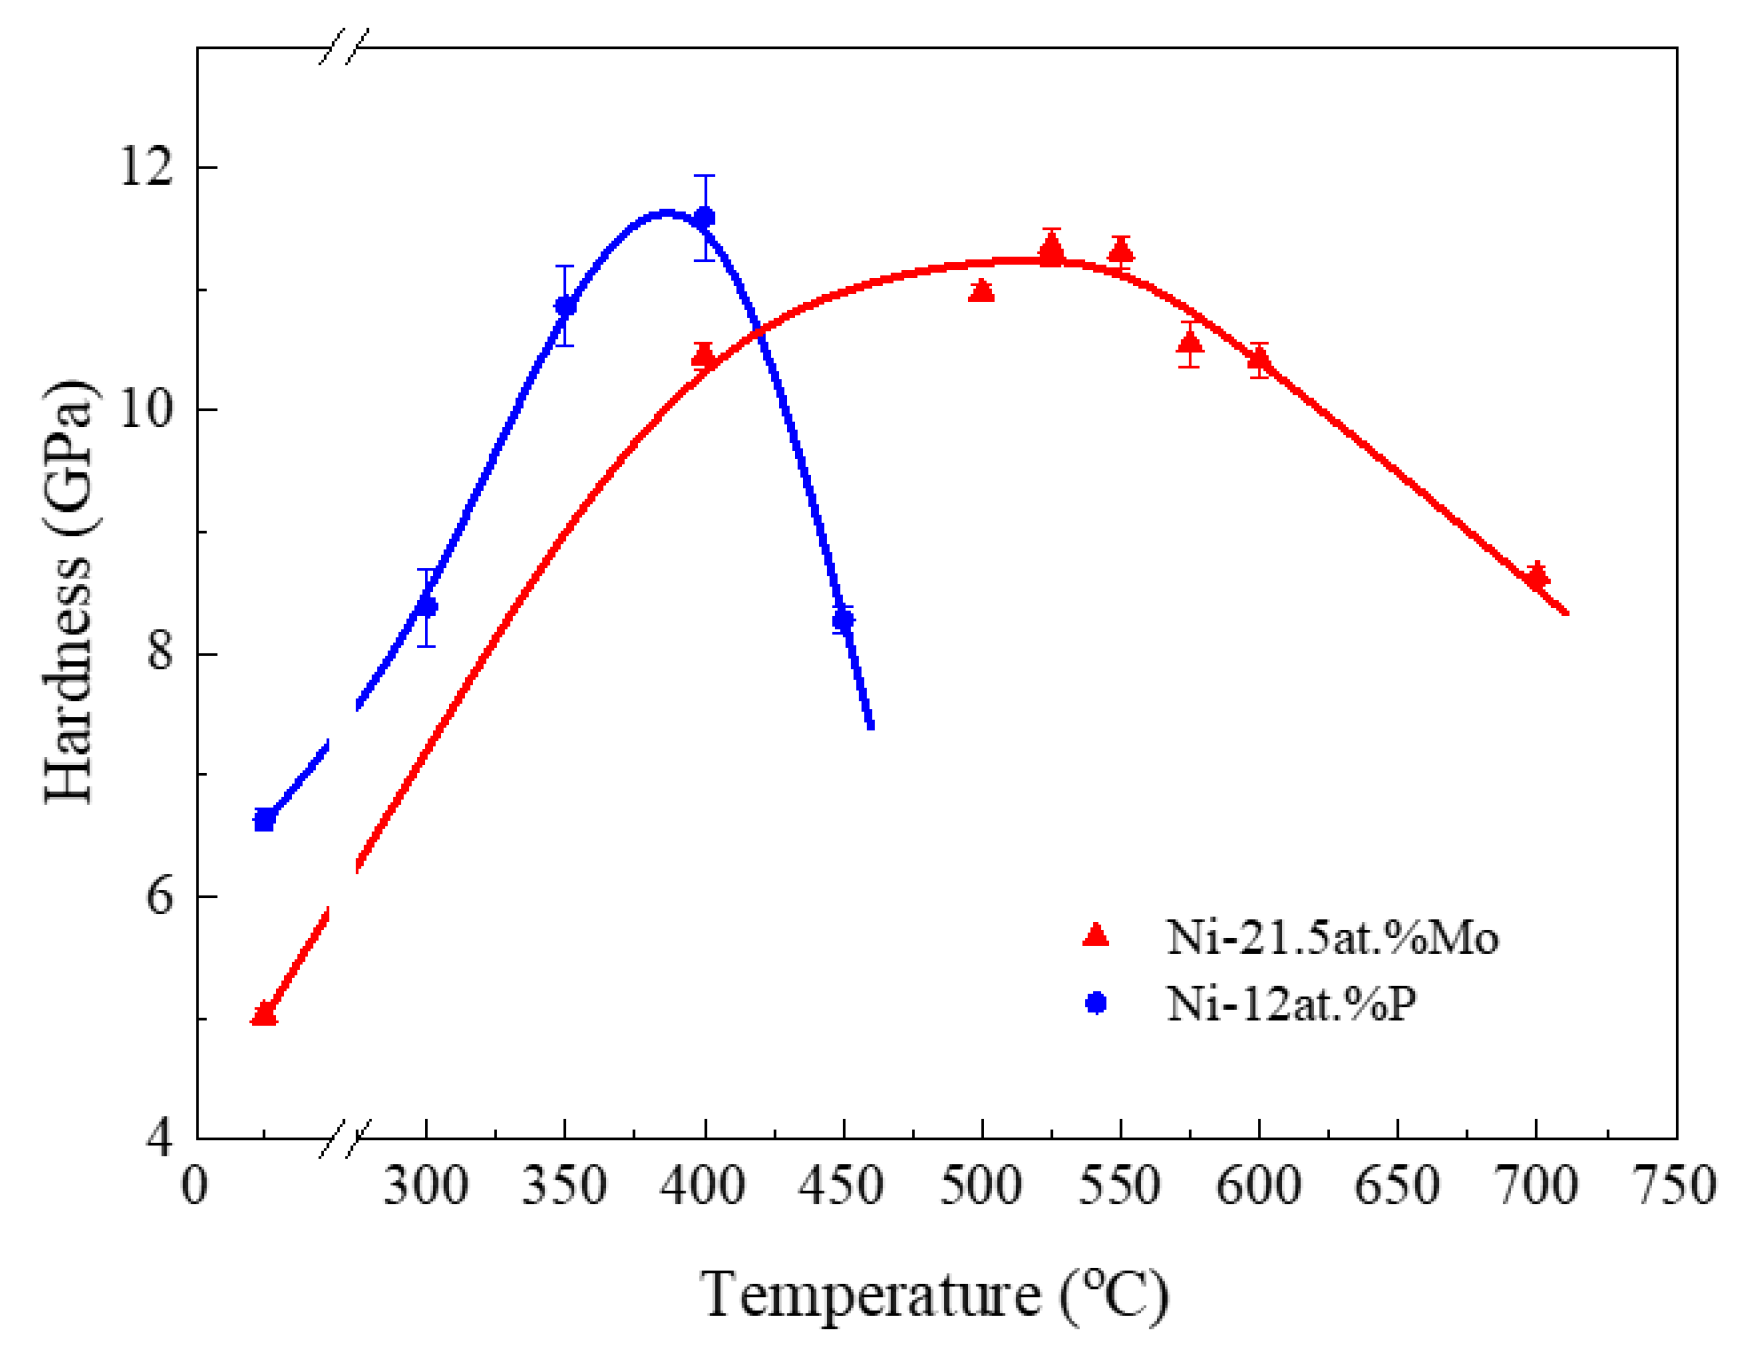
3.3. Annealing Hardening
4. Discussion
5. Conclusions
Author Contributions
Funding
Acknowledgments
Conflicts of Interest
References
- Hall, E.O. The deformation and ageing of mild steel. 3. Discussion of results. Proc. Phys. Soc. Lond. Sect. B 1951, 64, 747–753. [Google Scholar] [CrossRef]
- Petch, N.J. The cleavage strength of polycrystals. J. Iron Steel Inst. 1953, 174, 25–28. [Google Scholar]
- Detor, A.J.; Schuh, C.A. Tailoring and patterning the grain size of nanocrystalline alloys. Acta Mater. 2007, 55, 371–379. [Google Scholar] [CrossRef]
- Meyers, M.A.; Mishra, A.; Benson, D.J. Mechanical properties of nanocrystalline materials. Prog. Mater. Sci. 2006, 51, 427–556. [Google Scholar] [CrossRef]
- Schiotz, J.; Jacobsen, K.W. A maximum in the strength of nanocrystalline copper. Science 2003, 301, 1357–1359. [Google Scholar] [CrossRef] [PubMed]
- Hu, J.; Shi, Y.N.; Sauvage, X.; Sha, G.; Lu, K. Metallurgy grain boundary stability governs hardening and softening in extremely fine nanograined metals. Science 2017, 355, 1292–1296. [Google Scholar] [CrossRef]
- Qian, L.H.; Wang, S.C.; Zhao, Y.H.; Lu, K. Microstrain effect on thermal properties of nanocrystalline Cu. Acta Mater. 2002, 50, 3425–3434. [Google Scholar] [CrossRef]
- Weissmuller, J. Alloy effects in nanostructures. Nanostruct. Mater. 1993, 3, 261–272. [Google Scholar] [CrossRef]
- Weissmuller, J. Alloy thermodynamics in nanostructures. J. Mater. Res. 1994, 9, 4–7. [Google Scholar] [CrossRef]
- Kirchheim, R. Grain coarsening inhibited by solute segregation. Acta Mater. 2002, 50, 413–419. [Google Scholar] [CrossRef]
- Akiyama, T.; Fukushima, H. Recent study on the mechanism of the electrodeposition of iron-group metal-alloys. ISIJ Int. 1992, 32, 787–798. [Google Scholar] [CrossRef]
- Brenner, A. Electrodeposition of Alloys: Principles and Practice; Academic Press: New York, NY, USA, 1963. [Google Scholar]
- Donten, M.; Cesiulis, H.; Stojek, Z. Electrodeposition of amorphous/nanocrystalline and polycrystalline Ni-Mo alloys from pyrophosphate baths. Electrochim. Acta 2005, 50, 1405–1412. [Google Scholar] [CrossRef]
- Yamasaki, T. High-strength nanocrystalline Ni-W alloys produced by electrodeposition and their embrittlement behaviors during grain growth. Scr. Mater. 2001, 44, 1497–1502. [Google Scholar] [CrossRef]
- Chassaing, E.; Portail, N.; Levy, A.F.; Wang, G. Characterisation of electrodeposited nanocrystaltine Ni-Mo alloys. J. Appl. Electrochem. 2004, 34, 1085–1091. [Google Scholar] [CrossRef]
- Hu, J.; Zheng, X.G.; Shi, Y.N.; Lu, K. Effect of a mixture of saccharin and 2-butyne-1,4-diol on electrodeposition of nano-grained Ni-Mo alloys. J. Electrochem. Soc. 2017, 164, D348–D353. [Google Scholar] [CrossRef]
- Kapoor, G.; Peter, L.; Fekete, E.; Labar, J.L.; Gubicza, J. The influence of Mo addition on the microstructure and its thermal stability for electrodeposited Ni films. Mater. Charact. 2018, 145, 563–572. [Google Scholar] [CrossRef]
- Dietz, G.; Laska, T.; Schneider, H.D.; Stein, F. The microstructure of amorphous and microcrystalline electrodeposited Ni-P alloys. J. Less Common Met. 1988, 145, 573–580. [Google Scholar] [CrossRef]
- Andricacos, P.C.; Arana, C.; Tabib, J.; Dukovic, J.; Romankiw, L.T. Electrodeposition of nickel-iron alloys 1. Effect of agitation. J. Electrochem. Soc. 1989, 136, 1336–1340. [Google Scholar] [CrossRef]
- Cheung, C.; Djuanda, F.; Erb, U.; Palumbo, G. Electrodeposition of nanocrystalline Ni-Fe alloys. Nanostruct. Mater. 1995, 5, 513–523. [Google Scholar] [CrossRef]
- Landolt, D. Electrochemical and materials science aspects of alloy deposition. Electrochim. Acta 1994, 39, 1075–1090. [Google Scholar] [CrossRef]
- Yin, K.M.; Wei, J.H.; Fu, J.R.; Popov, B.N.; Popova, S.N.; White, R.E. Mass-transport effects on the electrodeposition of iron-nickel alloys at the presence of additives. J. Appl. Electrochem. 1995, 25, 543–555. [Google Scholar] [CrossRef]
- Koch, C.C.; Scattergood, R.O.; Darling, K.A.; Semones, J.E. Stabilization of nanocrystalline grain sizes by solute additions. J. Mater. Sci. 2008, 43, 7264–7272. [Google Scholar] [CrossRef]
- Murdoch, H.A.; Schuh, C.A. Estimation of grain boundary segregation enthalpy and its role in stable nanocrystalline alloy design. J. Mater. Res. 2013, 28, 2154–2163. [Google Scholar] [CrossRef]
- Chookajorn, T.; Murdoch, H.A.; Schuh, C.A. Design of stable nanocrystalline alloys. Science 2012, 337, 951–954. [Google Scholar] [CrossRef]
- Brenner, A.; Couch, D.E.; Williams, E.K. Electrodeposition of alloys of phosphorus with nickel or cobalt. J. Res. Nat. Bur. Stand. 1950, 44, 109–122. [Google Scholar] [CrossRef]
- Chang, L.; Kao, P.W.; Chen, C.H. Strengthening mechanisms in electrodeposited Ni-P alloys with nanocrystalline grains. Scr. Mater. 2007, 56, 713–716. [Google Scholar] [CrossRef]
- Pearson, W.B. The Cristal Chemistry and Physics of Metals and Alloys; Wiley-Interscience: New York, NY, USA, 1972. [Google Scholar]
- Bakonyi, I. Atomic volumes and local structure of metallic glasses. Acta Mater. 2005, 53, 2509–2520. [Google Scholar] [CrossRef]
- Trelewicz, J.R.; Schuh, C.A. Grain boundary segregation and thermodynamically stable binary nanocrystalline alloys. Phys. Rev. B 2009, 79, 13. [Google Scholar] [CrossRef]
- Tian, Y.J.; Xu, B.; Yu, D.L.; Ma, Y.M.; Wang, Y.B.; Jiang, Y.B.; Hu, W.T.; Tang, C.C.; Gao, Y.F.; Luo, K.; et al. Ultrahard nanotwinned cubic boron nitride. Nature 2013, 493, 385–388. [Google Scholar] [CrossRef]
- Liu, X.C.; Zhang, H.W.; Lu, K. Strain-induced ultrahard and ultrastable nanolaminated structure in nickel. Science 2013, 342, 337–340. [Google Scholar] [CrossRef] [PubMed]
- Huang, X.X.; Hansen, N.; Tsuji, N. Hardening by annealing and softening by deformation in nanostructured metals. Science 2006, 312, 249–251. [Google Scholar] [CrossRef] [PubMed]
- Weertman, J.R.; Sanders, P.G. Plastic deformation of nanocrystalline metals. Solid State Phenom. 1993, 35–36, 249–262. [Google Scholar] [CrossRef]
- Wang, Y.M.; Cheng, S.; Wei, Q.M.; Ma, E.; Nieh, T.G.; Hamza, A. Effects of annealing and impurities on tensile properties of electrodeposited nanocrystalline Ni. Scr. Mater. 2004, 51, 1023–1028. [Google Scholar] [CrossRef]
- Rupert, T.J.; Trelewicz, J.R.; Schuh, C.A. Grain boundary relaxation strengthening of nanocrystalline Ni–W alloys. J. Mater. Res. 2012, 27, 1285–1294. [Google Scholar] [CrossRef]
- Hasnaoui, A.; Van Swygenhoven, H.; Derlet, P.M. On non-equilibrium grain boundaries and their effect on thermal and mechanical behaviour: A molecular dynamics computer simulation. Acta Mater. 2002, 50, 3927–3939. [Google Scholar] [CrossRef]
- Bakonyi, I.; Cziraki, A.; Nagy, I.; Hosso, M. Crystallization characteristics of electrodeposited amorphous Ni-P alloys. Z. Metallkd. 1986, 77, 425–432. [Google Scholar]
- Dake, J.M.; Krill, C.E. Sudden loss of thermal stability in Fe-based nanocrystalline alloys. Scr. Mater. 2012, 66, 390–393. [Google Scholar] [CrossRef]
- Krill, C.E.; Ehrhardt, H.; Birringer, R. Thermodynamic stabilization of nanocrystallinity. Z. Metallkd. 2005, 96, 1134–1141. [Google Scholar] [CrossRef]


| Ni-Mo | Ni-P | |||
|---|---|---|---|---|
| NiSO4·6H2O | 60 g/L | NiSO4·6H2O | 150 g/L | |
| Na3C6H5O7·2H2O | 80 g/L | NiCl2·6H2O | 45 g/L | |
| Composition | NaMoO4·2H2O | 0.5–8.0 g/L | H3PO4 | 40 g/L |
| Saccharin | 2 g/L | H3PO3 | 0.3–5.0 g/L | |
| 2-butyne-1,4-diol | 0.15 g/L | SDS | 0.2 g/L | |
| pH | ~9 | ~4 | ||
| Temperature (°C) | 35 | 50 | ||
| Current density (mA/cm2) | 30 | 50 | ||
© 2019 by the authors. Licensee MDPI, Basel, Switzerland. This article is an open access article distributed under the terms and conditions of the Creative Commons Attribution (CC BY) license (http://creativecommons.org/licenses/by/4.0/).
Share and Cite
Zheng, X.; Hu, J.; Li, J.; Shi, Y. Achieving Ultrahigh Hardness in Electrodeposited Nanograined Ni-Based Binary Alloys. Nanomaterials 2019, 9, 546. https://doi.org/10.3390/nano9040546
Zheng X, Hu J, Li J, Shi Y. Achieving Ultrahigh Hardness in Electrodeposited Nanograined Ni-Based Binary Alloys. Nanomaterials. 2019; 9(4):546. https://doi.org/10.3390/nano9040546
Chicago/Turabian StyleZheng, Xiangui, Jian Hu, Jiongxian Li, and Yinong Shi. 2019. "Achieving Ultrahigh Hardness in Electrodeposited Nanograined Ni-Based Binary Alloys" Nanomaterials 9, no. 4: 546. https://doi.org/10.3390/nano9040546
APA StyleZheng, X., Hu, J., Li, J., & Shi, Y. (2019). Achieving Ultrahigh Hardness in Electrodeposited Nanograined Ni-Based Binary Alloys. Nanomaterials, 9(4), 546. https://doi.org/10.3390/nano9040546