A Microwave-Assisted Synthesis of Zinc Oxide Nanocrystals Finely Tuned for Biological Applications

 ,
,  ,
,  ,
,  , and
, and
Abstract
:1. Introduction
2. Materials and Methods
2.1. Synthesis, Functionalization and Labelling of ZnO Nanocrystals.
2.2. Characterization
2.3. In Vitro Mammalian Cell Culture Biological Test
3. Results and Discussion
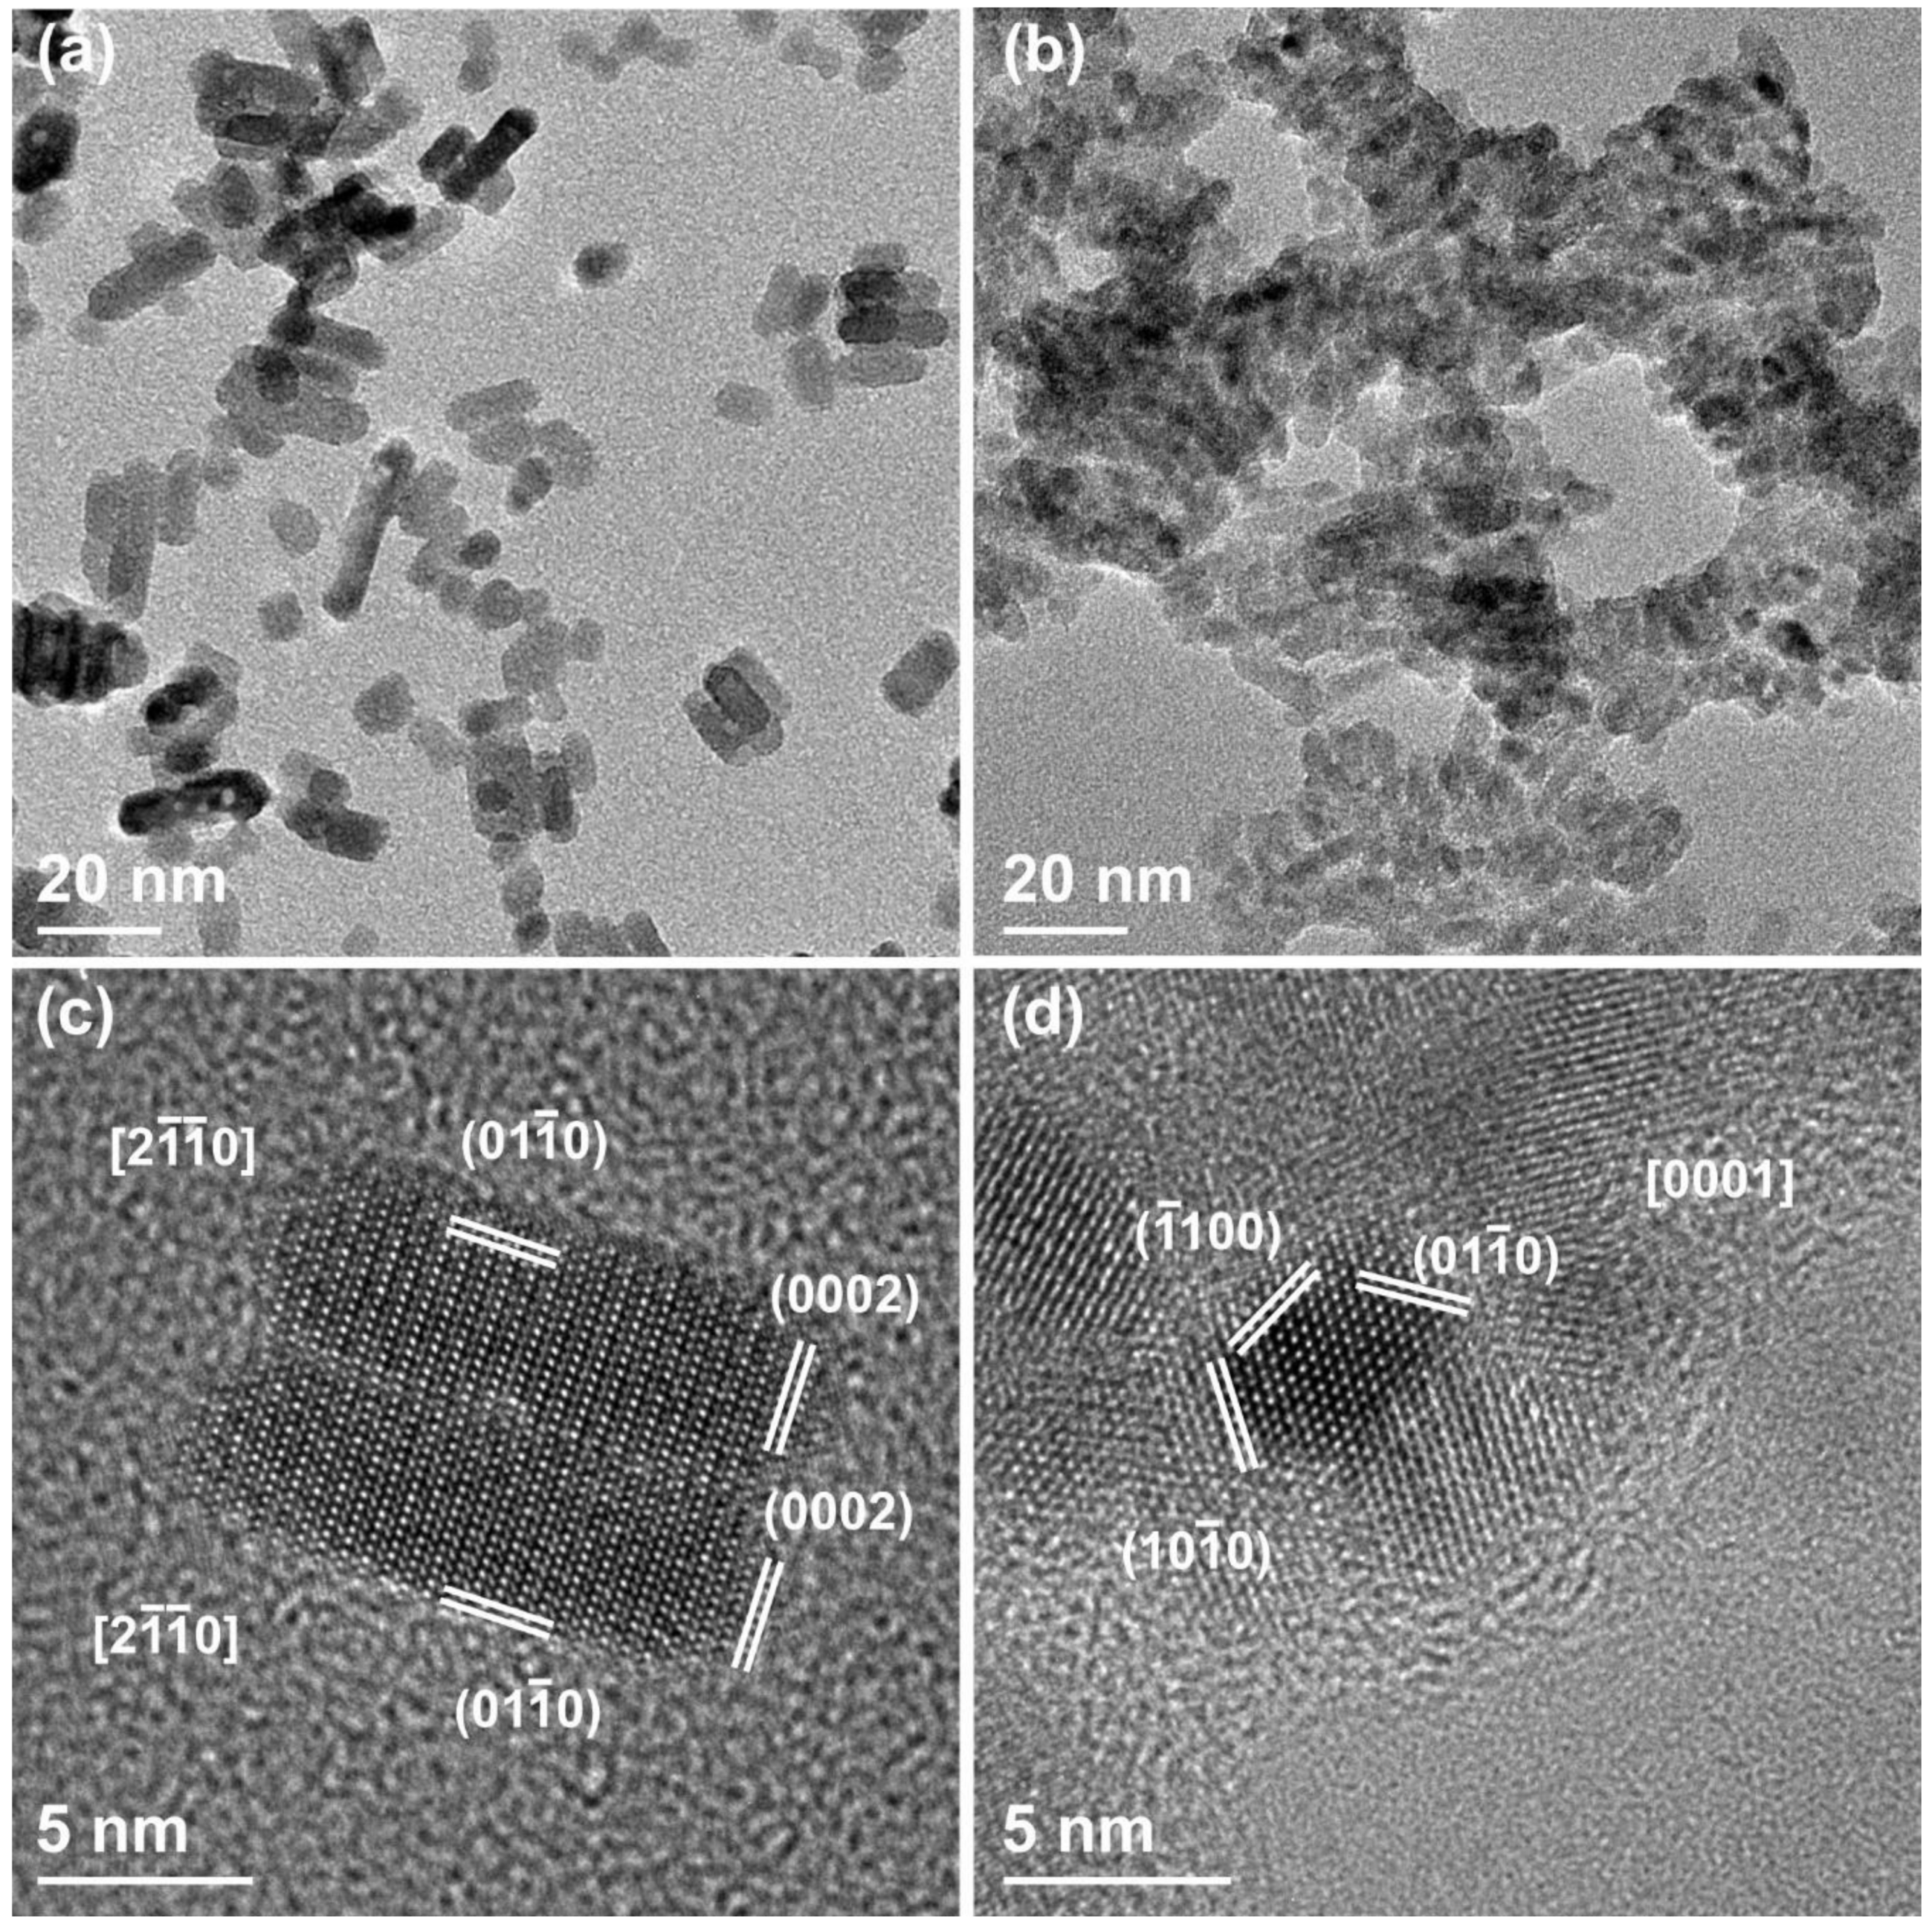
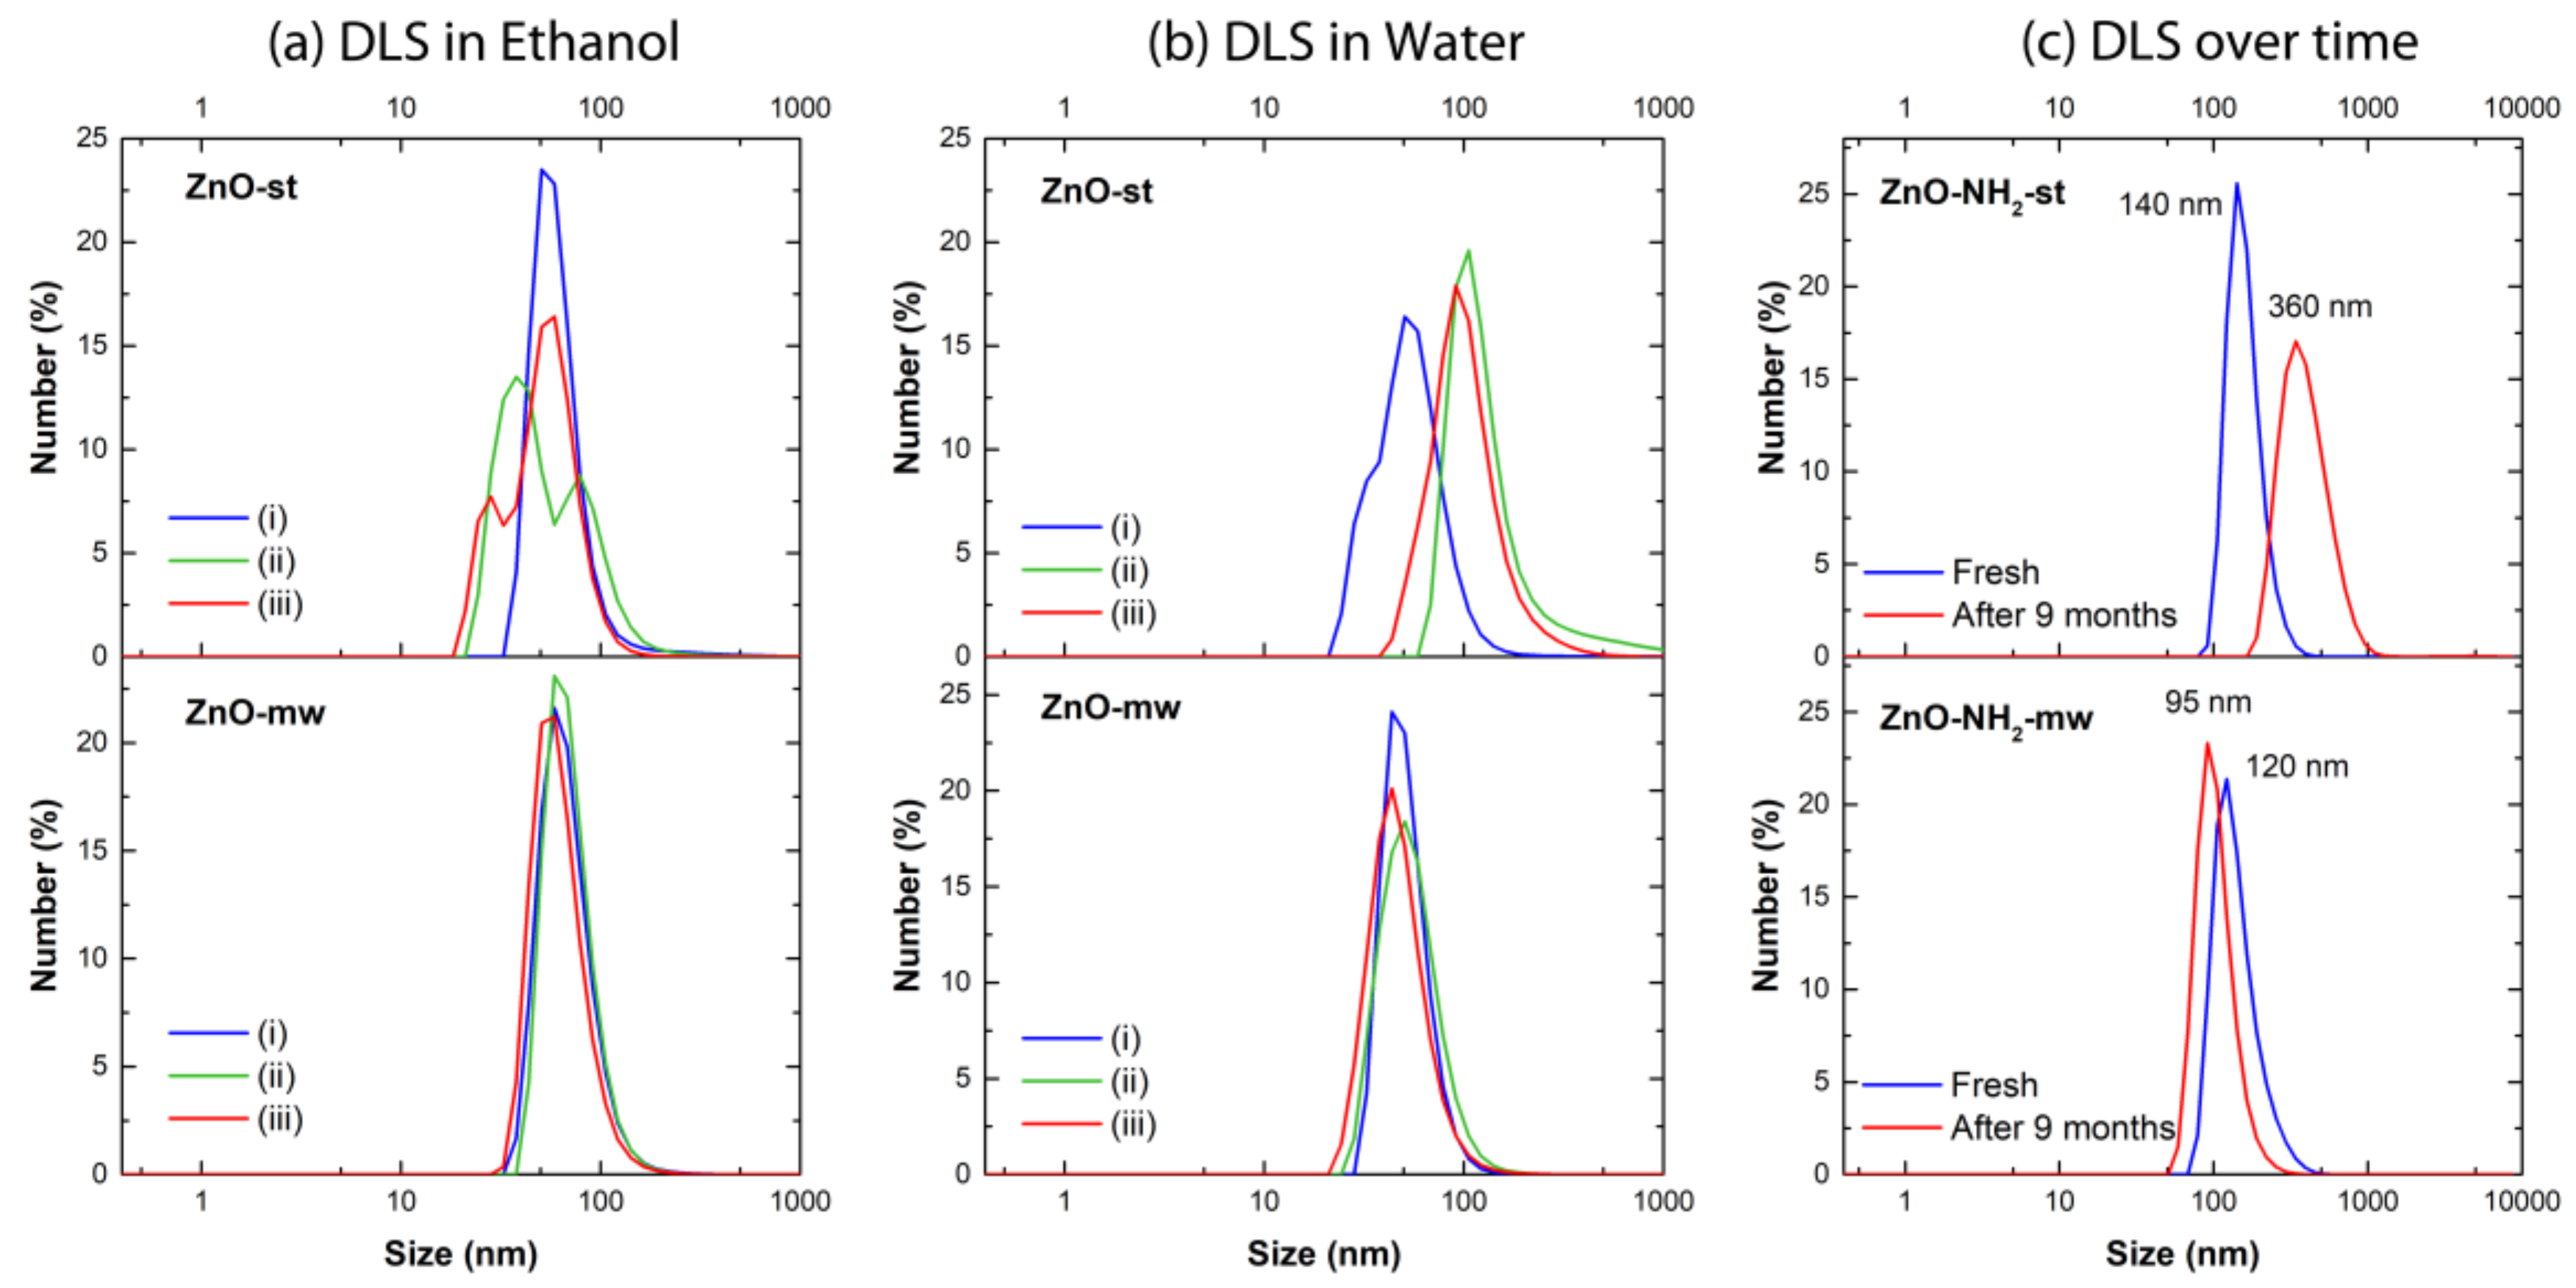
3.1. Morphological and Structural Characterization of ZnO Nanocrystals (NCs)
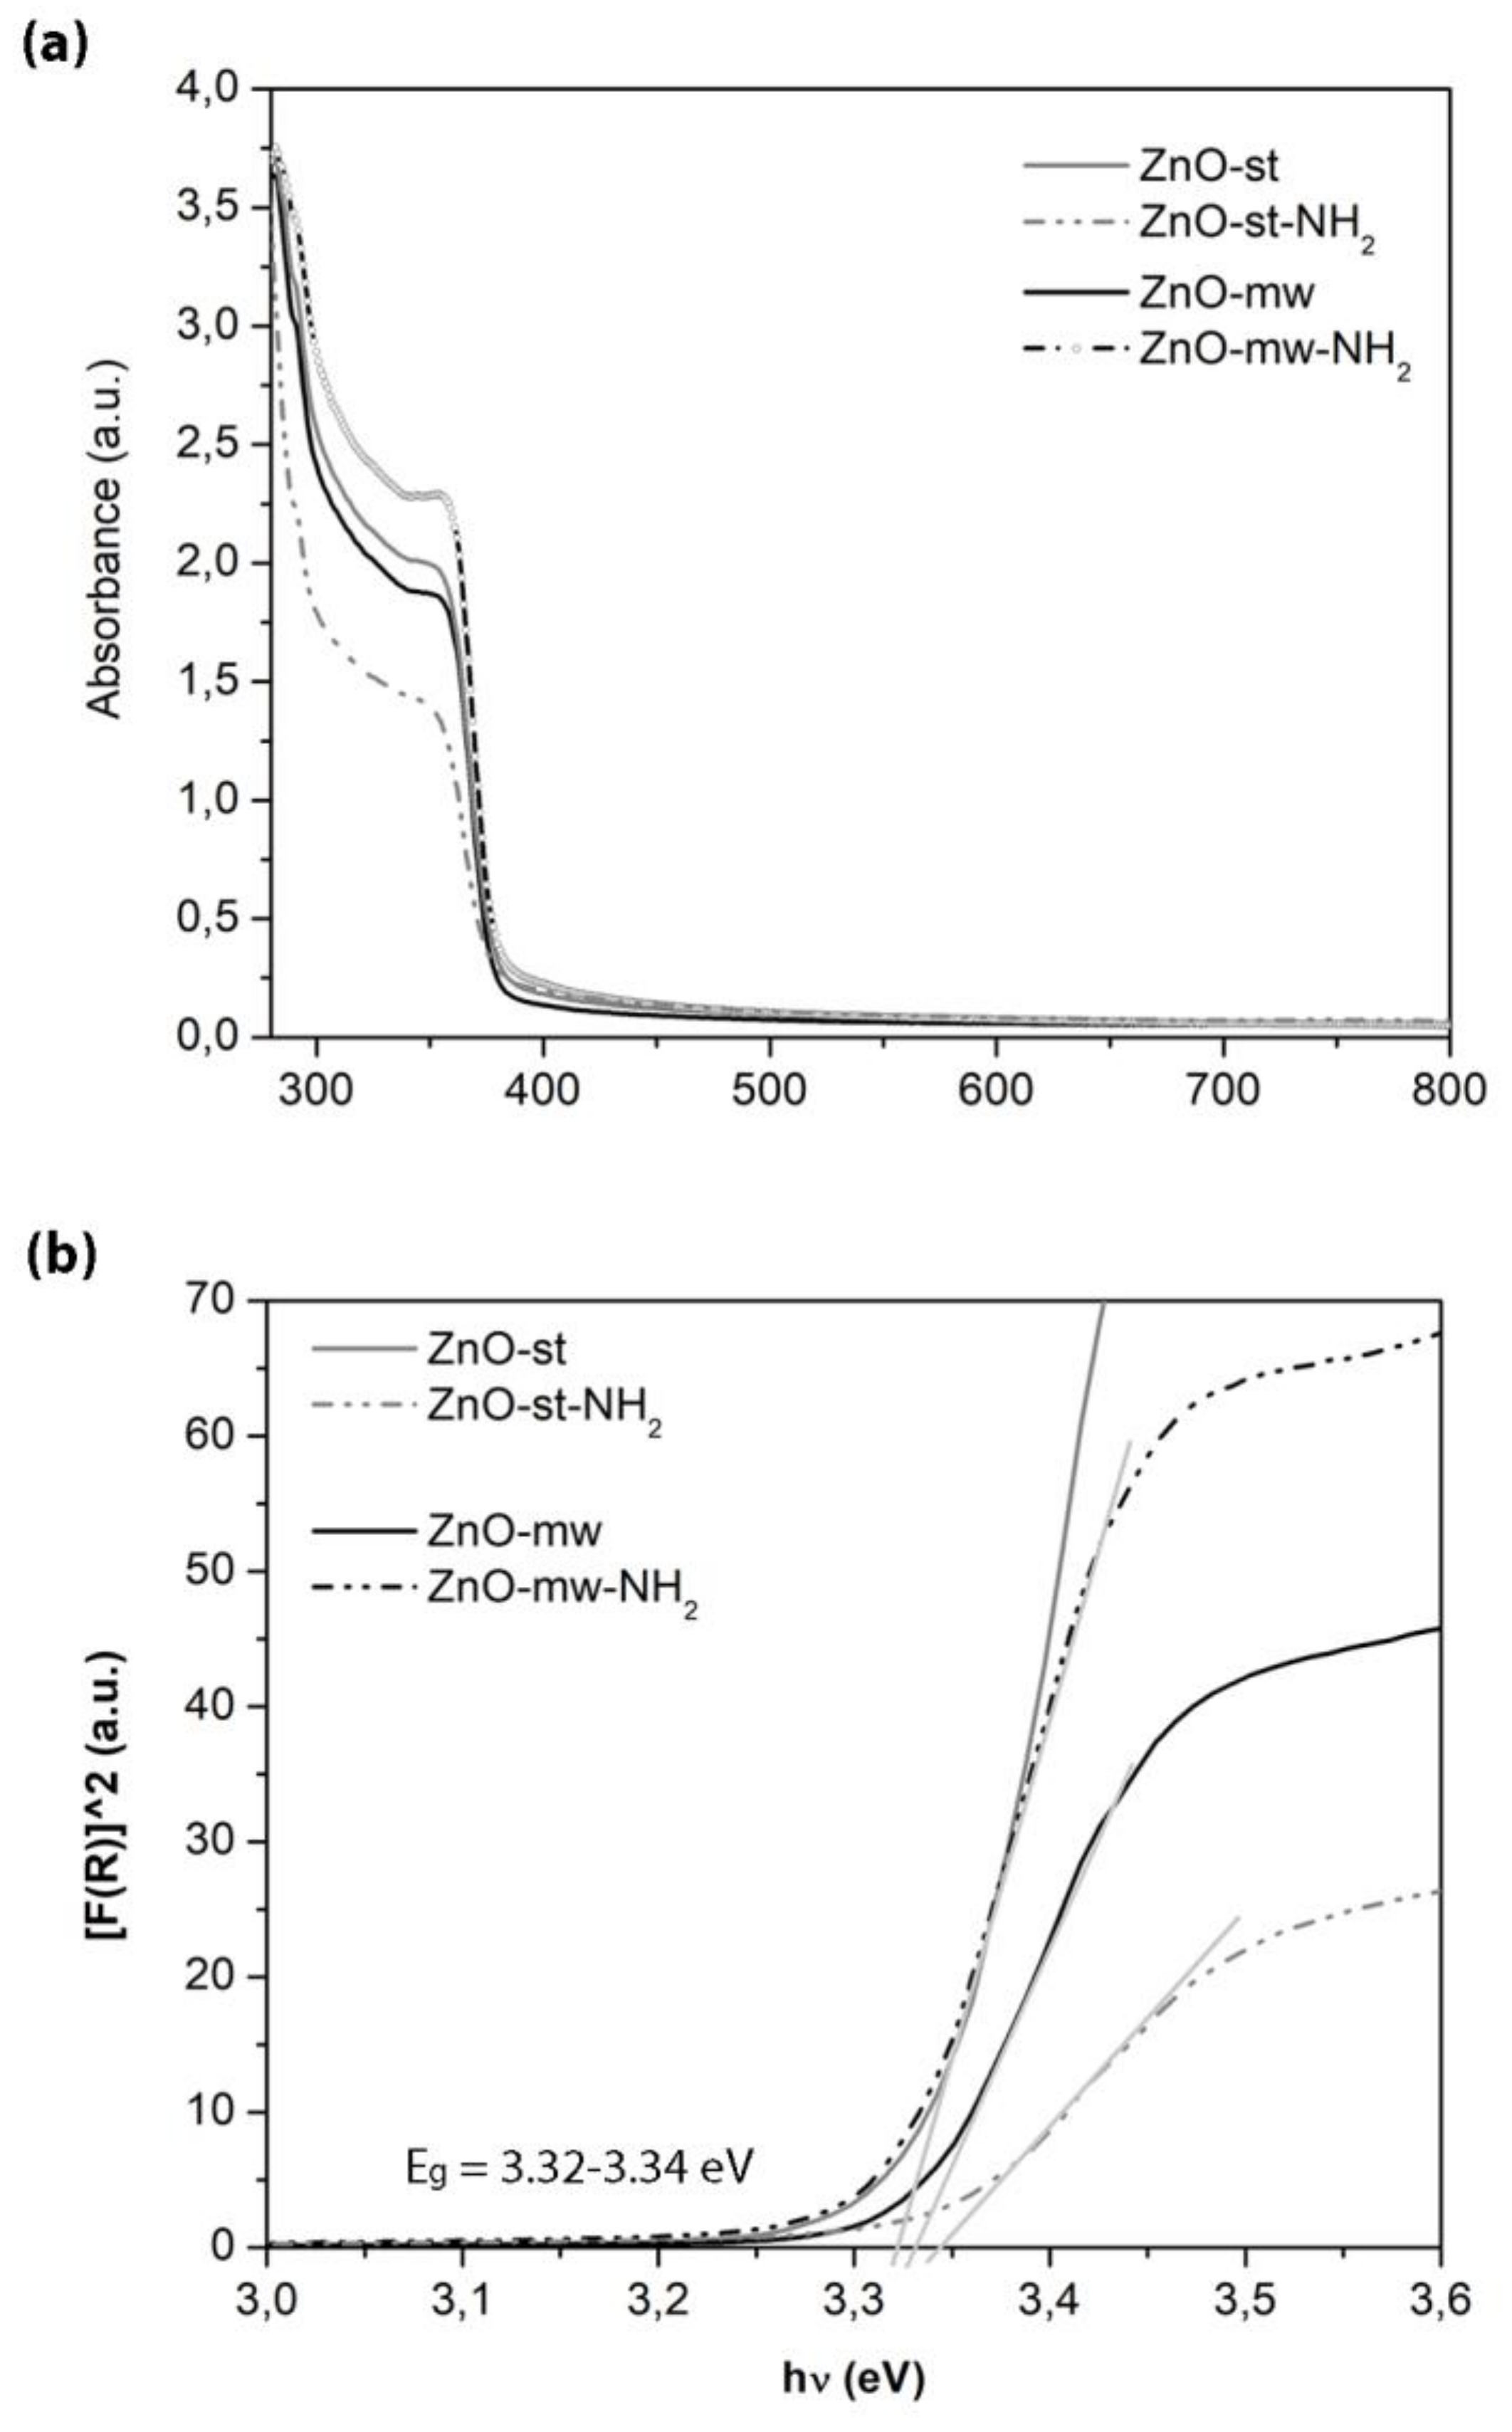
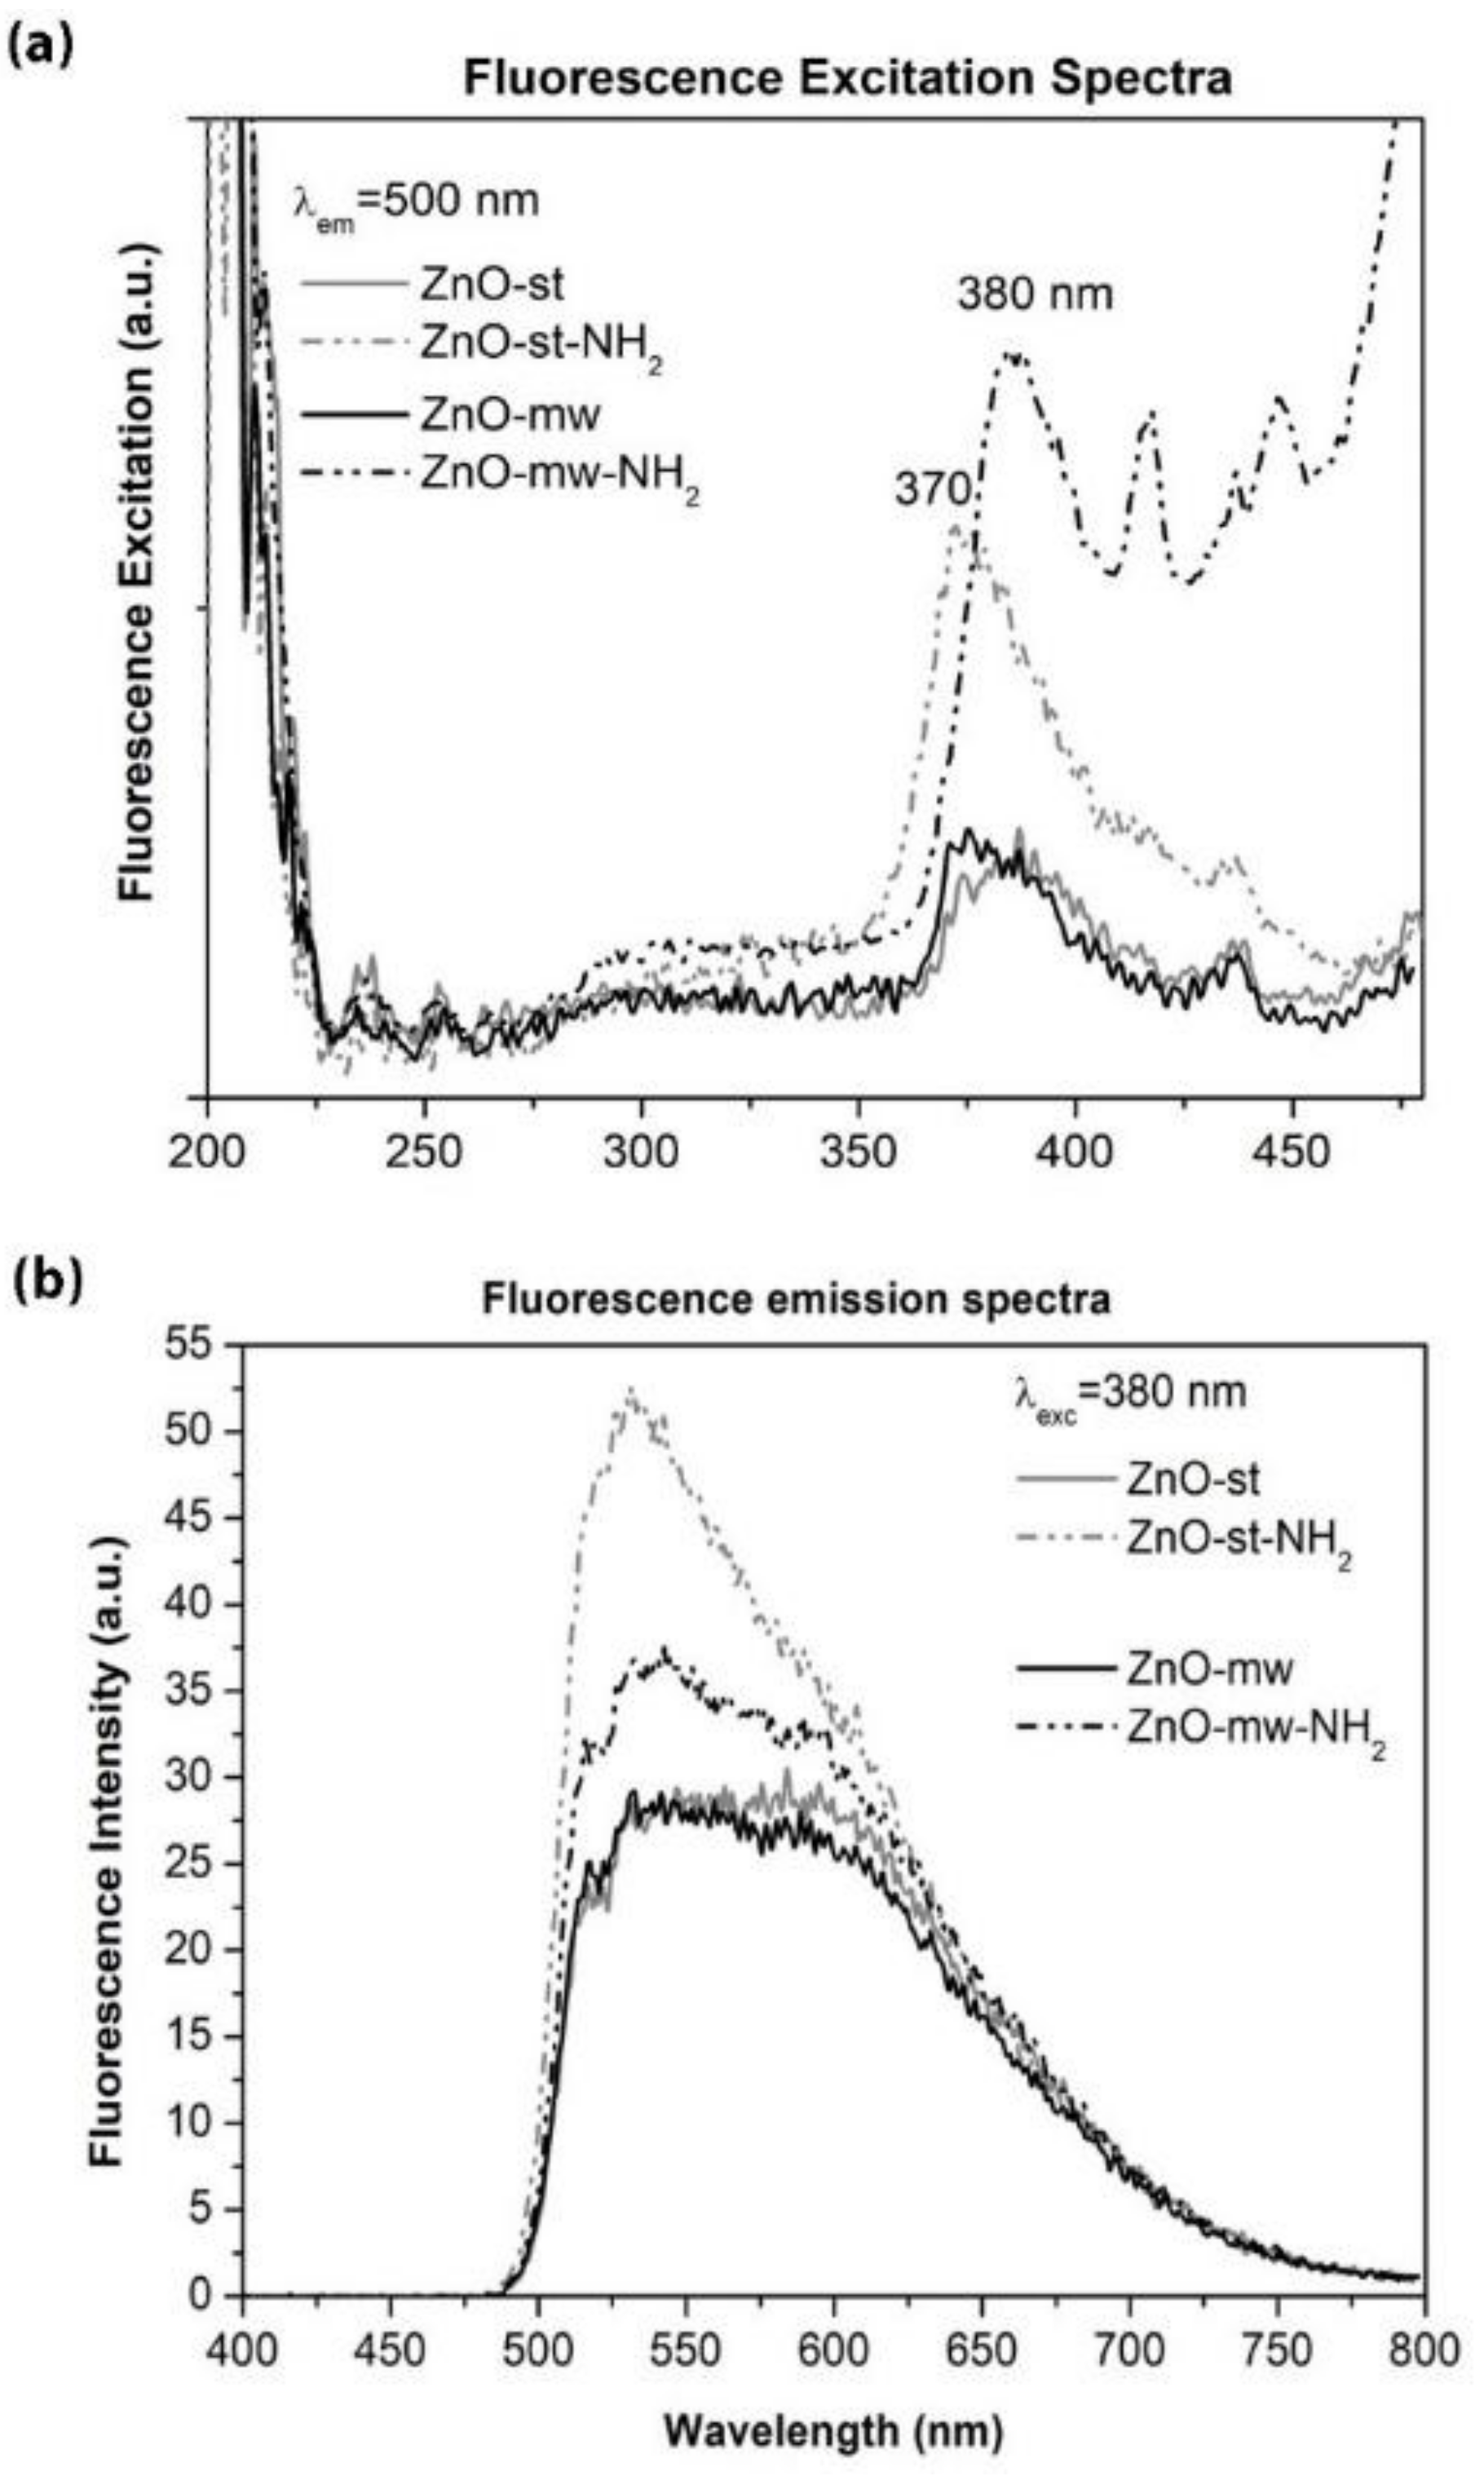
3.2. Optical and Luminescent Properties of ZnO NCs
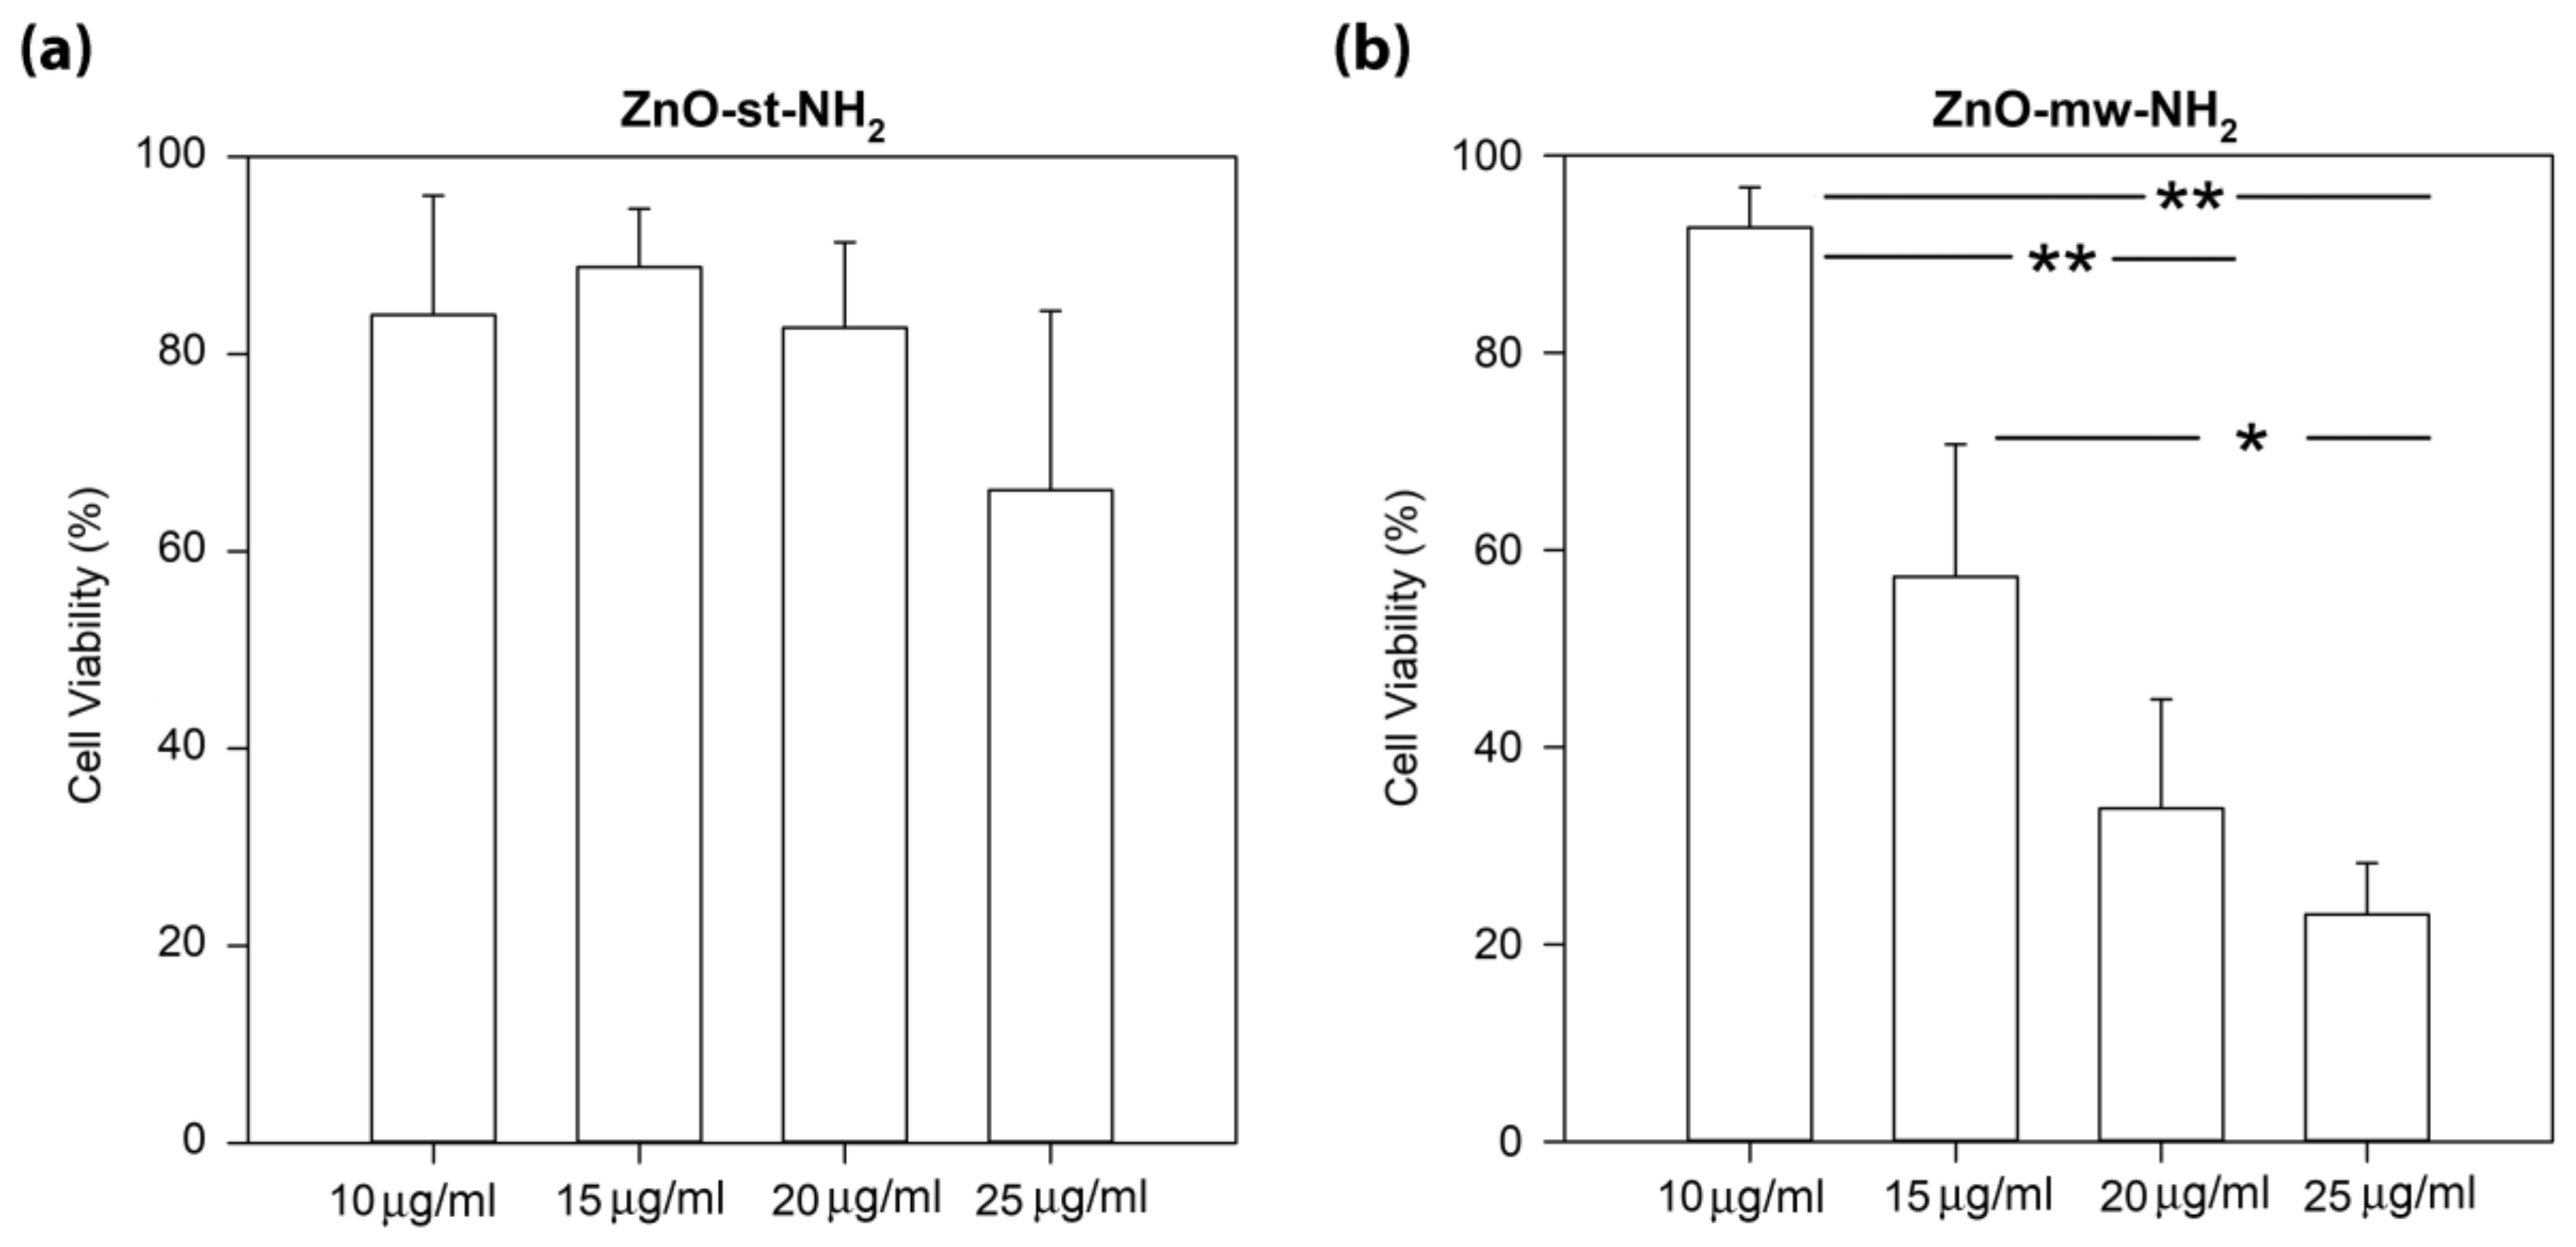
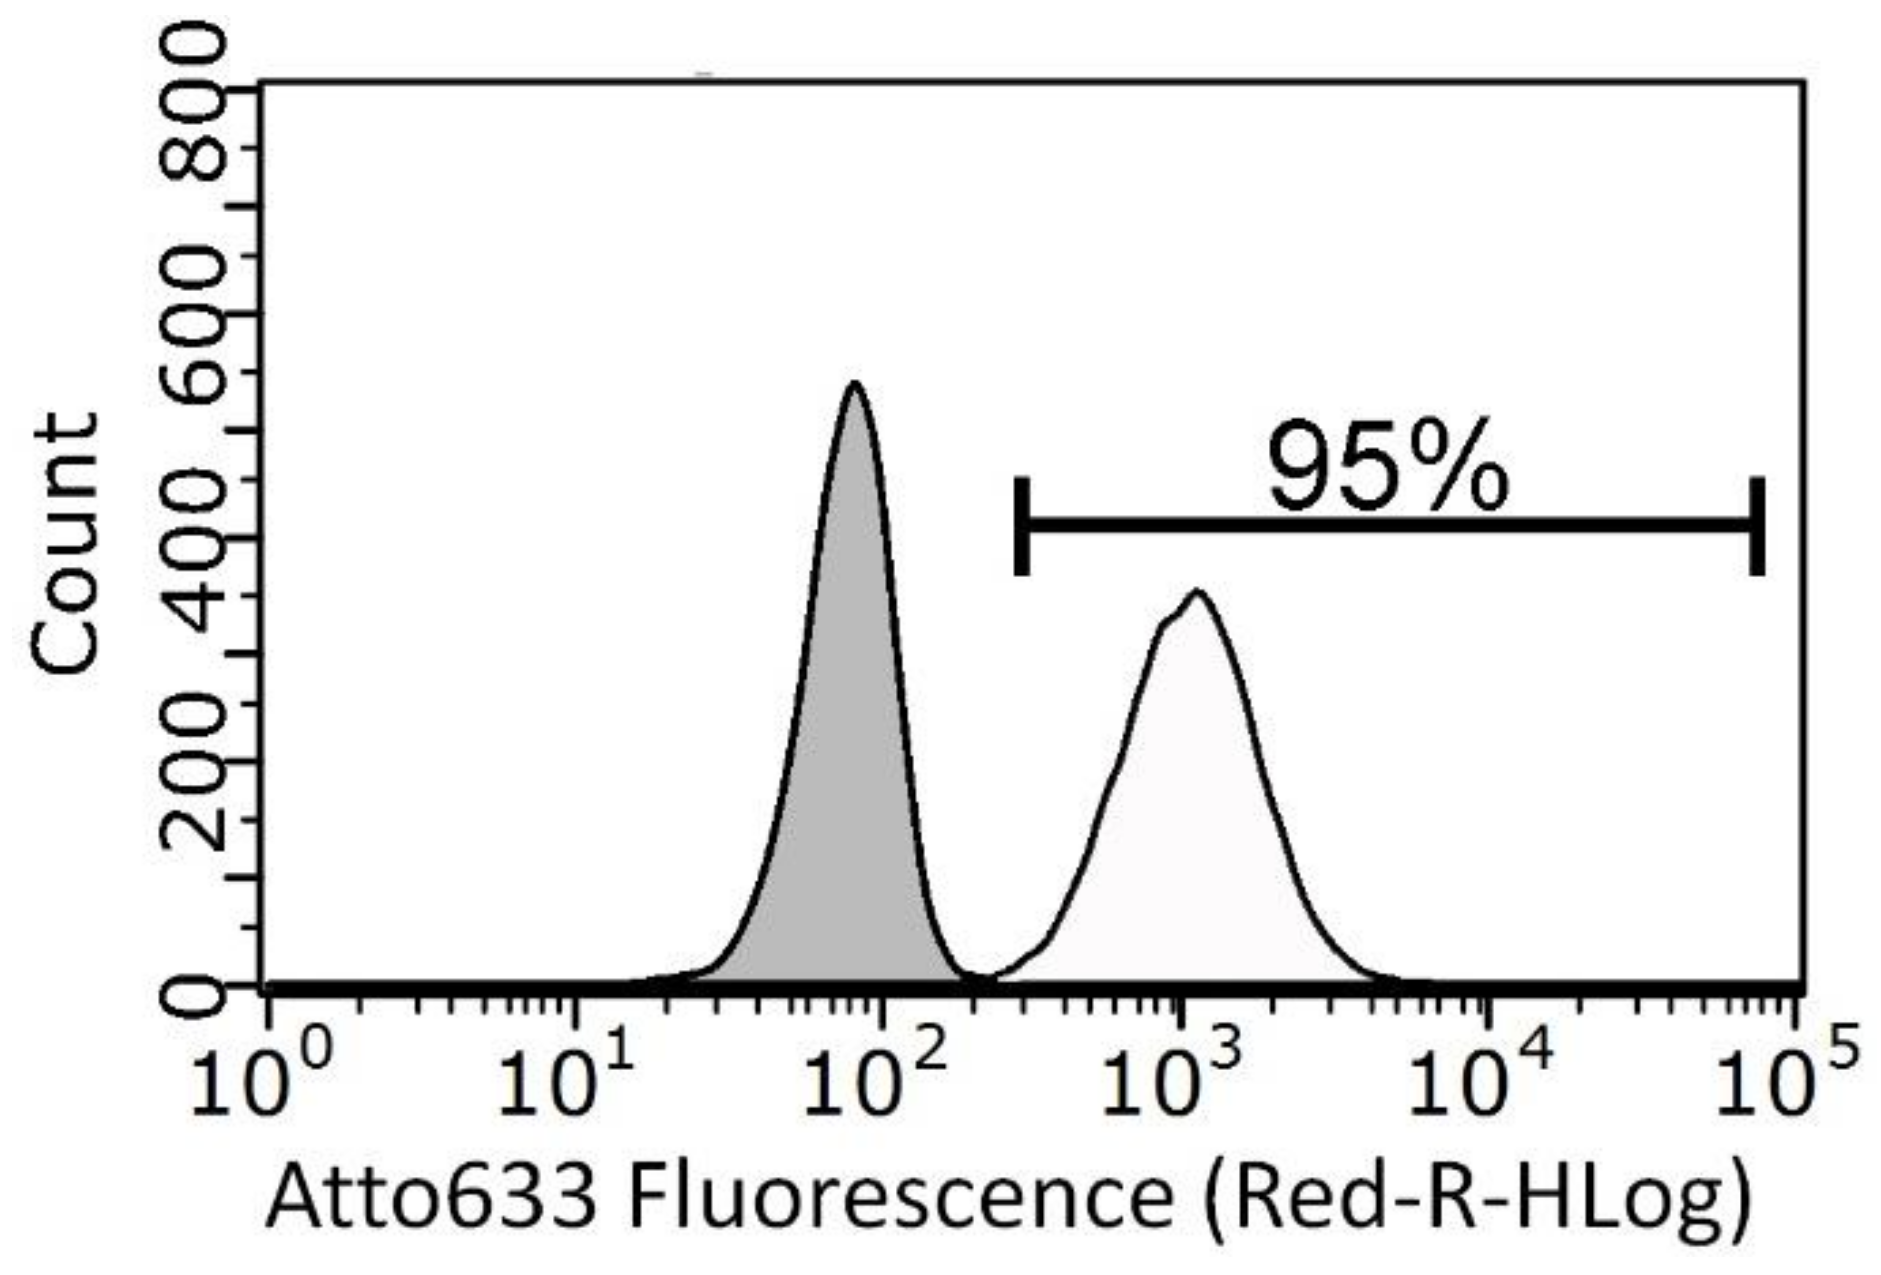
3.3. Cytotoxicity and Cell Internalization of ZnO Nanoparticles (NPs)
4. Conclusions
Author Contributions
Funding
Acknowledgments
Conflicts of Interest
References
- Kim, D.; Shin, K.; Kwon, S.G.; Hyeon, T. Synthesis and biomedical applications of multifunctional nanoparticles. Adv. Mater. 2018, 30, 1802309. [Google Scholar] [CrossRef]
- Zhu, P.; Weng, Z.; Li, X.; Liu, X.; Wu, S.; Yeung, K.W.K.; Wang, X.; Cui, Z.; Yang, X.; Chu, P.K. Biomedical applications of functionalized ZnO nanomaterials: From biosensors to bioimaging. Adv. Mater. Interfaces 2016, 3, 1500494. [Google Scholar] [CrossRef]
- Racca, L.; Canta, M.; Dumontel, B.; Ancona, A.; Limongi, T.; Garino, N.; Laurenti, M.; Canavese, G.; Cauda, V. Zinc oxide nanostructures in biomedicine. In Smart Nanoparticles for Biomedicine; Ciofani, G., Ed.; Elsevier: Amsterdam, Netherlands, 2018; pp. 171–187. [Google Scholar]
- Zhang, L.; Yin, L.; Wang, C.; Lun, N.; Qi, Y.; Xiang, D. Origin of visible photoluminescence of ZnO quantum dots: Defect-dependent and size-dependent. J. Phys. Chem. C 2010, 114, 9651–9658. [Google Scholar] [CrossRef]
- Huang, X.; Zheng, X.; Xu, Z.; Yi, C. Zno-based nanocarriers for drug delivery application: From passive to smart strategies. Int. J. Pharm. 2017, 534, 190–194. [Google Scholar] [CrossRef]
- Laurenti, M.; Cauda, V. Gentamicin-releasing mesoporous zno structures. Materials 2018, 11, 314. [Google Scholar] [CrossRef]
- Cauda, V.; Gazia, R.; Porro, S.; Stassi, S.; Canavese, G.; Roppolo, I.; Chiolerio, A. Nanostructured ZnO materials: Synthesis, properties and applications. In Handbook of Nanomaterial Properties; Bhushan, B.L.D., Schricker, S.R., Sigmund, W., Zauscher, S., Eds.; Springer: Berlin/Heidelberg, Germany, 2014; Volume XXVII. [Google Scholar]
- Garino, N.; Lamberti, A.; Gazia, R.; Chiodoni, A.; Gerbaldi, C. Cycling behaviour of sponge-like nanostructured ZnO as thin-film li-ion battery anodes. J. Alloy Compd. 2014, 615, S454–S458. [Google Scholar] [CrossRef]
- Cauda, V.; Pugliese, D.; Garino, N.; Sacco, A.; Bianco, S.; Bella, F.; Lamberti, A.; Gerbaldi, C. Multi-functional energy conversion and storage electrodes using flower-like zinc oxide nanostructures. Energy 2014, 65, 639–646. [Google Scholar] [CrossRef]
- Laurenti, M.; Stassi, S.; Canavese, G.; Cauda, V. Surface engineering of nanostructured ZnO surfaces. Adv. Mater. Interfaces 2017, 4, 1600758. [Google Scholar] [CrossRef]
- Jiang, J.; Pi, J.; Cai, J. The advancing of zinc oxide nanoparticles for biomedical applications. Bioinorg. Chem. Appl. 2018, 18. [Google Scholar] [CrossRef]
- Martínez-Carmona, M.; Gun’ko, Y.; Vallet-Regí, M. ZnO nanostructures for drug delivery and theranostic applications. Nanomaterials 2018, 8, 268. [Google Scholar] [CrossRef]
- Ali, A.; Phull, A.R.; Zia, M. Elemental zinc to zinc nanoparticles: Is ZnO NPs crucial for life? Synthesis, toxicological and environmental concerns. Nanotechnol. Rev. 2018, 7, 413–441. [Google Scholar] [CrossRef]
- Shen, C.; James, S.A.; de Jonge, M.D.; Turney, T.W.; Wright, P.F.A.; Feltis, B.N. Relating cytotoxicity, zinc ions, and reactive oxygen in ZnO nanoparticle-exposed human immune cells. Toxicol. Sci. 2013, 136, 120–130. [Google Scholar] [CrossRef]
- Han, L.; Zhai, Y.; Liu, Y.; Hao, L.; Guo, H. Comparison of the in vitro and in vivo toxic effects of three sizes of zinc oxide (ZnO) particles using flounder gill (fg) cells and zebrafish embryos. J. Ocean Univ. China 2017, 16, 93–106. [Google Scholar] [CrossRef]
- Duraimurugan, J.; Kumar, G.S.; Venkatesh, M.; Maadeswaran, P.; Girija, E.K. Morphology and size controlled synthesis of zinc oxide nanostructures and their optical properties. J. Mater. Sci. Mater. Electron. 2018, 29, 9339–9346. [Google Scholar] [CrossRef]
- Kalantari Bolaghi, Z.; Masoudpanah, S.M.; Hasheminiasari, M. Photocatalytic properties of ZnO powders synthesized by conventional and microwave-assisted solution combustion method. J. Sol-Gel Sci. Technol. 2018, 86, 711–718. [Google Scholar] [CrossRef]
- Chaudhary, S.; Kaur, Y.; Umar, A.; Chaudhary, G.R. Ionic liquid and surfactant functionalized ZnO nanoadsorbent for recyclable proficient adsorption of toxic dyes from waste water. J. Mol. Liq. 2016, 224, 1294–1304. [Google Scholar] [CrossRef]
- Cravotto, G.; Carnaroglio, D. Microwave Chemistry; Springer Book Series: Berlin, Germany; Boston, MA, USA, 2017. [Google Scholar]
- Horikoshi, S.; Serpone, N. Microwaves in Nanoparticle Synthesis: Fundamentals and Applications; Wiley-VCH Verlag GmbH & Co., KGaA: Weinheim, Germany, 2013. [Google Scholar]
- Zhu, Y.-J.; Chen, F. Microwave-assisted preparation of inorganic nanostructures in liquid phase. Chem. Rev. 2014, 114, 6462–6555. [Google Scholar] [CrossRef]
- Quirino, M.R.; Oliveira, M.J.C.; Keyson, D.; Lucena, G.L.; Oliveira, J.B.L.; Gama, L. Synthesis of zinc oxide by microwave hydrothermal method for application to transesterification of soybean oil (biodiesel). Mater. Chem. Phys. 2017, 185, 24–30. [Google Scholar] [CrossRef]
- Wojnarowicz, J.; Chudoba, T.; Gierlotka, S.; Lojkowski, W. Effect of microwave radiation power on the size of aggregates of ZnO NPs prepared using microwave solvothermal synthesis. Nanomaterials 2018, 8, 343. [Google Scholar] [CrossRef]
- Wojnarowicz, J.; Chudoba, T.; Koltsov, I.; Gierlotka, S.; Dworakowska, S.; Lojkowski, W. Size control mechanism of ZnO nanoparticles obtained in microwave solvothermal synthesis. Nanotechnology 2018, 29, 065601. [Google Scholar] [CrossRef]
- Dumontel, B.; Canta, M.; Engelke, H.; Chiodoni, A.; Racca, L.; Ancona, A.; Limongi, T.; Canavese, G.; Cauda, V. Enhanced biostability and cellular uptake of zinc oxide nanocrystals shielded with a phospholipid bilayer. J. Mater. Chem. B 2017, 5, 8799–8813. [Google Scholar] [CrossRef] [PubMed]
- Sanginario, A.; Cauda, V.; Bonanno, A.; Sapienza, S.; Demarchi, D. An electronic platform for real-time detection of bovine serum albumin by means of amine-functionalized zinc oxide microwires. RSC Adv. 2016, 6, 891–897. [Google Scholar] [CrossRef]
- IC50 Calculator. Available online: https://www.Aatbio.Com/tools/ic50-calculator (accessed on 23 October 2018).
- Al-Gaashani, R.; Radiman, S.; Daud, A.R.; Tabet, N.; Al-Douri, Y. XPS and optical studies of different morphologies of ZnO nanostructures prepared by microwave methods. Ceram. Int. 2013, 39, 2283–2292. [Google Scholar] [CrossRef]
- Kotsis, K.; Staemmler, V. Ab initio calculations of the O1s XPS spectra of ZnO and Zn oxo compounds. Phys. Chem. Chem. Phys. 2006, 8, 1490–1498. [Google Scholar] [CrossRef] [PubMed]
- Ogata, K.; Komuro, T.; Hama, K.; Koike, K.; Sasa, S.; Inoue, M.; Yano, M. Characterization of undoped ZnO layers grown by molecular beam epitaxy towards biosensing devices. Phys. Status Solidi 2004, 241, 616–619. [Google Scholar] [CrossRef]
- Kamarulzaman, N.; Kasim, M.F.; Rusdi, R. Band gap narrowing and widening of ZnO nanostructures and doped materials. Nanoscale Res. Lett. 2015, 10, 346. [Google Scholar] [CrossRef]
- Zhang, Z.-Y.; Xiong, H.-M. Photoluminescent ZnO nanoparticles and their biological applications. Materials 2015, 8, 3101. [Google Scholar] [CrossRef]
- Hong, H.; Shi, J.; Yang, Y.; Zhang, Y.; Engle, J.W.; Nickles, R.J.; Wang, X.; Cai, W. Cancer-targeted optical imaging with fluorescent zinc oxide nanowires. Nano Lett. 2011, 11, 3744–3750. [Google Scholar] [CrossRef]
- Norberg, N.S.; Gamelin, D.R. Influence of surface modification on the luminescence of colloidal ZnO nanocrystals. J. Phys. Chem. B 2005, 109, 20810–20816. [Google Scholar] [CrossRef]
- Li, S.; Sun, Z.; Li, R.; Dong, M.; Zhang, L.; Qi, W.; Zhang, X.; Wang, H. ZnO nanocomposites modified by hydrophobic and hydrophilic silanes with dramatically enhanced tunable fluorescence and aqueous ultrastability toward biological imaging applications. Sci. Rep. 2015, 5, 8475. [Google Scholar] [CrossRef]
- Hernández, S.; Cauda, V.; Chiodoni, A.; Dallorto, S.; Sacco, A.; Hidalgo, D.; Celasco, E.; Pirri, C.F. Optimization of 1d ZnO@TiO2 core–shell nanostructures for enhanced photoelectrochemical water splitting under solar light illumination. ACS Appl. Mater. Interfaces 2014, 6, 12153–12167. [Google Scholar] [CrossRef] [PubMed]
- Morales-Flores, N.; Galeazzi, R.; Rosendo, E.; Díaz, T.; Velumani, S.; Pal, U. Morphology control and optical properties of ZnO nanostructures grown by ultrasonic synthesis. Adv. Nano Res. 2013, 1, 59–70. [Google Scholar] [CrossRef]
- Özgür, Ü.; Alivov, Y.I.; Liu, C.; Teke, A.; Reshchikov, M.A.; Doğan, S.; Avrutin, V.; Cho, S.-J.; Morkoç, H. A comprehensive review of ZnO materials and devices. J. Appl. Phys. 2005, 98, 041301. [Google Scholar] [CrossRef]
- Xiong, H.-M. Photoluminescent ZnO nanoparticles modified by polymers. J. Mater. Chem. 2010, 20, 4251–4262. [Google Scholar] [CrossRef]
- Drasler, B.; Vanhecke, D.; Rodriguez-Lorenzo, L.; Petri-Fink, A.; Rothen-Rutishauser, B. Quantifying nanoparticle cellular uptake: Which method is best? Nanomedicine 2017, 12, 1727–1744. [Google Scholar] [CrossRef] [PubMed]


| Ethanol | Water | Ethanol | ||||||||
|---|---|---|---|---|---|---|---|---|---|---|
| Sample | Av. diameter (nm) | PDI | Av. diameter (nm) | PDI | Sample | Av. diameter (nm) | PDI | |||
| ZnO-st NCs | (i) | 65 | 0.28 | (i) | 56 | 0.52 | ZnO-NH2 st NCs | Fresh | 162 | 0.26 |
| (ii) | 60 * | 0.38 | (ii) | 155 | 0.36 | After 9 months | 410 | 0.25 | ||
| (iii) | 53 ** | 0.38 | (iii) | 108 | 0.18 | |||||
| ZnO-mw NCs | (i) | 70 | 0.19 | (i) | 52 | 0.12 | ZnO-NH2 .mw NCs | Fresh | 144 | 0.11 |
| (ii) | 71 | 0.14 | (ii) | 56 | 0.20 | After 9 months | 105 | 0.11 | ||
| (iii) | 64 | 0.18 | (iii) | 49 | 0.26 | |||||
| Sample | Atomic concentration (at.%) | |||||
|---|---|---|---|---|---|---|
| C | O | N | Zn | Zn/O | ||
| ZnO-mw NCs | 26.3 | 5.3 * | 34.3 ** | - | 34.1 | 0.99 |
| ZnO-st NCs | 27.5 | 4.7 | 35.6 | - | 32.2 | 0.90 |
| ZnO-mw-NH2 NCs | 25.4 | 1.7 | 38.5 | 2.4 | 32.0 | 0.83 |
© 2019 by the authors. Licensee MDPI, Basel, Switzerland. This article is an open access article distributed under the terms and conditions of the Creative Commons Attribution (CC BY) license (http://creativecommons.org/licenses/by/4.0/).
Share and Cite
Garino, N.; Limongi, T.; Dumontel, B.; Canta, M.; Racca, L.; Laurenti, M.; Castellino, M.; Casu, A.; Falqui, A.; Cauda, V. A Microwave-Assisted Synthesis of Zinc Oxide Nanocrystals Finely Tuned for Biological Applications. Nanomaterials 2019, 9, 212. https://doi.org/10.3390/nano9020212
Garino N, Limongi T, Dumontel B, Canta M, Racca L, Laurenti M, Castellino M, Casu A, Falqui A, Cauda V. A Microwave-Assisted Synthesis of Zinc Oxide Nanocrystals Finely Tuned for Biological Applications. Nanomaterials. 2019; 9(2):212. https://doi.org/10.3390/nano9020212
Chicago/Turabian StyleGarino, Nadia, Tania Limongi, Bianca Dumontel, Marta Canta, Luisa Racca, Marco Laurenti, Micaela Castellino, Alberto Casu, Andrea Falqui, and Valentina Cauda. 2019. "A Microwave-Assisted Synthesis of Zinc Oxide Nanocrystals Finely Tuned for Biological Applications" Nanomaterials 9, no. 2: 212. https://doi.org/10.3390/nano9020212
APA StyleGarino, N., Limongi, T., Dumontel, B., Canta, M., Racca, L., Laurenti, M., Castellino, M., Casu, A., Falqui, A., & Cauda, V. (2019). A Microwave-Assisted Synthesis of Zinc Oxide Nanocrystals Finely Tuned for Biological Applications. Nanomaterials, 9(2), 212. https://doi.org/10.3390/nano9020212