Fe3O4 Nanoparticles Loaded on Lignin Nanoparticles Applied as a Peroxidase Mimic for the Sensitively Colorimetric Detection of H2O2

 , and
, and
Abstract
:
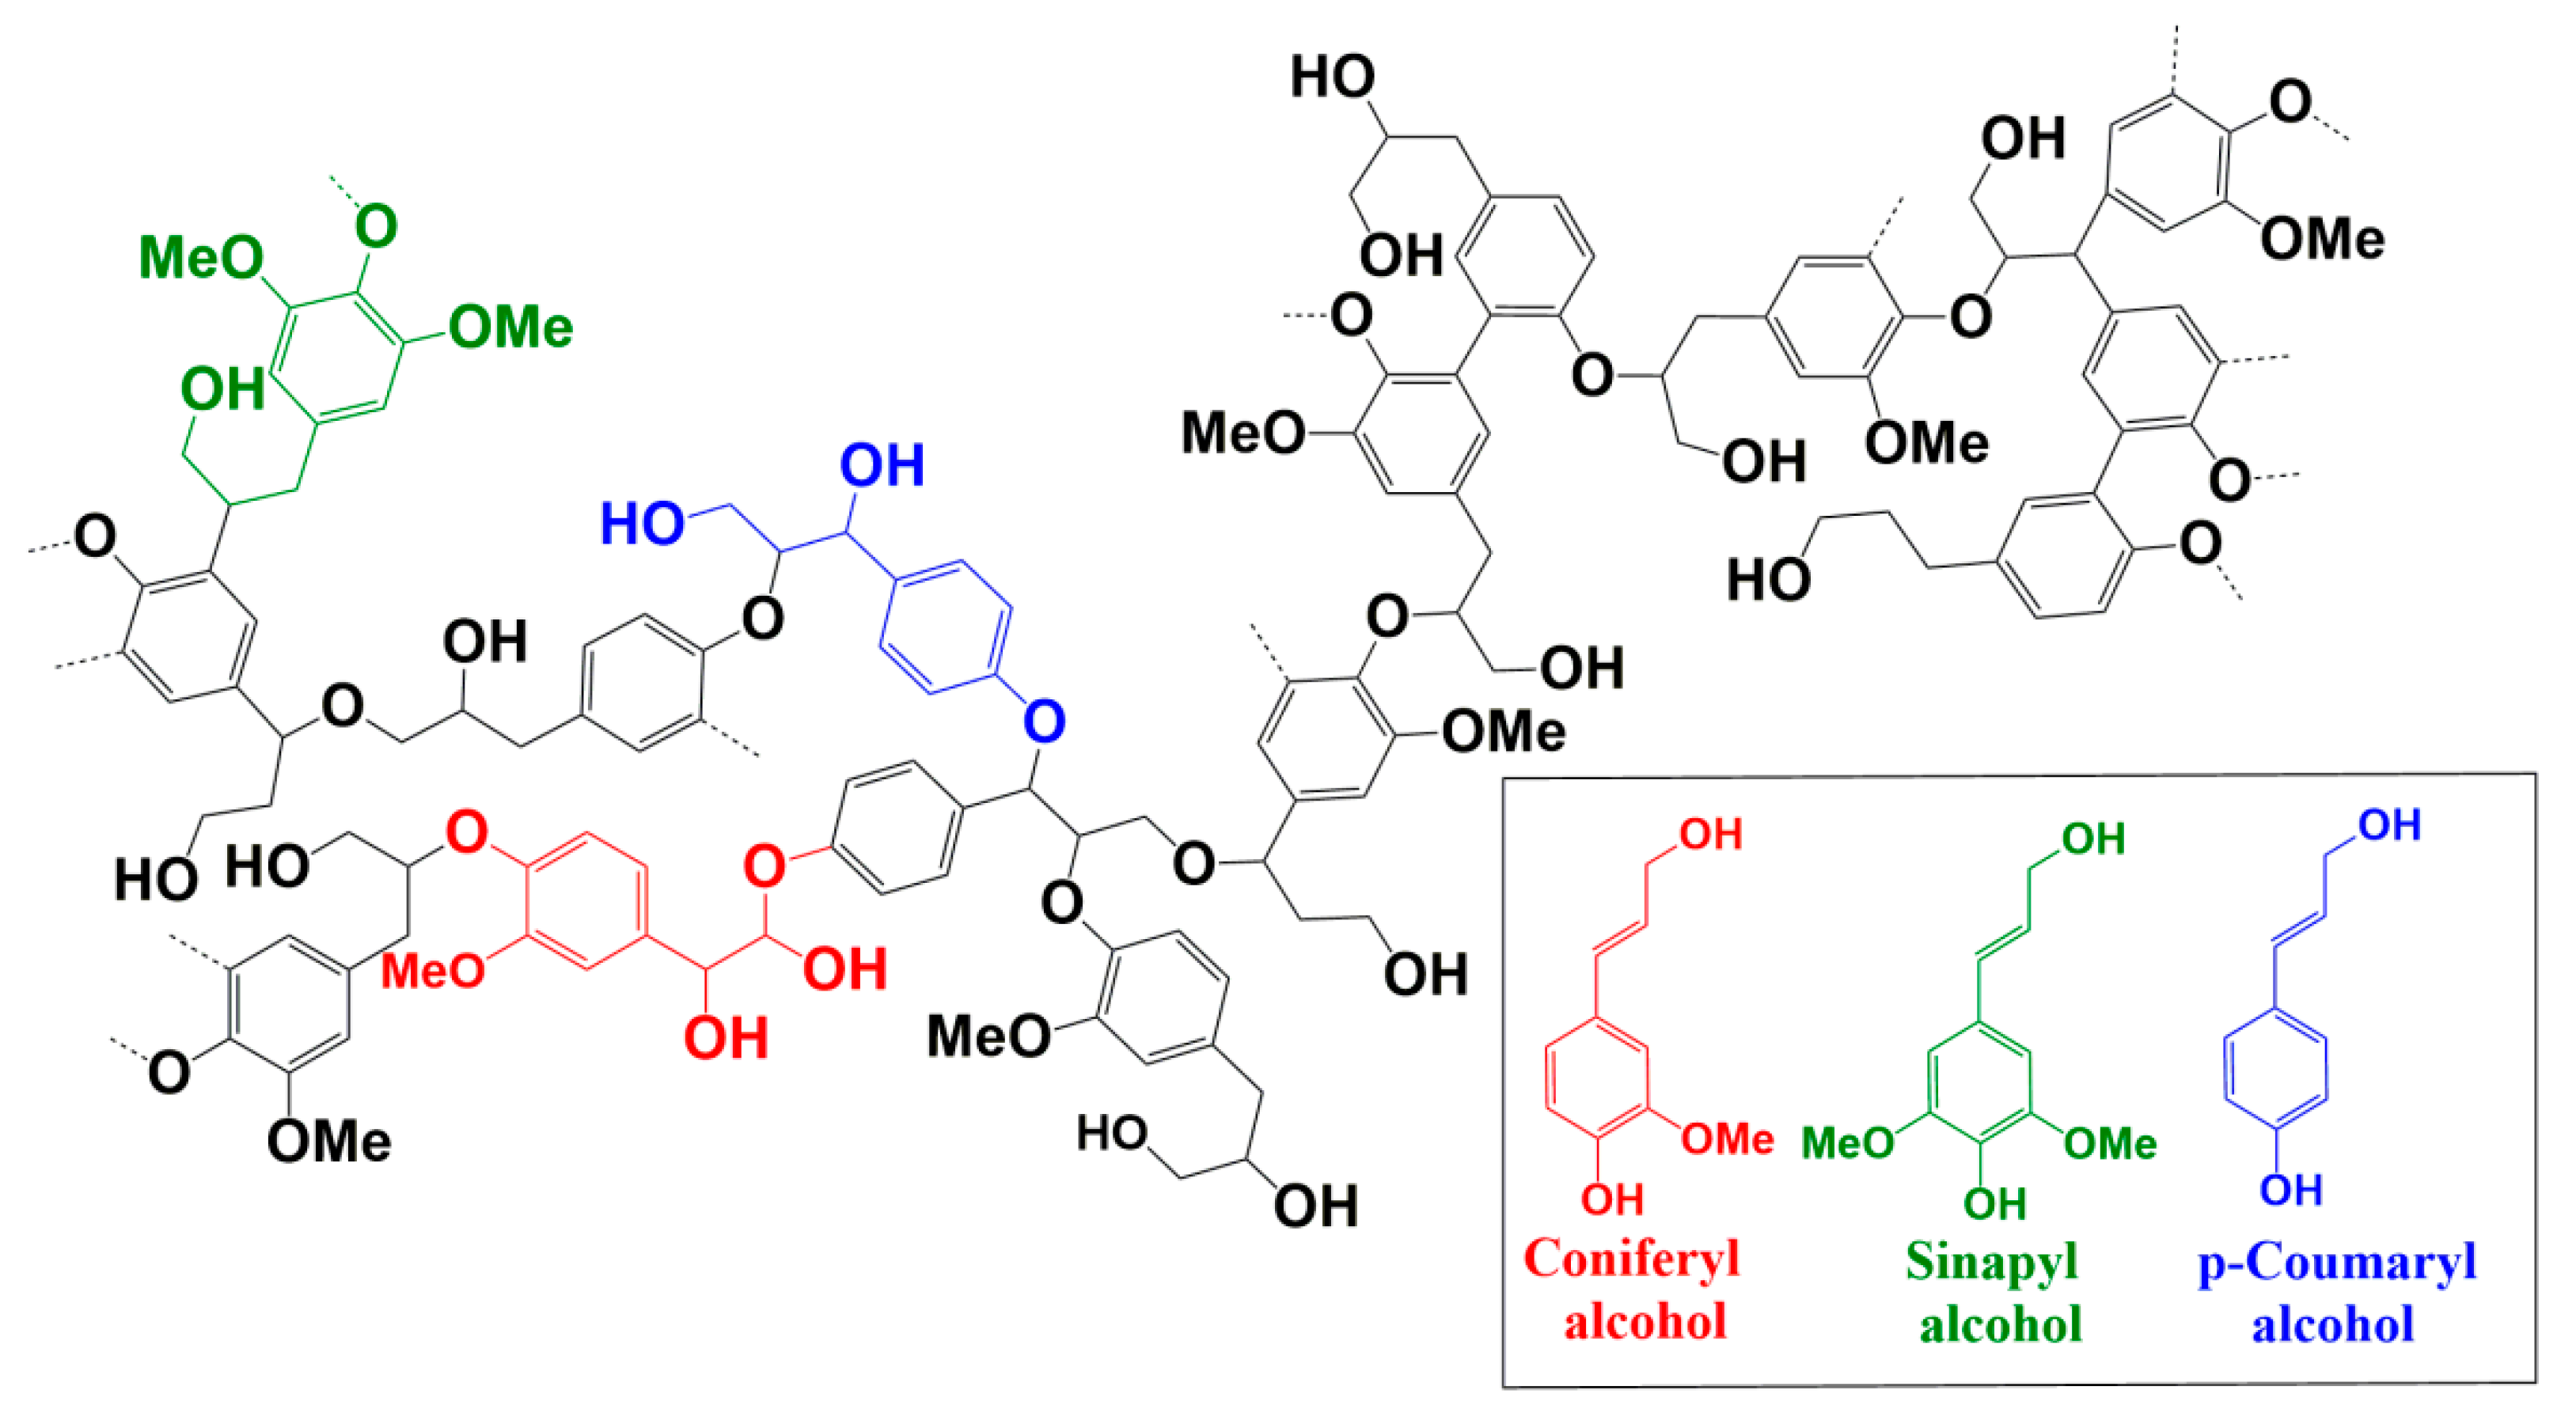
1. Introduction
2. Experimental
2.1. Materials and Reagents
2.2. Statistical Analysis
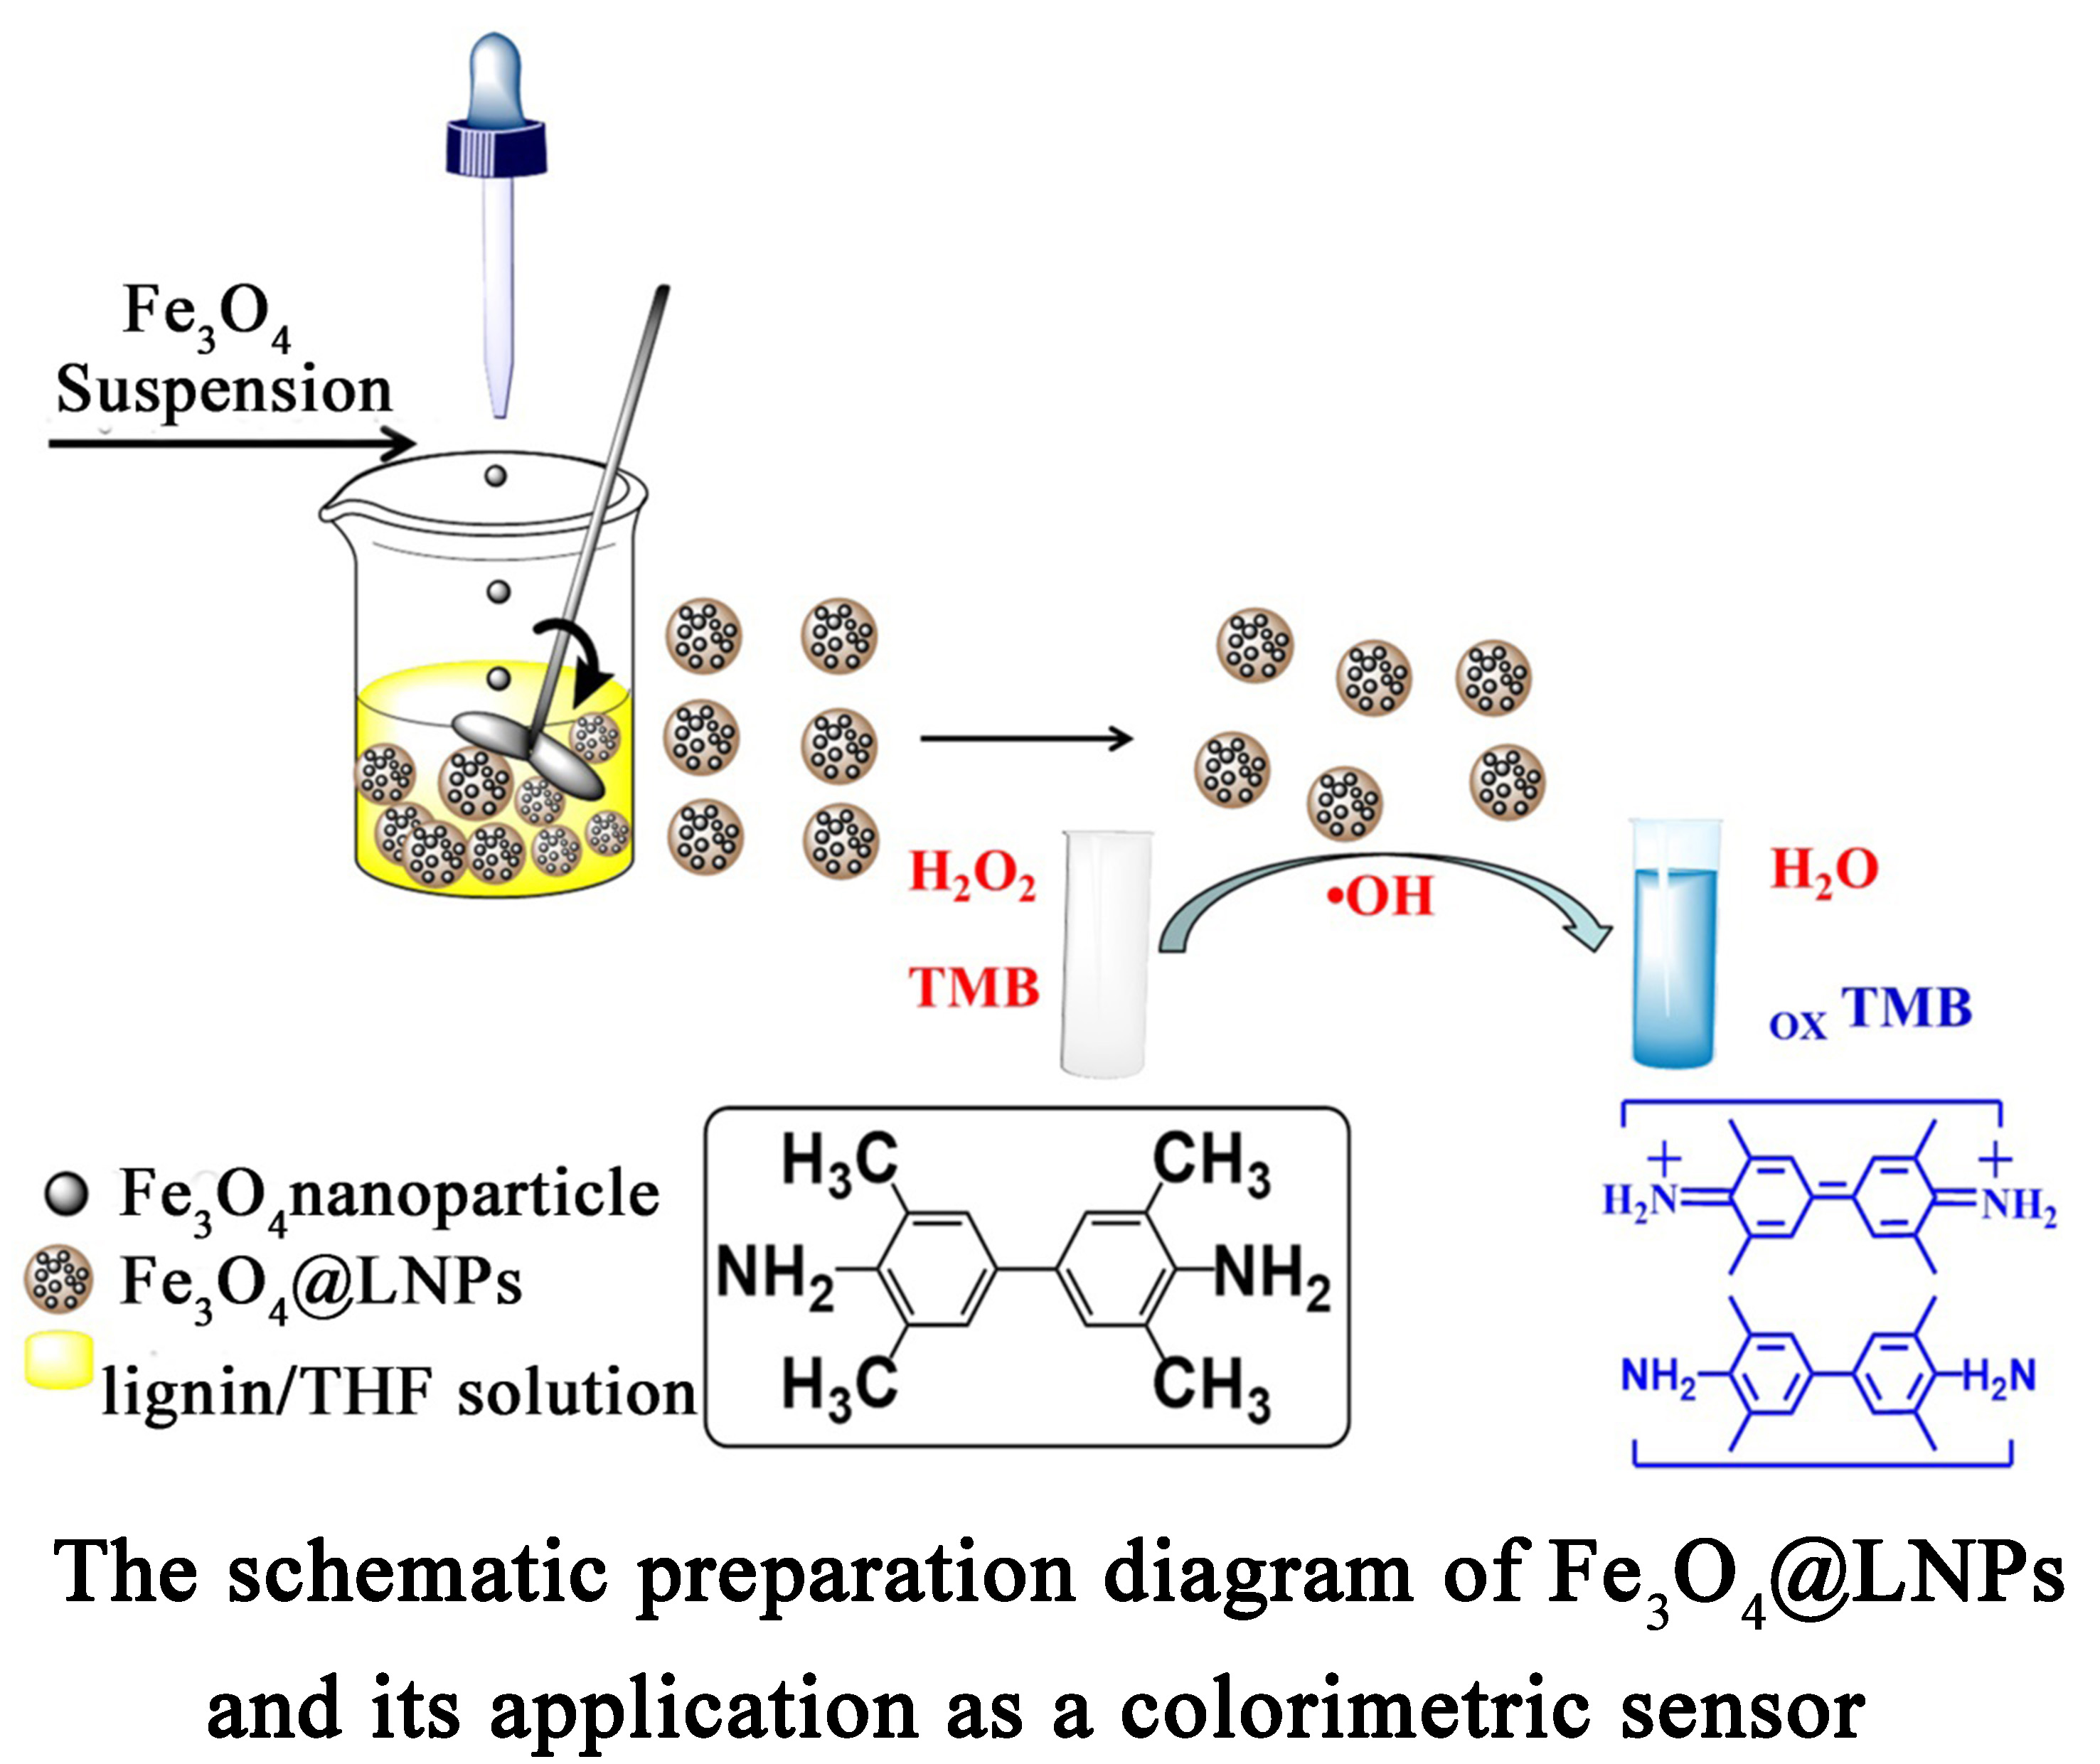
2.3. Preparation of Fe3O4@LNPs
2.4. Peroxidase-Like Activity of Fe3O4@LNPs
2.5. Steady Kinetic Analysis of Fe3O4@LNPs
2.6. Colorimetric Detection of H2O2
2.7. Characterization
3. Results and Discussion
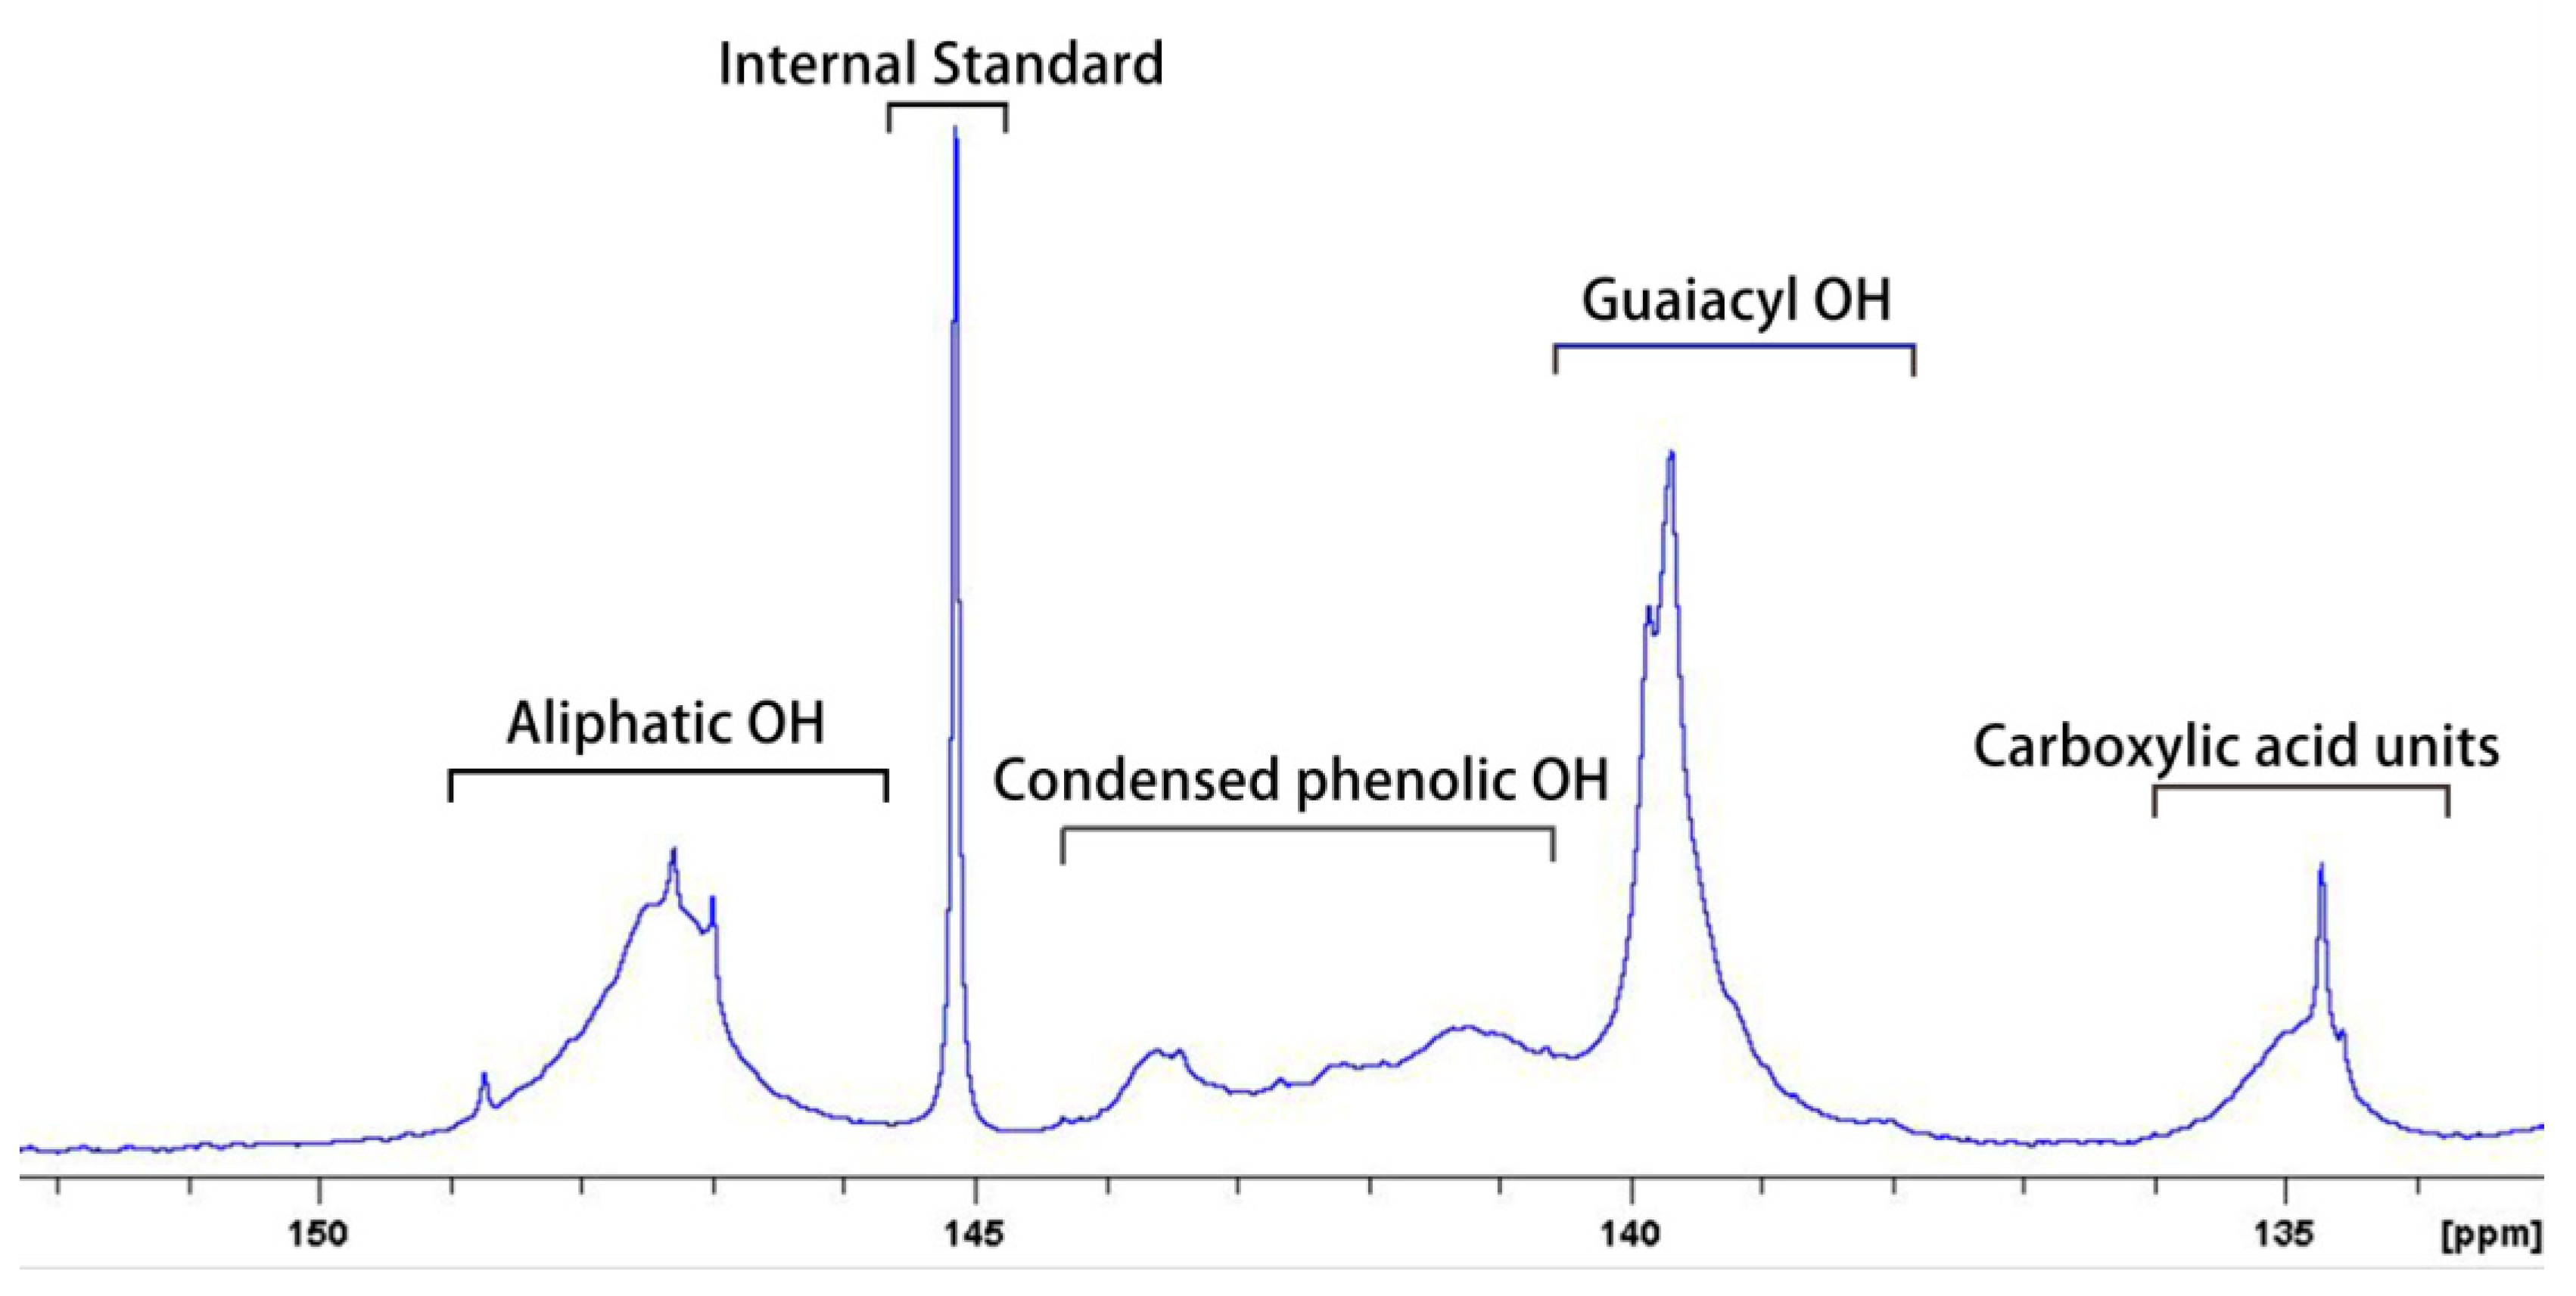
3.1. Quantification of Hydroxyl Groups of Lignin
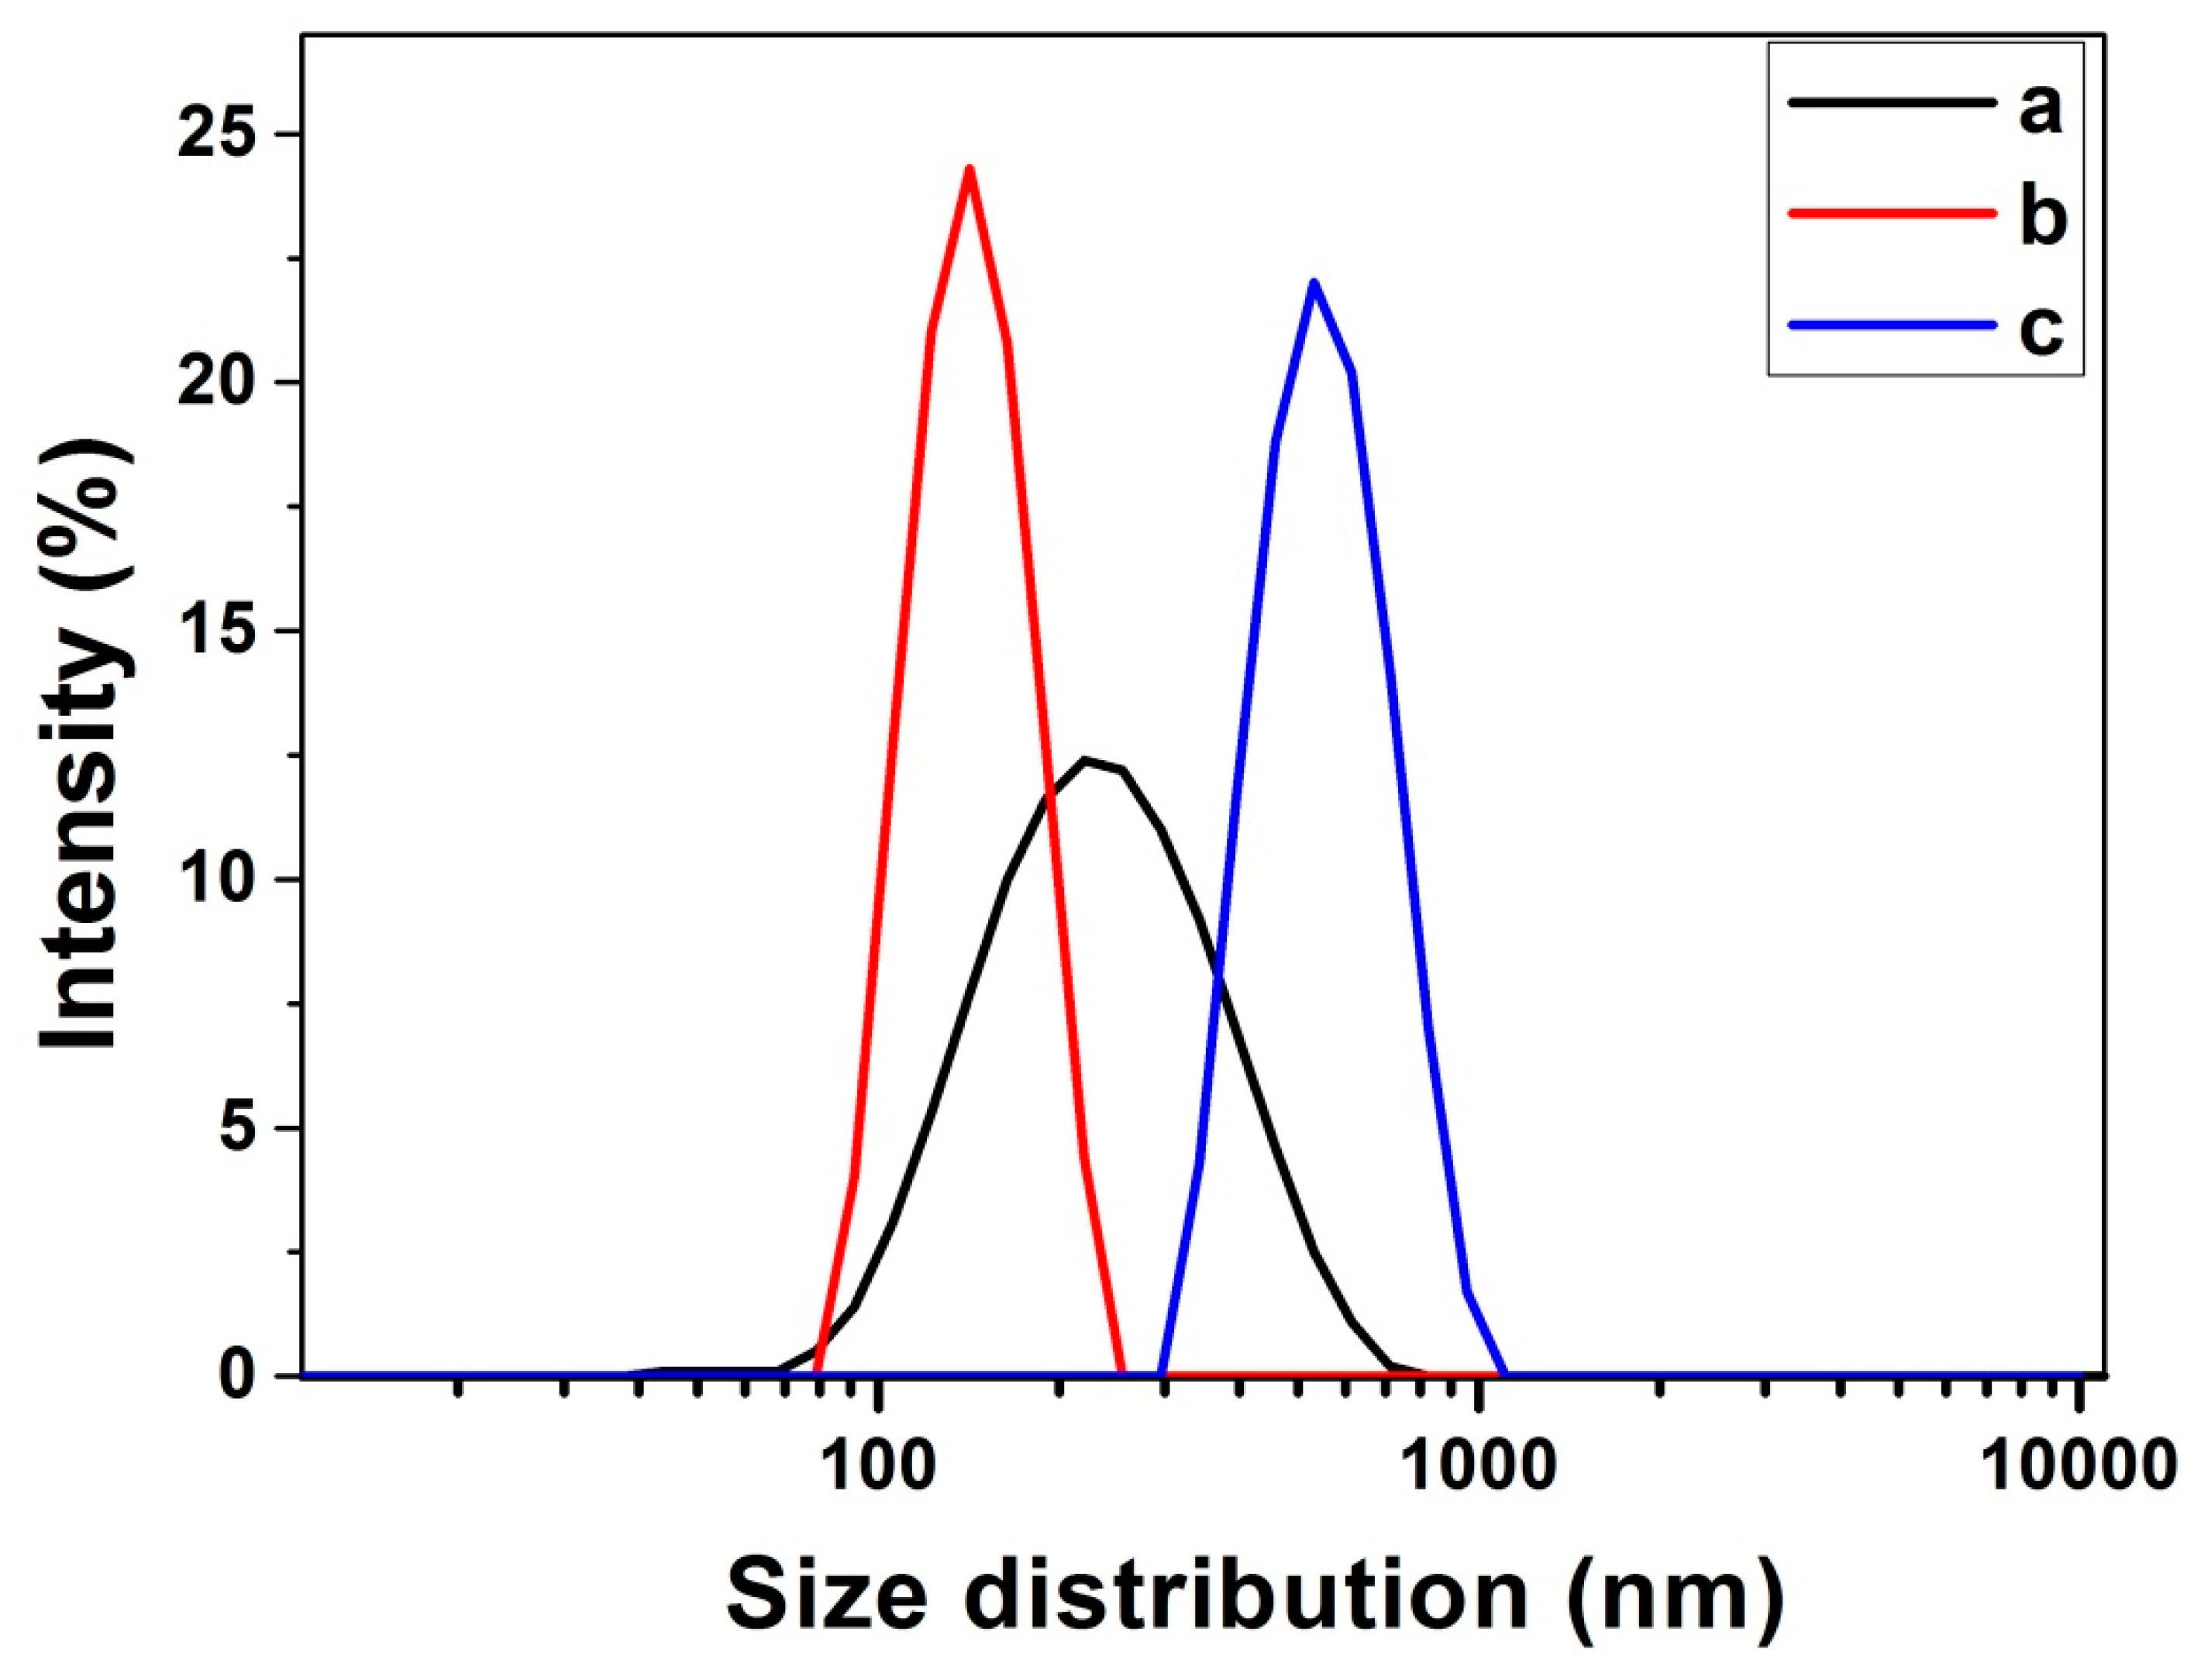
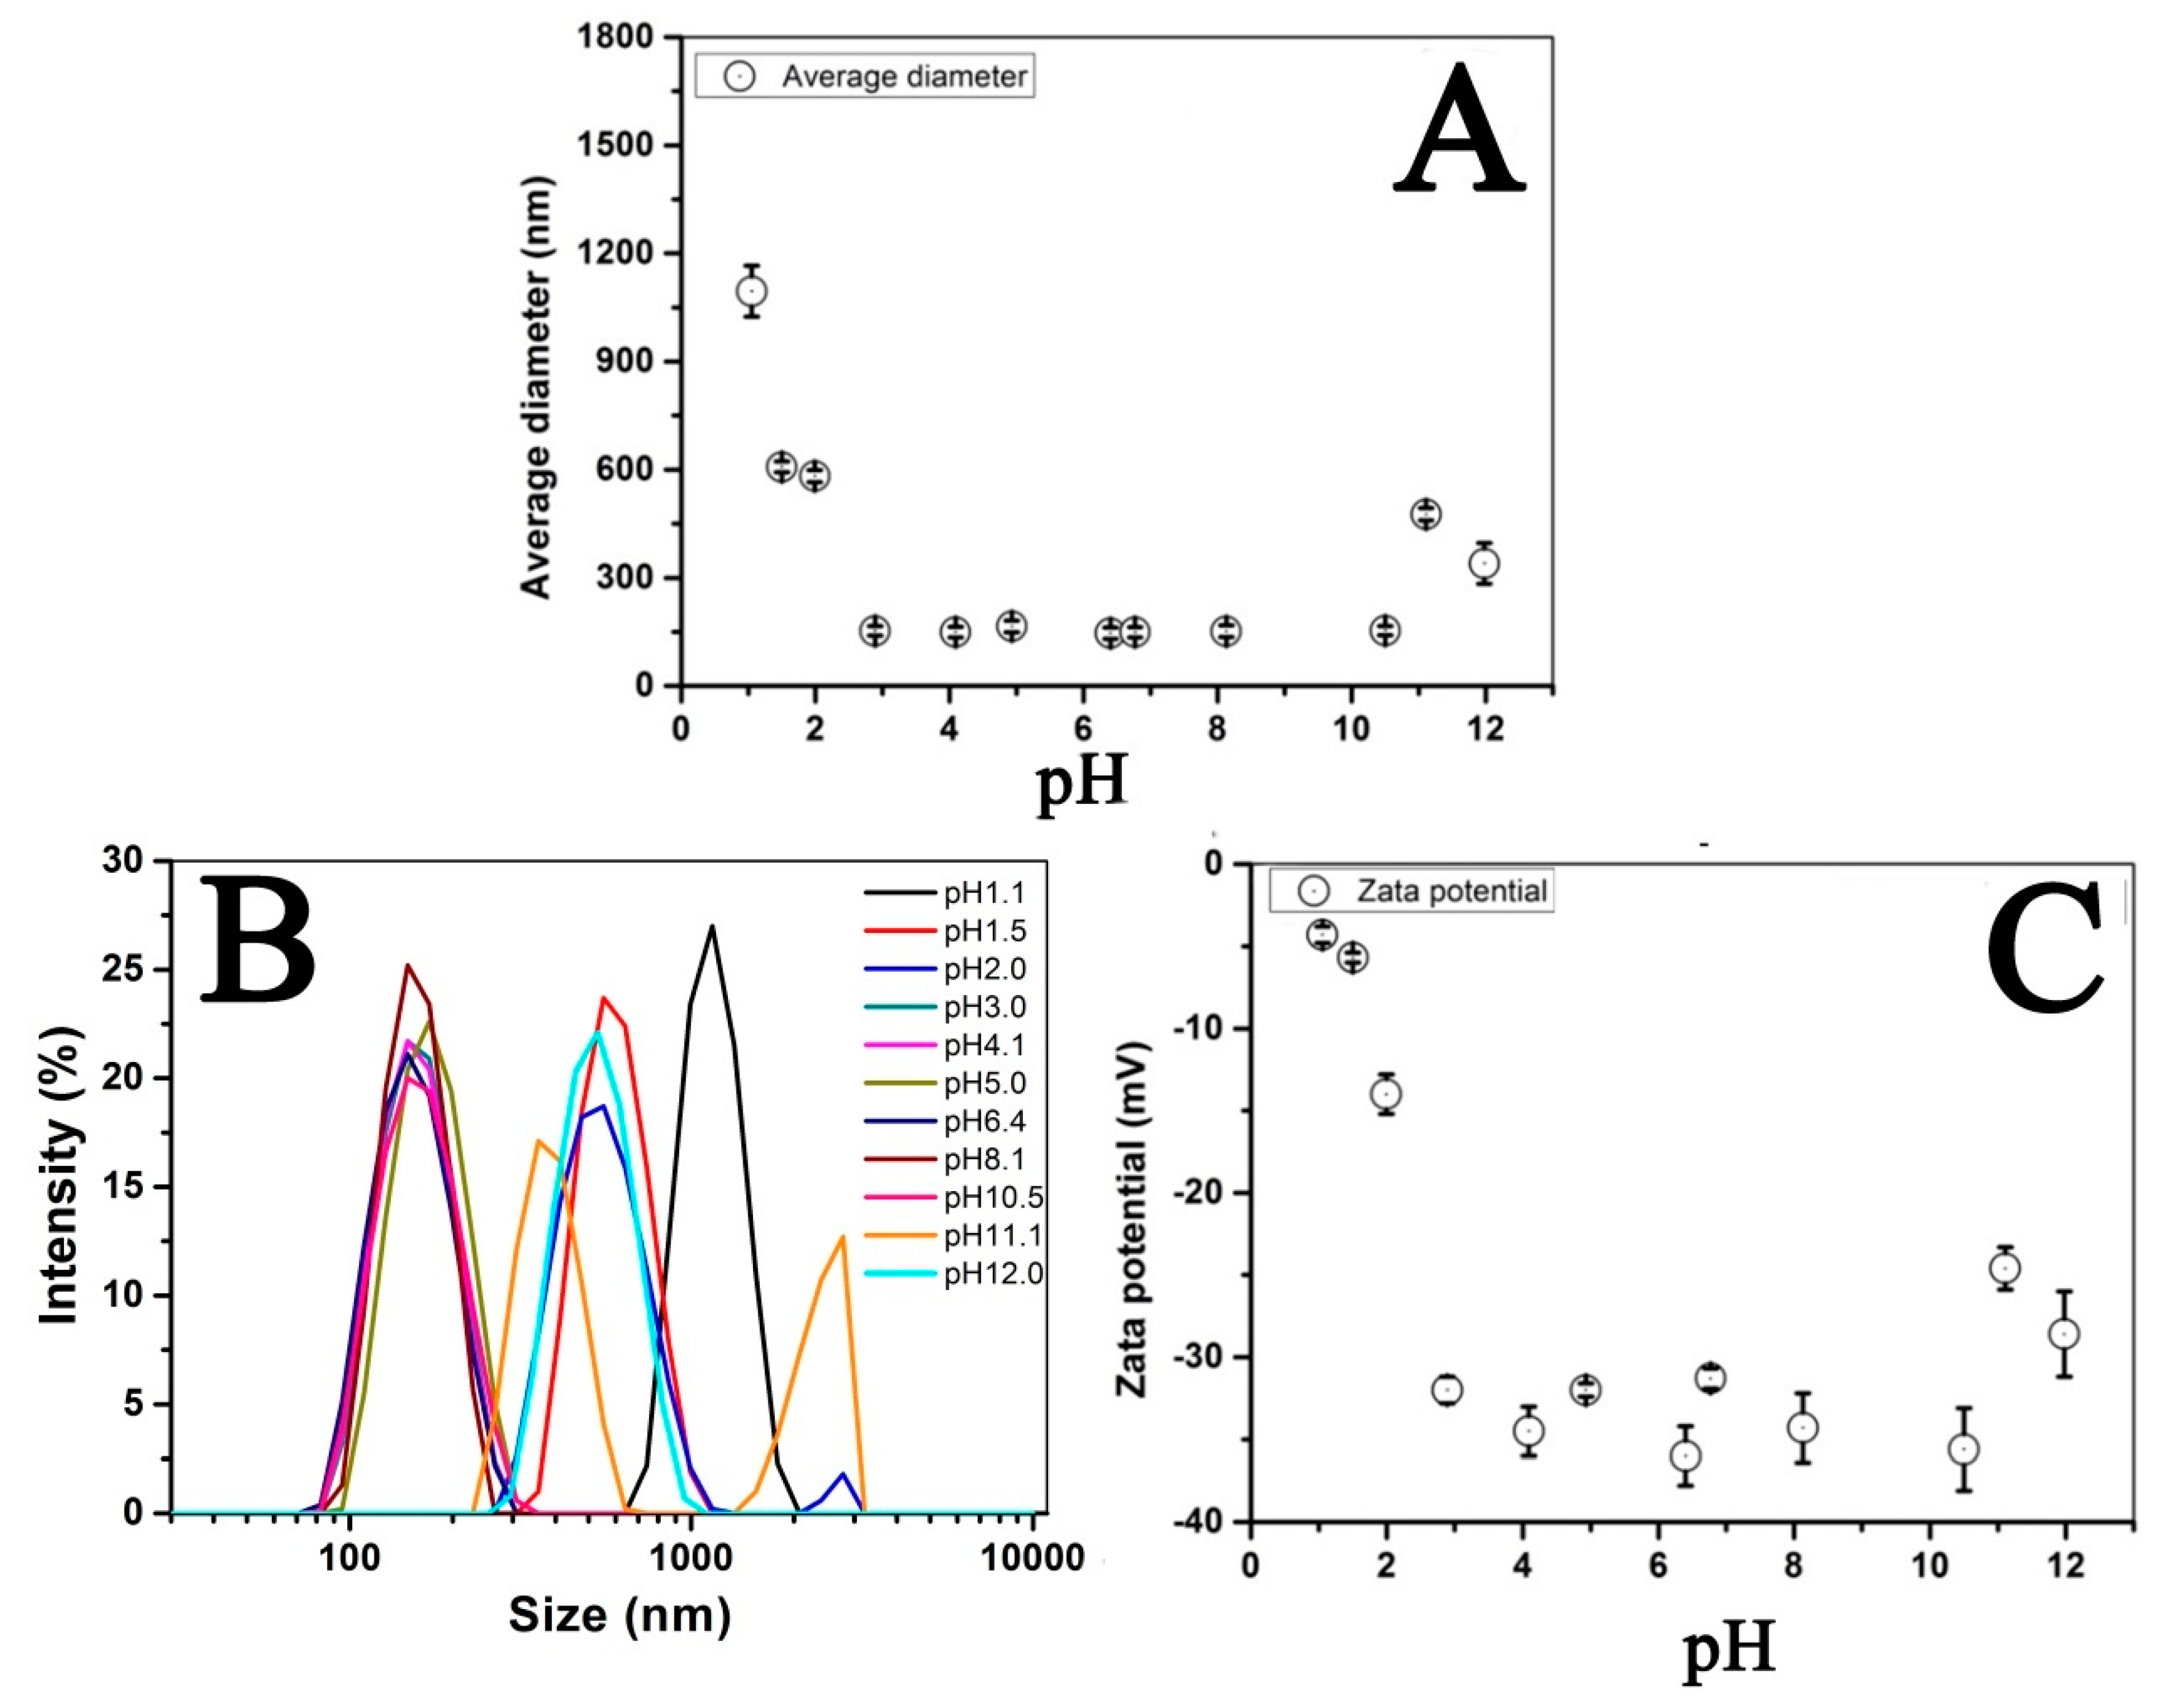
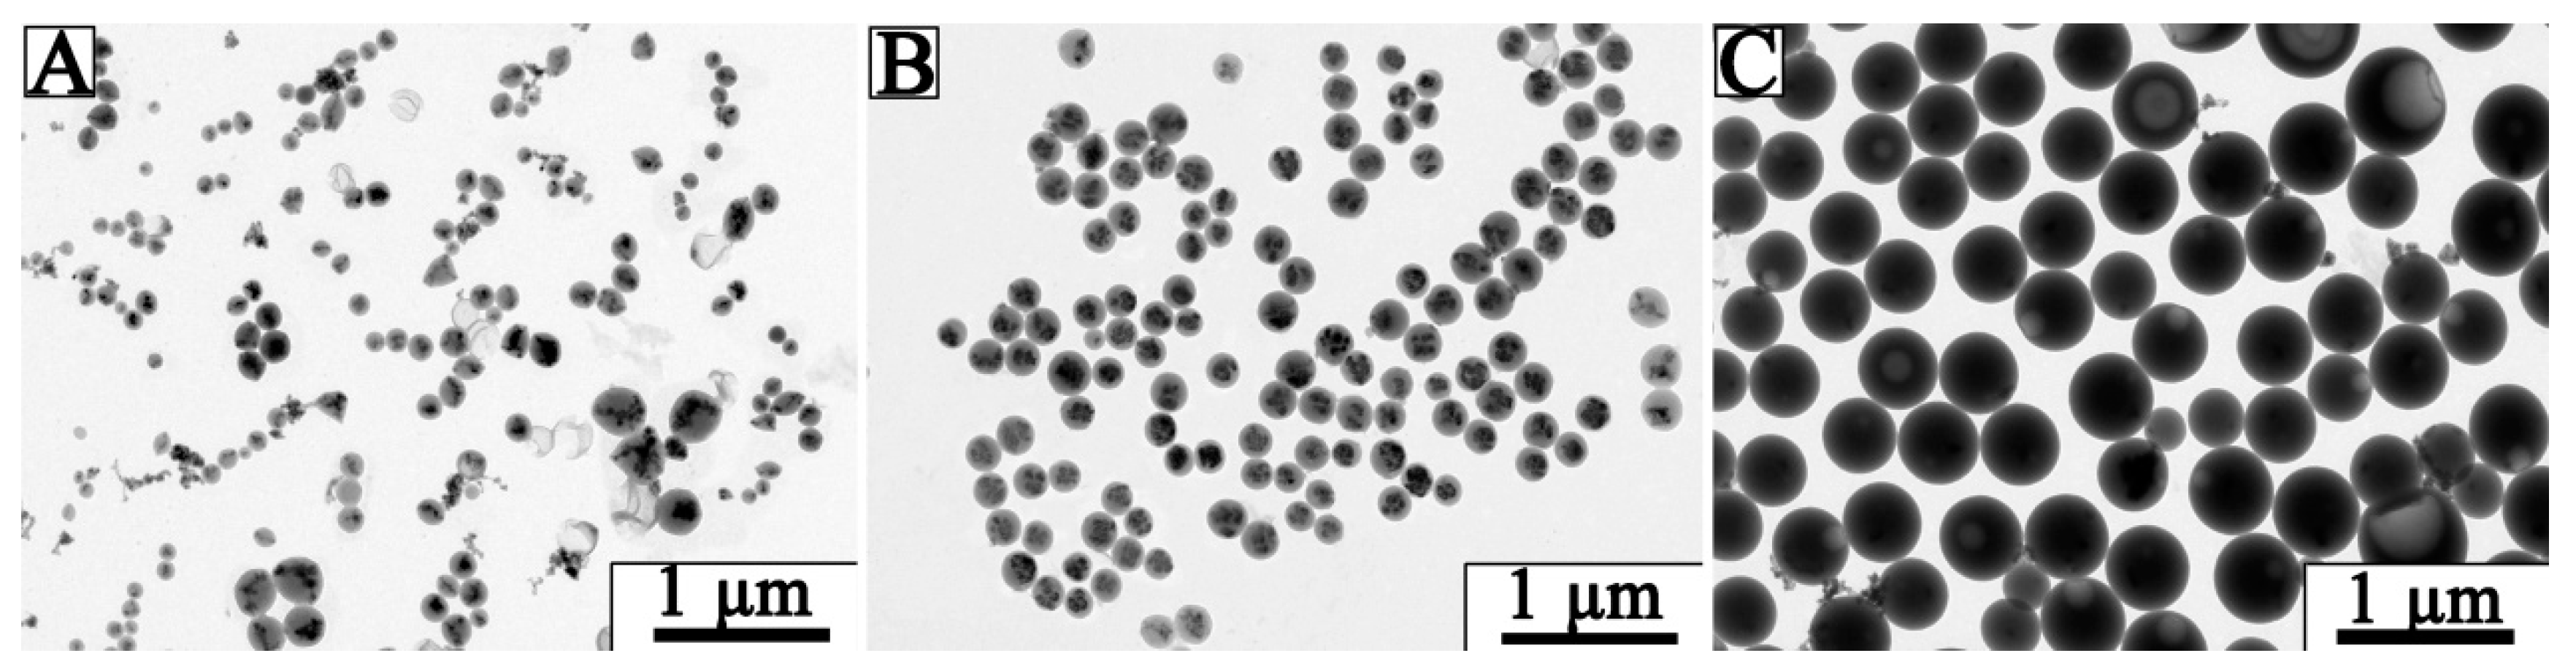
3.2. Optimization of Fe3O4@LNPs Formation
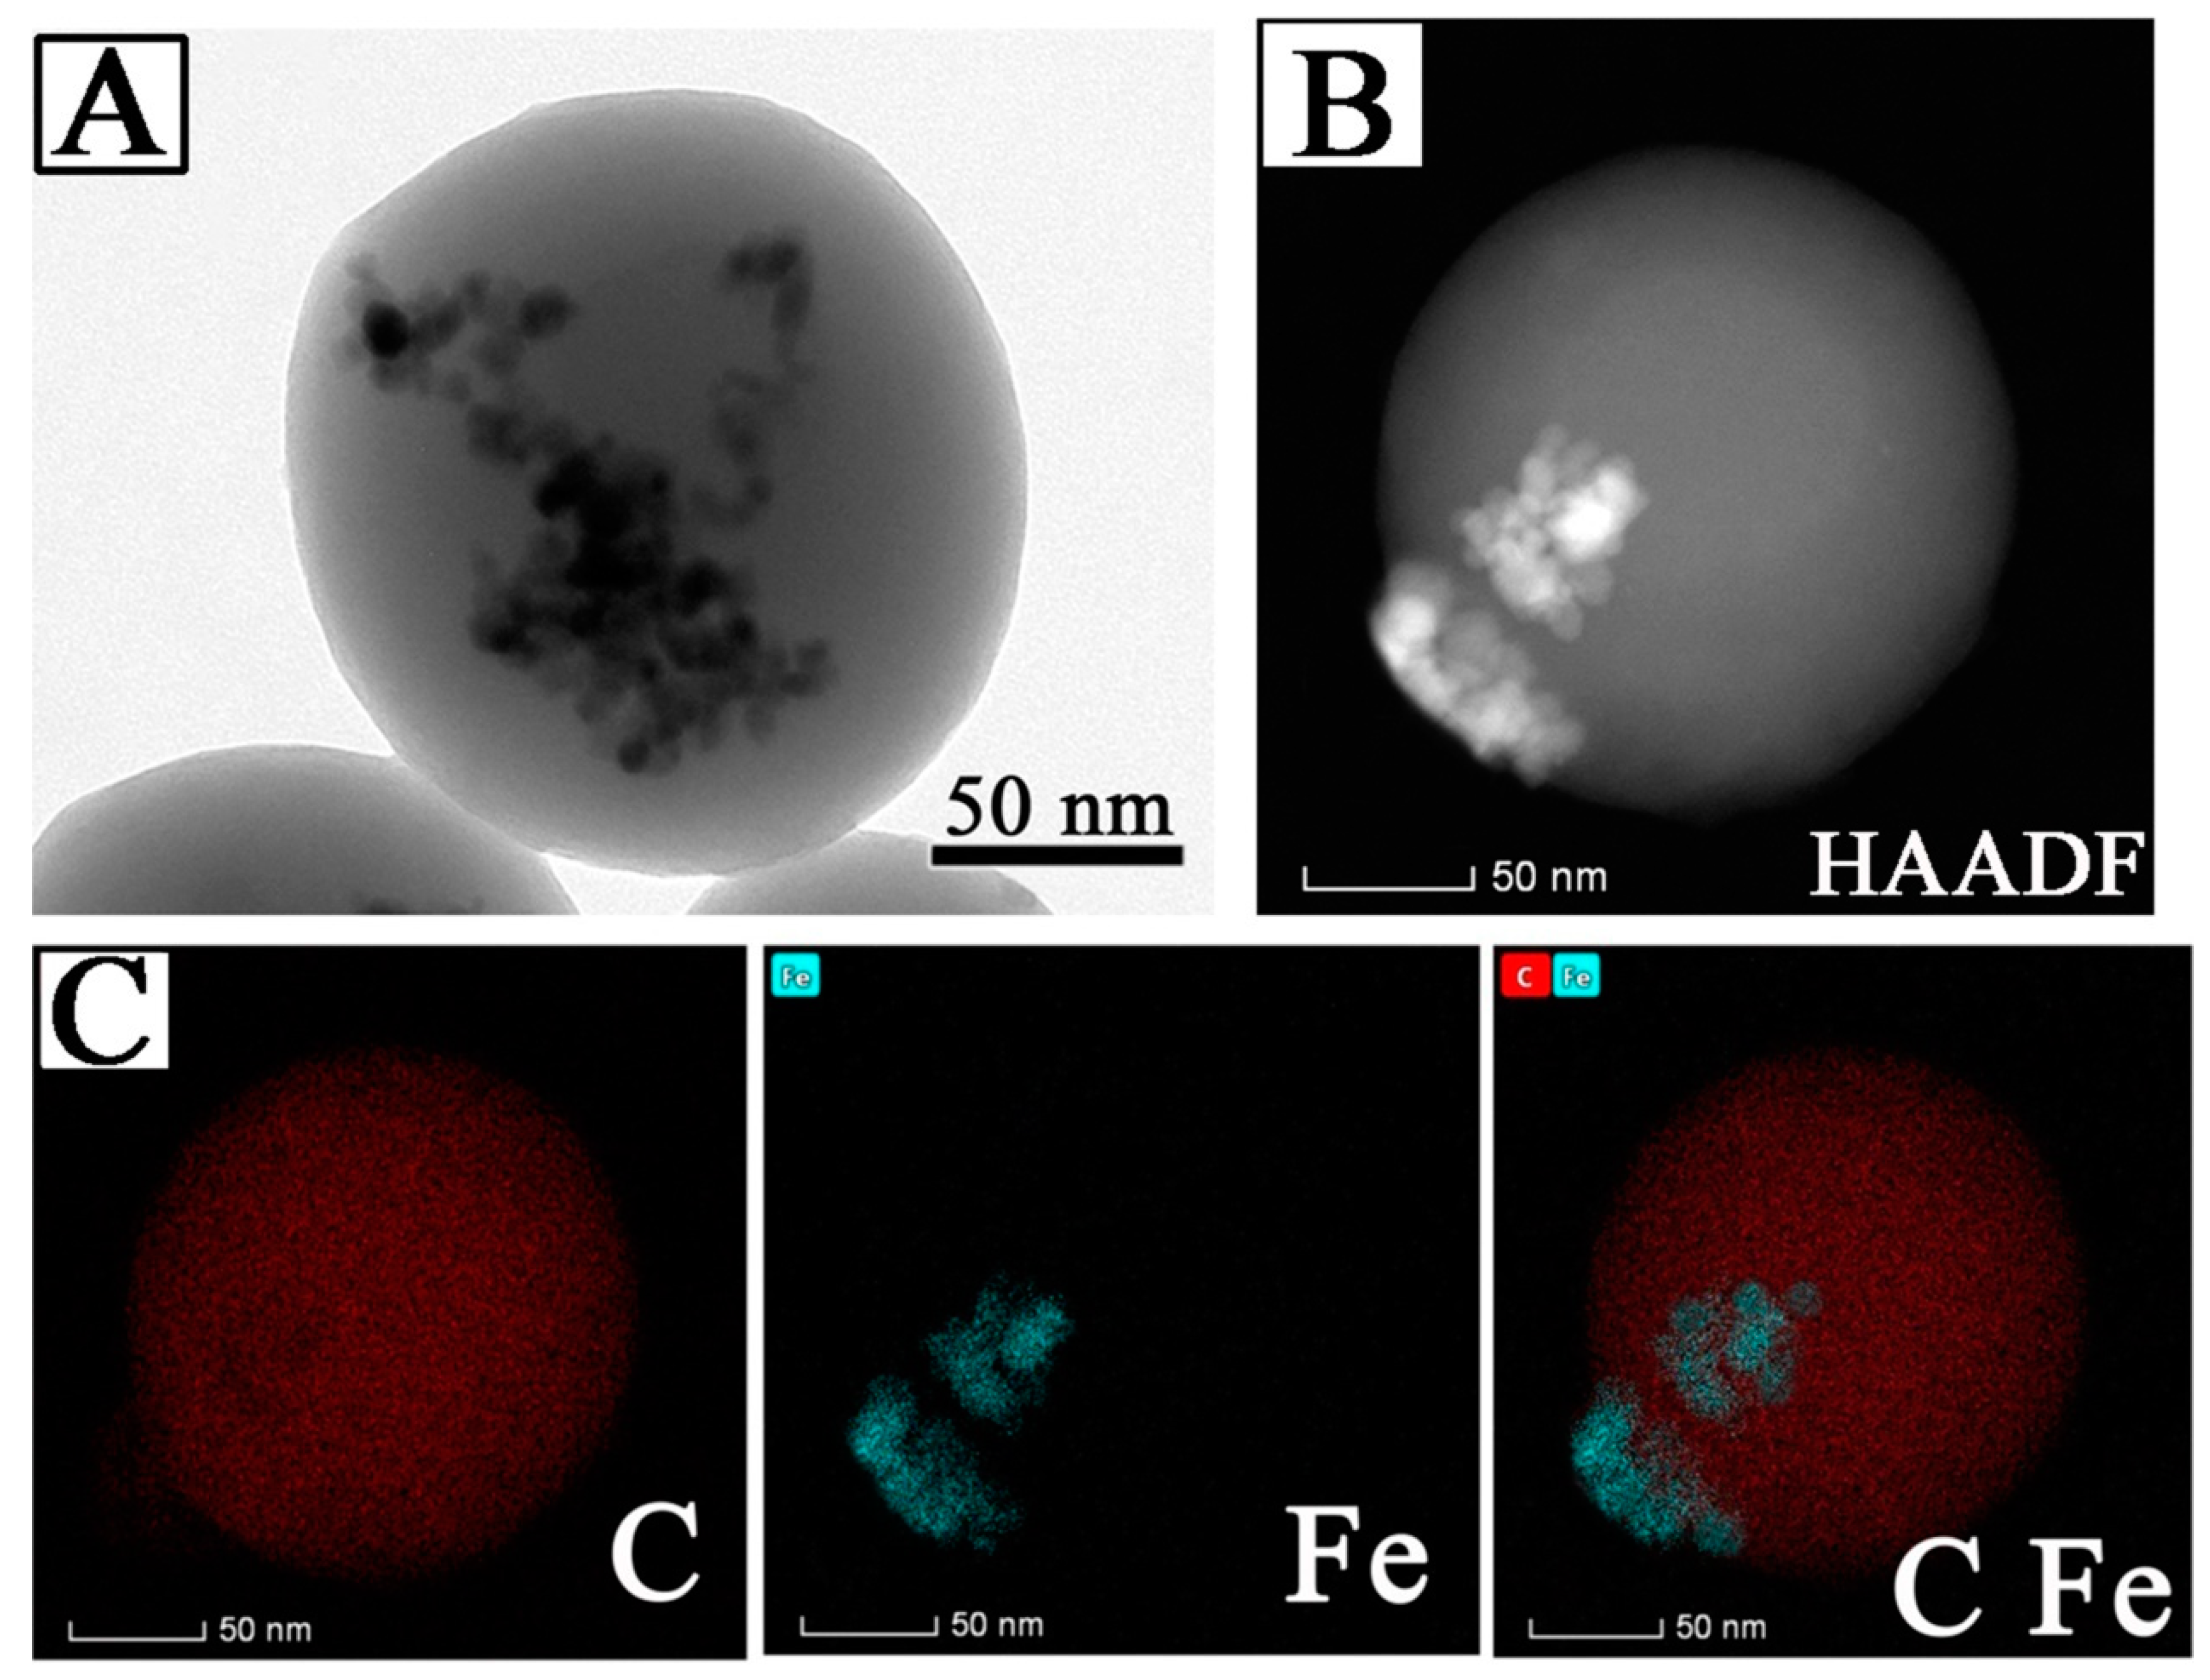
3.3. Characterization of Fe3O4 @LNPs
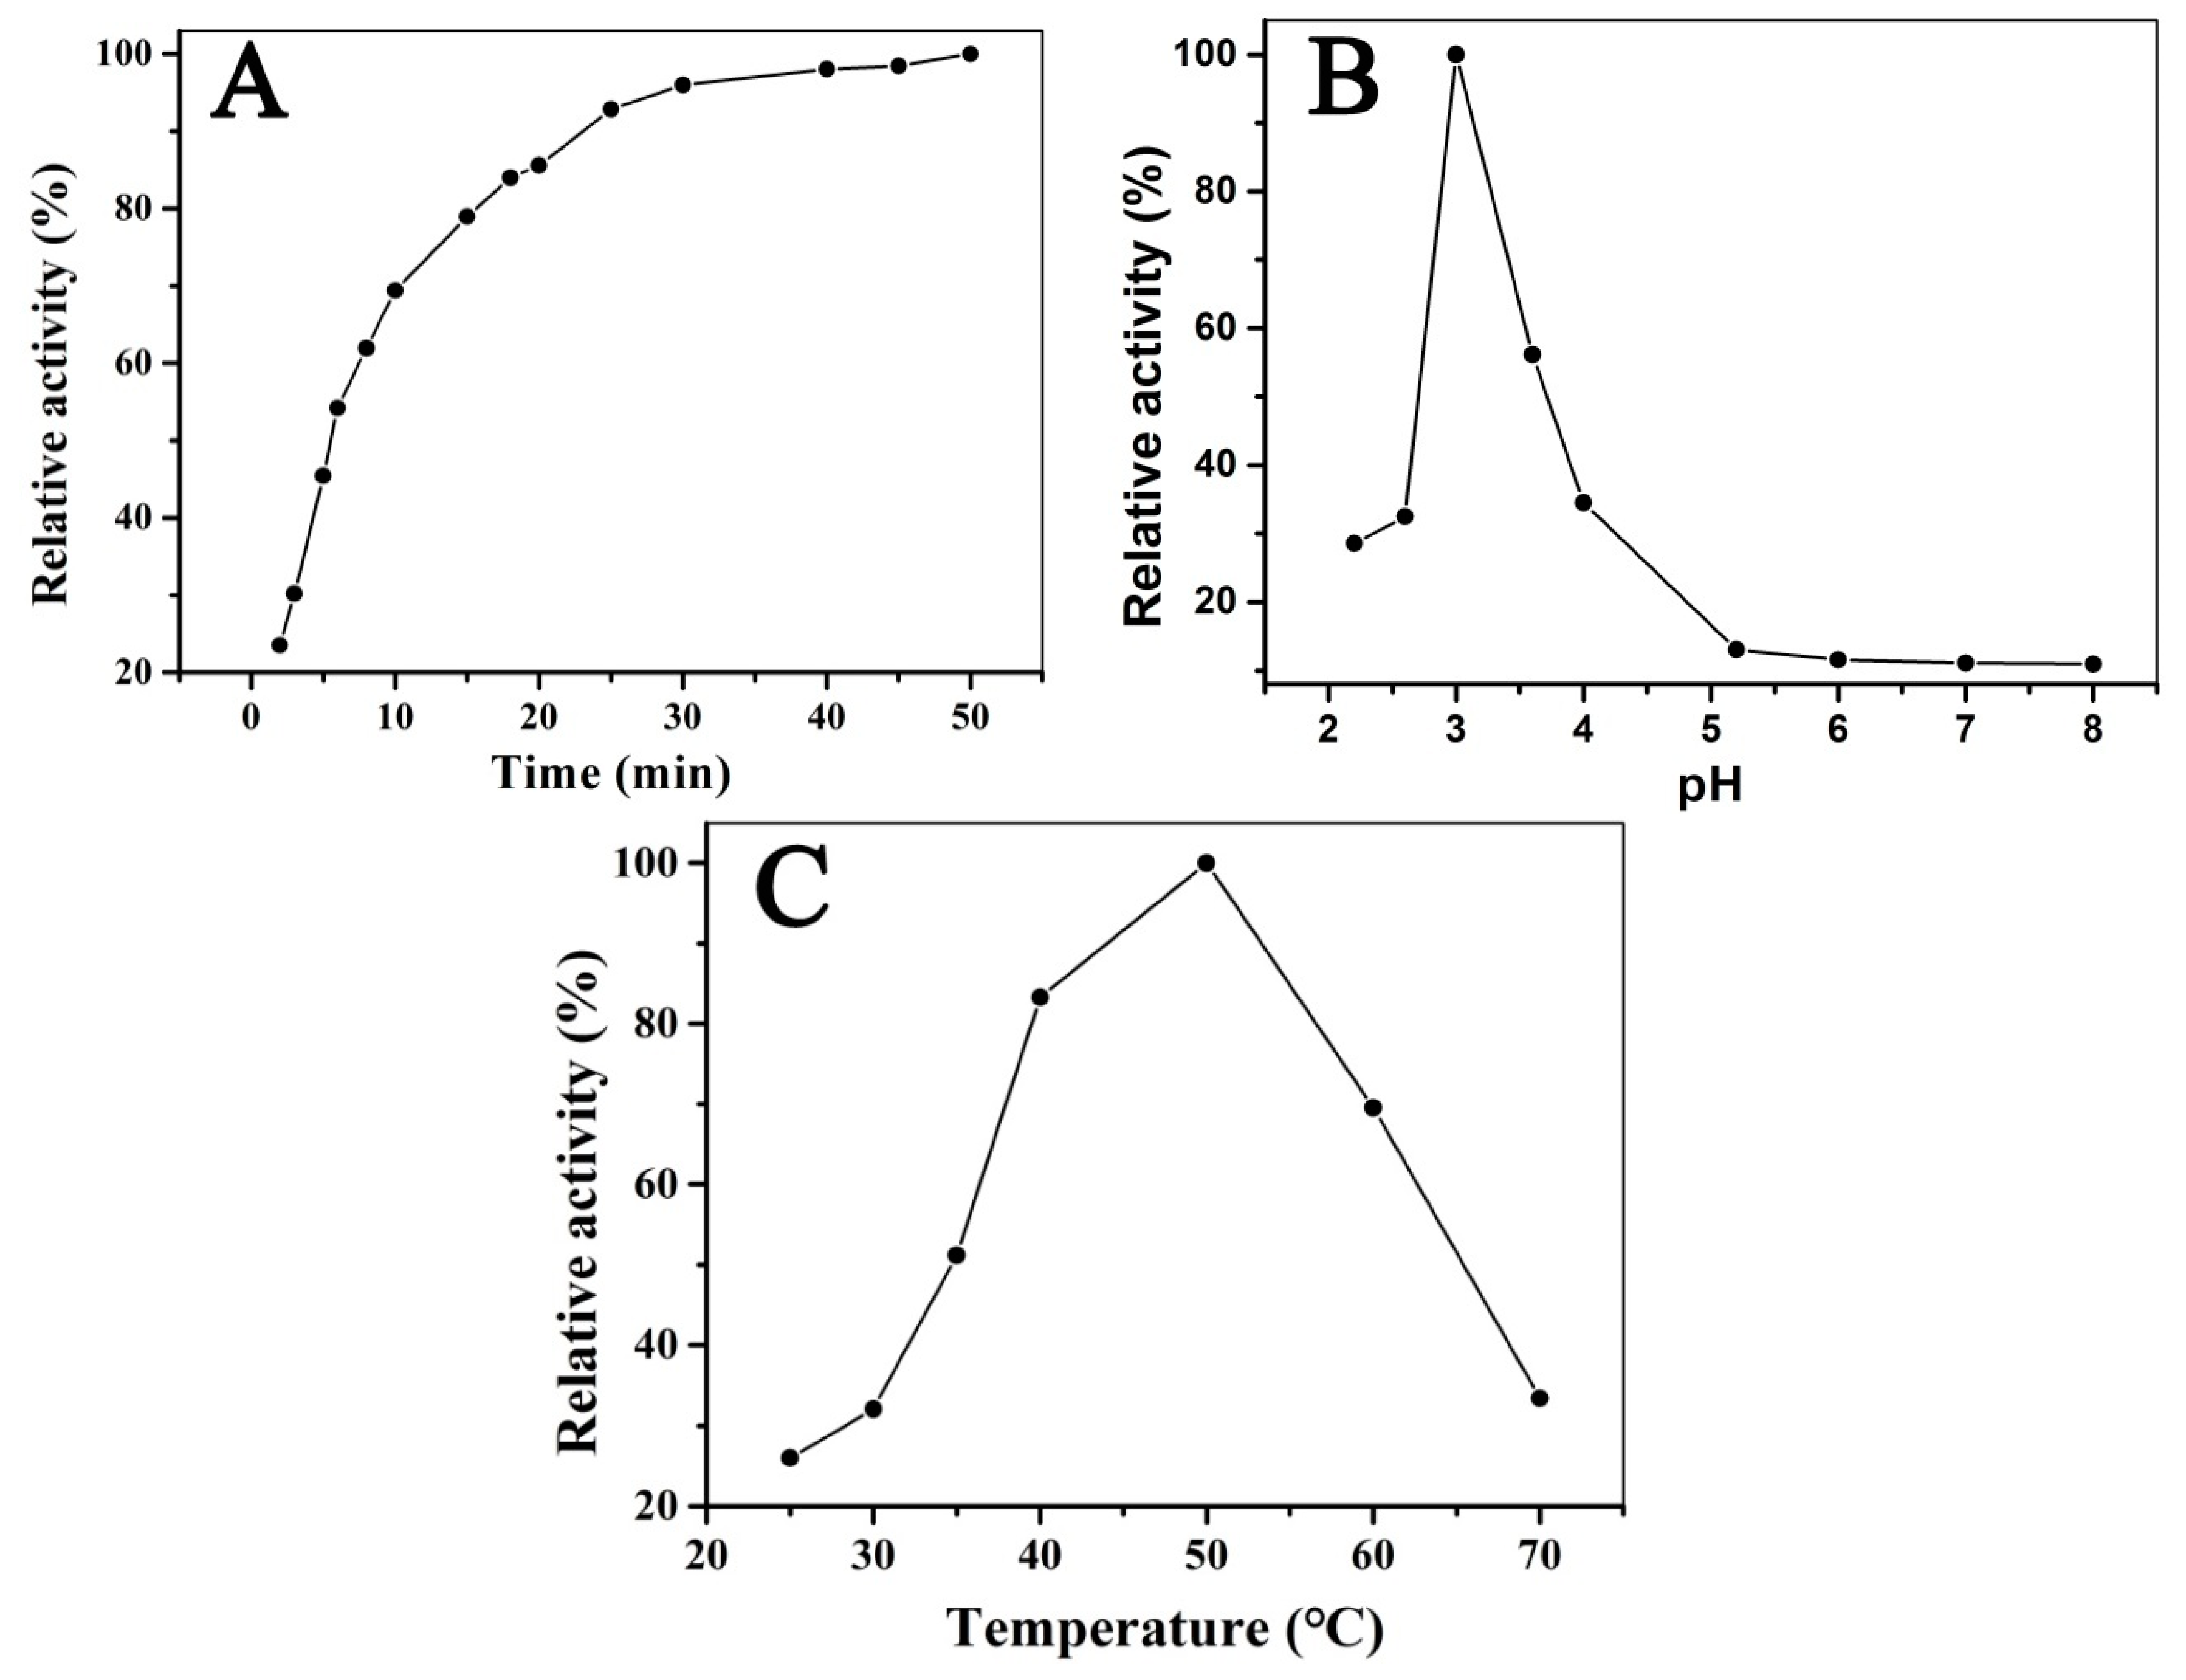
3.4. Optimizing the Reaction Conditions of H2O2 and TMB Catalyzed by Fe3O4@LNPs
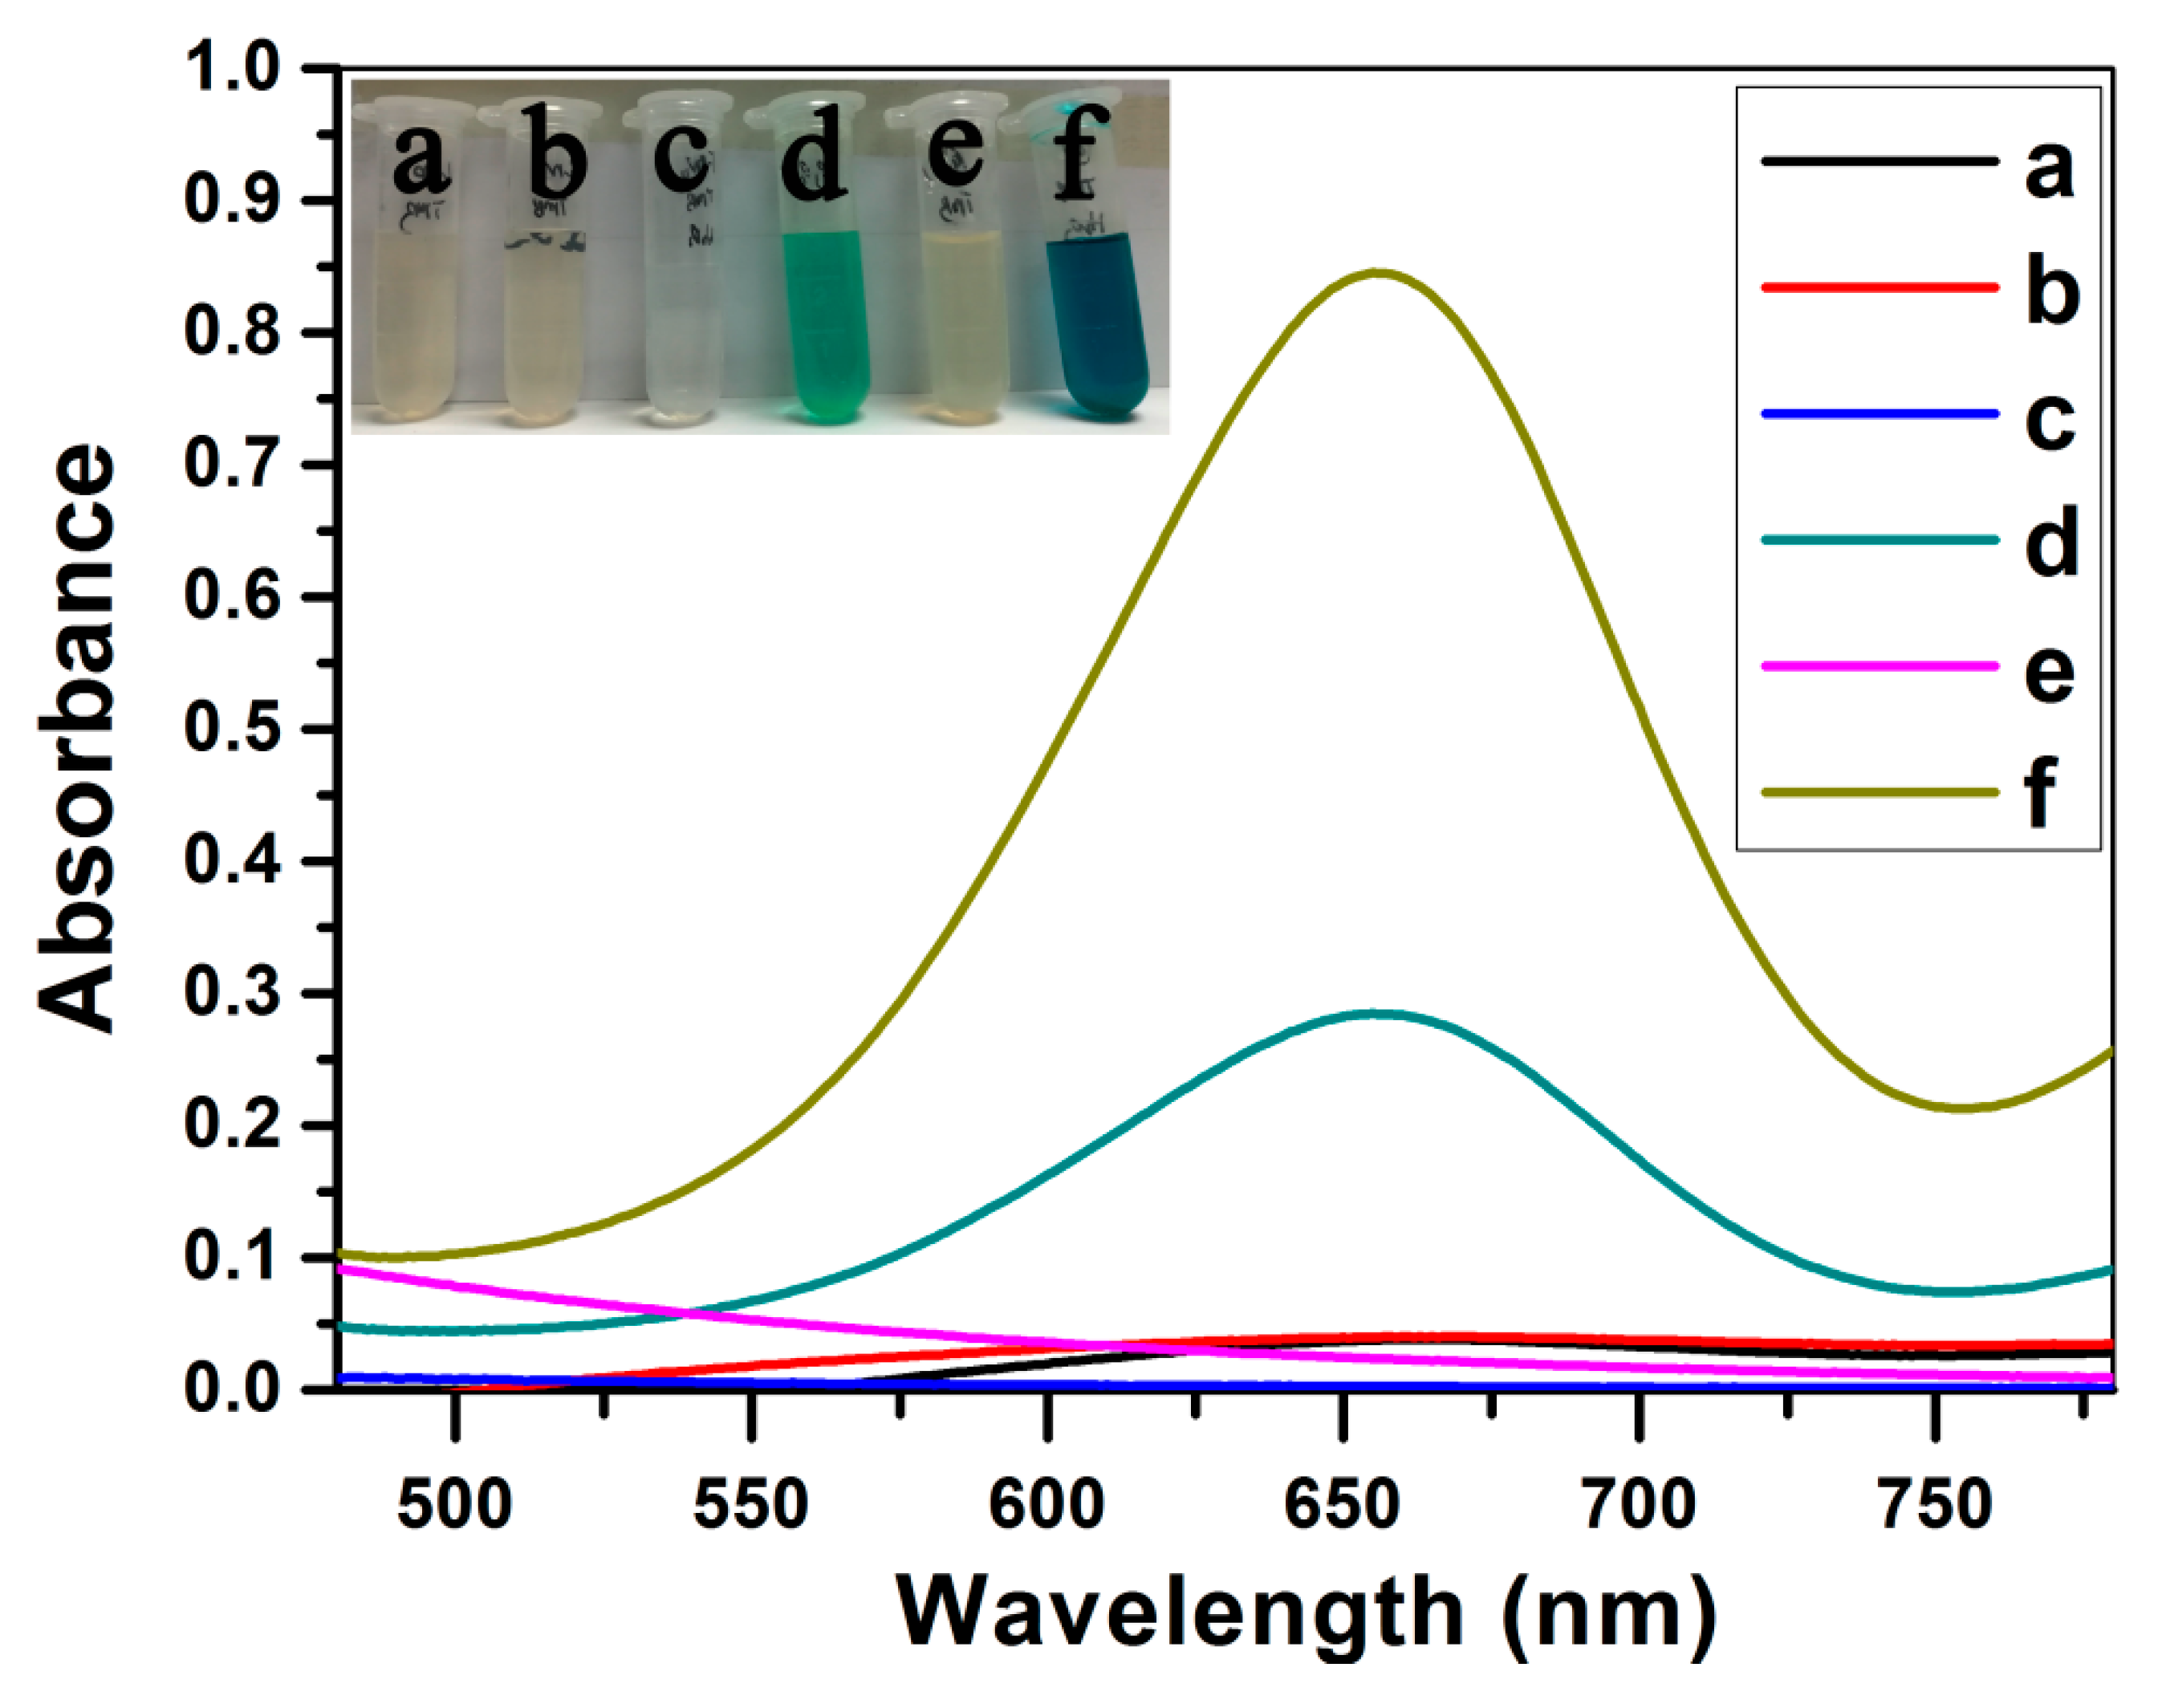
3.5. Peroxidase-liked Activity of Fe3O4@LNPs
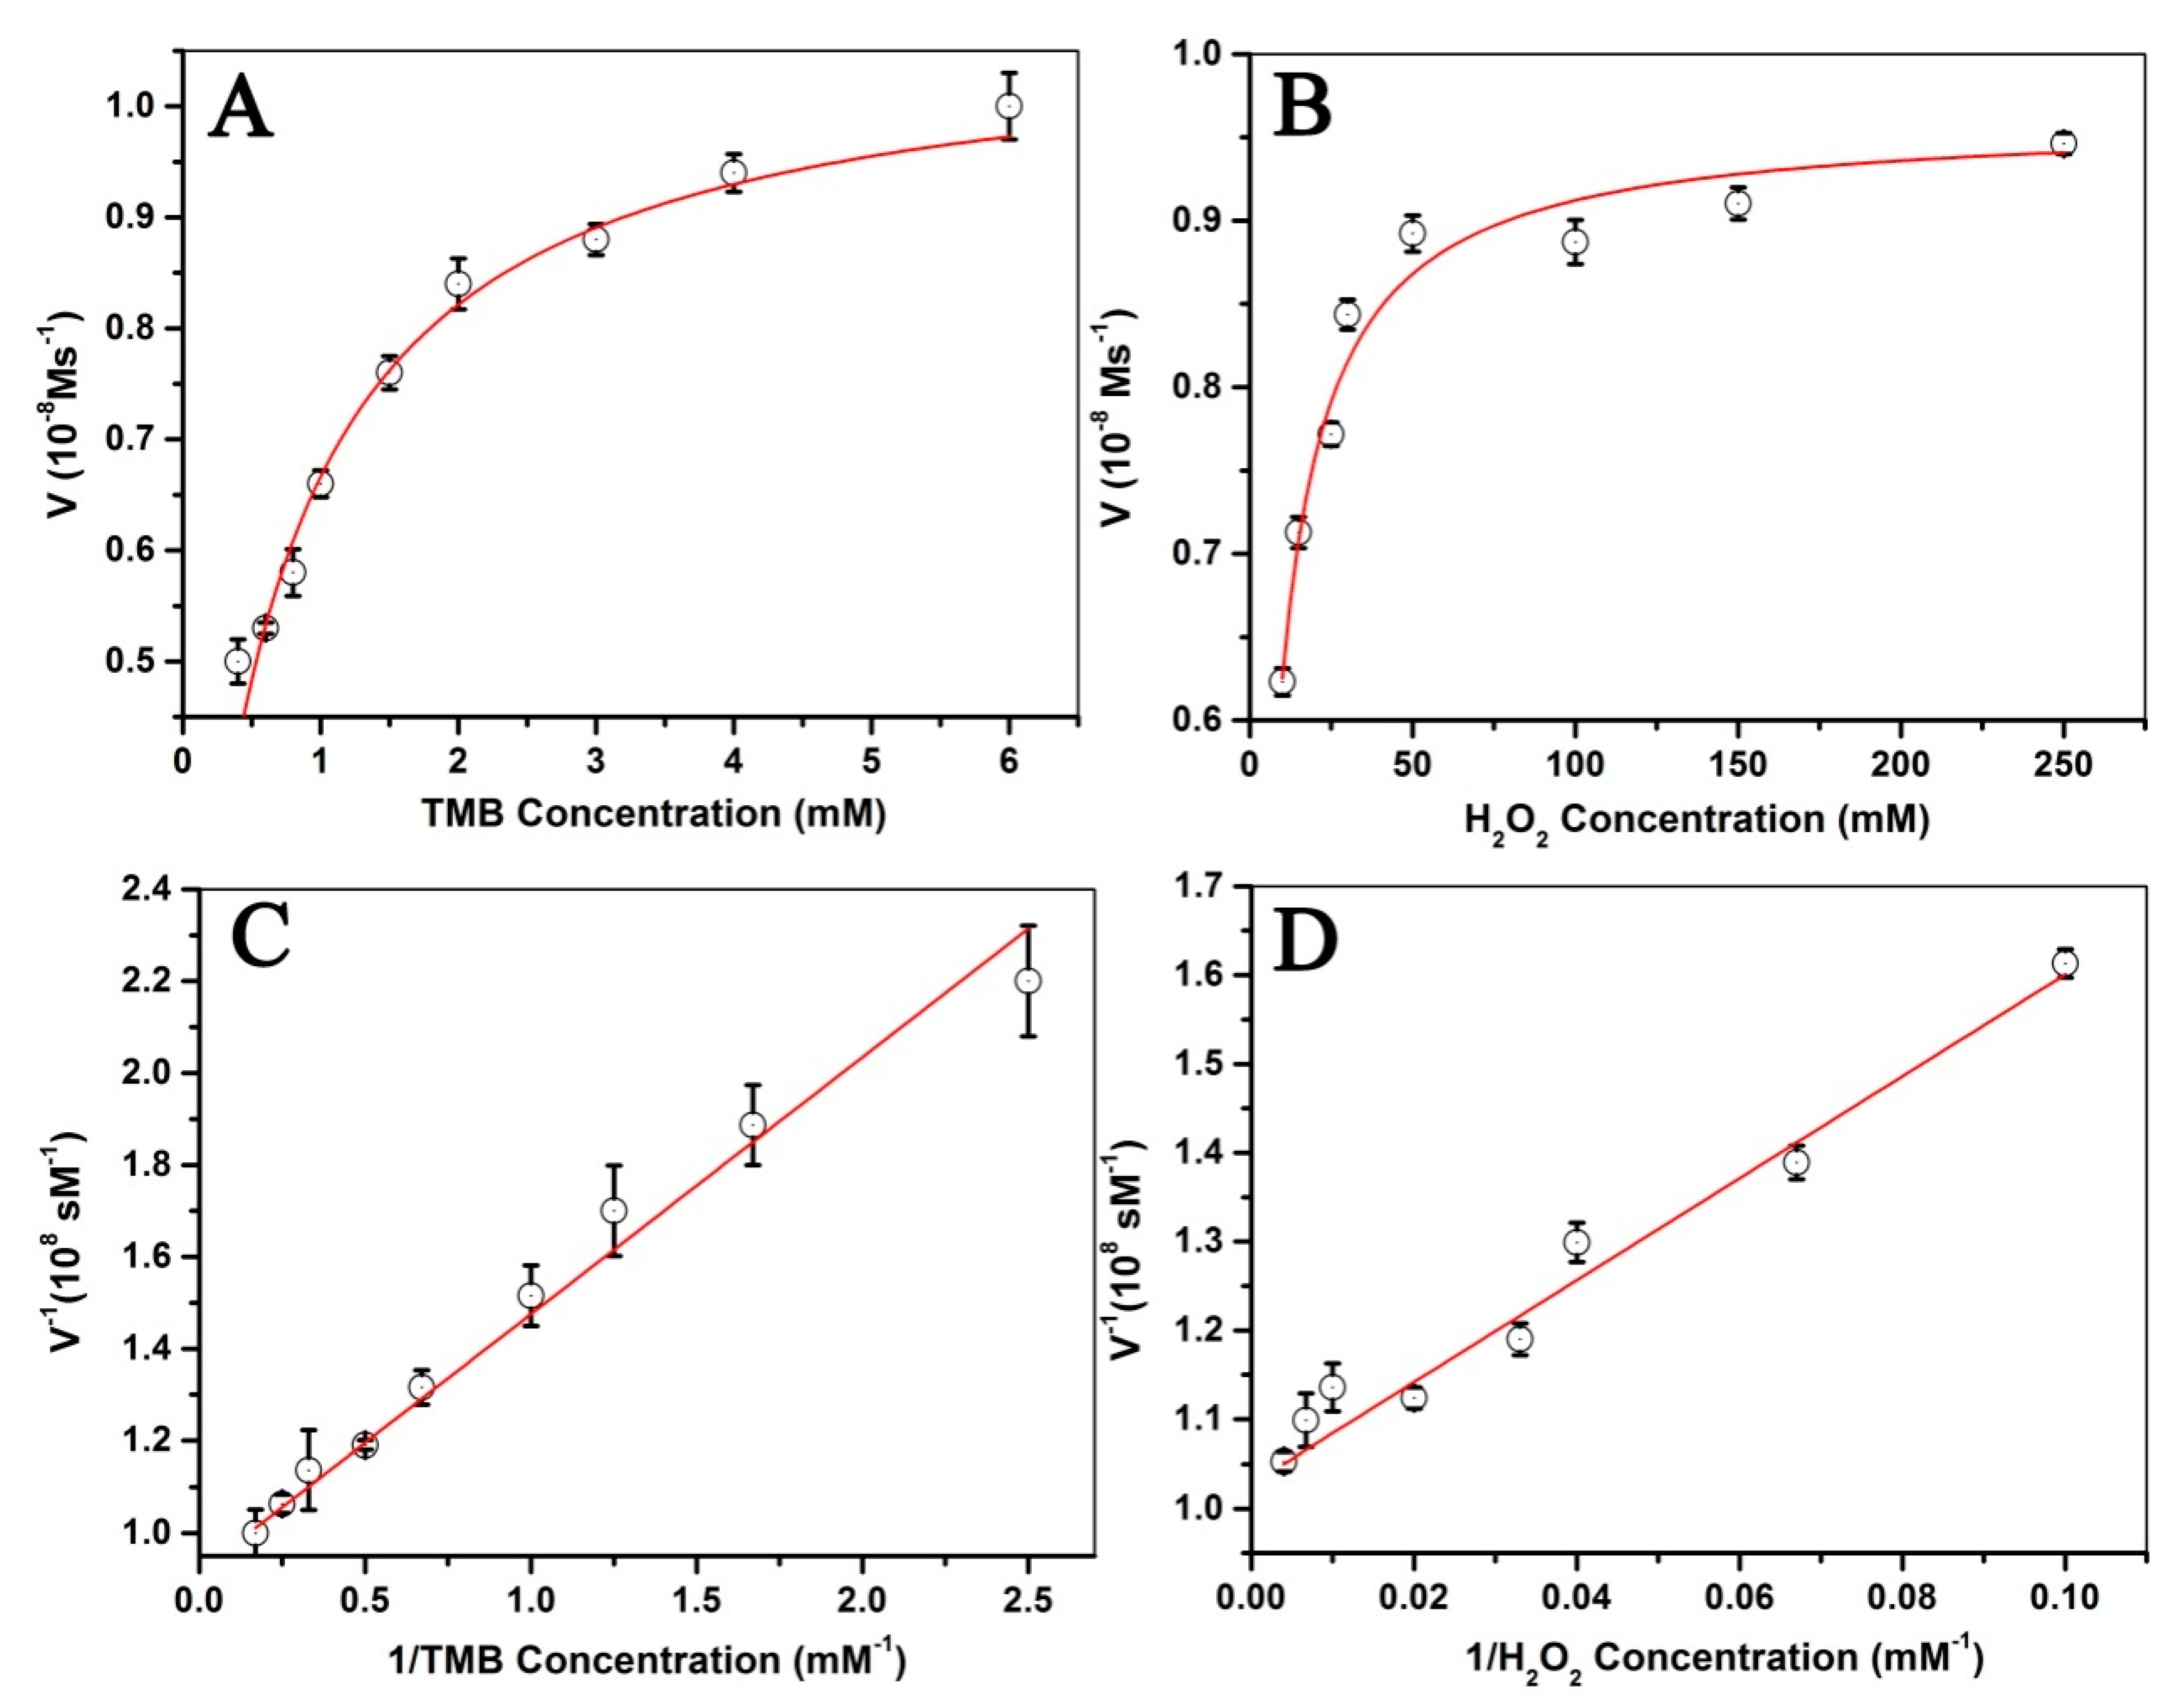
3.6. Steady-State Kinetic Study of Fe3O4@LNPs
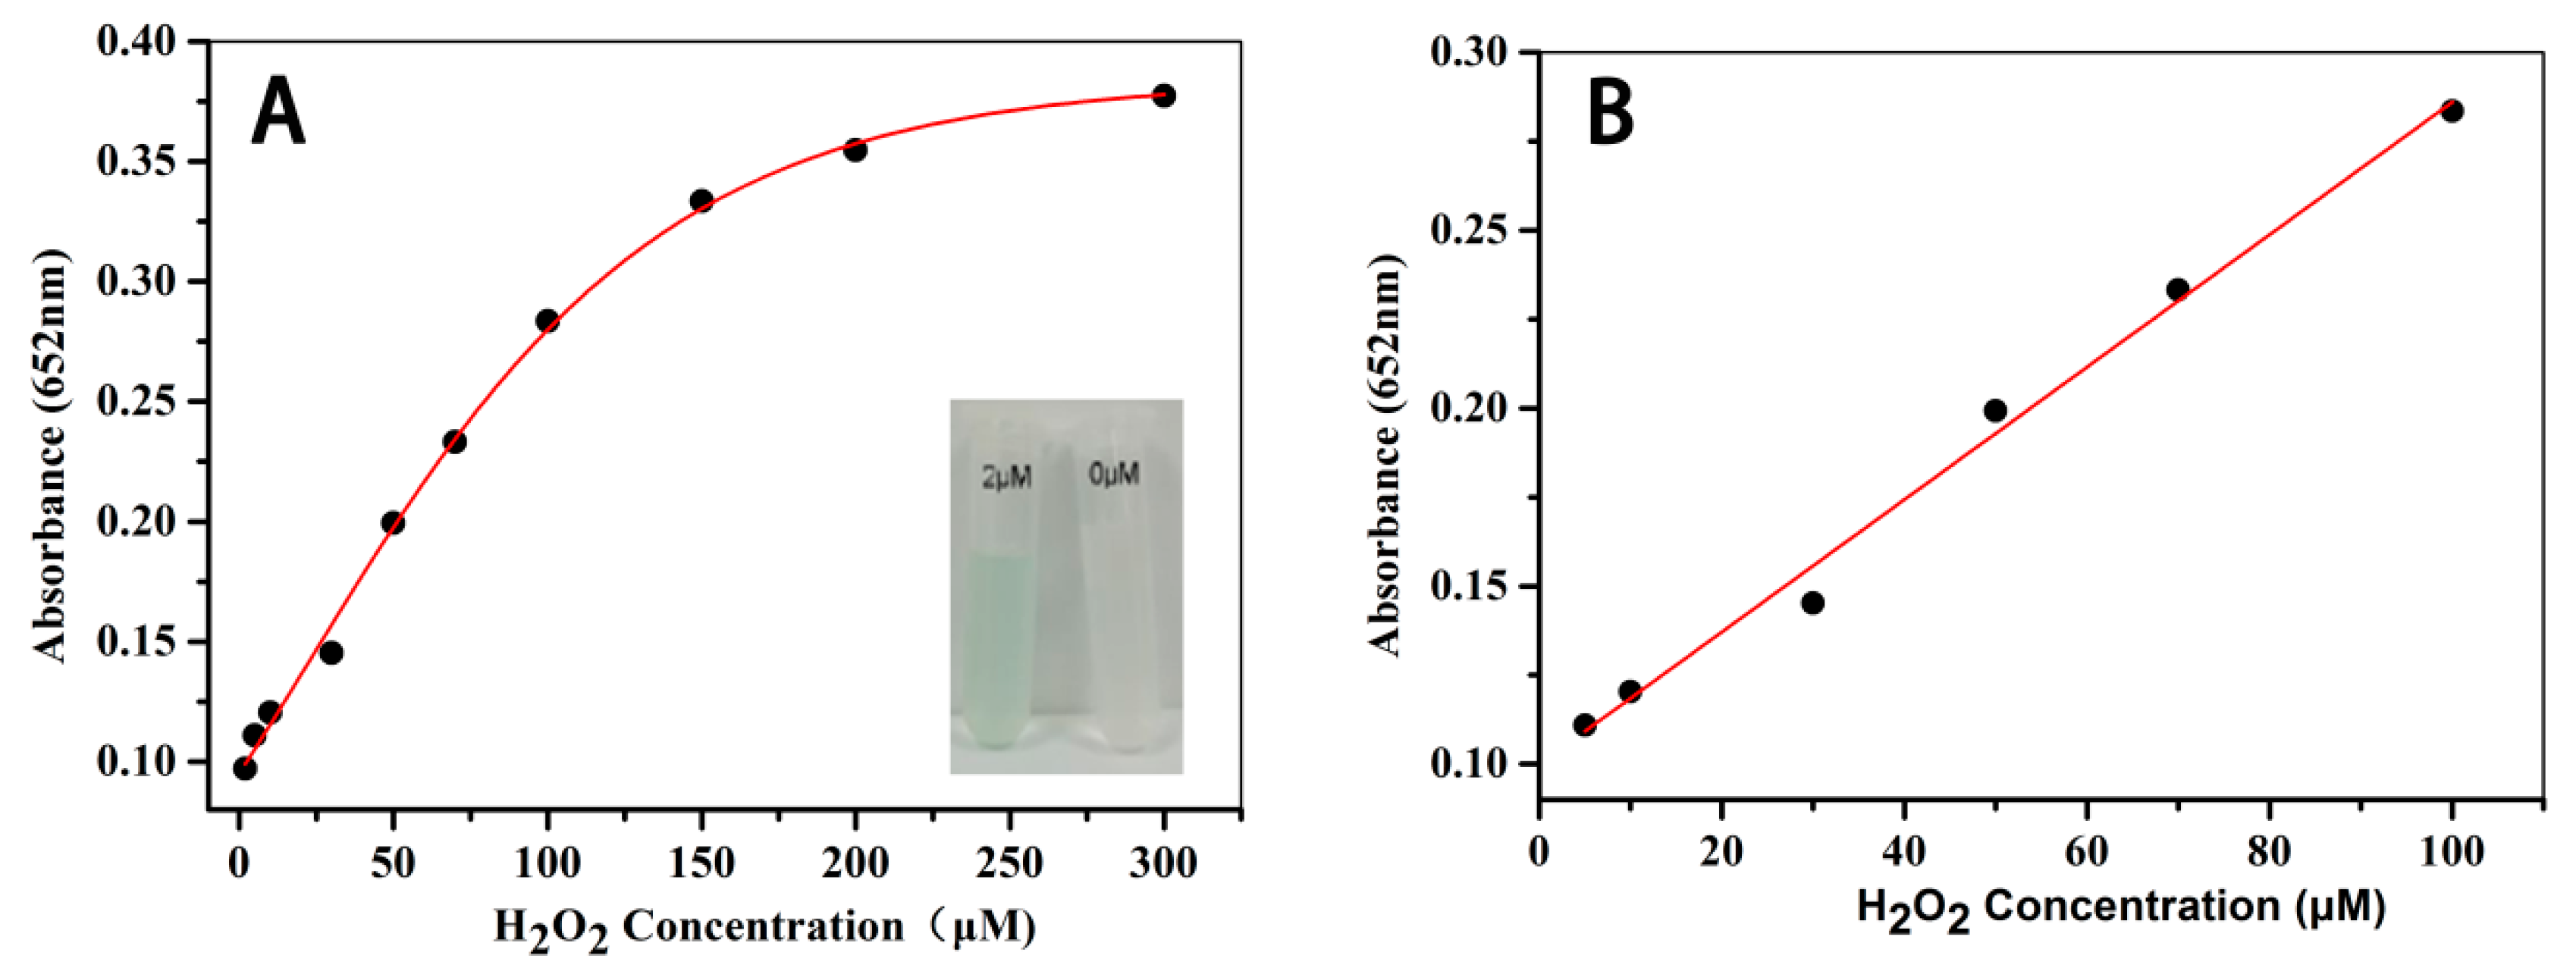
3.7. The Colorimetric Detection of H2O2
4. Conclusion
Author Contributions
Funding
Conflicts of Interest
References
- Muralikrishna, S.; Cheunkar, S.; Lertanantawong, B.; Ramakrishnappa, T.; Nagaraju, D.H.; Surareungchai, W.; Balakrishna, R.G.; Reddy, K.R. Graphene oxide-Cu(II) composite electrode for non-enzymatic determination of hydrogen peroxide. J. Electroanal. Chem. 2016, 776, 59–65. [Google Scholar] [CrossRef]
- Zhang, X.; Bi, X.; Di, W.; Qin, W. A simple and sensitive Ce(OH)CO3/H2O2/TMB reaction system for colorimetric determination of H2O2 and glucose. Sens. Actuators B Chem. 2016, 231, 714–722. [Google Scholar] [CrossRef]
- Sun, L.; Ding, Y.; Jiang, Y.; Liu, Q. Montmorillonite-loaded ceria nanocomposites with superior peroxidase-like activity for rapid colorimetric detection of H2O2. Sens. Actuators B Chem. 2017, 239, 848–856. [Google Scholar] [CrossRef]
- Zhang, Y.T.; Bai, S.J. An Improved Method for Determination of Trace Hydrogen Peroxide in Water. J. Environ. Health 2006, 23, 258–261. [Google Scholar]
- Sun, J.; Li, C.; Qi, Y.; Guo, S.; Liang, X. Optimizing Colorimetric Assay Based on V2O5 Nanozymes for Sensitive Detection of H2O2 and Glucose. Sensors 2016, 16, 584. [Google Scholar] [CrossRef] [PubMed]
- Chen, Y.H. Determination of Peroxides in Food Samples by High Performance Liquid Chromatography with Variable Wavelength Detector. Chin. J. Spectrosc. Lab. 2009, 26, 414–417. [Google Scholar]
- Nasir, M.; Nawaz, M.H.; Latif, U.; Yaqub, M.; Hayat, A.; Rahim, A. An overview on enzyme-mimicking nanomaterials for use in electrochemical and optical assays. Microchim. Acta 2016. [Google Scholar] [CrossRef]
- Sheng, Y.; Yang, H.; Wang, Y.; Han, L.; Zhao, Y.; Fan, A. Silver nanoclusters-catalyzed luminol chemiluminescence for hydrogen peroxide and uric acid detection. Talanta 2017, 166, 268–274. [Google Scholar] [CrossRef]
- Han, L.; Zhang, H.; Chen, D.; Li, F. Protein-Directed Metal Oxide Nanoflakes with Tandem Enzyme-Like Characteristics: Colorimetric Glucose Sensing Based on One-Pot Enzyme-Free Cascade Catalysis. Adv. Funct. Mater. 2018, 28, 1800018. [Google Scholar] [CrossRef]
- Zhao, K.; Gu, W.; Zheng, S.; Zhang, C.; Xian, Y. SDS–MoS2 nanoparticles as highly-efficient peroxidase mimetics for colorimetric detection of H2O2 and glucose. Talanta 2015, 141, 47–52. [Google Scholar] [CrossRef]
- Gao, L.; Zhuang, J.; Nie, L.; Zhang, J.; Zhang, Y.; Gu, N.; Wang, T.; Feng, J.; Yang, D.; Perrett, S. Intrinsic peroxidase-like activity of ferromagnetic nanoparticles. Nat. Nanotechnol. 2007, 2, 577–583. [Google Scholar] [CrossRef] [PubMed]
- Asati, A.; Santra, S.; Kaittanis, C.; Nath, S.; Perez, J.M. Oxidase-like activity of polymer-coated cerium oxide nanoparticles. Angew. Chem. 2009, 48, 2308–2312. [Google Scholar] [CrossRef] [PubMed]
- Liu, Q.; Yang, Y.; Li, H.; Zhu, R.; Shao, Q.; Yang, S.; Xu, J. NiO nanoparticles modified with 5,10,15,20-tetrakis(4-carboxyl pheyl)-porphyrin: Promising peroxidase mimetics for H2O2 and glucose detection. Biosens. Bioelectron. 2015, 64, 147–153. [Google Scholar] [CrossRef] [PubMed]
- Liu, J.; Meng, L.; Fei, Z.; Dyson, P.J.; Jing, X.; Liu, X. MnO2 nanosheets as an artificial enzyme to mimic oxidase for rapid and sensitive detection of glutathione. Biosens. Bioelectron. 2017, 90, 69–74. [Google Scholar] [CrossRef] [PubMed]
- Ning, L.Y.; Guan, X.L.; Ma, J.W.; Wang, M.; Fan, X.B.; Zhang, G.L.; Zhang, F.B.; Peng, W.C.; Li, Y. A highly sensitive nonenzymatic H2O2 sensor based on platinum, ZnFe2O4 functionalized reduced graphene oxide. J. Alloy. Compd. 2018, 738, 317–322. [Google Scholar] [CrossRef]
- Yang, X.; Ouyang, Y.J.; Wu, F.; Hu, Y.J.; Zhang, H.F.; Wu, Z.Y. In situ controlled preparation of platinum nanoparticles dopping into graphene sheets@cerium oxide nanocomposites sensitized screen printed electrode for nonenzymatic electrochemical sensing of hydrogen peroxide. J. Electroanal. Chem. 2016, 777, 85–91. [Google Scholar] [CrossRef]
- Khan, M.E.; Khan, M.M.; Cho, M.H. Defected graphene nano-platelets for enhanced hydrophilic nature and visible light-induced photoelectrochemical performances. J. Phys. Chem. Solids 2017, 104, 233–242. [Google Scholar] [CrossRef]
- Lievonen, M.; Valle-Delgado, J.J.; Mattinen, M.L.; Hult, E.L.; Lintinen, K.; Kostiainen, M.A.; Paananen, A.; Szilvay, G.R.; Setälä, H.; Österberg, M. Simple process for lignin nanoparticle preparation. Green Chem. 2016, 18, 1416–1422. [Google Scholar] [CrossRef]
- Ragauskas, A.J.; Beckham, G.T.; Biddy, M.J.; Chandra, R.; Chen, F.; Davis, M.F.; Davison, B.H.; Dixon, R.A.; Gilna, P.; Keller, M. Lignin valorization: Improving lignin processing in the biorefinery. Science 2014, 344, 1246843. [Google Scholar] [CrossRef]
- Hilgers, R.; Vincken, J.-P.; Gruppen, H.; Kabel, M.A. Laccase/Mediator Systems: Their Reactivity toward Phenolic Lignin Structures. ACS Sustain. Chem. Eng. 2018, 6, 2037–2046. [Google Scholar] [CrossRef]
- Zhang, H.; Bai, Y.; Zhou, W.; Chen, F. Color reduction of sulfonated eucalyptus kraft lignin. Int. J. Biol. Macromol. 2017, 97, 201–208. [Google Scholar] [CrossRef] [PubMed]
- Chang, Q.; Deng, K.; Zhu, L.; Jiang, G.; Yu, C.; Tang, H. Determination of hydrogen peroxide with the aid of peroxidase-like Fe3O4 magnetic nanoparticles as the catalyst. Microchim. Acta 2009, 165, 299. [Google Scholar] [CrossRef]
- Jiang, B.; Duan, D.; Gao, L.; Zhou, M.; Fan, K.; Tang, Y.; Xi, J.; Bi, Y.; Tong, Z.; Gao, G.F.; et al. Standardized assays for determining the catalytic activity and kinetics of peroxidase-like nanozymes. Nat. Protoc. 2018, 13, 1506–1520. [Google Scholar] [CrossRef]
- Zhu, M.; Dai, Y.; Wu, Y.; Liu, K.; Qi, X.; Sun, Y. Bandgap control of alpha-Fe2O3 nanozymes and their superior visible light promoted peroxidase-like catalytic activity. Nanotechnology 2018, 29, 465704. [Google Scholar] [CrossRef] [PubMed]
- Ding, Y.; Yang, B.; Liu, H.; Liu, Z.; Zhang, X.; Zheng, X.; Liu, Q. FePt-Au ternary metallic nanoparticles with the enhanced peroxidase-like activity for ultrafast colorimetric detection of H2O2. Sens. Actuators B Chem. 2018, 259, 775–783. [Google Scholar] [CrossRef]
- Liu, Q.; Zhang, L.; Li, H.; Jia, Q.; Jiang, Y.; Yang, Y.; Zhu, R. One-pot synthesis of porphyrin functionalized γ-Fe2O3 nanocomposites as peroxidase mimics for H2O2 and glucose detection. Mater. Sci. Eng. C 2015, 55, 193–200. [Google Scholar] [CrossRef] [PubMed]
- Chen, Y.; Xianyu, Y.; Dong, M.; Zhang, J.; Zheng, W.; Qian, Z.; Jiang, X. Cascade Reaction-Mediated Assembly of Magnetic/Silver Nanoparticles for Amplified Magnetic Biosensing. Anal. Chem. 2018, 90, 6906–6912. [Google Scholar] [CrossRef]
- Zhao, W.; Xiao, L.P.; Song, G.; Sun, R.C.; He, L.; Singh, S.; Simmons, B.A.; Cheng, G. From lignin subunits to aggregates: Insights into lignin solubilization. Green Chem. 2017, 19, 3272–3281. [Google Scholar] [CrossRef]
- Xiong, F.; Han, Y.; Wang, S.; Li, G.; Qin, T.; Chen, Y.; Chu, F. Preparation and Formation Mechanism of Renewable Lignin Hollow Nanospheres with a Single Hole by Self-Assembly. Acs Sustain. Chem. Eng. 2017, 5, 2273–2281. [Google Scholar] [CrossRef]
- Destrée, C.; Nagy, J.B. Mechanism of formation of inorganic and organic nanoparticles from microemulsions. Adv. Colloid Interface Sci. 2006, 123–126, 353–367. [Google Scholar]
- Ishikawa, Y.; Katoh, Y.; Ohshima, H. Colloidal stability of aqueous polymeric dispersions: Effect of pH and salt concentration. Colloids Surf. B-Biointerfaces 2005, 42, 53–58. [Google Scholar] [CrossRef] [PubMed]
- Liu, H.; Jiao, M.; Gu, C.; Zhang, M. Au@CuxOS yolk-shell nanomaterials with porous shells act as a new peroxidase mimic for the colorimetric detection of H2O2. J. Alloy. Compd. 2017, 741, 197–204. [Google Scholar] [CrossRef]
- Wang, H.; Jiang, H.; Wang, S.; Shi, W.; He, J.; Liu, H.; Huang, Y. Fe3O4–MWCNT magnetic nanocomposites as efficient peroxidase mimic catalysts in a Fenton-like reaction for water purification without pH limitation. RSC Adv. 2014, 4, 45809–45815. [Google Scholar] [CrossRef]
- Jiang, J.; He, C.; Wang, S.; Jiang, H.; Li, J.; Li, L. Recyclable ferromagnetic chitosan nanozyme for decomposing phenol. Carbohydr. Polym. 2018, 198, 348–353. [Google Scholar] [CrossRef] [PubMed]
- Ding, Y.; Fan, F.R.; Tian, Z.Q.; Wang, Z.L. Sublimation-Induced Shape Evolution of Silver Cubes. Small 2009, 5, 2812–2815. [Google Scholar] [CrossRef] [PubMed]
- Liu, Q.Y.; Li, H.; Zhao, Q.R.; Zhu, R.R.; Yang, Y.T.; Jia, Q.Y.; Bian, B.; Zhuo, L.H. Glucose-sensitive colorimetric sensor based on peroxidase mimics activity of porphyrin-Fe(3)O(4) nanocomposites. Mater. Sci. Eng. C-Mater. Biol. Appl. 2014, 41, 142–151. [Google Scholar] [CrossRef] [PubMed]
- Fan, K.; Wang, H.; Xi, J.; Liu, Q.; Meng, X.; Duan, D.; Gao, L.; Yan, X. Optimization of Fe3O4 nanozyme activity via single amino acid modification mimicking an enzyme active site. Chem. Commun. 2016, 53, 424–427. [Google Scholar] [CrossRef]
- Chen, S.; Chi, M.; Yang, Z.; Gao, M.; Wang, C.; Lu, X. Carbon dots/Fe3O4 hybrid nanofibers as efficient peroxidase mimics for sensitive detection of H2O2 and ascorbic acid. Inorg. Chem. Front. 2017, 4, 1621–1627. [Google Scholar] [CrossRef]
- Hui, W.; Erkang, W. Fe3O4 magnetic nanoparticles as peroxidase mimetics and their applications in H2O2 and glucose detection. Anal. Chem. 2008, 80, 2250–2254. [Google Scholar] [CrossRef]
- Song, L.; Huang, C.; Zhang, W.; Ma, M.; Chen, Z.; Gu, N.; Zhang, Y. Graphene oxide-based Fe2O3 hybrid enzyme mimetic with enhanced peroxidase and catalase-like activities. Colloids Surf. A Physicochem. Eng. Asp. 2016, 506, 747–755. [Google Scholar] [CrossRef]


| Catalyst | Substrate | Km/mM | Vm/10−8 Ms−1 | Reference |
|---|---|---|---|---|
| Fe3O4@LNPs | TMB | 0.51 | 1.03 | This work |
| Fe3O4@LNPs | H2O2 | 5.30 | 0.96 | This work |
| Fe3O4 NPs | TMB | 0.01 | 3.44 | [11] |
| Fe3O4 NPs | H2O2 | 154 | 9.78 | [11] |
| HRP | TMB | 0.43 | 10.00 | [11] |
| HRP | H2O2 | 3.70 | 8.71 | [11] |
| His-Fe3O4 | H2O2 | 37.99 | - | [37] |
| Ala-Fe3O4 | H2O2 | 226.60 | - | [37] |
| P-Fe3O4 | TMB | 0.44 | - | [36] |
| CDs-Fe3O4 | H2O2 | 56.97 | - | [38] |
| GO-Fe3O4 | H2O2 | 305.00 | 1.01 | [40] |
© 2019 by the authors. Licensee MDPI, Basel, Switzerland. This article is an open access article distributed under the terms and conditions of the Creative Commons Attribution (CC BY) license (http://creativecommons.org/licenses/by/4.0/).
Share and Cite
Zhang, Q.; Li, M.; Guo, C.; Jia, Z.; Wan, G.; Wang, S.; Min, D. Fe3O4 Nanoparticles Loaded on Lignin Nanoparticles Applied as a Peroxidase Mimic for the Sensitively Colorimetric Detection of H2O2. Nanomaterials 2019, 9, 210. https://doi.org/10.3390/nano9020210
Zhang Q, Li M, Guo C, Jia Z, Wan G, Wang S, Min D. Fe3O4 Nanoparticles Loaded on Lignin Nanoparticles Applied as a Peroxidase Mimic for the Sensitively Colorimetric Detection of H2O2. Nanomaterials. 2019; 9(2):210. https://doi.org/10.3390/nano9020210
Chicago/Turabian StyleZhang, Qingtong, Mingfu Li, Chenyan Guo, Zhuan Jia, Guangcong Wan, Shuangfei Wang, and Douyong Min. 2019. "Fe3O4 Nanoparticles Loaded on Lignin Nanoparticles Applied as a Peroxidase Mimic for the Sensitively Colorimetric Detection of H2O2" Nanomaterials 9, no. 2: 210. https://doi.org/10.3390/nano9020210
APA StyleZhang, Q., Li, M., Guo, C., Jia, Z., Wan, G., Wang, S., & Min, D. (2019). Fe3O4 Nanoparticles Loaded on Lignin Nanoparticles Applied as a Peroxidase Mimic for the Sensitively Colorimetric Detection of H2O2. Nanomaterials, 9(2), 210. https://doi.org/10.3390/nano9020210