Evaluation of the Cytotoxicity and Oxidative Stress Response of CeO2-RGO Nanocomposites in Human Lung Epithelial A549 Cells

 ,
, 


Abstract
1. Introduction
2. Materials and Methods
2.1. Preparation of CeO2-RGO Nanocomposites, RGO and CeO2 NPs
2.2. Characterization
2.3. Cell Culture
2.4. Exposure of Cells to CeO2 NPs, RGO and CeO2-RGO Nanocomposites
2.5. Toxicity Experiments
2.6. Statistical Analysis
3. Results and Discussion
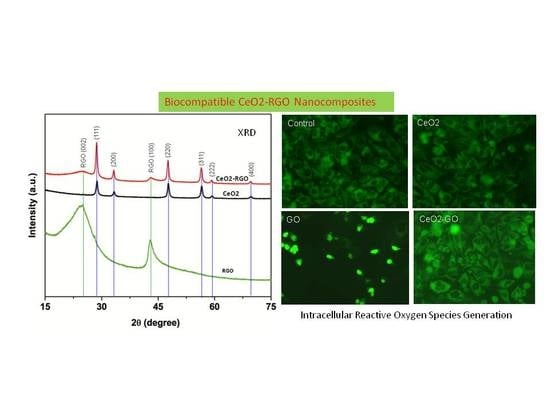
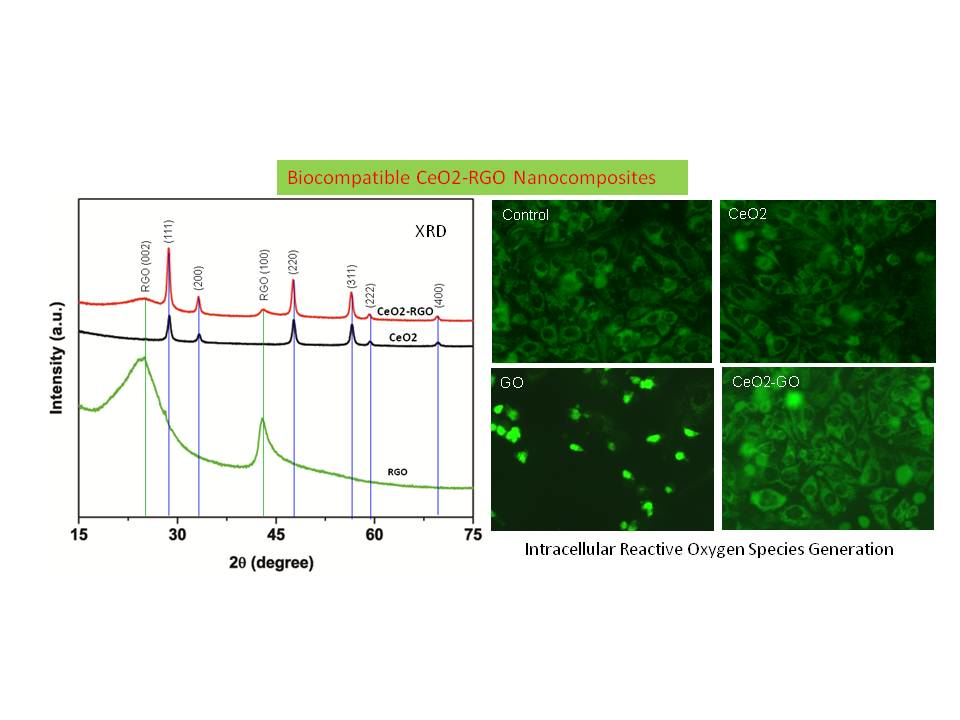
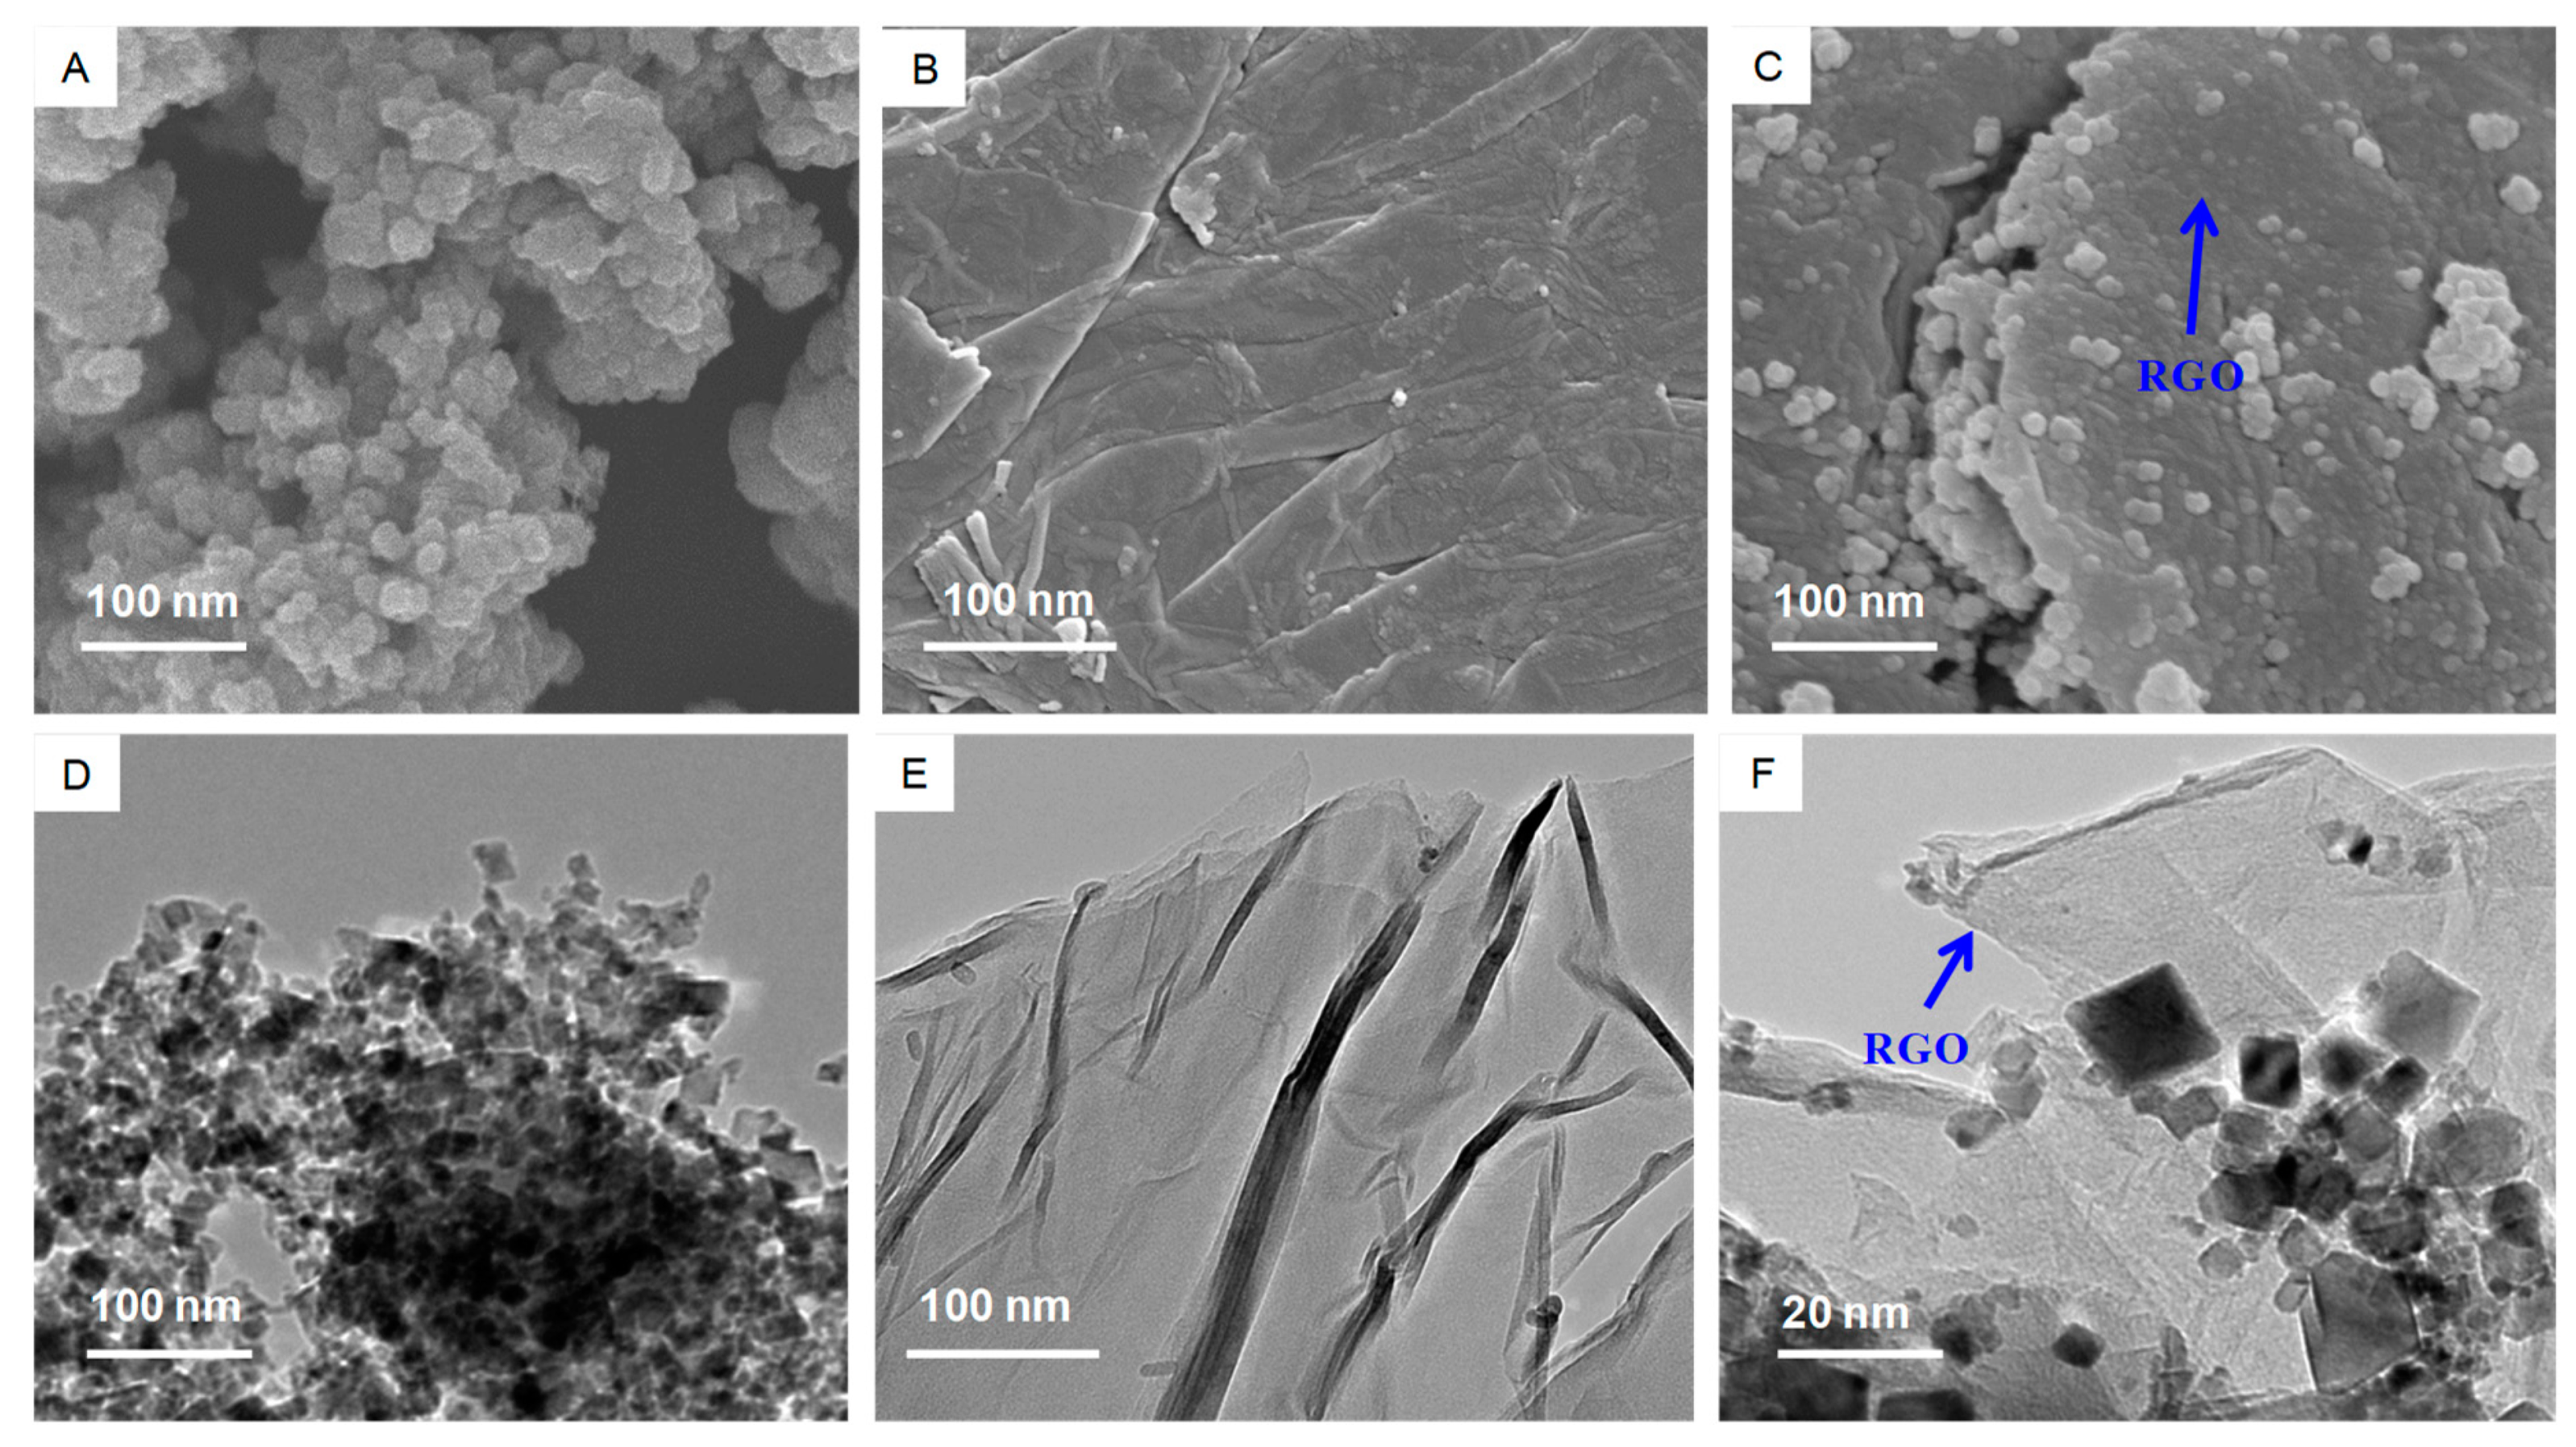
3.1. Characterization of CeO2 NPs, RGO and CeO2-RGO Nanocomposites
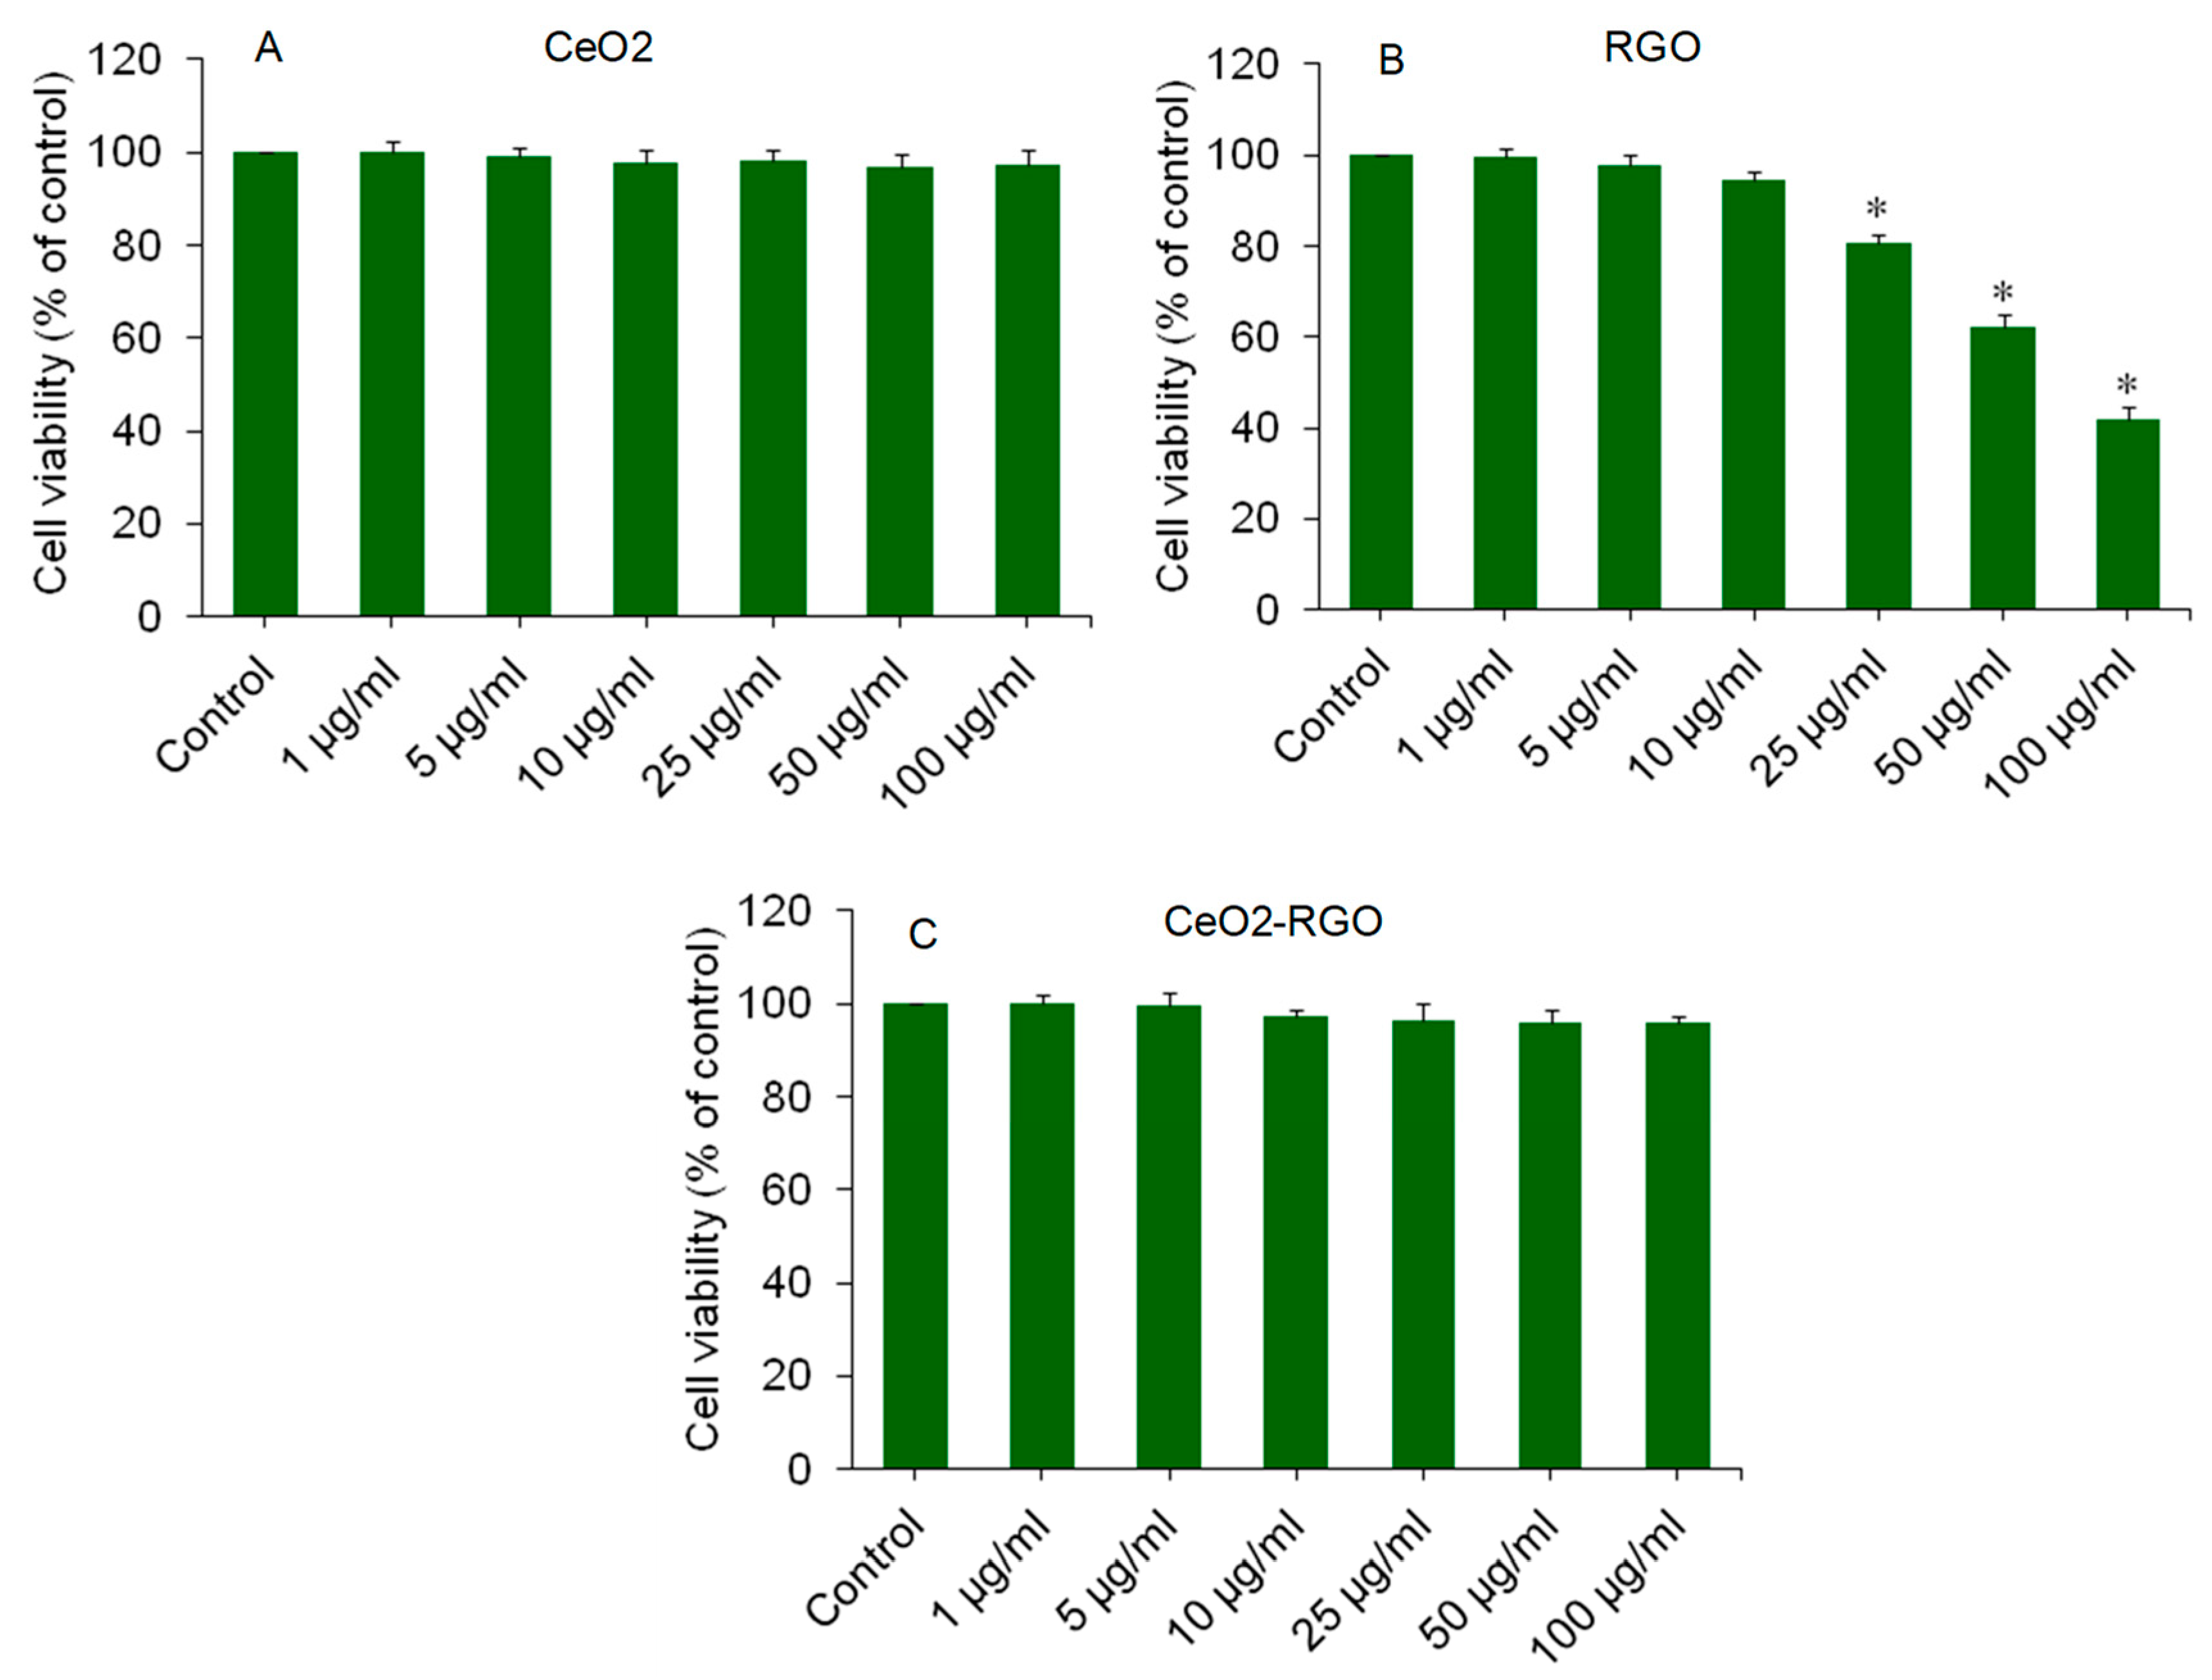
3.2. Cytotoxicity
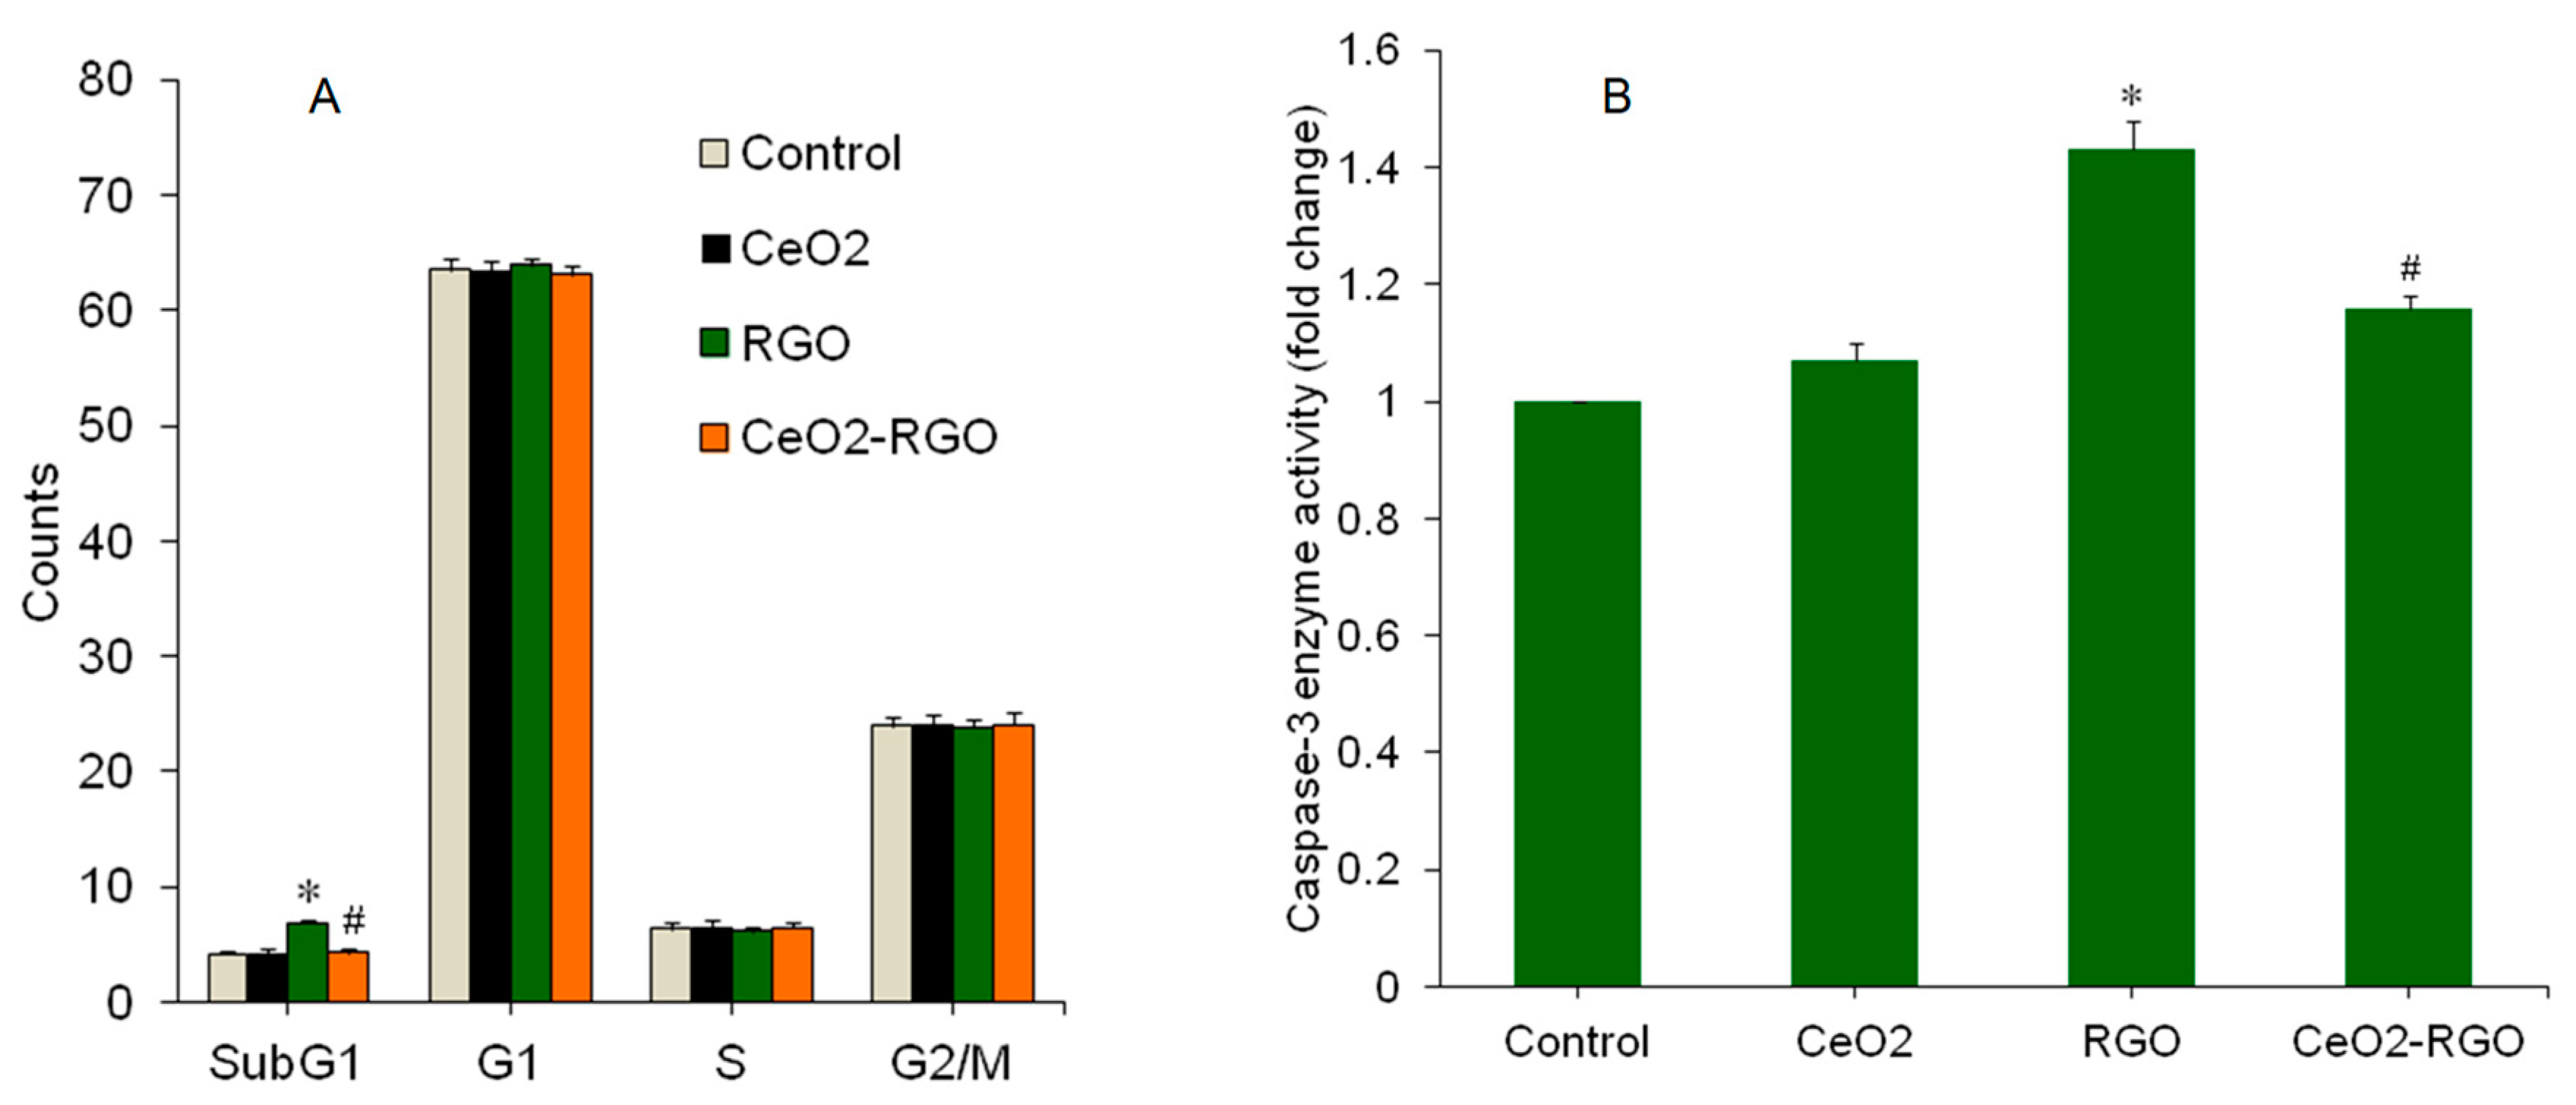
3.3. Apoptosis
3.4. Oxidative Stress
4. Conclusions
Author Contributions
Funding
Conflicts of Interest
References
- Geim, A.K. Graphene: Status and prospects. Science 2009, 324, 1530–1534. [Google Scholar] [CrossRef]
- Lalwani, G.; D’Agati, M.; Khan, A.M.; Sitharaman, B. Toxicology of graphene-based nanomaterials. Adv. Drug. Deliv. Rev. 2016, 105, 109–144. [Google Scholar] [CrossRef]
- Palacios, T. Graphene electronics: Thinking outside the silicon box. Nat. Nanotechnol. 2011, 6, 464–465. [Google Scholar] [CrossRef] [PubMed]
- Krishnan, D.; Kim, F.; Luo, J.; Cruz-Silva, R.; Cote, L.J.; Jang, H.D.; Huang, J. Energetic graphene oxide: Challenges and opportunities. Nano Today 2012, 7, 137–152. [Google Scholar] [CrossRef]
- Zhang, B.; Wei, P.; Zhou, Z.; Wei, T. Interactions of graphene with mammalian cells: Molecular mechanisms and biomedical insights. Adv. Drug. Deliv. Rev. 2016, 105, 145–162. [Google Scholar] [CrossRef] [PubMed]
- Das, S.; Singh, S.; Singh, V.; Joung, D.; Dowding, J.M.; Reid, D.; Anderson, J.; Zhai, L.; Khondaker, S.I.; Self, W.T.; et al. Oxygenated functional group density on graphene oxide: Its effect on cell toxicity. Part. Part. Syst. Charact. 2013, 30, 148–157. [Google Scholar] [CrossRef]
- Mittal, S.; Kumar, V.; Dhiman, N.; Chauhan, L.K.; Pasricha, R.; Pandey, A.K. Physico-chemical properties based differential toxicity of graphene oxide/reduced graphene oxide in human lung cells mediated through oxidative stress. Sci. Rep. 2016, 6, 39548. [Google Scholar] [CrossRef] [PubMed]
- Marcano, D.C.; Kosynkin, D.V.; Berlin, J.M.; Sinitskii, A.; Sun, Z.; Slesarev, A.; Alemany, L.B.; Lu, W.; Tour, J.M. Improved synthesis of graphene oxide. ACS Nano 2010, 4, 4806–4814. [Google Scholar] [CrossRef] [PubMed]
- Wojtoniszak, M.; Chen, X.; Kalenczuk, R.J.; Wajda, A.; Łapczuk, J.; Kurzewski, M.; Drozdzik, M.; Chu, P.K.; Borowiak-Palen, E. Synthesis, dispersion, and cytocompatibility of graphene oxide and reduced graphene oxide. Colloid Surface B 2012, 89, 79–85. [Google Scholar] [CrossRef]
- Wang, K.; Ruan, J.; Song, H.; Zhang, J.; Wo, Y.; Guo, S. Biocompatibility of graphene oxide. Nanoscale Res. Lett. 2011, 6, 8. [Google Scholar] [CrossRef]
- Yang, K.; Wan, J.; Zhang, S.; Zhang, Y.; Lee, S.T.; Liu, Z. In vivo pharmacokinetics, long term biodistribution, and toxicology of PEGylated graphene in mice. ACS Nano 2011, 5, 516–522. [Google Scholar] [CrossRef] [PubMed]
- Chang, Y.; Yang, S.T.; Liu, J.H.; Dong, E.; Wang, Y.; Cao, A.; Liu, Y.; Wang, H. In vitro toxicity evaluation of graphene oxide on A549 cells. Toxicol. Lett. 2011, 200, 201–210. [Google Scholar] [CrossRef] [PubMed]
- Bengtson, S.; Kling, K.; Madsen, A.M.; Noergaard, A.W.; Jacobsen, N.R.; Clausen, P.A.; Alonso, B.; Pesquera, A.; Zurutuza, A.; Ramos, R.; et al. No cytotoxicity or genotoxicity of graphene and graphene oxide in murine lung epithelial FE1 cells in vitro. Environ. Mol. Mutagenesis 2016, 57, 469–482. [Google Scholar] [CrossRef] [PubMed]
- Akhavan, O.; Ghaderi, E.; Akhavan, A. Size-dependent genotoxicity of graphene nanoplatelets in human stem cells. Biomaterials 2012, 33, 8017–8025. [Google Scholar] [CrossRef] [PubMed]
- Schinwald, A.; Murphy, F.A.; Jones, A.; MacNee, W.; Donaldson, K. Graphene-based nanoplatelets: A new risk to the respiratory system as a consequence of their unusual aerodynamic properties. ACS Nano 2012, 6, 736–746. [Google Scholar] [CrossRef] [PubMed]
- Matesanz, M.C.; Vila, M.; Feito, M.J.; Linares, J.; Gonçalves, G.; Vallet-Regi, M.; Marques, P.A.; Portolés, M.T. The effects of graphene oxide nanosheets localized on F-actin filaments on cell-cycle alterations. Biomaterials 2013, 34, 1562–1569. [Google Scholar] [CrossRef] [PubMed]
- Pelin, M.; Fusco, L.; León, V.; Martín, C.; Criado, A.; Sosa, S.; Vázquez, E.; Tubaro, A.; Prato, M. Differential cytotoxic effects of graphene and graphene oxide on skin keratinocytes. Sci. Rep. 2017, 7, 40572. [Google Scholar] [CrossRef]
- Ali, D.; Alarifi, S.; Alkahtani, S.; Almeer, R.S. Silver-doped graphene oxide nanocomposite triggers cytotoxicity and apoptosis in human hepatic normal and carcinoma cells. Int. J. Nanomed. 2018, 13, 5685–5699. [Google Scholar] [CrossRef]
- Gurunathan, S.; Kang, M.-H.; Jeyaraj, M.; Kim, J.-H. Differential cytotoxicity of different sizes of graphene oxide nanoparticles in leydig (TM3) and sertoli (TM4) cells. Nanomaterials 2019, 9, 139. [Google Scholar] [CrossRef]
- Hirst, S.M.; Karakoti, A.S.; Tyler, R.D.; Sriranganathan, N.; Seal, S.; Reilly, C.M. Anti-inflammatory properties of cerium oxide nanoparticles. Small 2009, 5, 2848–2856. [Google Scholar] [CrossRef]
- Akhtar, M.J.; Ahamed, M.; Alhadlaq, H.A.; Khan, M.A.M.; Alrokayan, S.A. Glutathione replenishing potential of CeO2 nanoparticles in human breast and fibrosarcoma cells. J. Colloid Interface Sci. 2015, 453, 21–27. [Google Scholar] [CrossRef] [PubMed]
- Khan, M.A.M.; Khan, W.; Ahamed, M.; Alhazaa, A.N. Investigation on the structure and physical properties of Fe3O4/RGO nanocomposites and their photocatalytic application. Mater. Sci. Semicond. Process. 2019, 99, 44–53. [Google Scholar] [CrossRef]
- Wang, S.; Gao, R.; Zhou, K. The influence of cerium dioxide functionalized reduced graphene oxide on reducing fire hazards of thermoplastic polyurethane nanocomposites. J. Colloid Interface Sci. 2019, 536, 127–134. [Google Scholar] [CrossRef] [PubMed]
- Diaz-Diestra, D.; Thapa, B.; Badillo-Diaz, D.; Beltran-Huarac, J.; Morell, G.; Weiner, B.R. Graphene oxide/ZnS:Mn nanocomposite functionalized with folic acid as a nontoxic and effective theranostic platform for breast cancer treatment. Nanomaterials 2018, 8, 484. [Google Scholar] [CrossRef]
- Wilding, J.L.; Bodmer, W.F. Cancer cell lines for drug discoveryand development. Cancer Res. 2014, 74, 2377–2384. [Google Scholar] [CrossRef]
- Qiang, S.; Wang, M.; Liang, J.; Zhao, X.; Fan, Q.; Geng, R.; Luo, D.; Li, Z.; Zhang, L. Effects of morphology regulated by Pb2+ on graphene oxide cytotoxicity: Spectroscopic and in vitro investigations. Mater. Chem. Phys. 2020, 239, 122016. [Google Scholar] [CrossRef]
- Liang, J.J.; Li, P.; Zhao, X.L.; Liu, Z.Y.; Fan, Q.H.; Li, Z.; Li, J.X.; Wang, D. Distinct interface behaviors of Ni(II) on graphene oxide and oxidized carbon nanotubes triggered by different topological aggregations. Nanoscale 2018, 10, 1383–1393. [Google Scholar] [CrossRef]
- Yu, H.T.; Zhang, B.W.; Bulin, C.; Li, R.H.; Xing, R.G. High-efficient synthesis of graphene oxide based on improved Hummers method. Sci. Rep. 2016, 6, 36143. [Google Scholar] [CrossRef]
- Kumar, S.; Kumar, A. Enhanced photocatalytic activity of rGO-CeO2 nanocomposites driven by sunlight. Mat. Sci. Eng. B 2017, 223, 98–108. [Google Scholar] [CrossRef]
- Ahamed, M.; Akhtar, M.J.; Siddiqui, M.A.; Ahmad, J.; Musarrat, J.; Al-Khedhairy, A.A.; AlSalhi, M.S.; Alrokayan, S.A. Oxidative stress mediated apoptosis induced by nickel ferrite nanoparticles in cultured A549 cells. Toxicology 2011, 283, 101–108. [Google Scholar] [CrossRef]
- Ahamed, M.; Akhtar, M.J.; Alhadlaq, H.A.; Khan, M.A.; Alrokayan, S.A. Comparative cytotoxic response of nickel ferrite nanoparticles in human liver HepG2 and breast MFC-7 cancer cells. Chemosphere 2015, 135, 278–288. [Google Scholar] [CrossRef] [PubMed]
- Siddiqui, M.A.; Alhadlaq, H.A.; Ahmad, J.; Al-Khedhairy, A.A.; Musarrat, J.; Ahamed, M. Copper oxide nanoparticles induced mitochondria mediated apoptosis in human hepatocarcinoma cells. PLoS ONE 2013, 8, e69534. [Google Scholar] [CrossRef] [PubMed]
- Ellman, G.I. Tissue sulfhydryl groups. Arch. Biochem. Biophys. 1959, 82, 70–77. [Google Scholar] [CrossRef]
- Bradford, M.M. A rapid and sensitive for the quantitation of microgram quantities of protein utilizing the principle of protein-dye binding. Anal. Biochem. 1976, 72, 248–254. [Google Scholar] [CrossRef]
- Khan, M.A.M.; Khan, W.; Ahamed, M.; Alhazaa, A.N. Microstructural properties and enhanced photocatalytic performance of Zn doped CeO2 nanocrystals. Sci. Rep. 2017, 7, 12560. [Google Scholar] [CrossRef]
- Guo, L.; Zhong, Q.; Ding, J.; Lv, Z.; Zhao, W.; Deng, Z. Low-temperature NOx (x = 1, 2) removal with °OH radicals from catalytic ozonation over a RGO-CeO2 nanocomposite: The highly promotional effect of oxygen vacancies. RSC Adv. 2016, 6, 87869–87877. [Google Scholar] [CrossRef]
- Wang, Z.; Zhao, P.; He, D.; Cheng, Y.; Liao, L.; Li, S.; Luo, Y.; Peng, Z.; Li, P. Cerium oxide immobilized reduced graphene oxide hybrids with excellent microwave absorbing performance. Phys. Chem. Chem. Phys. 2018, 20, 14155–14165. [Google Scholar] [CrossRef]
- Channei, D.; Inceesungvorn, B.; Wetchakun, N.; Ukritnukun, S.; Nattestad, A.; Chen, J.; Phanichphant, S. Photocatalytic degradation of methyl orange by CeO2 and Fe-doped CeO2 films under visible light irradiation. Sci. Rep. 2014, 4, 5757. [Google Scholar] [CrossRef]
- Zhang, J.; Xiong, Z.; Zhao, X.S. Graphene–metal–oxide composites for the degradation of dyes under visible light irradiation. J. Mater. Chem. 2011, 21, 3634–3640. [Google Scholar] [CrossRef]
- Kannan, K.; Jain, S.K. Oxidative stress and apoptosis. Pathophysiology 2000, 7, 153–163. [Google Scholar] [CrossRef]
- Zhuang, C.; She, Y.; Zhang, H.; Song, M.; Han, Y.; Li, Y.; Zhu, Y. Cytoprotective effect of deferiprone against aluminum chloride-induced oxidative stress and apoptosis in lymphocytes. Toxicol. Lett. 2018, 285, 132–138. [Google Scholar] [CrossRef] [PubMed]
- Ishikawa, K.; Ishii, H.; Saito, T. DNA damage-dependent cell cycle checkpoints and genomic stability. DNA Cell Biol. 2006, 25, 406–411. [Google Scholar] [CrossRef] [PubMed]
- Sharma, V.; Anderson, D.; Dhawan, A. Zinc oxide nanoparticles induce oxidative DNA damage and ROS-triggered mitochondria mediated apoptosis in human liver cells (HepG2). Apoptosis 2012, 17, 852–870. [Google Scholar] [CrossRef] [PubMed]
- Ahamed, M.; Akhtar, M.J.; Alhadlaq, H.A.; Alrokayan, S.A. Assessment of the lung toxicity of copper oxide nanoparticles: Current status. Nanomedicine (Lond.) 2015, 10, 2365–2377. [Google Scholar] [CrossRef] [PubMed]
- Carocho, M.; Ferreira, I.R. A review on antioxidants, prooxidants and related controversy: Natural and synthetic compounds, screening and analysis methodologies and future perspectives. Food Chem. Toxicol. 2013, 51, 15–25. [Google Scholar] [CrossRef]
- Nel, A.; Xia, T.; Madler, L.; Li, N. Toxic potential of materials at the nano-level. Science 2006, 311, 622–627. [Google Scholar] [CrossRef]
- Shaheen, F.; Aziz, M.H.; Fatima, M.; Khan, M.A.; Ahmed, F.; Ahmad, R.; Ahmad, M.A.; Alkhuraiji, T.S.; Akram, M.W.; Raza, R.; et al. In Vitro cytotoxicity and morphological assessments of GO-ZnO against the MCF-7 Cells: Determination of singlet oxygen by chemical trapping. Nanomaterials 2018, 8, 539. [Google Scholar] [CrossRef]
- Franco, R.; Panayiotidis, M.I.; Cidlowski, J.A. Glutathione depletion is necessary for apoptosis in lymphoid cells independent of reactive oxygen species formation. J. Biol. Chem. 2007, 282, 30452–30465. [Google Scholar] [CrossRef]
- Circu, M.L.; Aw, T.Y. Reactive oxygen species, cellular redox systems, and apoptosis. Free Radic. Biol. Med. 2010, 48, 749–762. [Google Scholar] [CrossRef]
- Li, X.; Sun, L.; Ge, A.; Guo, Y. Enhanced chemiluminescence detection of thrombin based on cerium oxide nanoparticles. Chem. Commun. 2011, 47, 947–949. [Google Scholar] [CrossRef]
- Lin, Y.H.; Xu, C.; Ren, J.S.; Qu, X.G. Using thermally regenerable cerium oxide nanoparticles in biocomputing to perform label free, resettable, and colorimetric logic operations. Angew. Chem. Int. Ed. 2012, 51, 12579–12583. [Google Scholar] [CrossRef] [PubMed]
- Wang, C.; Li, J.; Amatore, C.; Chen, Y.; Jiang, H.; Wang, X.M. Gold nanoclusters and graphene nanocomposites for drug delivery and imaging of cancer cells. Angew. Chem. 2011, 50, 11644–11648. [Google Scholar] [CrossRef] [PubMed]
- Yin, H.; Zhou, Y.; Zhang, H.; Meng, X.; Ai, S. Electrochemical determination of microRNA-21 based on graphene, LNA integrated molecular beacon, AuNPs and biotin multifunctional bio bar codes and enzymatic assay system. Biosens. Bioelectron. 2012, 33, 247–253. [Google Scholar] [CrossRef] [PubMed]
- Darabdhara, G.; Das, M.R.; Singh, S.P.; Rengan, A.K.; Szunerits, S.; Boukherroub, R. Ag and Au nanoparticles/reduced graphene oxide composite materials: Synthesis and application in diagnostics and therapeutics. Adv. Colloid Interface Sci. 2019, 271, 101991. [Google Scholar] [CrossRef] [PubMed]


© 2019 by the authors. Licensee MDPI, Basel, Switzerland. This article is an open access article distributed under the terms and conditions of the Creative Commons Attribution (CC BY) license (http://creativecommons.org/licenses/by/4.0/).
Share and Cite
Ahamed, M.; Akhtar, M.J.; Khan, M.A.M.; Alaizeri, Z.M.; Alhadlaq, H.A. Evaluation of the Cytotoxicity and Oxidative Stress Response of CeO2-RGO Nanocomposites in Human Lung Epithelial A549 Cells. Nanomaterials 2019, 9, 1709. https://doi.org/10.3390/nano9121709
Ahamed M, Akhtar MJ, Khan MAM, Alaizeri ZM, Alhadlaq HA. Evaluation of the Cytotoxicity and Oxidative Stress Response of CeO2-RGO Nanocomposites in Human Lung Epithelial A549 Cells. Nanomaterials. 2019; 9(12):1709. https://doi.org/10.3390/nano9121709
Chicago/Turabian StyleAhamed, Maqusood, Mohd Javed Akhtar, M. A. Majeed Khan, ZabnAllah M. Alaizeri, and Hisham A. Alhadlaq. 2019. "Evaluation of the Cytotoxicity and Oxidative Stress Response of CeO2-RGO Nanocomposites in Human Lung Epithelial A549 Cells" Nanomaterials 9, no. 12: 1709. https://doi.org/10.3390/nano9121709
APA StyleAhamed, M., Akhtar, M. J., Khan, M. A. M., Alaizeri, Z. M., & Alhadlaq, H. A. (2019). Evaluation of the Cytotoxicity and Oxidative Stress Response of CeO2-RGO Nanocomposites in Human Lung Epithelial A549 Cells. Nanomaterials, 9(12), 1709. https://doi.org/10.3390/nano9121709