Sub-Micropillar Spacing Modulates the Spatial Arrangement of Mouse MC3T3-E1 Osteoblastic Cells

 , , , ,
  , ,
, ,  and
and 
Abstract
1. Introduction
2. Materials and Methods
3. Results
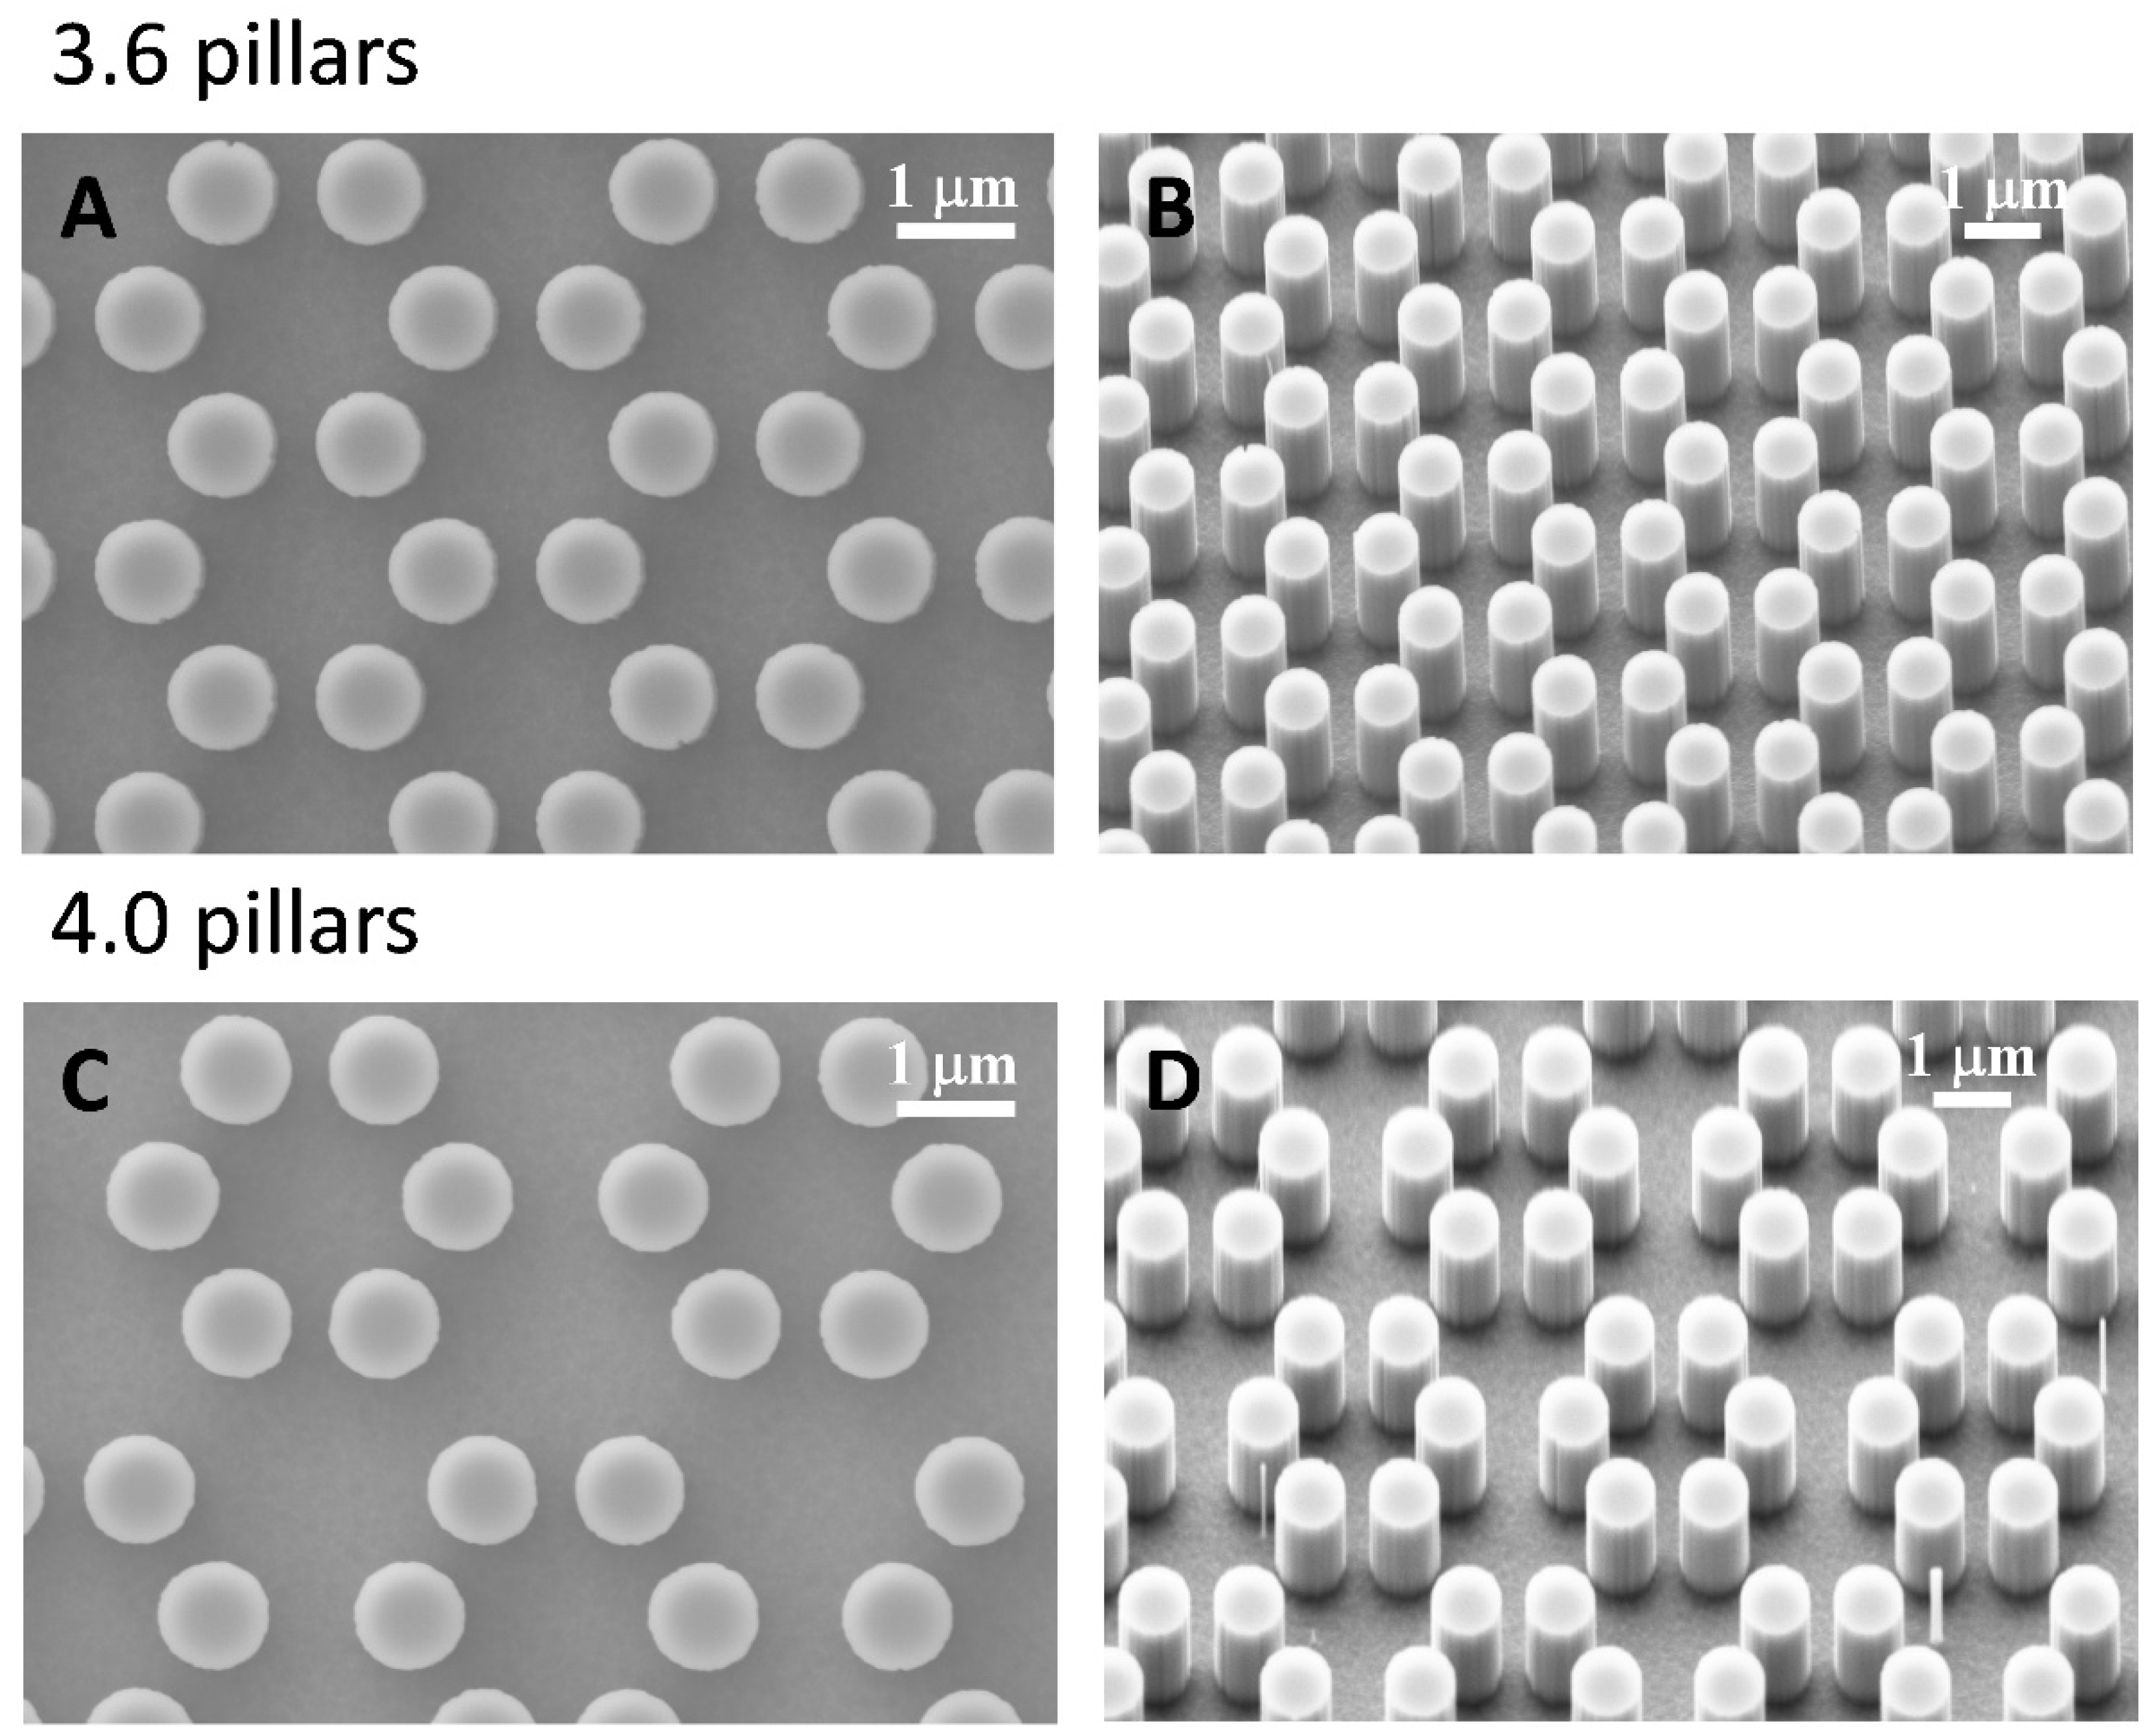
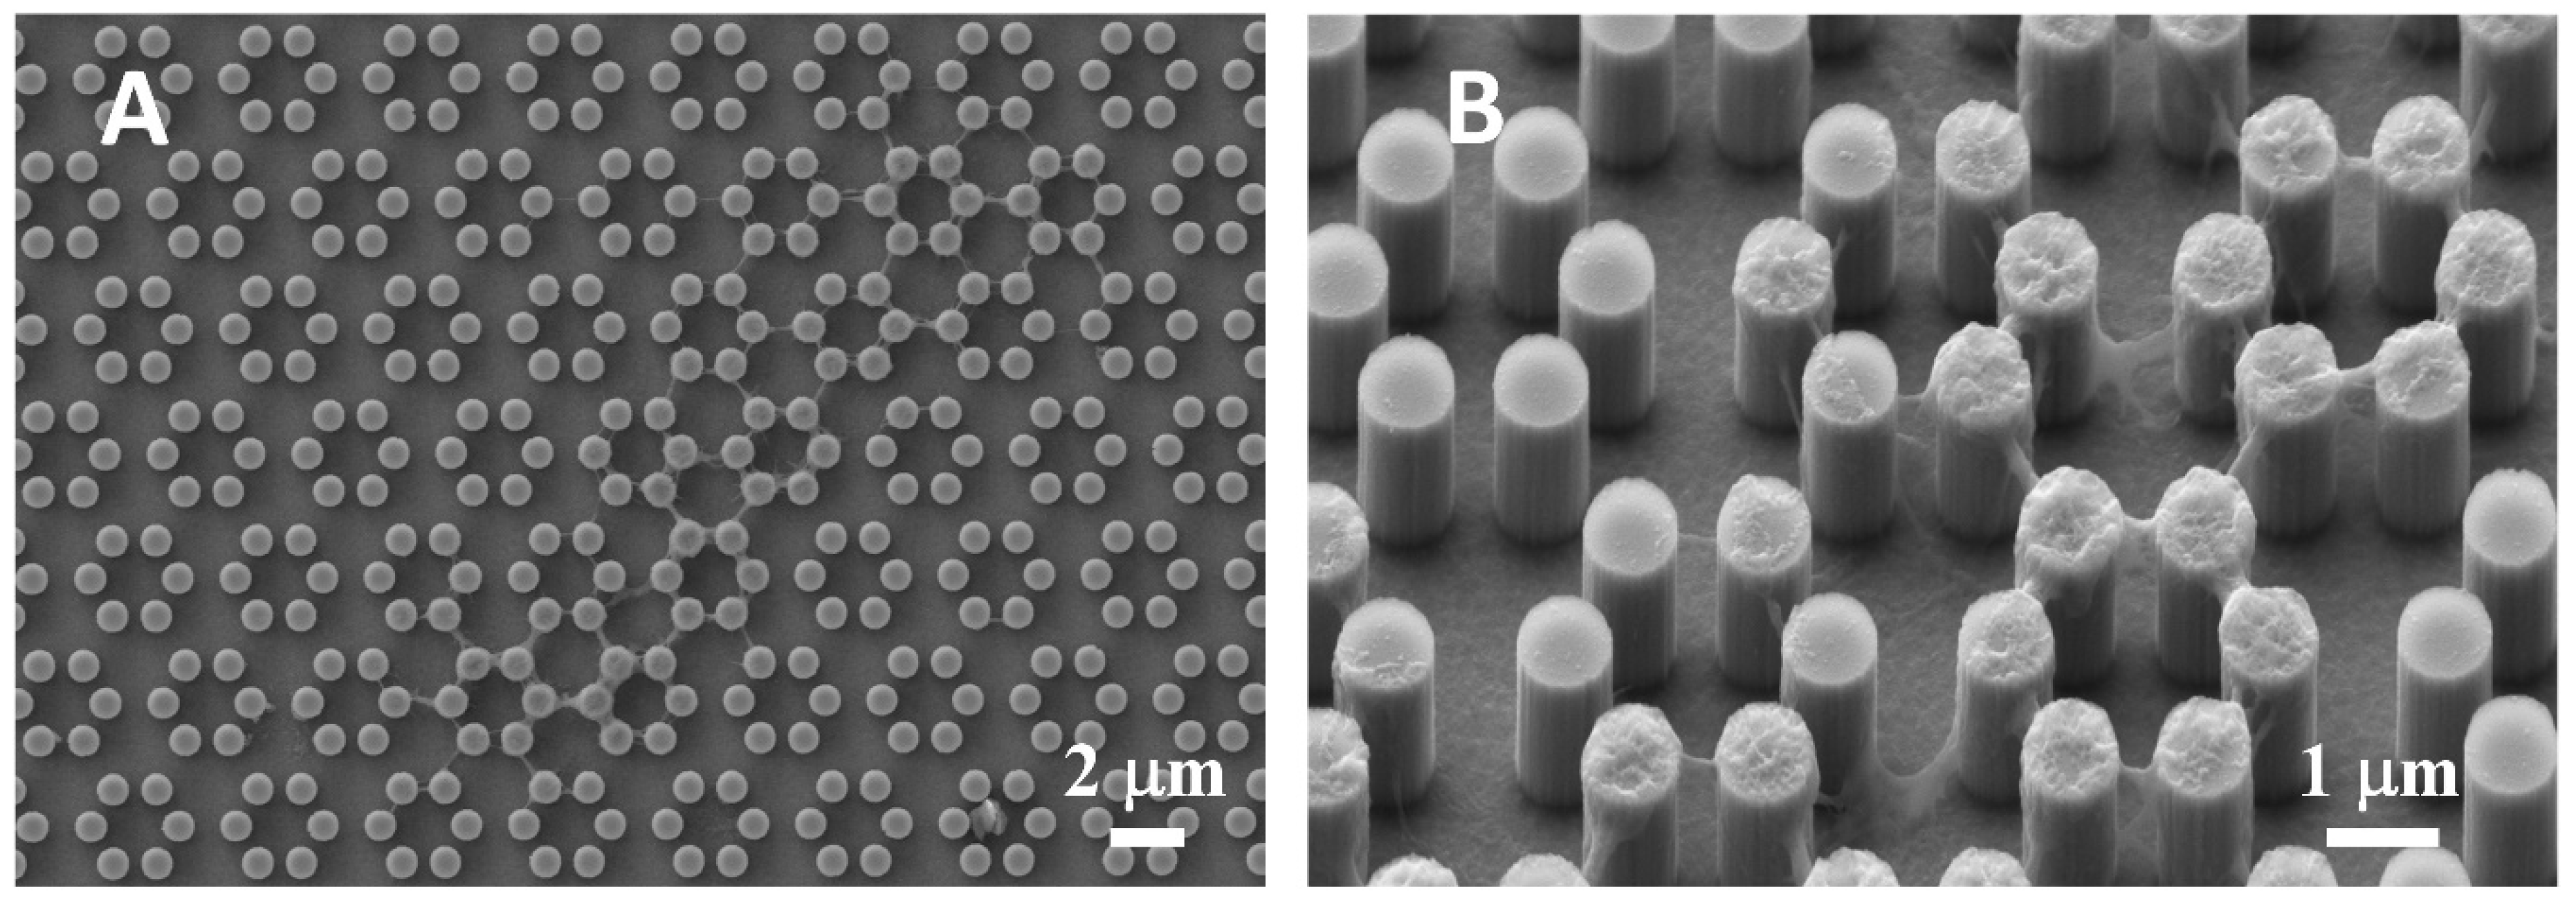
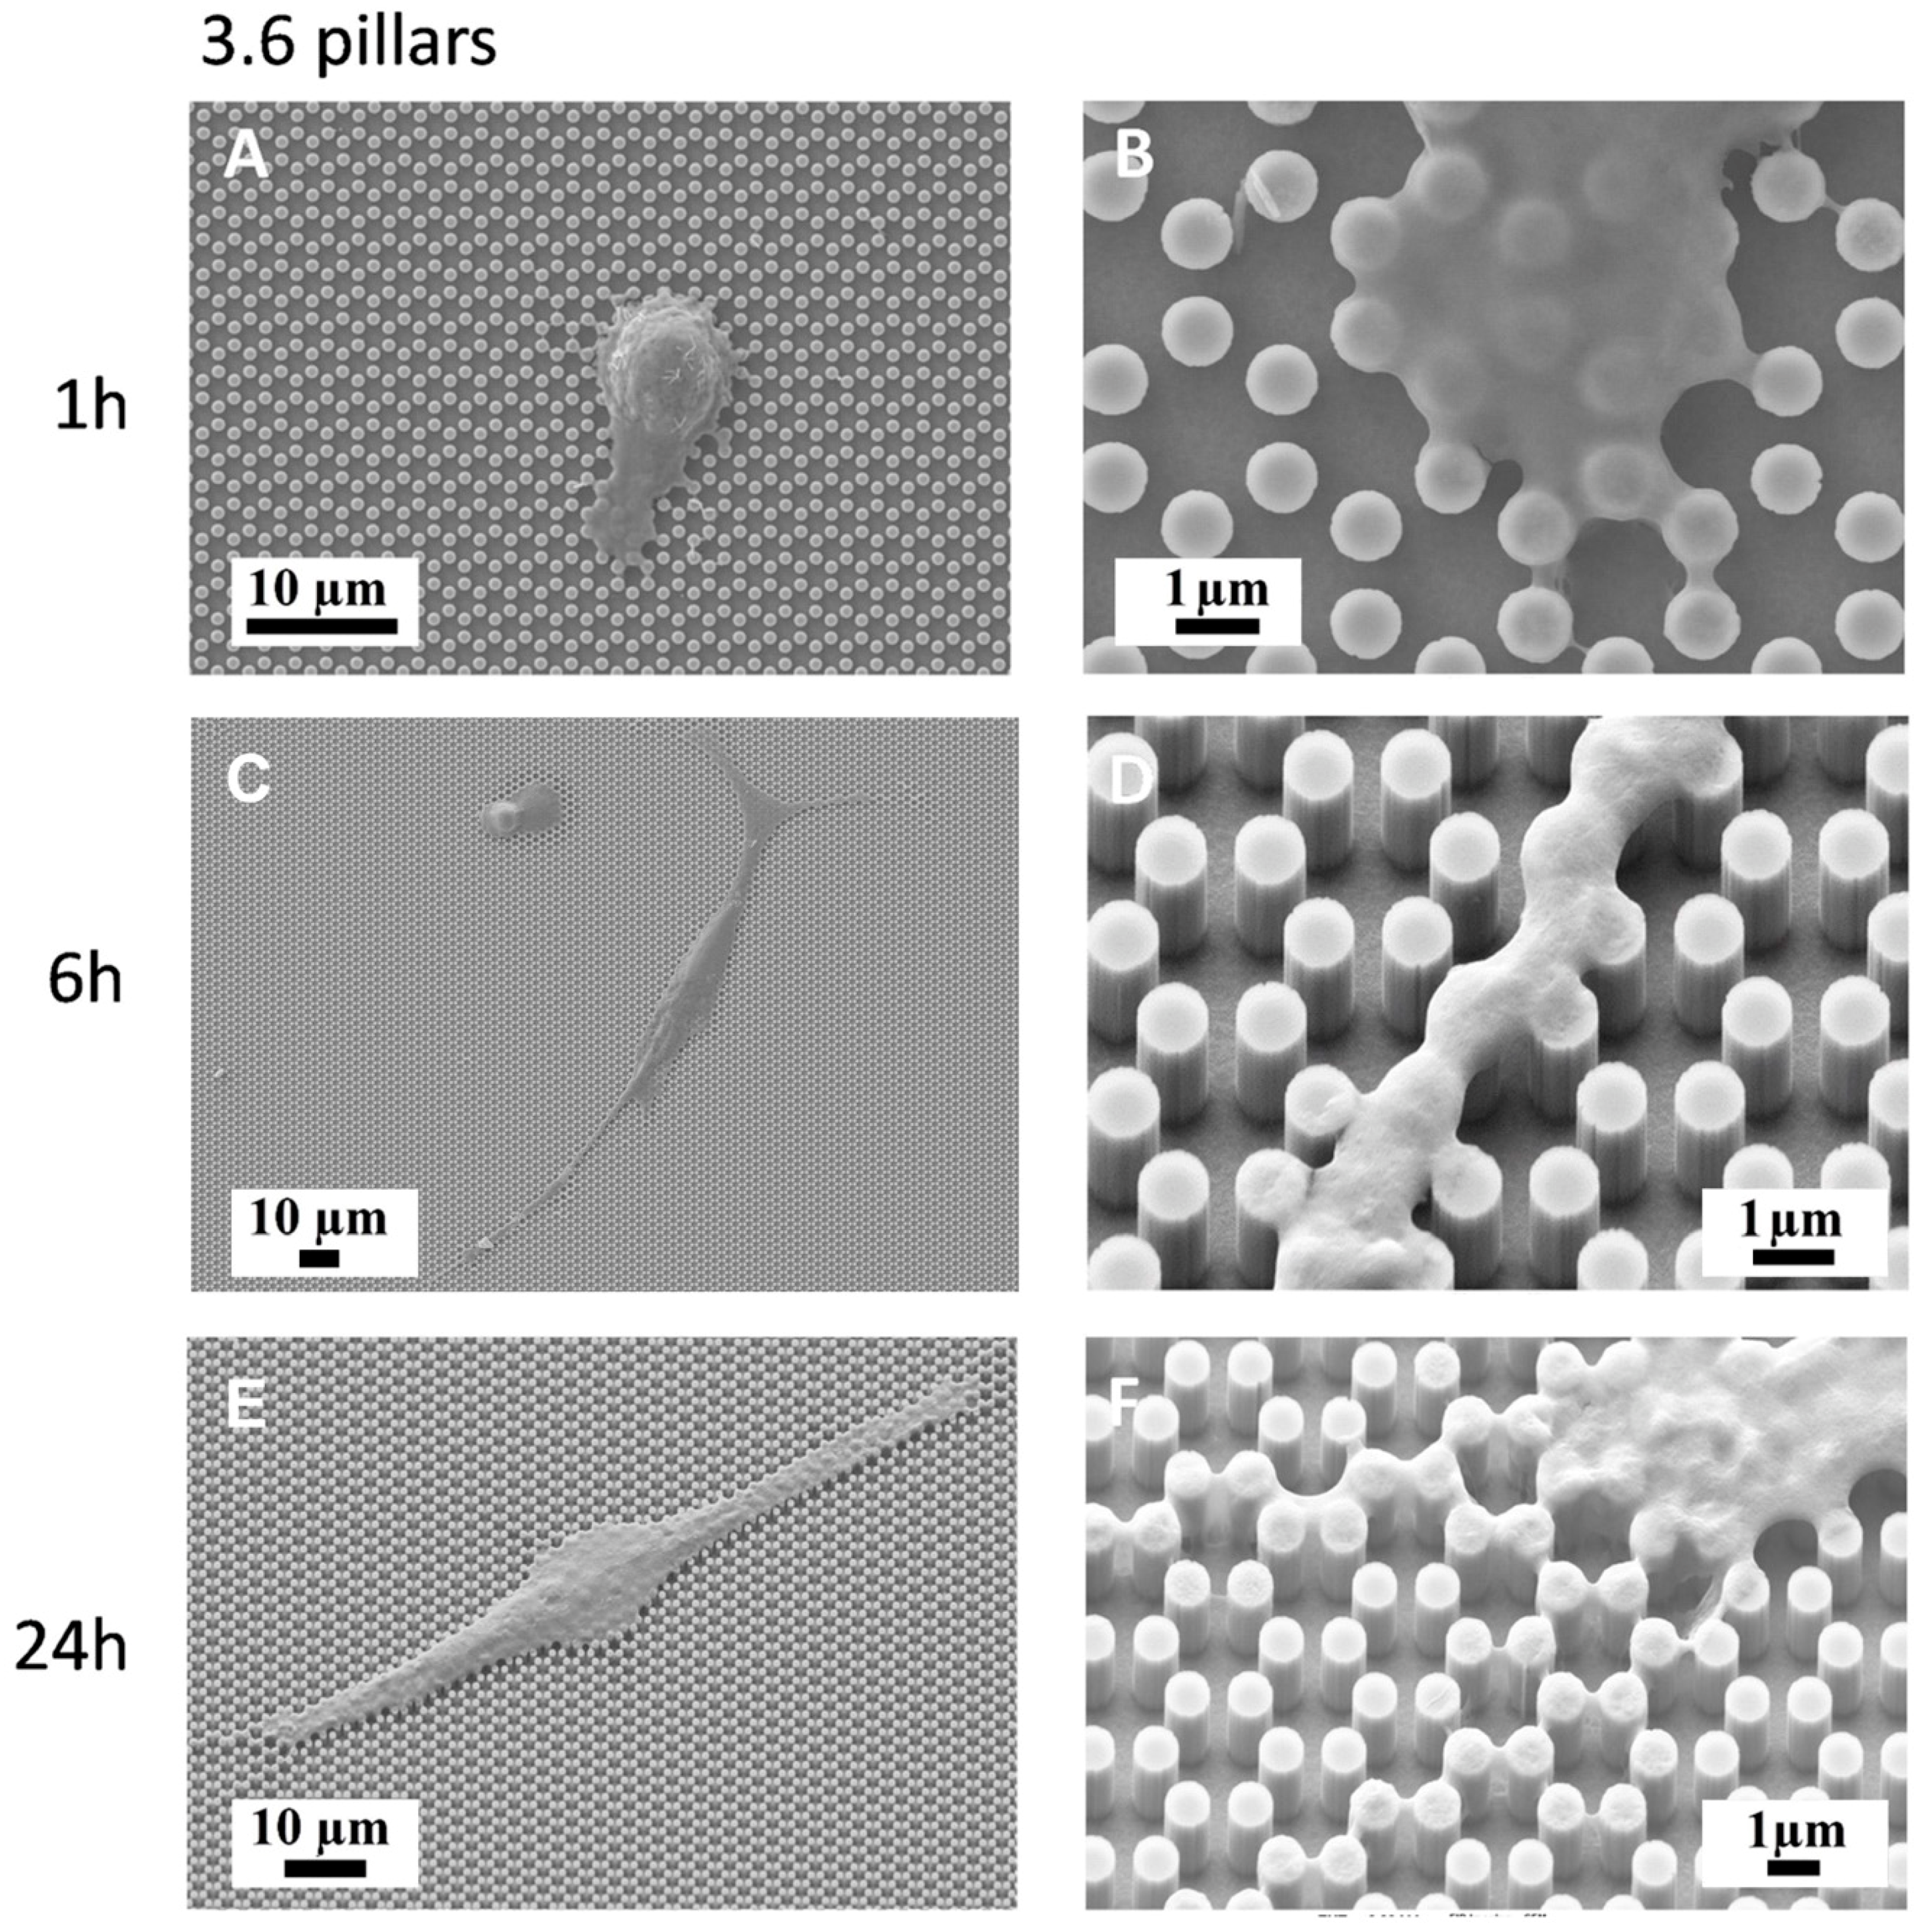
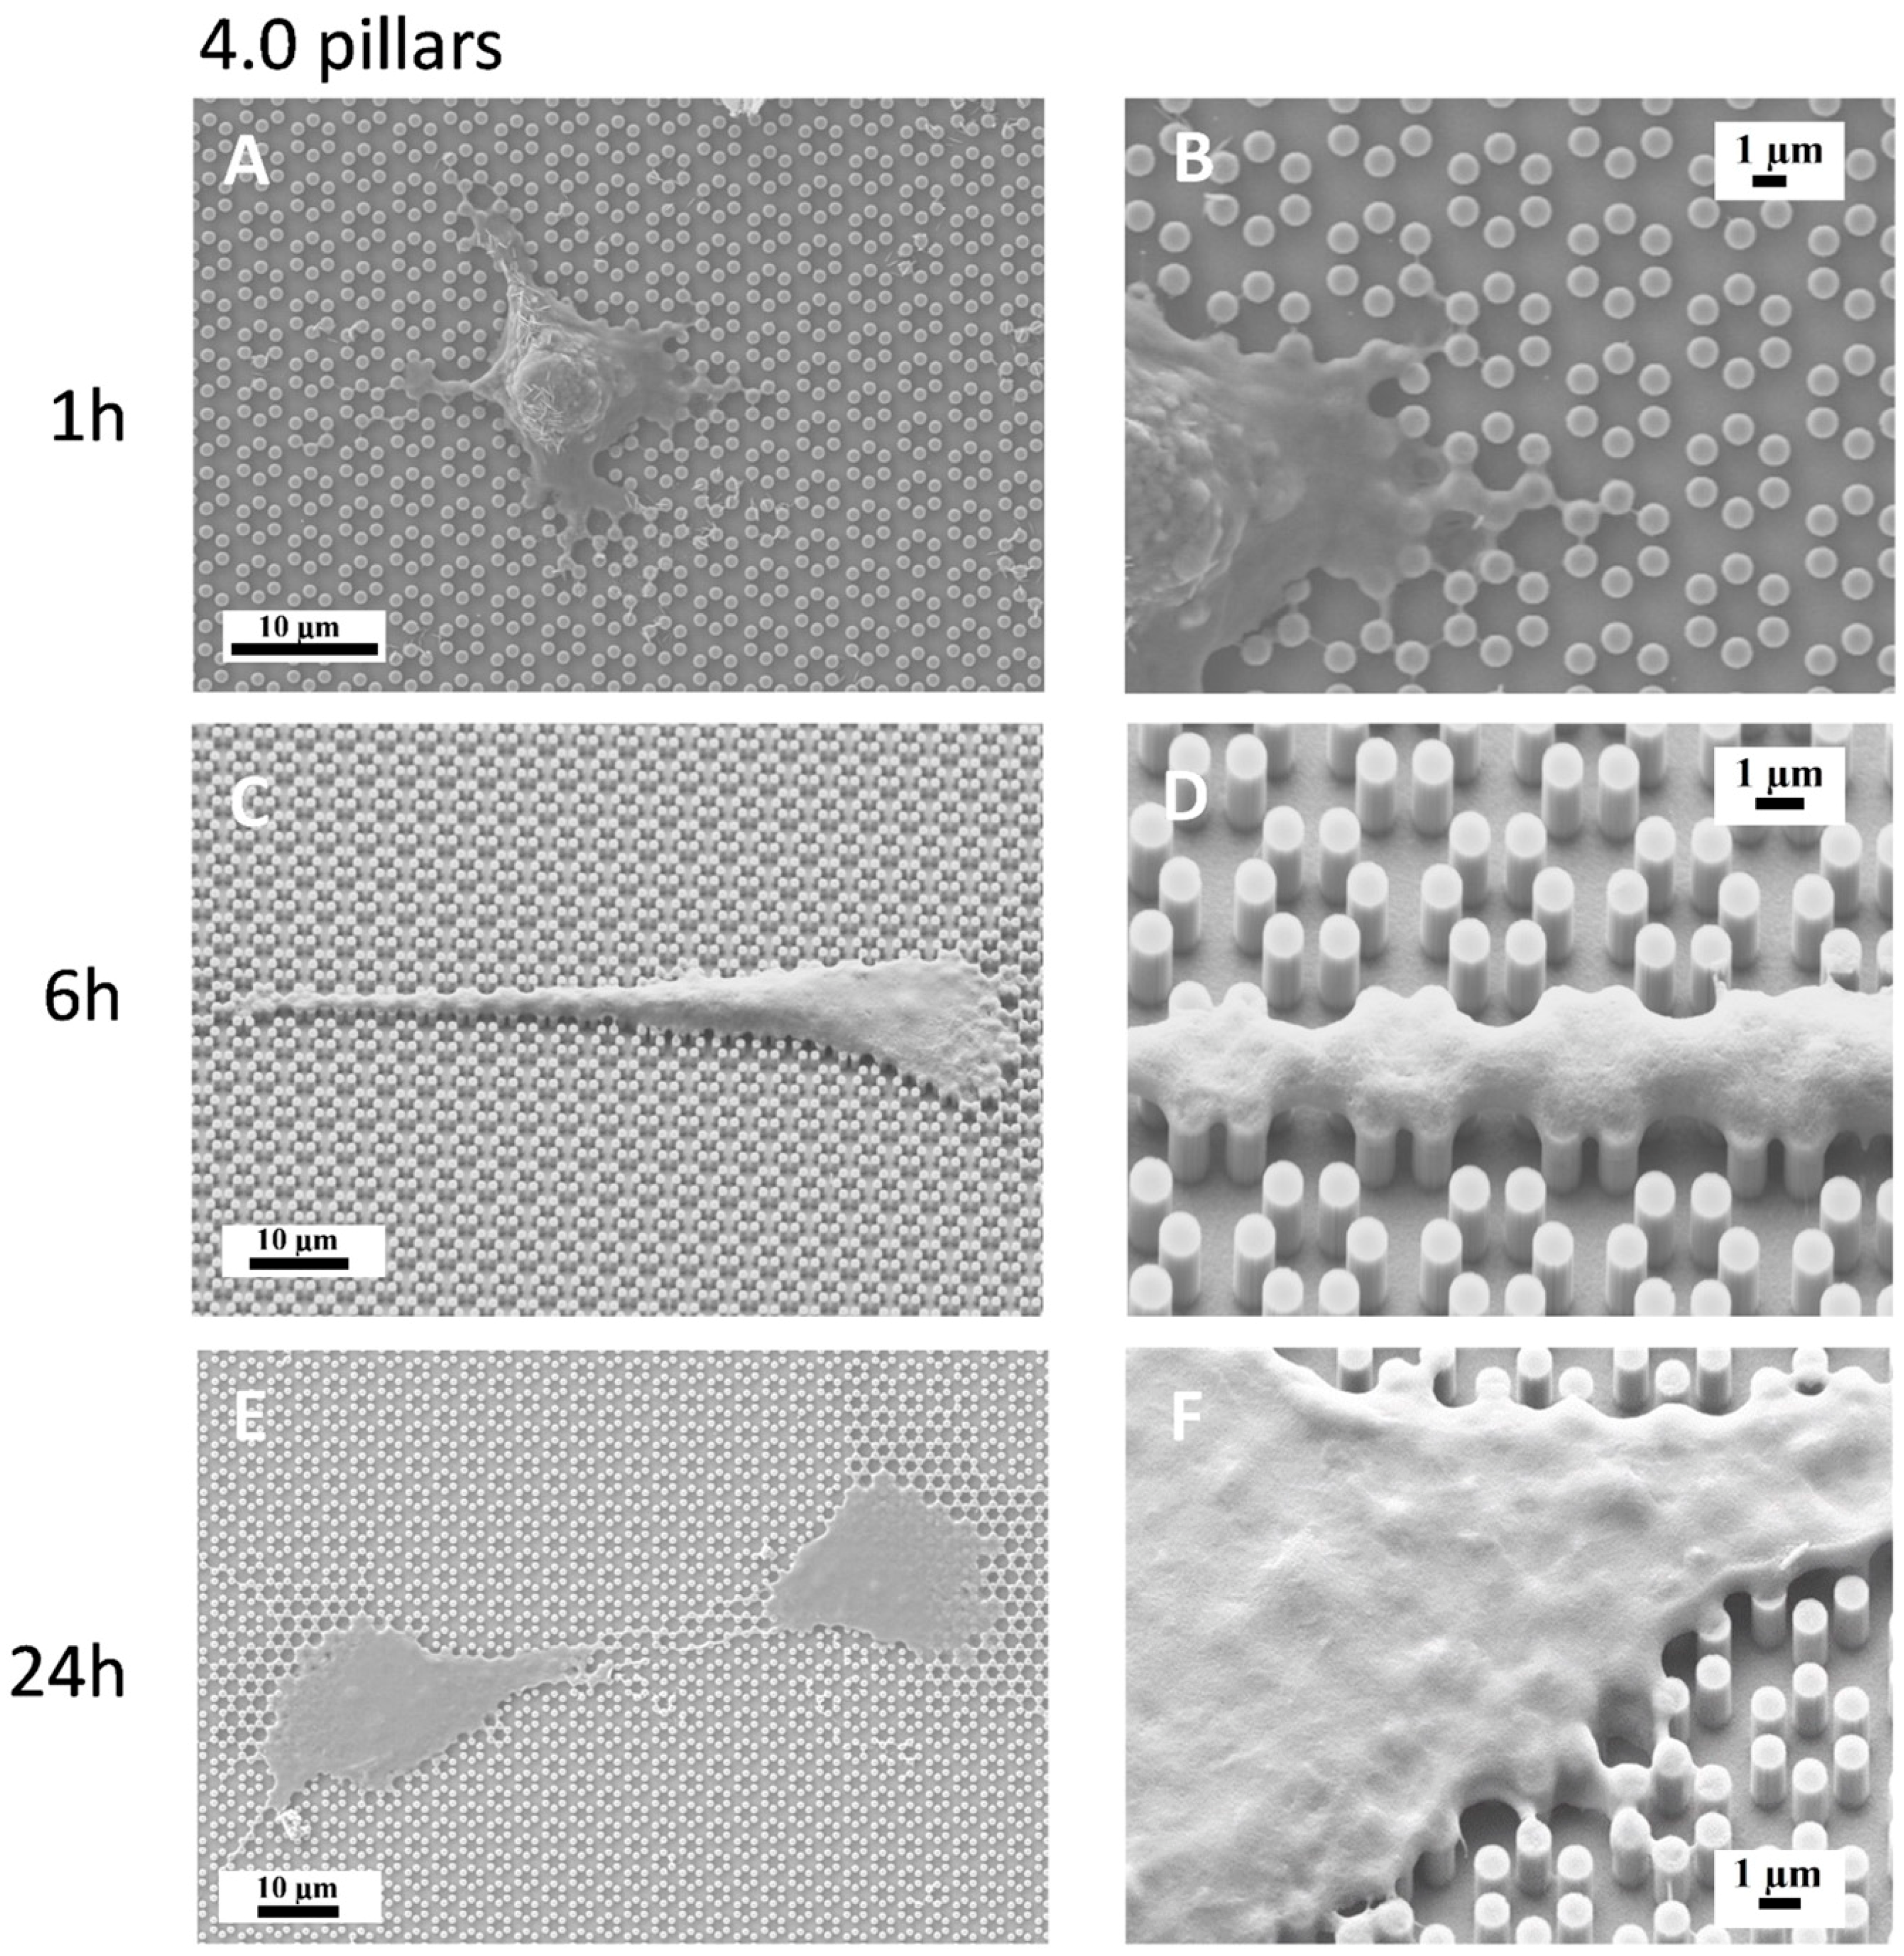
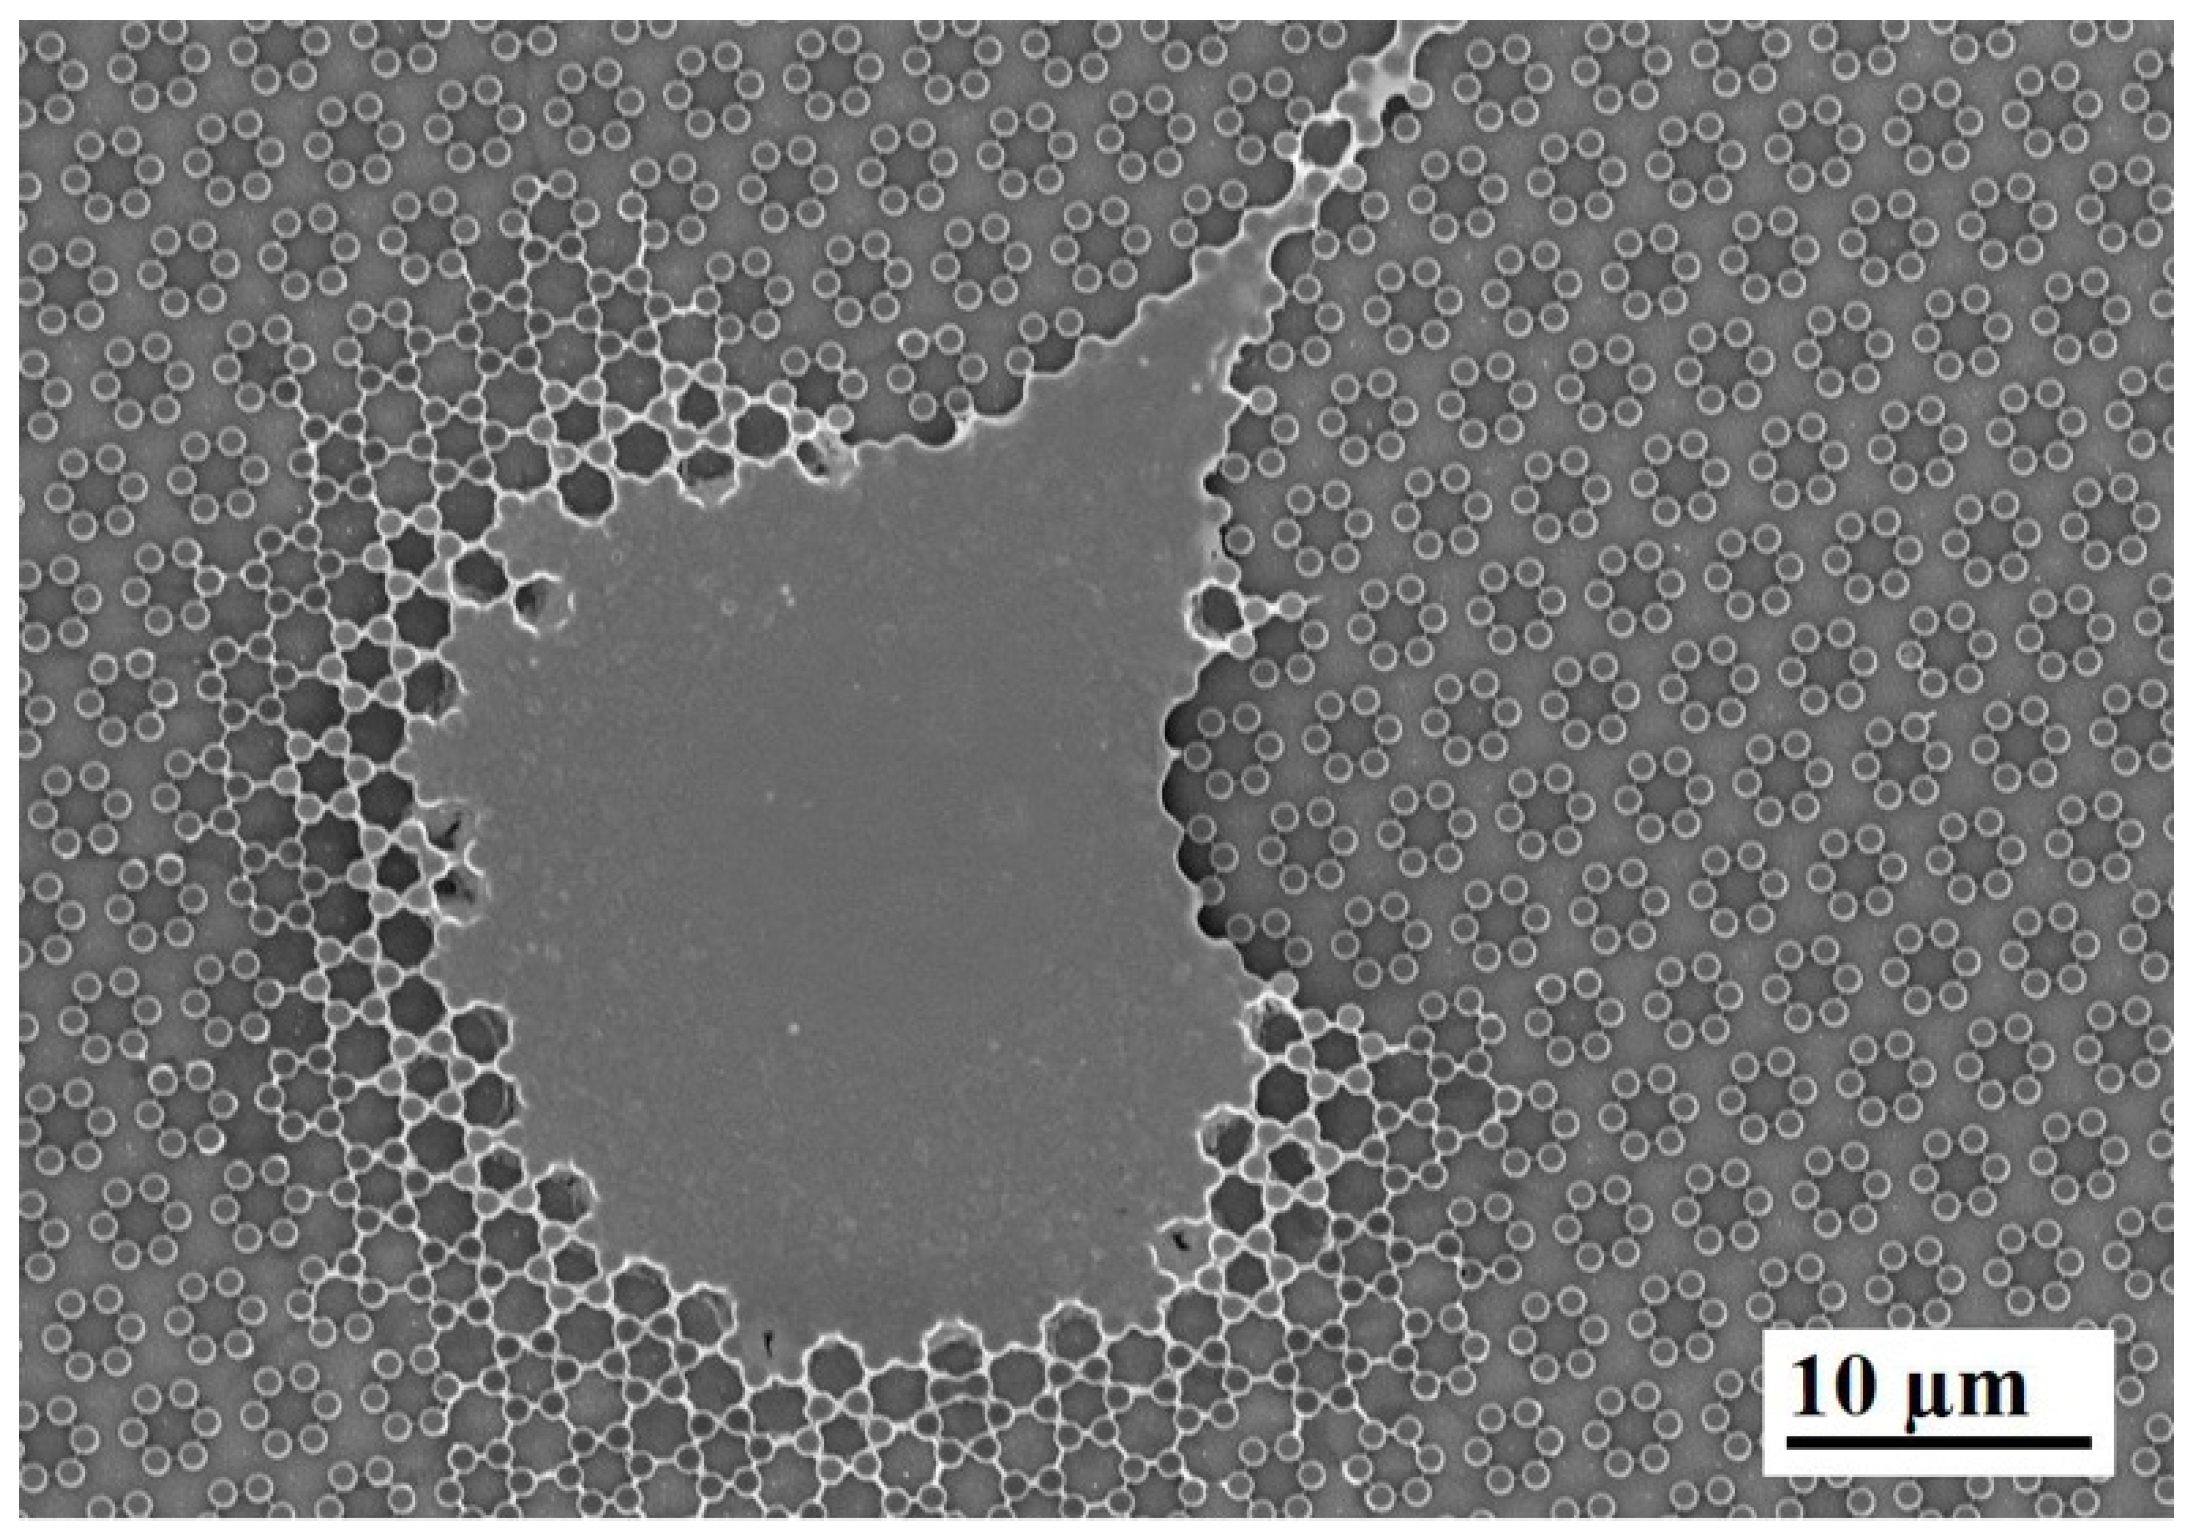
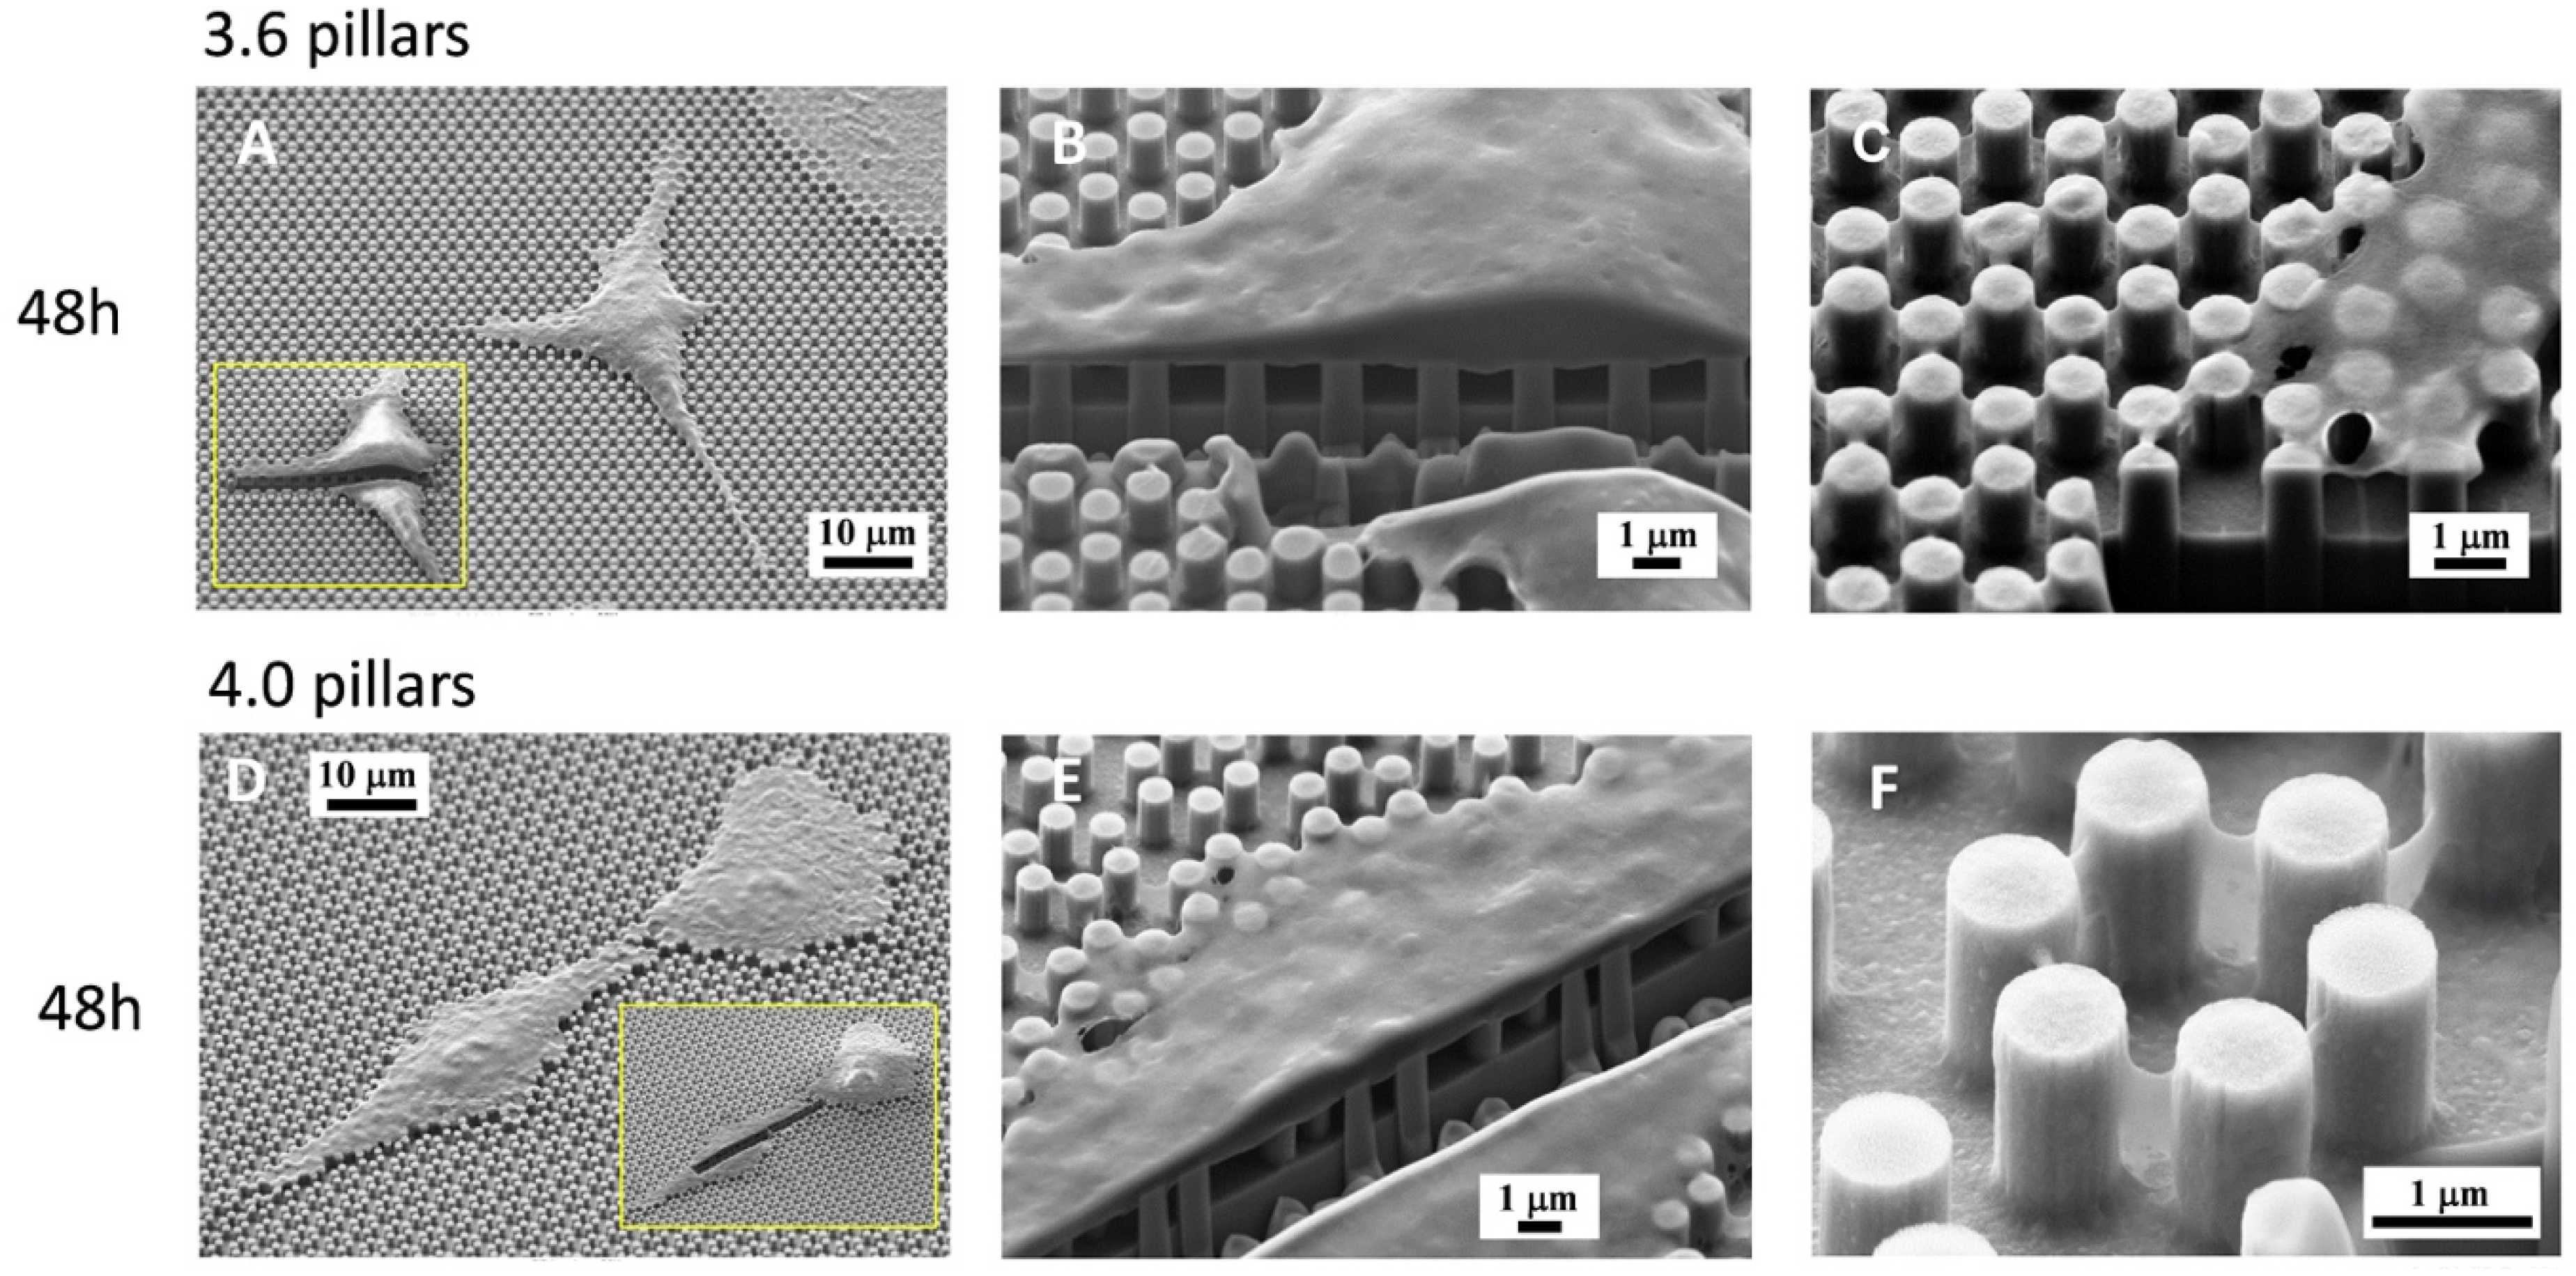
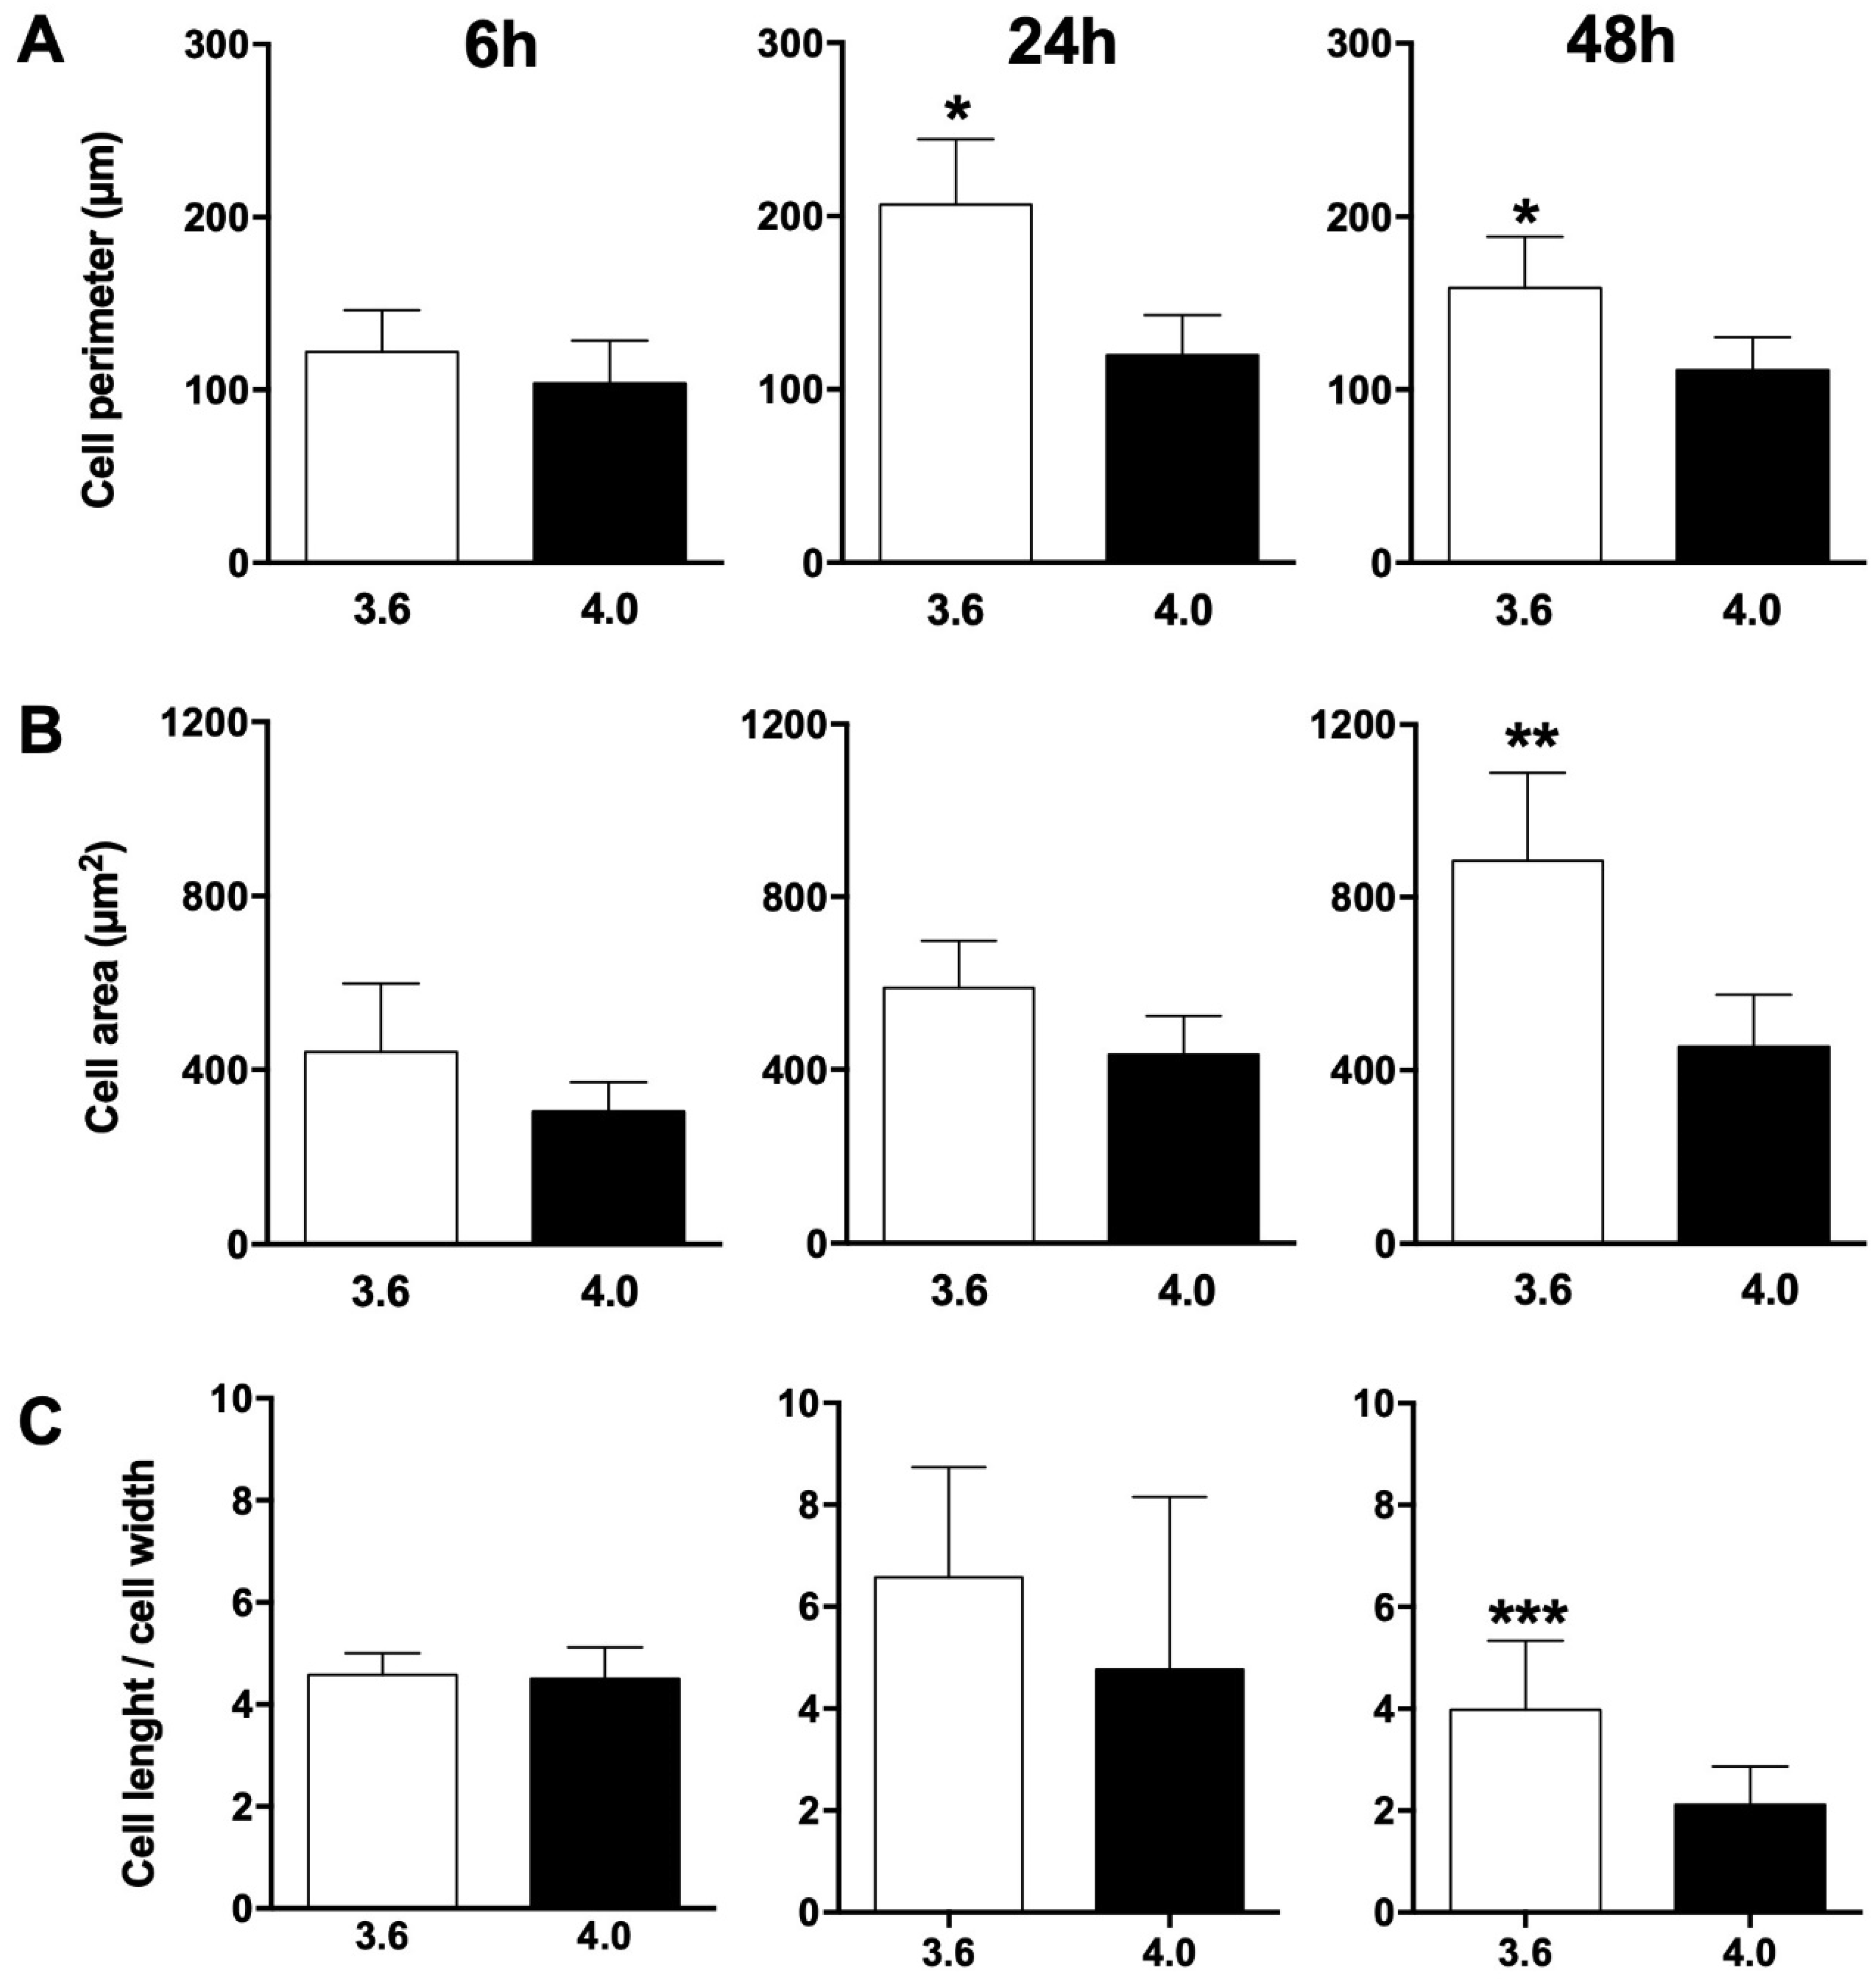
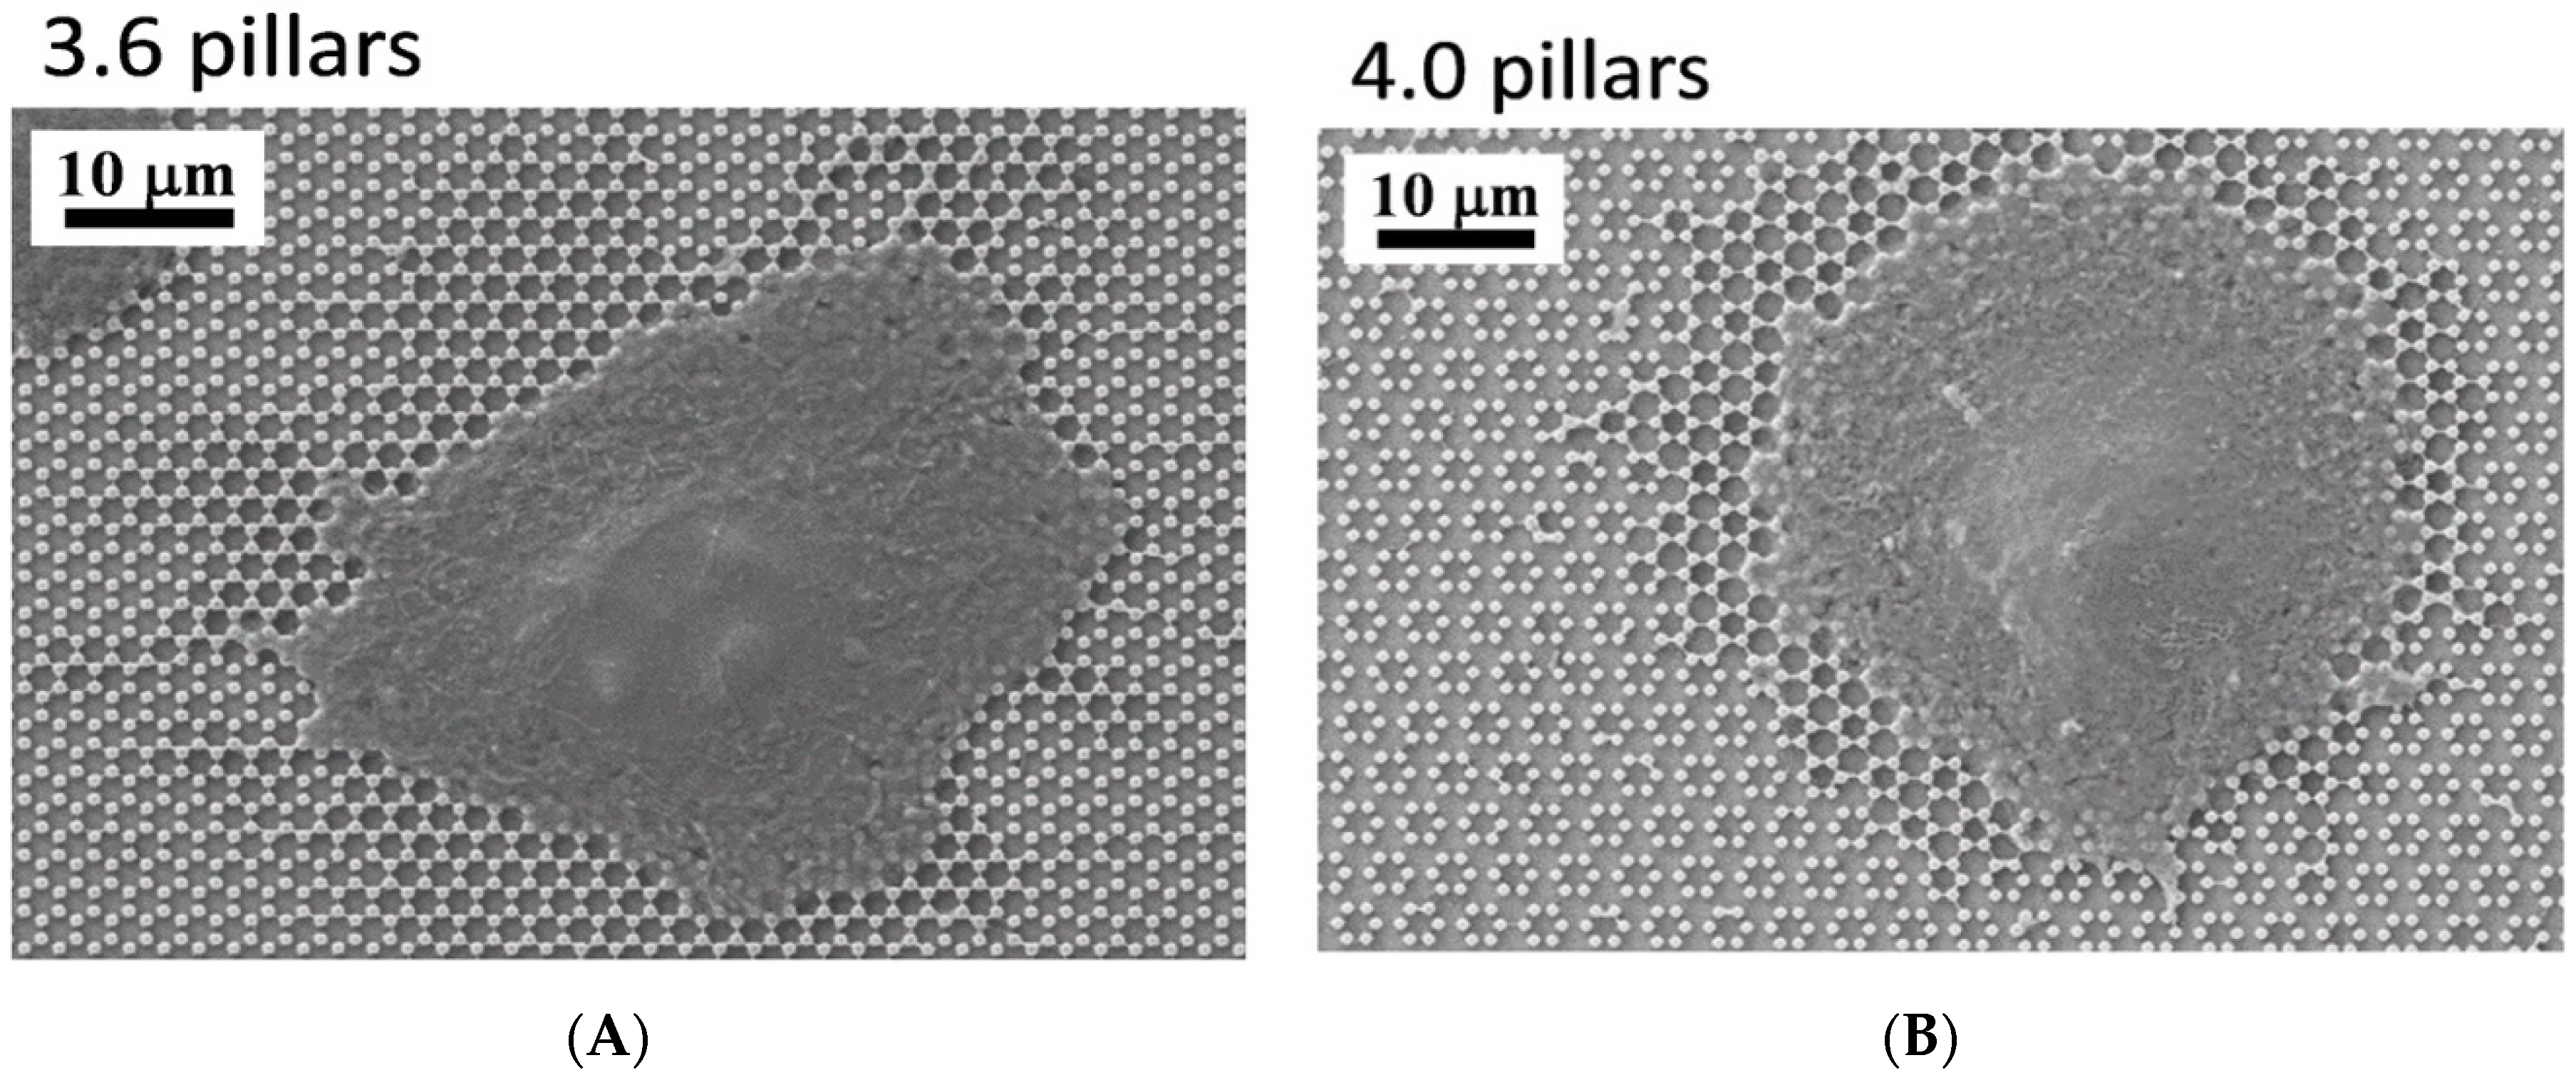
3.1. SEM Morphology
3.2. Cell Viability
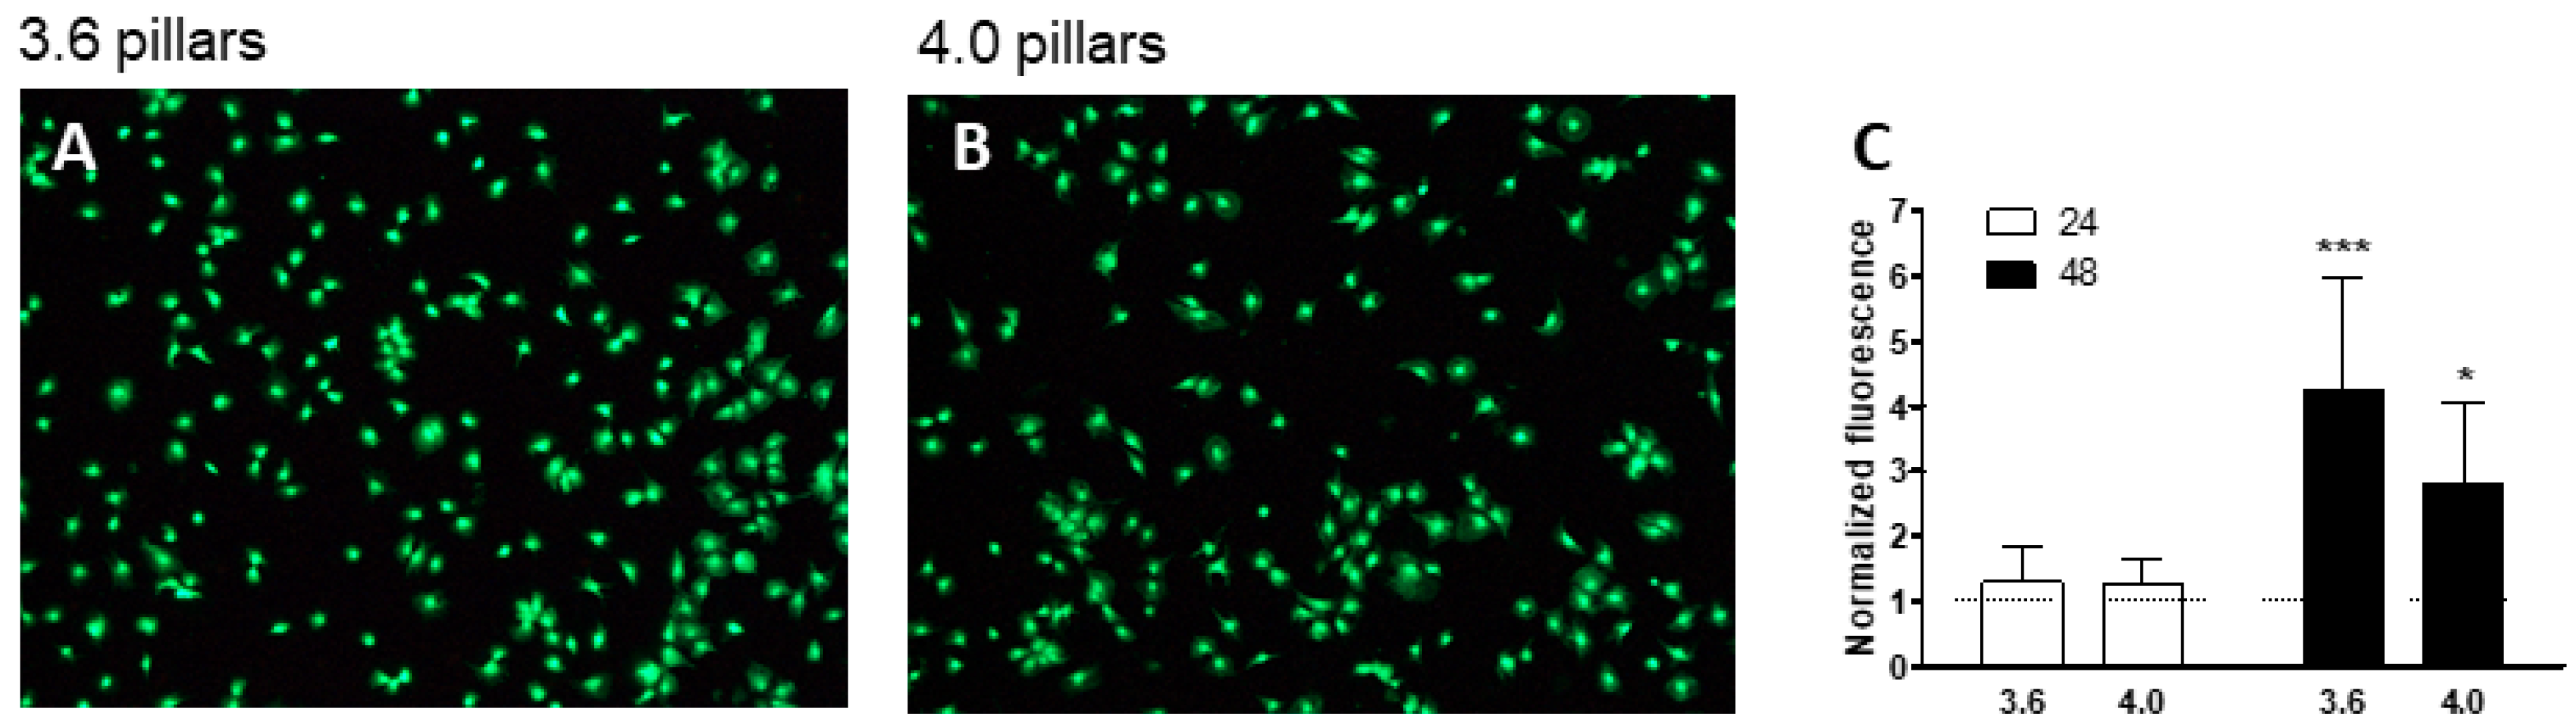
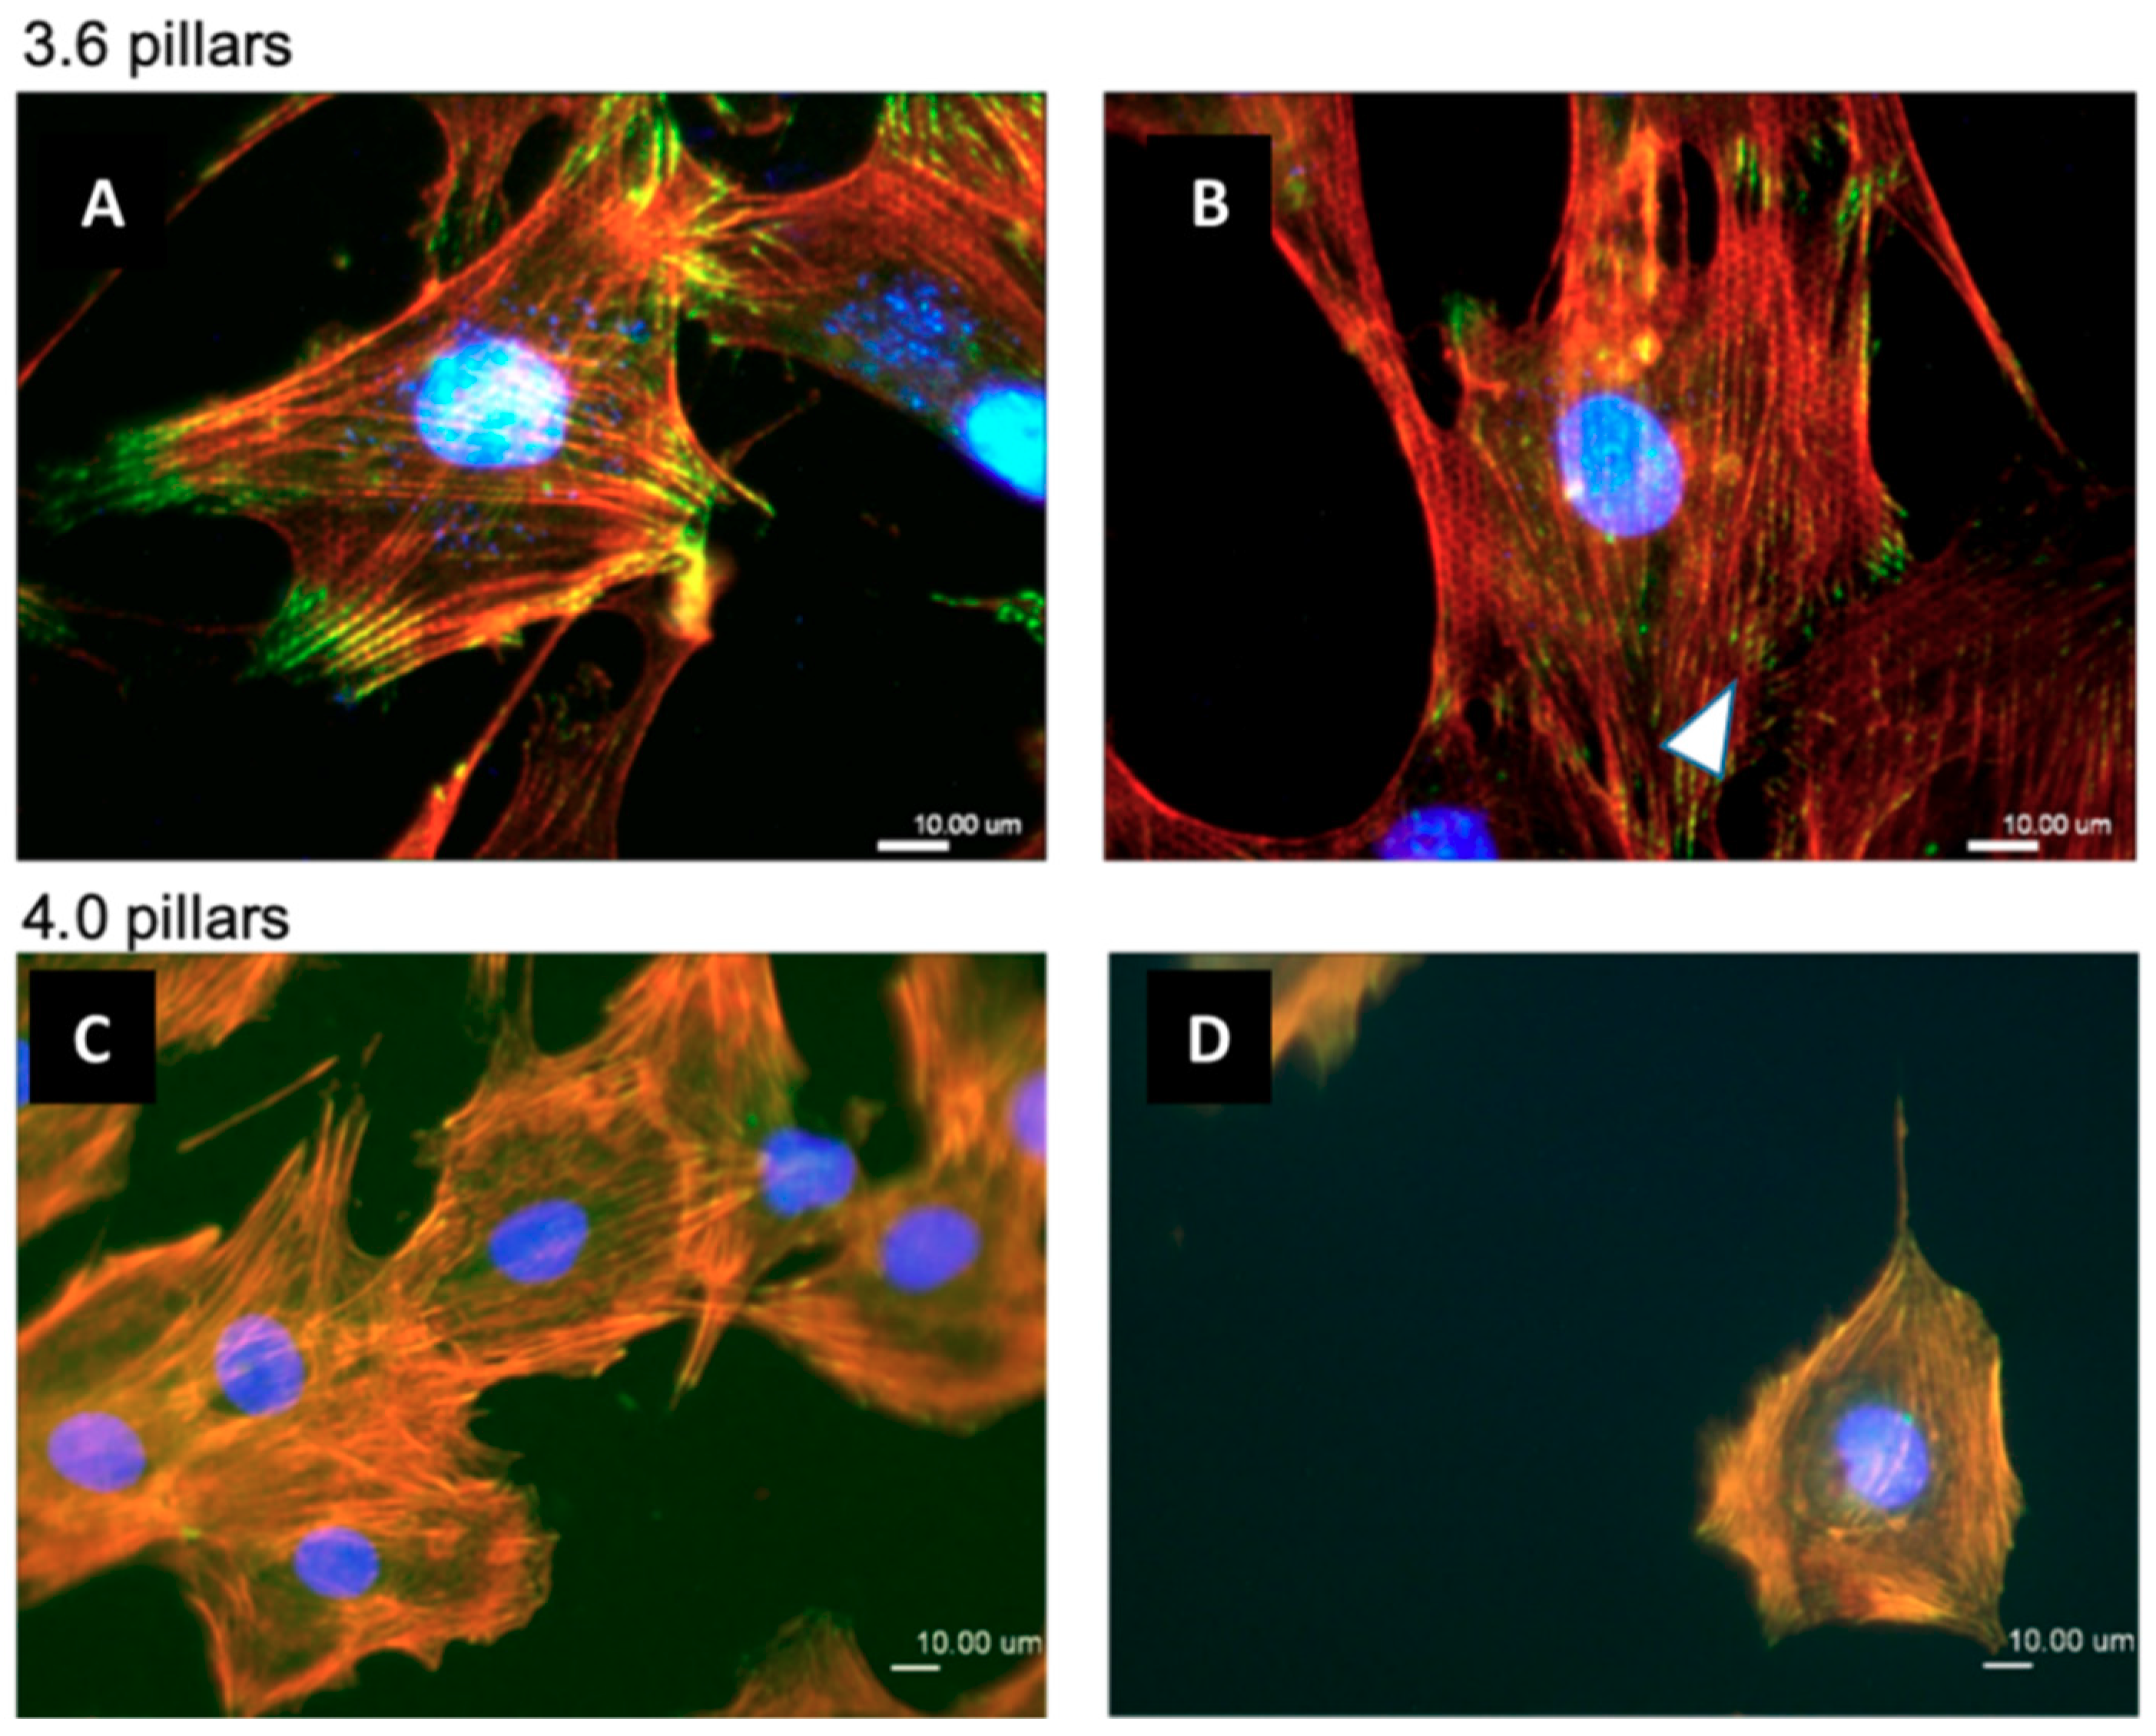
3.3. Immunofluorescence
3.4. Effect of Cytoskeletal Inhibitors on Cell Adhesion
4. Discussion
5. Conclusions
Supplementary Materials
Author Contributions
Funding
Conflicts of Interest
References
- Sundell, G.; Dahlin, C.; Andersson, M.; Thuvander, M. The bone-implant interface of dental implants in humans on the atomic scale. Acta Biomater. 2017, 48, 445–450. [Google Scholar] [CrossRef] [PubMed]
- Rupp, F.; Liang, L.; Geis-Gerstorfer, J.; Scheideler, L.; Hüttig, F. Surface characteristics of dental implants: A review. Dent. Mater. 2018, 34, 40–57. [Google Scholar] [CrossRef]
- Buser, D.; Sennerby, L.; De Bruyn, H. Modern implant dentistry based on osseointegration: 50 years of progress, current trends and open questions. Periodontol. 2000 2017, 73, 7–21. [Google Scholar] [CrossRef]
- Ting, M.; Jefferies, S.R.; Xia, W.; Engqvist, H.; Suzuki, J.B. Classification and Effects of Implant Surface Modification on the Bone: Human Cell–Based In Vitro Studies. J. Oral Implantol. 2017, 43, 58–83. [Google Scholar] [CrossRef]
- Smeets, R.; Stadlinger, B.; Schwarz, F.; Beck-Broichsitter, B.; Jung, O.; Precht, C.; Kloss, F.; Gröbe, A.; Heiland, M.; Ebker, T. Impact of Dental Implant Surface Modifications on Osseointegration. Biomed. Res. Int. 2016, 2016, 6285620. [Google Scholar] [CrossRef]
- Kilian, K.A.; Bugarija, B.; Lahn, B.T.; Mrksich, M. Geometric cues for directing the differentiation of mesenchymal stem cells. Proc. Natl. Acad. Sci. USA 2010, 107, 4872–4877. [Google Scholar] [CrossRef]
- Yin, C.; Zhang, Y.; Cai, Q.; Li, B.; Yang, H.; Wang, H.; Qi, H.; Zhou, Y.; Meng, W. Effects of the micro-nano surface topography of titanium alloy on the biological responses of osteoblast. J. Biomed. Mater. Res. Part A 2017, 105, 757–769. [Google Scholar] [CrossRef]
- Gittens, R.A.; Scheideler, L.; Rupp, F.; Hyzy, S.L.; Geis-Gerstorfer, J.; Schwartz, Z.; Boyan, B.D. A review on the wettability of dental implant surfaces II: Biological and clinical aspects. Acta Biomater. 2014, 10, 2907–2918. [Google Scholar] [CrossRef]
- Parisi, L.; Toffoli, A.; Cutrera, M.; Bianchi, M.G.; Lumetti, S.; Bussolati, O.; Macaluso, G.M. Plasma Proteins at the Interface of Dental Implants Modulate Osteoblasts Focal Adhesions Expression and Cytoskeleton Organization. Nanomaterials 2019, 9, 1407. [Google Scholar] [CrossRef]
- Ghezzi, B.; Lagonegro, P.; Pece, R.; Parisi, L.; Bianchi, M.; Tatti, R.; Verucchi, R.; Attolini, G.; Quaretti, M.; Macaluso, G.M. Osteoblast adhesion and response mediated by terminal-SH group charge surface of SiOxCy nanowires. J. Mater. Sci. Mater. Med. 2019, 30, 43. [Google Scholar] [CrossRef]
- Toffoli, A.; Parisi, L.; Bianchi, M.; Lumetti, S.; Bussolati, O.; Macaluso, G.M. Thermal treatment to increase titanium wettability induces selective proteins adsorption from blood plasma thus affecting osteoblasts adhesion. Mater. Sci. Eng. Part C 2019, 107, 110250. [Google Scholar] [CrossRef] [PubMed]
- Engler, A.J.; Sen, S.; Sweeney, H.L.; Discher, D.E. Matrix Elasticity Directs Stem Cell Lineage Specification. Cell 2006, 126, 677–689. [Google Scholar] [CrossRef] [PubMed]
- Khalili, A.; Ahmad, M. A Review of Cell Adhesion Studies for Biomedical and Biological Applications. Int. J. Mol. Sci. 2015, 16, 18149–18184. [Google Scholar] [CrossRef]
- Albert, P.J.; Schwarz, U.S. Modeling cell shape and dynamics on micropatterns. Cell Adhension Migr. 2016, 10, 516–528. [Google Scholar] [CrossRef] [PubMed]
- Nardone, G.; Oliver-De La Cruz, J.; Vrbsky, J.; Martini, C.; Pribyl, J.; Skládal, P.; Pešl, M.; Caluori, G.; Pagliari, S.; Martino, F.; et al. YAP regulates cell mechanics by controlling focal adhesion assembly. Nat. Commun. 2017, 8, 15321. [Google Scholar] [CrossRef]
- Tomakidi, P.; Schulz, S.; Proksch, S.; Weber, W.; Steinberg, T. Focal adhesion kinase (FAK) perspectives in mechanobiology: Implications for cell behaviour. Cell Tissue Res. 2014, 357, 515–526. [Google Scholar] [CrossRef]
- Luo, Y.; Xu, X.; Lele, T.; Kumar, S.; Ingber, D.E. A multi-modular tensegrity model of an actin stress fiber. J. Biomech. 2008, 41, 2379–2387. [Google Scholar] [CrossRef]
- Dupont, S.; Morsut, L.; Aragona, M.; Enzo, E.; Giulitti, S.; Cordenonsi, M.; Zanconato, F.; Le Digabel, J.; Forcato, M.; Bicciato, S.; et al. Role of YAP/TAZ in mechanotransduction. Nature 2011, 474, 179–183. [Google Scholar] [CrossRef]
- Anselme, K.; Wakhloo, N.T.; Rougerie, P.; Pieuchot, L. Role of the Nucleus as a Sensor of Cell Environment Topography. Adv. Healthc. Mater. 2018, 7, 1701154. [Google Scholar] [CrossRef]
- Lagonegro, P.; Trevisi, G.; Nasi, L.; Parisi, L.; Manfredi, E.; Lumetti, S.; Rossi, F.; Macaluso, G.M.; Salviati, G.; Galli, C. Osteoblasts preferentially adhere to peaks on micro-structured titanium. Dent. Mater. J. 2018, 37, 278–285. [Google Scholar] [CrossRef]
- Czekanska, E.M.; Stoddart, M.J.; Richards, R.G.; Hayes, J.S. In search of an osteoblast cell model for in vitro research. Eur. Cell. Mater. 2012, 24, 1–17. [Google Scholar] [CrossRef] [PubMed]
- Zhang, X.; Jevasuwan, W.; Sugimoto, Y.; Fukata, N. Controlling Catalyst-Free Formation and Hole Gas Accumulation by Fabricating Si/Ge Core-Shell and Si/Ge/Si Core-Double Shell Nanowires. ACS Nano 2019. [Google Scholar] [CrossRef] [PubMed]
- Jevasuwan, W.; Pradel, K.C.; Subramani, T.; Chen, J.; Takei, T.; Nakajima, K.; Sugimoto, Y.; Fukata, N. Diffused back surface field formation in combination with two-step H2 annealing for improvement of silicon nanowire-based solar cell efficiency. Jpn. J. Appl. Phys. 2017, 56, 04CP01. [Google Scholar] [CrossRef]
- Bays, J.L.; DeMali, K.A. Vinculin in cell–cell and cell–matrix adhesions. Cell. Mol. Life Sci. 2017, 74, 2999–3009. [Google Scholar] [CrossRef] [PubMed]
- Matschegewski, C.; Staehlke, S.; Loeffler, R.; Lange, R.; Chai, F.; Kern, D.P.; Beck, U.; Nebe, B.J. Cell architecture-cell function dependencies on titanium arrays with regular geometry. Biomaterials 2010, 31, 5729–5740. [Google Scholar] [CrossRef]
- Galli, C.; MacAluso, G.M.; Piemontese, M.; Passeri, G. Titanium topography controls FoxO/β-catenin signaling. J. Dent. Res. 2011, 90, 360–364. [Google Scholar] [CrossRef]
- Boyan, B.D.; Cheng, A.; Olivares-Navarrete, R.; Schwartz, Z. Implant Surface Design Regulates Mesenchymal Stem Cell Differentiation and Maturation. Adv. Dent. Res. 2016, 28, 10–17. [Google Scholar] [CrossRef]
- Gittens, R.A.; Olivares-Navarrete, R.; McLachlan, T.; Cai, Y.; Hyzy, S.L.; Schneider, J.M.; Schwartz, Z.; Sandhage, K.H.; Boyan, B.D. Differential responses of osteoblast lineage cells to nanotopographically-modified, microroughened titanium–aluminum–vanadium alloy surfaces. Biomaterials 2012, 33, 8986–8994. [Google Scholar] [CrossRef]
- Seo, C.H.; Furukawa, K.; Montagne, K.; Jeong, H.; Ushida, T. The effect of substrate microtopography on focal adhesion maturation and actin organization via the RhoA/ROCK pathway. Biomaterials 2011, 32, 9568–9575. [Google Scholar] [CrossRef]
- Calzado-Martín, A.; Méndez-Vilas, A.; Multigner, M.; Saldaña, L.; González-Carrasco, J.L.; González-Martín, M.L.; Vilaboa, N. On the role of RhoA/ROCK signaling in contact guidance of bone-forming cells on anisotropic Ti6Al4V surfaces. Acta Biomater. 2011, 7, 1890–1901. [Google Scholar] [CrossRef]
- Moerke, C.; Mueller, P.; Nebe, J.B. Sensing of micropillars by osteoblasts involves complex intracellular signaling. J. Mater. Sci. Mater. Med. 2017, 28, 171. [Google Scholar] [CrossRef] [PubMed]
- Geiger, B.; Spatz, J.P.; Bershadsky, A.D. Environmental sensing through focal adhesions. Nat. Rev. Mol. Cell Biol. 2009, 10, 21–33. [Google Scholar] [CrossRef] [PubMed]
- Moerke, C.; Mueller, P.; Nebe, B. Attempted caveolae-mediated phagocytosis of surface-fixed micro-pillars by human osteoblasts. Biomaterials 2016, 76, 102–114. [Google Scholar] [CrossRef] [PubMed]
- Hasturk, O.; Ermis, M.; Demirci, U.; Hasirci, N.; Hasirci, V. Square prism micropillars on poly(methyl methacrylate) surfaces modulate the morphology and differentiation of human dental pulp mesenchymal stem cells. Colloids Surf. B Biointerfaces 2019, 178, 44–55. [Google Scholar] [CrossRef]
- Hasturk, O.; Ermis, M.; Demirci, U.; Hasirci, N.; Hasirci, V. Square prism micropillars improve osteogenicity of poly(methyl methacrylate) surfaces. J. Mater. Sci. Mater. Med. 2018, 29, 53. [Google Scholar] [CrossRef] [PubMed]
- Ulmer, J.; Geiger, B.; Spatz, J.P. Force-induced fibronectin fibrillogenesis in vitro. Soft Matter 2008, 4, 1998. [Google Scholar] [CrossRef]
- Schmoranzer, J.; Kreitzer, G.; Simon, S.M.; Migala, A.; Almers, W.; Gerdes, H.H. Migrating fibroblasts perform polarized, microtubule-dependent exocytosis towards the leading edge. J. Cell Sci. 2003, 116, 4513–4519. [Google Scholar] [CrossRef]
- Truong, D.; Bahls, C.R.; Nebe, B.; van Rienen, U. Simulation of actin distribution of osteoblasts on titanium pillar arrays using a bio-chemo-mechanical model. Int. J. Numer. Methods Biomed. Eng. 2018, 34, e3097. [Google Scholar] [CrossRef]
- Ghibaudo, M.; Di Meglio, J.-M.; Hersen, P.; Ladoux, B. Mechanics of cell spreading within 3D-micropatterned environments. Lab Chip 2011, 11, 805–812. [Google Scholar] [CrossRef]
- Ganguly, A.; Yang, H.; Sharma, R.; Patel, K.D.; Cabral, F. The role of microtubules and their dynamics in cell migration. J. Biol. Chem. 2012, 287, 43359–43369. [Google Scholar] [CrossRef]
- Rennison, M.E.; Handel, S.E.; Wilde, C.J.; Burgoyne, R.D. Investigation of the role of microtubules in protein secretion from lactating mouse mammary epithelial cells. J. Cell Sci. 1992, 102 Pt 2, 239–247. [Google Scholar]
- Mundy, D.I.; Machleidt, T.; Ying, Y.; Anderson, R.G.W.; Bloom, G.S. Dual control of caveolar membrane traffic by microtubules and the actin cytoskeleton. J. Cell Sci. 2002, 115, 4327–4339. [Google Scholar] [CrossRef] [PubMed]


© 2019 by the authors. Licensee MDPI, Basel, Switzerland. This article is an open access article distributed under the terms and conditions of the Creative Commons Attribution (CC BY) license (http://creativecommons.org/licenses/by/4.0/).
Share and Cite
Ghezzi, B.; Lagonegro, P.; Fukata, N.; Parisi, L.; Calestani, D.; Galli, C.; Salviati, G.; Macaluso, G.M.; Rossi, F. Sub-Micropillar Spacing Modulates the Spatial Arrangement of Mouse MC3T3-E1 Osteoblastic Cells. Nanomaterials 2019, 9, 1701. https://doi.org/10.3390/nano9121701
Ghezzi B, Lagonegro P, Fukata N, Parisi L, Calestani D, Galli C, Salviati G, Macaluso GM, Rossi F. Sub-Micropillar Spacing Modulates the Spatial Arrangement of Mouse MC3T3-E1 Osteoblastic Cells. Nanomaterials. 2019; 9(12):1701. https://doi.org/10.3390/nano9121701
Chicago/Turabian StyleGhezzi, Benedetta, Paola Lagonegro, Naoki Fukata, Ludovica Parisi, Davide Calestani, Carlo Galli, Giancarlo Salviati, Guido M. Macaluso, and Francesca Rossi. 2019. "Sub-Micropillar Spacing Modulates the Spatial Arrangement of Mouse MC3T3-E1 Osteoblastic Cells" Nanomaterials 9, no. 12: 1701. https://doi.org/10.3390/nano9121701
APA StyleGhezzi, B., Lagonegro, P., Fukata, N., Parisi, L., Calestani, D., Galli, C., Salviati, G., Macaluso, G. M., & Rossi, F. (2019). Sub-Micropillar Spacing Modulates the Spatial Arrangement of Mouse MC3T3-E1 Osteoblastic Cells. Nanomaterials, 9(12), 1701. https://doi.org/10.3390/nano9121701