Article

An Nd3+-Sensitized Upconversion Fluorescent Sensor for Epirubicin Detection

1
Jiangsu Key Laboratory for Design & Manufacture of Micro/Nano Biomedical Instruments and School of Mechanical Engineering, Southeast University, Nanjing 210096, China
2
School of Public Health, Southeast University, Nanjing 210009, China
*
Authors to whom correspondence should be addressed.
Nanomaterials 2019, 9(12), 1700; https://doi.org/10.3390/nano9121700
Submission received: 1 November 2019 / Revised: 23 November 2019 / Accepted: 26 November 2019 / Published: 28 November 2019

Abstract

:
We describe here an Nd3+-sensitized upconversion fluorescent sensor for epirubicin (EPI) detection in aqueous solutions under 808 nm laser excitation. The upconversion fluorescence of nanoparticles is effectively quenched in the presence of EPI via a fluorescence resonance energy transfer mechanism. The dynamic quenching constant was 2.10 × 10⁴ M−1. Normalized fluorescence intensity increased linearly as the EPI concentration was raised from 0.09 μM to 189.66 μM and the fluorometric detection limit was 0.05 μM. The sensing method was simple, fast, and low-cost and was able to be applied to determine the levels of EPI in urine with spike recoveries from 97.5% to 102.6%. Another important feature of the proposed fluorescent sensor is that it holds a promising potential for in vivo imaging and detection due to its distinctive properties such as weak autofluorescence, low heating effect, and high light penetration depth.

1. Introduction

Epirubicin (EPI), an anthracycline antibiotic, is a highly effective antineoplastic agent, and is widely used for the treatment of various cancers including breast cancer, hepatocellular carcinoma, gastric cancer, lymphoma, and leukemia [1,2,3,4,5,6,7]. At an appropriate level, it can achieve the maximum therapeutic effect with minimal toxicity. However, the accumulation of EPI in the human body can be highly toxic and could have severe adverse effects, such as cardiotoxicity, myelosuppression, and hypoalbuminemia, potentially causing irreversible damage to organs [4,8,9,10]. To optimize cancer therapy, sensitive and selective detections of EPI are required to monitor the EPI concentration in biological samples.
Traditional techniques for the detection of EPI in biological fluids include liquid chromatography (LC), capillary electrophoresis (CE) and electrochemical methods [11]. Liquid chromatography generally requires pretreatment of biological samples using solid phase or liquid–liquid extractions and is coupled with additional detection approaches including ultraviolet (UV), fluorometry, or mass spectrometry (MS) [12,13,14,15,16,17,18,19,20,21]. LC-based methods, which benefit from an enriched target concentration after extractions, are very sensitive and accurate. Capillary electrophoresis is an alternative separation technique and is commonly coupled with laser-induced-fluorescence detection (LIF) [22,23,24]. However, these detection strategies are usually costly, time-consuming, or involve sophisticated instruments. Electrochemical sensors convert the interactions between the target analyte, EPI, and electrodes into an electrical signal and have fast response time and relatively high sensitivity [25,26,27,28,29]. Moreover, the sensitivity and selectivity can be further improved by modifying the electrode surface using carbon nanotubes, nanoparticles, and DNA [30,31,32,33,34]. Nonetheless, issues such as non-specific binding, the reproducibility of measurements, long term stability of sensors, and complex processes required to modify the electrode still need to be addressed [35].
In recent years, fluorescent sensors have attracted a great deal of attention because they are relatively simple, fast, low cost, and sensitive and have been widely used in various biological applications [36,37,38,39,40]. However, as far as we know, no fluorescent sensors have been reported for EPI detection. Available fluorescence probes, including quantum dots and organic dyes have been developed for detecting other anthracycline antibiotics including doxorubicin, daunorubicin, idarubicin, and mitoxantrone [41,42,43,44,45,46,47]. These down-conversion fluorescence probes generally require the use of ultraviolet or visible light as the excitation source, which causes many problems, such as a low signal to noise ratio, possible damage to cells and organs, and a low light penetration depth. In contrast, lanthanide doped upconversion nanoparticles (UCNPs), which transform the near infrared irradiation to a shorter wavelength fluorescence (e.g., visible light), circumvent these aforementioned problems and have inherently distinctive advantages, including weak autofluorescence, good biocompatibility, a narrow emission peak, and high photochemical stability [48,49,50,51]. To advance the in vivo applications of UCNPs, the excitation wavelength has been altered from 980 nm to ~800 nm by doping Nd3+ ions, which minimize the laser-induced heating effect due to significant reductions in the absorption coefficient of water [52,53,54,55].
In this work, we have designed and synthesized a ligand-free Nd3+-sensitized upconversion fluorescence sensor (NaYF4:Yb/Er/Nd@NaYF4:Nd) for measurements of EPI under 808 nm laser excitation. UCNPs acts as an energy donor while EPI works as an energy acceptor. Owing to the overlap between the emission band of UCNPs and the absorption band of EPI, the fluorescence intensity of UCNPs can be effectively quenched in the presence of EPI through a fluorescence resonance energy transfer (FRET) process (Figure 1). The proposed sensing method is operationally convenient, fast, and cost effective and its overall performance is comparable to conventional methods employing sophisticated equipment or requiring tedious sensor preparations. The application of the sensing system was demonstrated by detecting the EPI levels in urine.

2. Materials and Methods

2.1. Chemicals and Reagents

Yttrium(III) acetate hydrate (99.9%), ytterbium(III) acetate hydrate (99.9%), erbium(III) acetate hydrate (99.9%), neodymium(III) acetate hydrate (99.9%), ammonium fluoride (NH4F, 98+%), 1-octadecene (ODE, 90%), oleic acid (OA, 90%), epirubicin hydrochloride (EPI, 90+%), and L-cysteine (L-Cys, 97%) were purchased from Sigma-Aldrich. Histidine (His, 99%) and glucose (Glu, 99%) were bought from Macklin. Phosphate buffered saline (PBS) was obtained from HyClone. Hydrogen chloride (HCl), sodium hydroxide (NaOH), potassium chloride (KCl), sodium chlorate (NaCl), calcium chloride (CaCl2,) magnesium chloride (MgCl2), aluminum chloride (AlCl3), and L-glycine (L-Gly) were supplied from the China National Pharmaceutical Group Corporation. Cyanidin 3-glucoside, doxorubicin, and daunorubicin were purchased from Shanghai yuanye Bio-Technology company. All chemicals and reagents were analytically pure and used without any further purification.

2.2. Characterization

Upconversion fluorescence spectra were recorded on an Edinburgh F96S luminescence spectrometer (Shanghai Lengguang Technology Co., China) at room temperature with the excitation of an external 0–2 W adjustable continuous wave semiconductor laser at 808 nm (Changchun Laser Optoelectronics Technology Co., China). The morphology and size of the UCNPs were determined by transmission electron microscopy (TEM, Tecnai G2, FEI Company, Hillsboro OR, USA). The crystal structure and the phase purity of the UCNPs were obtained using an X-ray diffractometer (XRD, Bruker D8-Discover, Karlsruhe, Germany). Ultraviolet-visible (UV-Vis) absorption spectra were recorded on a UV-Vis spectrophotometer (Shimadzu UV-1780, Kyoto, Japan). The Fourier transform infrared (FTIR) spectra were performed using a Nicole iS10 FTIR spectrometer (Thermo Fisher Scientific, Waltham, USA) from samples in KBr pellets.

2.3. Synthesis of Oleic Acid (OA)-Coated NaYF4:Yb/Er/Nd

NaYF4:Yb/Er/Nd nanoparticles were synthesized using the co-precipitation method [56]. Following the typical procedure, 1 mmol rare-earth acetates (Y/Yb/Er/Nd = 77:20:2:1) were mixed with oleic acid (10 mL) and 1-octadecene (15 mL) in a 100 mL flask under vigorous stirring. The solution was heated to 156 °C under argon protection and maintained for 1 h to form the lanthanide oleate complexes and remove the residual water and oxygen. Then, the solution was cooled down to 50 °C. A methanol solution (20 mL) containing NH4F (4 mmol) and NaOH (2.5 mmol) was added into the flask and incubated for 30 min. The temperature was increased to 70 °C to remove the methanol and then heated to 305 °C under an argon atmosphere for 1.5 h, before being cooled down to room temperature. The resulting nanoparticles were precipitated from the solution by the addition of ethanol and collected via centrifugation at 6000 rpm. The precipitated nanoparticles were repeatedly washed with ethanol and cyclohexane and finally redispersed in cyclohexane.

2.4. Synthesis of OA-Coated Core@shell NaYF4:Yb/Er/Nd@NaYF4:Nd

By using the synthesized NaYF4:Yb/Er/Nd core nanoparticles as seeds, an NaYF4:Nd layer was grown through the epitaxial growth method [56]. A total of 0.5 mmol of rare-earth acetates (Y/Nd = 70:30) were mixed with oleic acid (10 mL) and 1-octadecene (15 mL) in a flask. The solution was heated to 156 °C under argon flow for 1 h with magnetic stirring and then cooled to 50 °C. Core nanoparticles (1 mmol) in cyclohexane (10 mL) were added along with a methanol solution (20 mL) containing NH4F (4 mmol) and NaOH (2.5 mmol) into the flask and stirred at 50 °C for 30 min. The temperature was increased to 70 °C to remove the methanol and then heated to 305 °C under an argon atmosphere for 1.5 h, before being cooled down to room temperature. The resulting nanoparticles were precipitated out by the addition of ethanol, collected by centrifugation, washed with ethanol and cyclohexane, and finally redispersed in cyclohexane by ultrasonication.

2.5. Synthesis of Ligand-Free NaYF4:Yb/Er/Nd@NaYF4:Nd

Ligand-free core@shell UNCPs were prepared using acid treatment. Oleic acid (OA)-coated core@shell nanoparticles (0.2 mmol) in cyclohexane (1 mL) were added with ethanol. The mixture was centrifuged at 6000 rpm to precipitate the nanoparticles. The collected nanoparticles were added with 0.1 M HCl solution (1 mL). The reaction was performed with ultrasonication for 1 h at 45 °C. During the reaction, the carboxylate groups of the OA ligand were protonated to form OA. Next, the solution was mixed with 0.1 mL cyclohexane to remove OA by extraction with cyclohexane. Subsequently, the ligand-free UCNPs were collected by centrifugation at 14,000 rpm for 0.5 h. The product was washed repeatedly with deionized water and redispersed in deionized water for further experiments.

2.6. Optimization of Experimental Conditions

The effect of pH on the fluorescence intensity with and without EPI (26.73 μM) was investigated using solutions containing ligand-free core@shell UCNPs (0.4 M) with pH values adjusted from 4 to 8 by adding HCl or NaOH. Under an optimized pH, the influence of the ligand-free core@shell UCNP concentration on the quenching efficiency was explored with the addition of EPI (26.73 μM). The optimal reaction time was determined under the optimized ligand-free core@shell UCNP concentration in PBS.

2.7. Assay Conditions for the detection of EPI

A stock solution of 137.94 mM EPI was prepared in deionized water and stored at 4 °C. Different concentrations of EPI were obtained by diluting the stock solution. The concentration of ligand-free core@shell UCNPs was adjusted to 0.6 M by adding PBS. For the fluorometric detection, various concentrations of EPI solutions were added into 3 mL of ligand-free core@shell UCNP (0.6 M) solution. To avoid a change in volume, each addition was 1.5 μL. The final concentration of EPI was varied from 0.09 μM to 258.63 μM. Reactions were performed for 10 min at room temperature before fluorescence spectrum measurements.

2.8. Real Sample Preparation

The urine sample was collected from a healthy volunteer. The sample was diluted 10 fold before analysis and no other pretreatments were used.

3. Results and Discussion

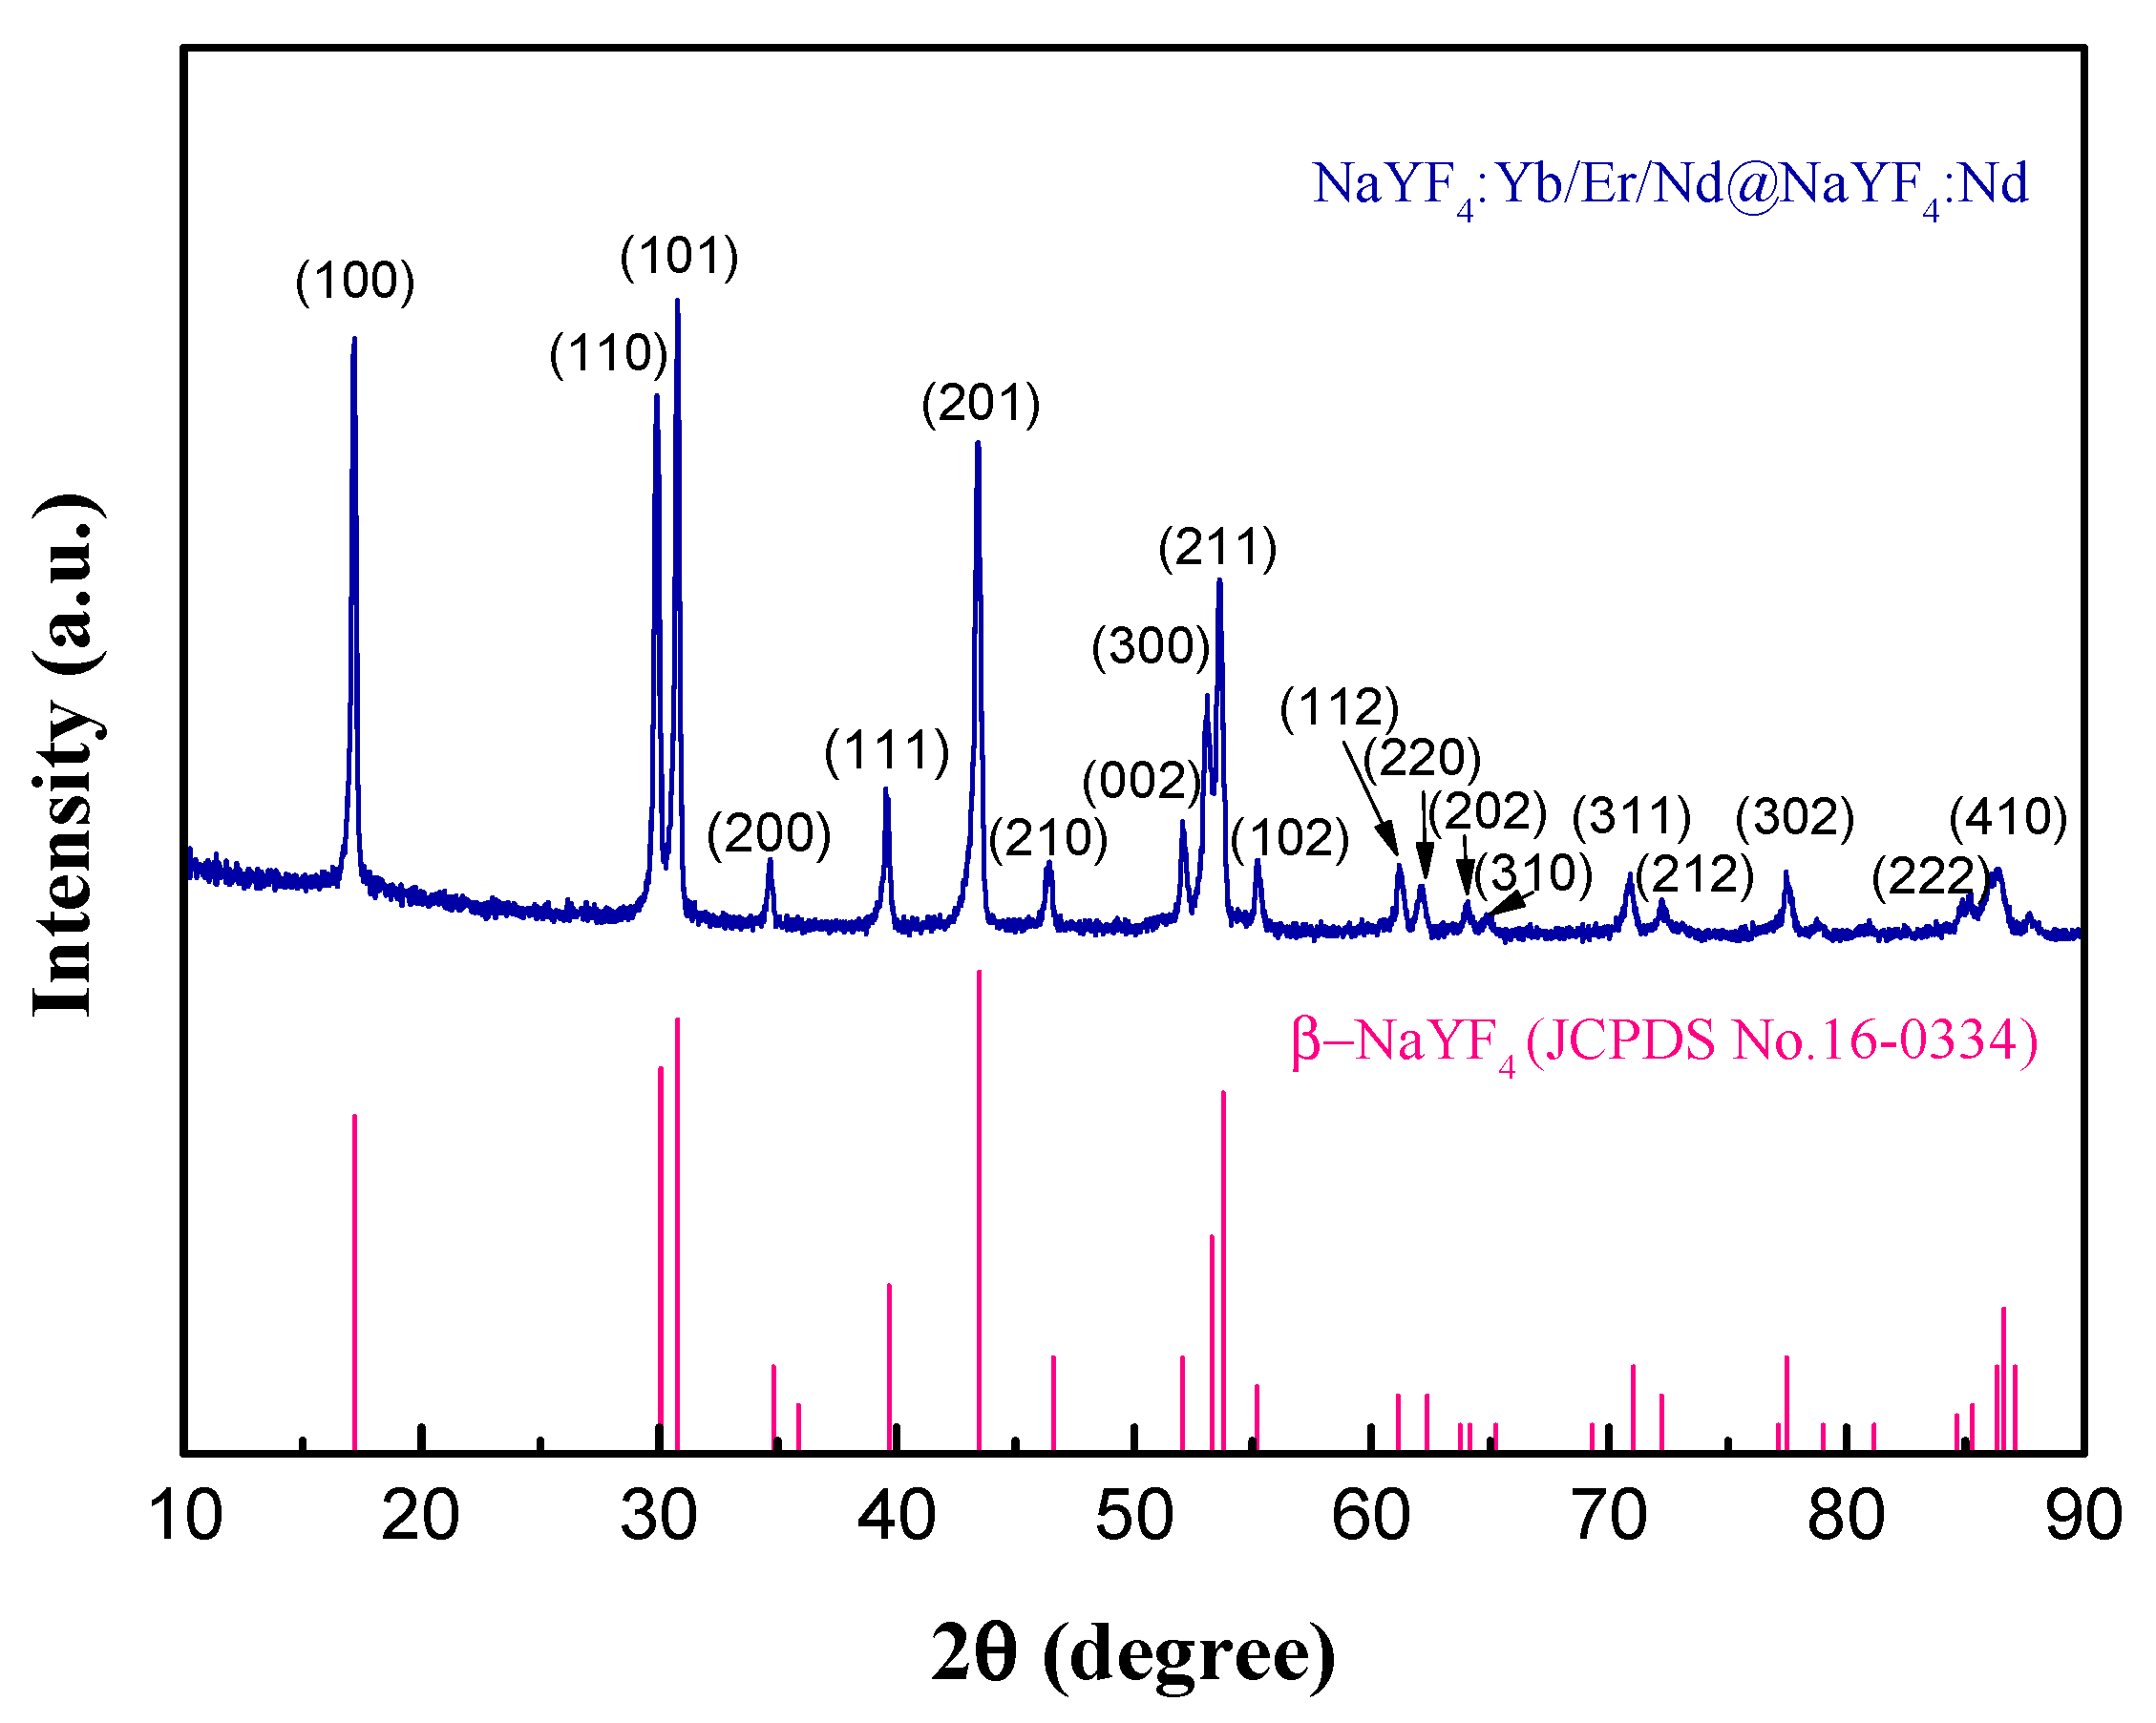
3.1. Characterization of UCNPs

Prepared core (NaYF4:Yb/Er/Nd), core@shell (NaYF4:Yb/Er/Nd@NaYF4:Nd), and ligand-free core@shell (NaYF4:Yb/Er/Nd@NaYF4:Nd) UCNPs were analyzed by TEM. Figure 2a demonstrates that the synthesized core UCNPs are well-dispersed spherical particles and uniform in size with an average diameter of ~24.7 ± 1.7 nm (mean ± standard deviation). To enhance the upconversion fluorescence intensity, an external shell doped with Nd3+ was grown on the surface of the core UCNPs via the epitaxial growth method. Owing to an overall increase in the doping concentration of Nd3+, this active shell layer can enhance the harvesting of excitation energy. Additionally, the core-shell structure can minimize the surface quenching effect of the core and reduce cross relaxation between lanthanide ions [52]. As illustrated in Figure 2b, the resulting core@shell UCNPs were highly monodispersed elliptic particles with a length of 32.2 ± 1.4 nm and width of 25.1 ± 1.7 nm. The physical shape and size of these core@shell UCNPs was consistent with those of reported core@shell UCNPs synthesized using the same method [56]. To make core@shell UCNPs water-dispersible, the surface of the UCNPs was modified by removing oleate ligands. Figure 2c shows that the ligand-free core@shell UCNPs disperse well in water and retain the same narrow size distribution as the core@shell UCNPs. The successful removal of oleate ligands after acid treatment was also confirmed by Fourier-transform infrared spectroscopy. As shown in Figure S1, for the spectrum of core@shell UCNPs, peaks at 2927 and 2853 cm−1 are attributed to symmetric and asymmetric stretching vibrations of C-H, and peaks at 1556 and 1464 cm−1 are caused by symmetric and asymmetric stretching of COO-respectively, which are all associated with oleate ligands [57]. After surface modifications, these characteristic bands almost all vanished.
The crystal structure of the ligand-free core@shell UCNPs (denoted by Nd3+-UCNPs) was examined by X-ray diffraction (XRD), as shown in Figure 3. It was found that the peak positions and intensities were in good agreement with the calculated values of the pure hexagonal-phase structure β-NaYF4 nanocrystals (JCPDS no. 16-0334). In addition, the selected area electron diffraction pattern (SAED) of the Nd3+-UCNPs (Figure 2d) displays spotty polycrystalline diffraction rings, which correspond to the (111), (200), (220), and (311) planes of β-NaYF4 lattice. It is noted that β-phase NaYF4 is preferred over α-NaYF4, since it has a much stronger fluorescence intensity and better fluorescent thermal stability [58].

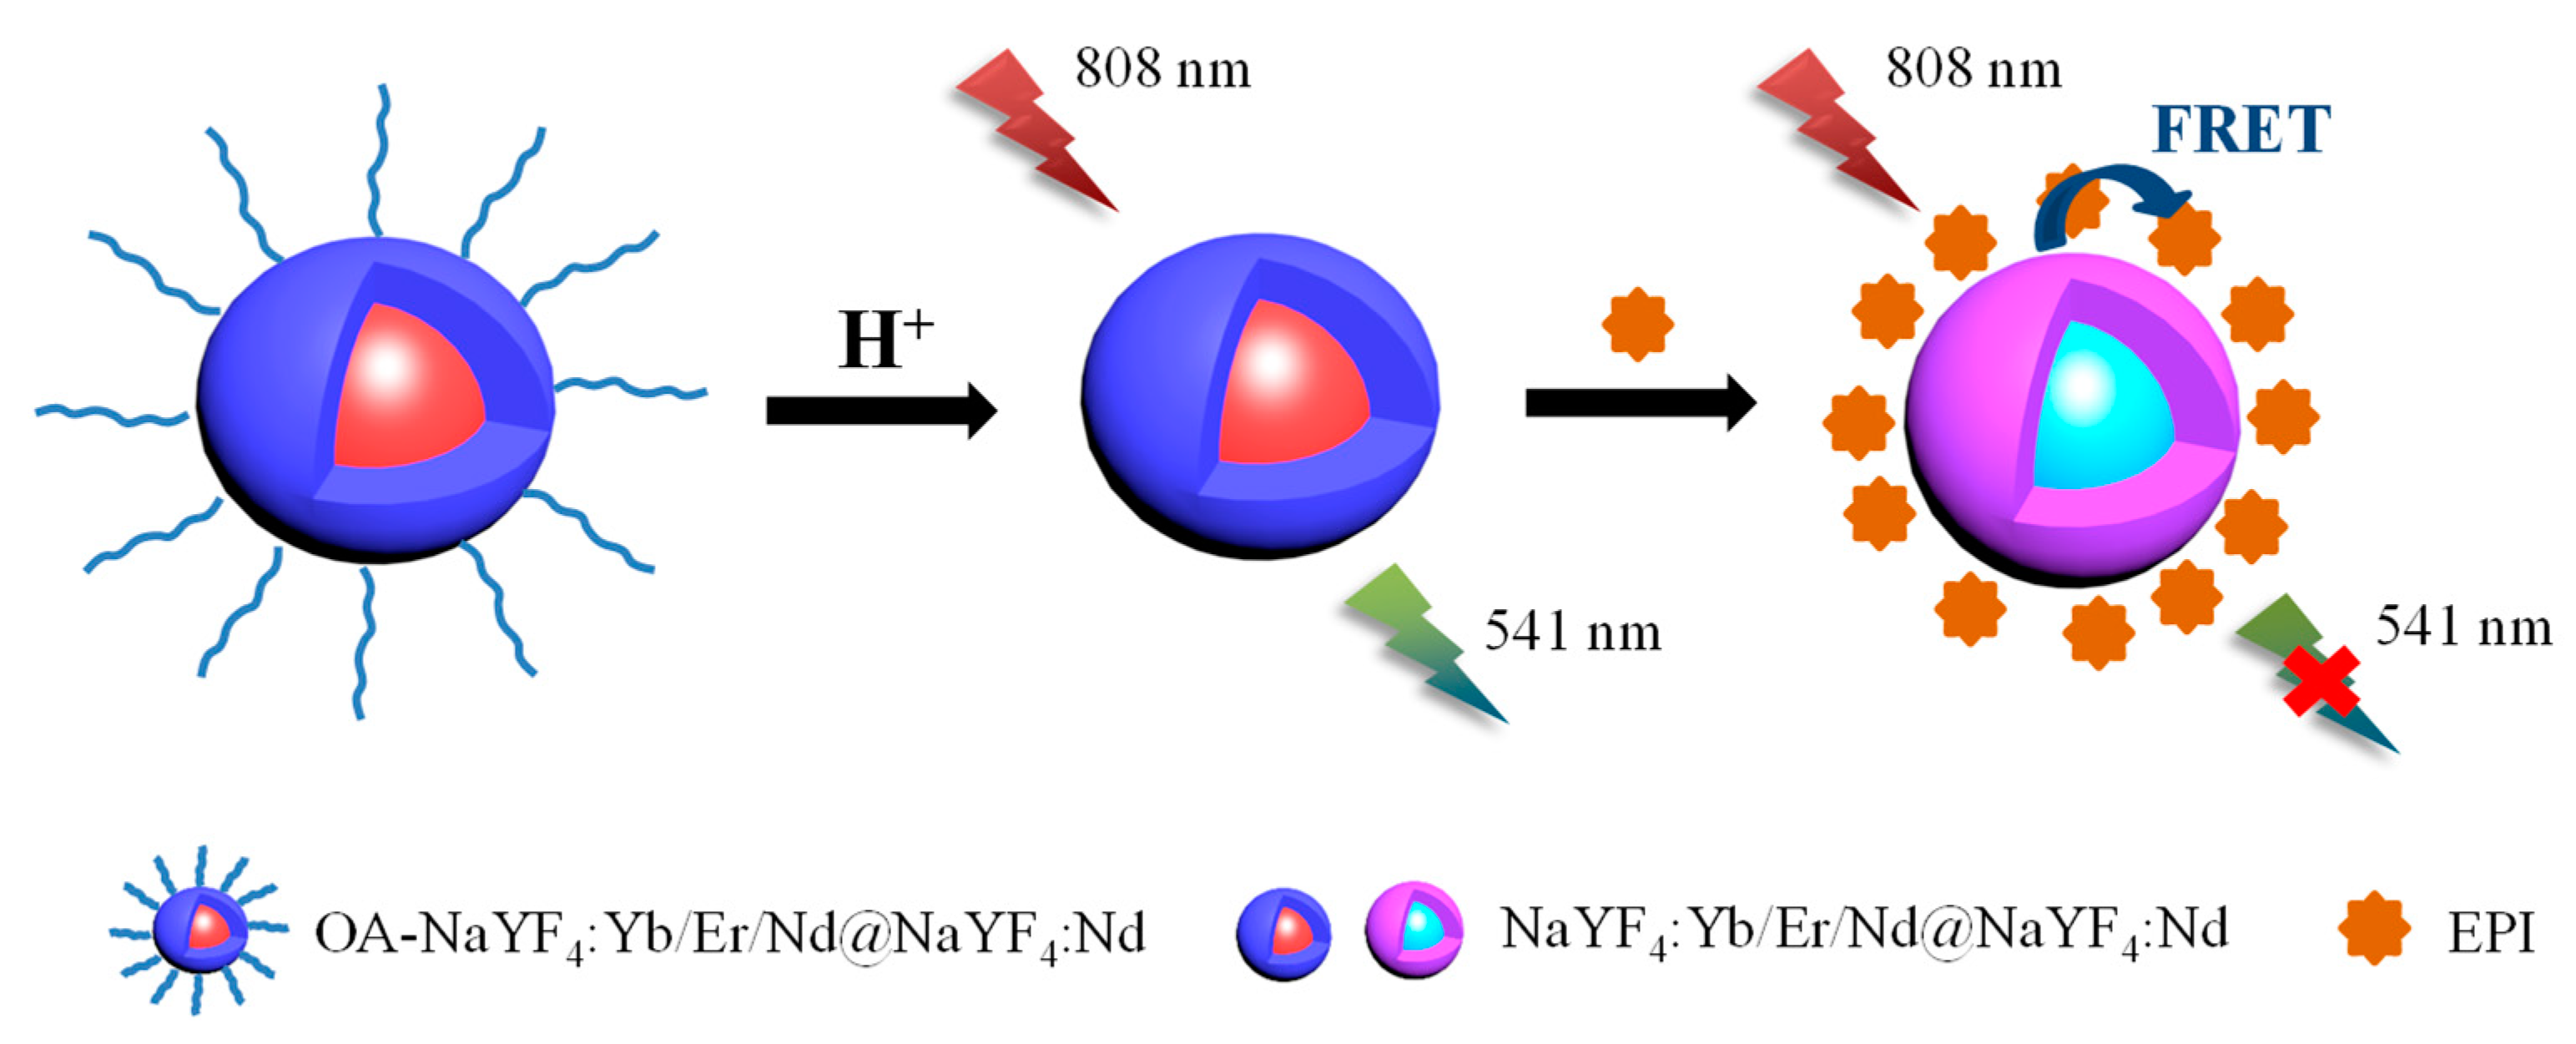
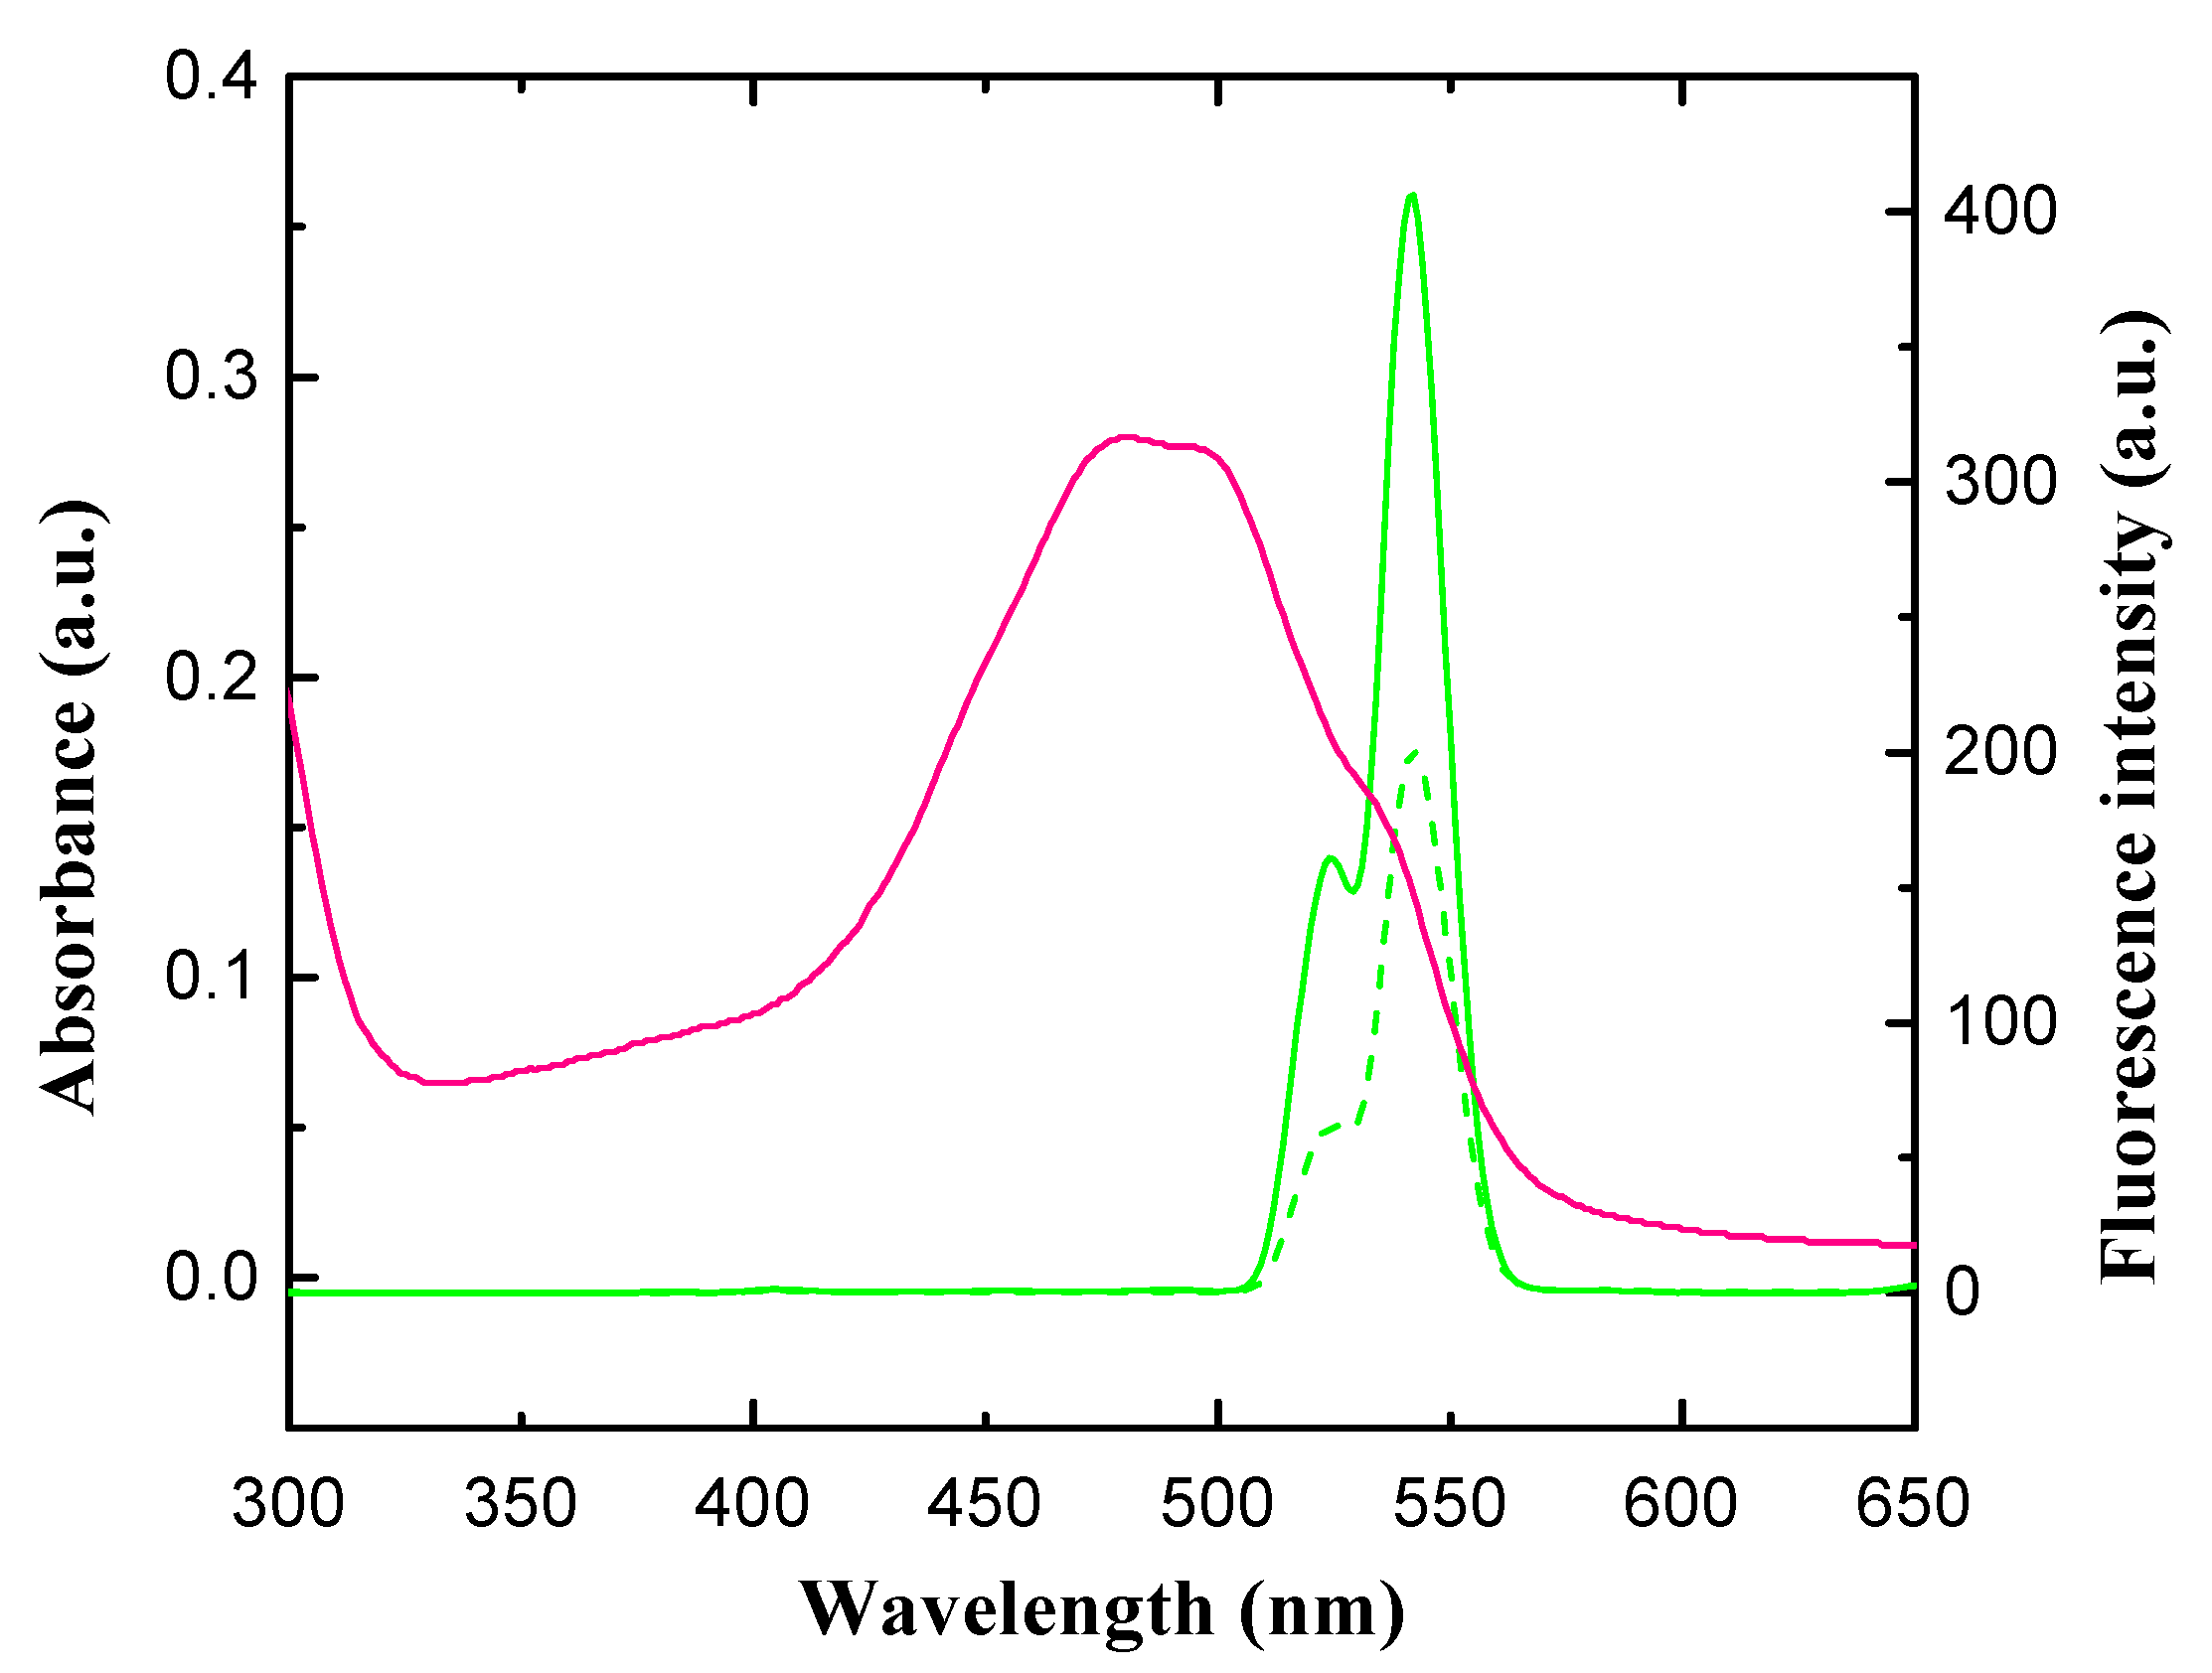
3.2. Principle of Detection

The principle of the fluorometric detection of EPI using Nd3+-UCNPs is illustrated in Figure 1. The detection is based on the fluorescence resonance energy transfer process between Nd3+-UCNPs and EPI, where Nd3+-UCNPs works as an energy donor and EPI acts as an energy acceptor. Upon 808 nm excitation, the Nd3+ ions doped in the shell layer absorb and transfer the excitation energy to nearby Yb3+ ions in the nucleus and subsequently to the luminescent Er3+ center, which yields the upconversion emission. As shown in Figure 4, the Nd3+-UCNPs exhibit two emission bands in the green parts of the visible region. The emission bands at around 523 nm and 541 nm are due to 2H11/2-4I15/2, 4S3/2-4I15/2 transitions of Er3+, respectively [59]. The absorption spectrum of EPI (26.73 μM) in neutral pH conditions (pH = 7) was measured using a UV-Vis spectrophotometer. Figure 4 demonstrates that EPI has absorption peaks at 480 nm and 497 nm, which are close to the emission peaks of Nd3+-UCNPs. The absorption band of EPI (~400 nm–~600 nm) matched well with the emission band of Nd3+-UCNPs; therefore, they work as a donor and acceptor pair. Furthermore, the distance between the donor and the acceptor plays a critical role in affecting the rate of energy transfer [54]. It has been reported that the surface of Nd3+-UCNPs is negatively charged in neutral and alkaline solutions, while EPI is positively charged because of protonated amino nitrogen [60,61]. Therefore, EPI and Nd3+-UCNPs would interact via electrostatic attractions to form a new complex and quench the fluorescence intensity, as displayed in Figure 4. Notably, the maximum emission of Nd3+-UCNPs is located at ~541 nm. Therefore, the emission at 541 nm was used as the quantitative signal in the further experiments.

3.3. Optimization of Experimental Conditions

To achieve high sensitivity and precision, several experimental conditions were optimized including the pH of the system, concentration of Nd3+-UCNPs, and reaction time. The effect of pH on the detection system was investigated with 0.4 M EPI (Figure S2). Considering that EPI may undergo hydrolysis in alkaline solutions (pH > 7.4), PBS (pH = 7.4) for the detection system was selected for further experiments to attain a low detection limit (Figure S2) [62].
The effect of the concentration of Nd3+-UCNPs on the quenching efficiency was explored. The fluorescence intensity of Nd3+-UCNPs with and without the addition of EPI were denoted by I and I 0 , respectively. Figure 5a demonstrates the quenching efficiency, computed by ( I 0 I ) / I 0 , with the concentration of Nd3+-UCNPs varying from 0.13 to 0.8 M. It is seen that the quenching efficiency reaches the maximum when the concentration of Nd3+-UCNPs reaches ~0.6 M. Hence, the concentration of Nd3+-UCNPs was fixed at 0.6 M for the following experiments.
The reaction time also plays an important role in the detection. Figure 5b shows the temporal evolution of the quenched fluorescence intensity of Nd3+-UCNPs at 541 nm upon the addition of EPI (26.73 μM). The fluorescence intensity decreases sharply in the first several minutes, and reaches a steady state after a reaction time of 10 min. Furthermore, the fluorescence intensity remains stable for about 1 h, which demonstrates good stability of the detection system. Therefore, the reaction time was set to 10 min in all experiments.

3.4. Fluorometric Detection of EPI

A series of fluorescence spectra of Nd3+-UCNPs in the presence of various concentrations of EPI were recorded under the optimized experimental conditions, as illustrated in Figure 6a. The fluorescence intensity decreases monotonously with the increase in EPI concentrations. Figure 6b plots the fluorescence intensity ratio, I 0 / I , (monitored at 541 nm) against the concentration of EPI (0–258.63 μM). A good linear relationship occurs (R2 = 0.994) when the concentration of EPI is in the range of 0.09 μM to 189.66 μM. Quantified analysis can be performed using the Stern-Volmer equation, which is given by,
I 0 / I = 1 + K s v × [ Q ]
where K s v is the Stern-Volmer quenching constant and [ Q ] is the concentration of the quencher, EPI. K s v was computed to be 2.10 × 10⁴ M−1 using a linear least square fit. The K s v of the order 104 demonstrates that EPI is an efficient quencher. The detection limit was determined to be 0.05 μM, which was calculated by 3 σ / K , where σ represents the standard deviation of the blank signal and K is the slope of the linear curve. To compare with other methods, Table 1 summarizes the detection limit and the linear range of other techniques for EPI detection. The detection limit of this method is comparable to that of electrochemical methods [28,29,30,31], which is sufficiently sensitive for practical applications. Furthermore, this detection system has a wider linear range than that of other methods [13,16,20,22,28,29,30].

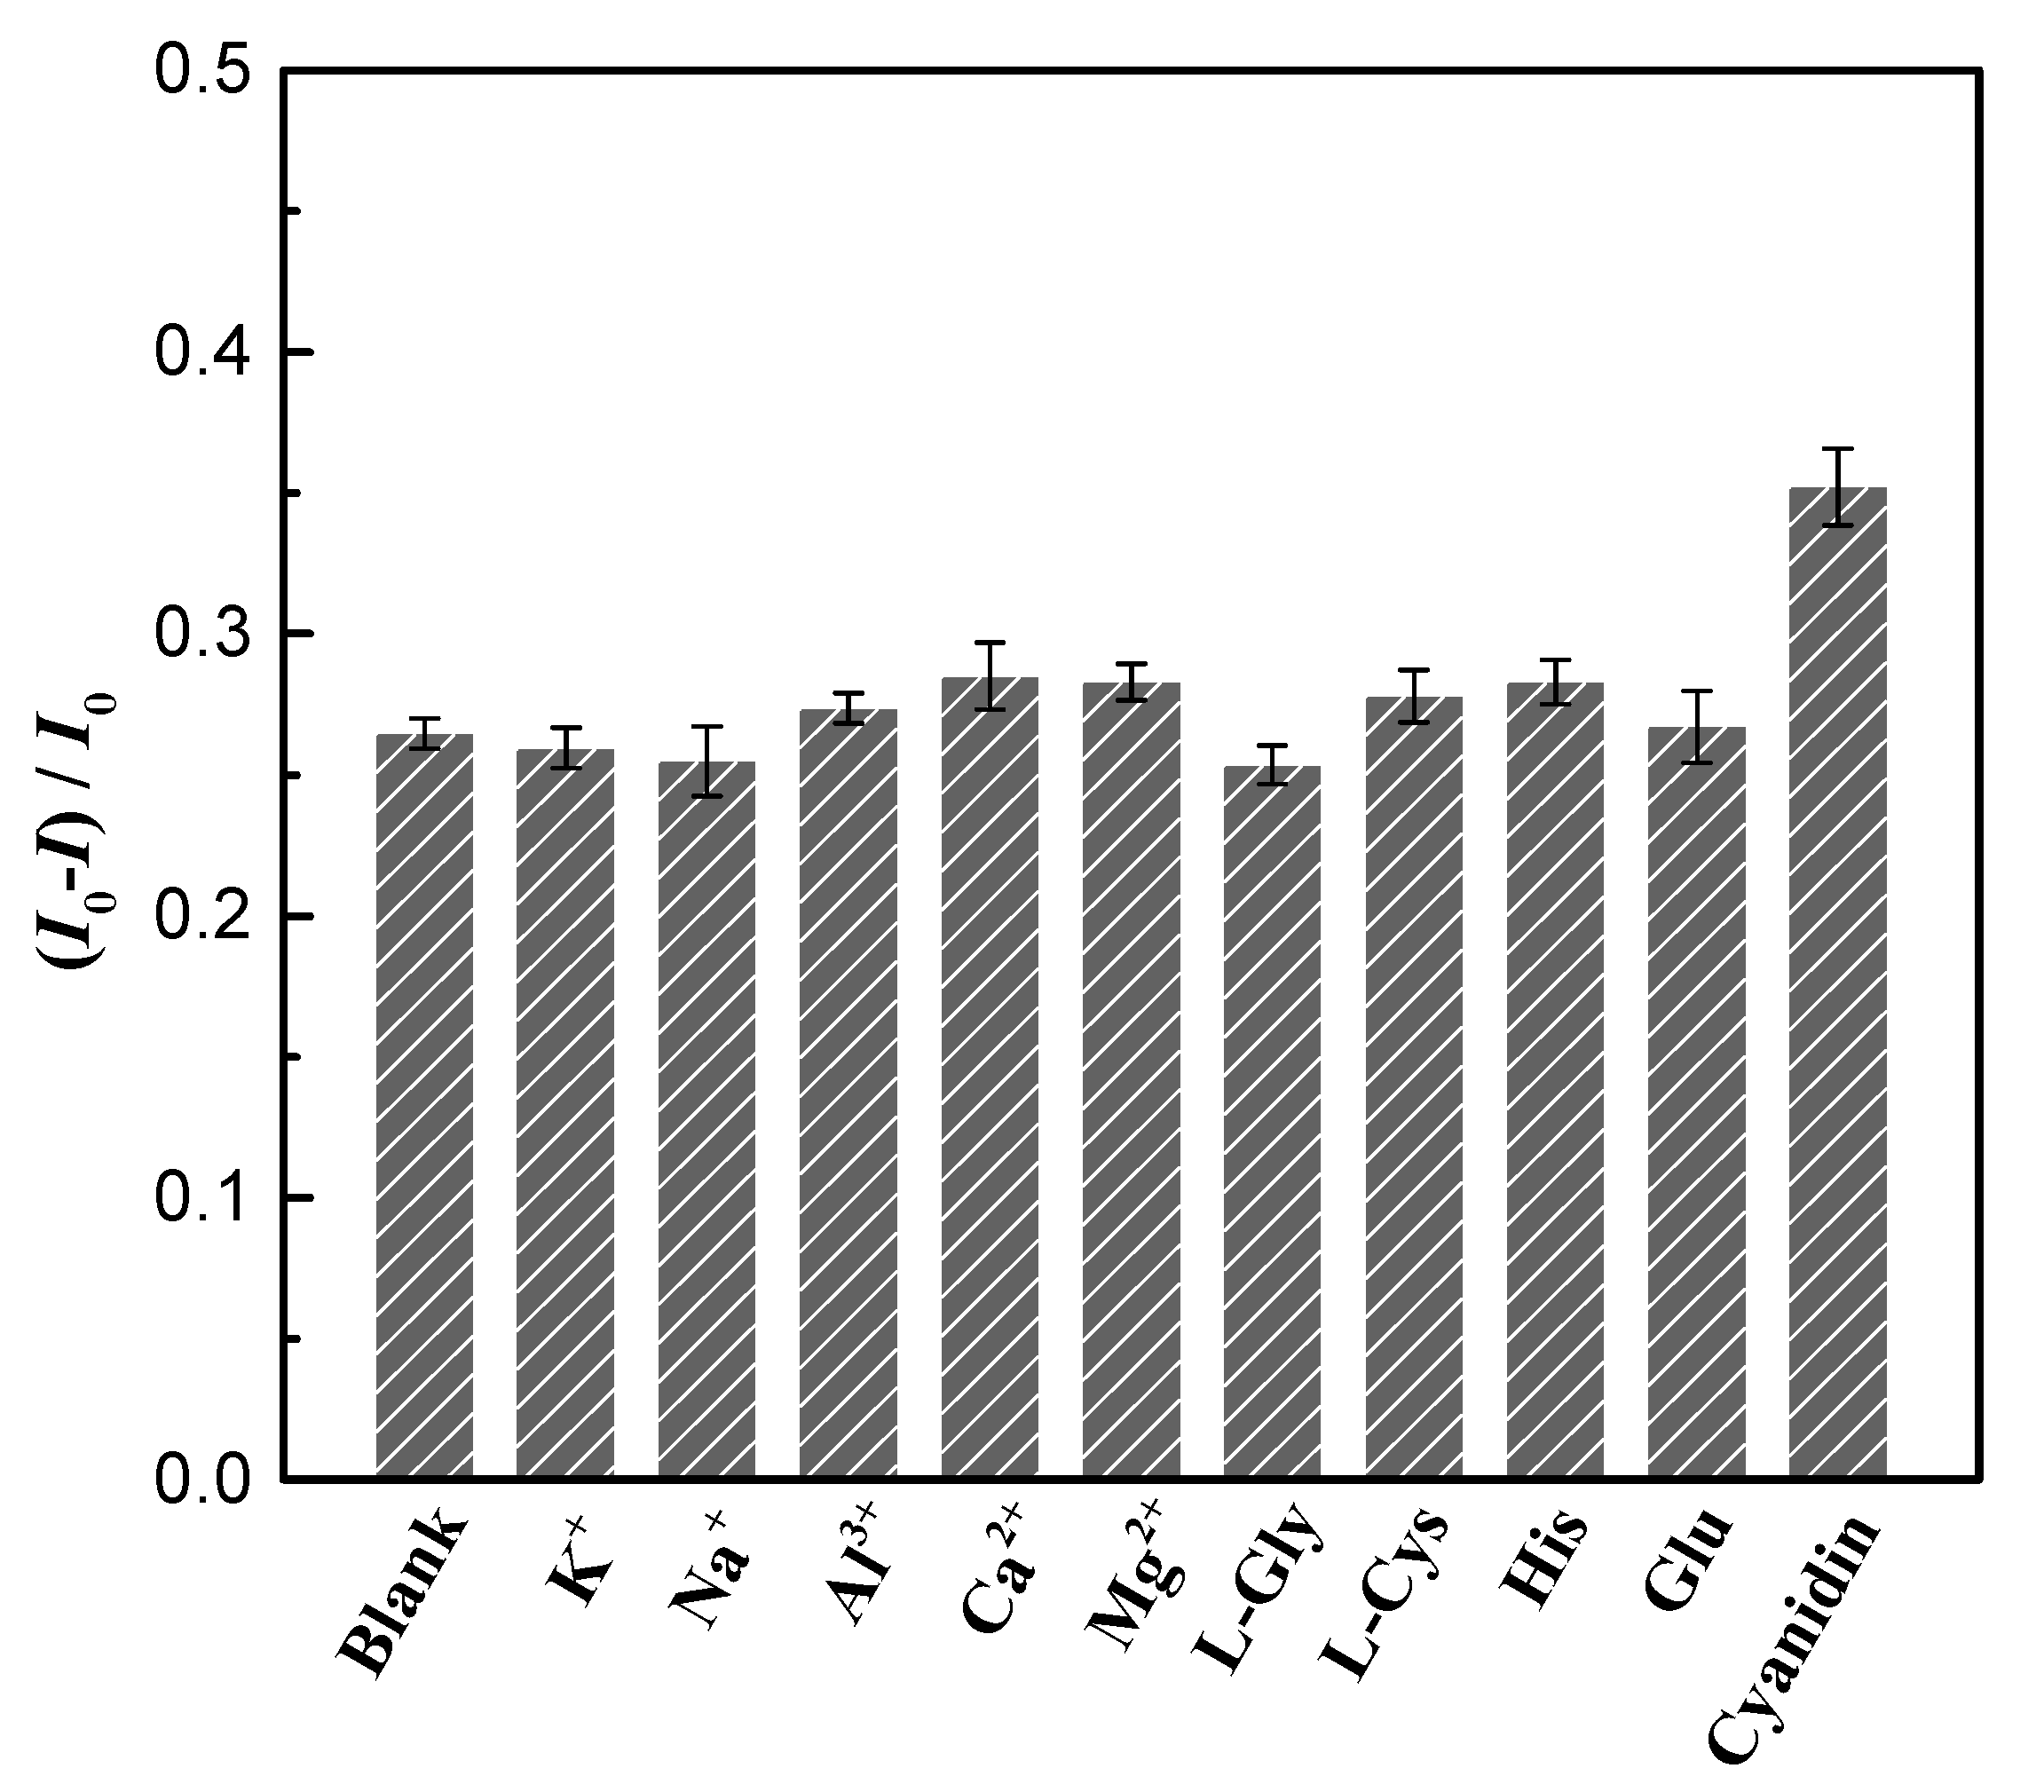
3.5. Selectivity for the Detection of EPI

The interference of some metal ions and biomolecules that are normally present in biological fluids on the detection of EPI by the Nd3+-UCNPs probe was examined. As shown in Figure 7, except for 3 fold cyanidin 3-glucoside, the quenching efficiency when 17.24 μM EPI was added was not affected by a coexisting substance including 500 fold K+, 500 fold Na+, 500 fold Al3+, 300 fold Ca2+, 200 fold Mg2+, 1000 fold L-glycine, 500 fold L-cysteine, 500 fold histidine, or 300 fold glucose. The addition of cyanidin 3-glucoside would attenuate the upconversion fluorescence intensity, because cyanidin 3-glucoside has similar absorption spectra to that of EPI [63]. To gain a clear picture of the interference effect of cyanidin 3-glucoside, the quenching efficiency was measured with the concentration of cyanidin 3-glucoside varied from 0.1724 μM to 34.48 μM, as demonstrated in Figure S3a. It was found that the quenching efficiency was insensitive to variations in the concentration of cyanidin 3-glucoside when its concentration was low (less than 8.62 μM). Since normally the concentration of anthocyanin metabolites in urine is very low, their interference effects on the determination are minimal [63]. Even if a large anthocyanin dose is consumed, concentrations of anthocyanin metabolites in urine at 24 h are reduced to levels of ~0.01 μM [63]. In this case, their interference effects could be effectively eliminated by waiting sufficiently long time before the investigation. Furthermore, most potential interferences can be largely eliminated by simple dilution. Additionally, we performed experiments to investigate the interference effect in the presence of other anthracycline antibiotics including doxorubicin and daunorubicin. As shown in Figure S3b, the quenching efficiency was affected by the presence of doxorubicin or daunorubicin, especially when their concentrations were large. The current nanoprobe is limited to detecting EPI without the presence of some anthracycline antibiotics, whose molecular structure is similar to that of EPI. However, generally, EPI is not combined with other anthracycline antibiotics in actual treatment. To further improve the specificity, the UCNP surfaces would need to be modified with aptamer or molecularly printed polymers, which can interact specifically with EPI [30,64]. This will be investigated in future work.

3.6. Sample Analysis

For practical applications, the proposed Nd3+-UCNPs sensor was employed to detect EPI in human urine. The detection of EPI was performed by spiking a specified concentration of EPI in 3 mL urine sample containing Nd3+-UCNPs (0.6 M) using the standard addition method. As shown in Table 2, the recovery for the sample was in the range of 97.5–102.6%, with a relative standard deviation (RSD) from 4.7% to 6.1%. This result confirms the feasibility of using Nd3+-UCNPs for EPI detection in human urine samples.

4. Conclusions

In summary, a simple and selective Nd3+-UCNPs fluorescent sensor for rapid and reliable detection of EPI in aqueous solutions has been proposed. Water-dispersible Nd3+-UCNPs are prepared by simply removing the oleic ligands from the core@shell UCNPs through acid treatment. The absorption of EPI onto the Nd3+-UCNP surface effectively quenches the upconversion fluorescence intensity via the FRET process. This sensing method is fast and sensitive and has a wide linear range. The interference from common ions and biomolecules is minimal. Urine sample testing demonstrates that the detection strategy is applicable for real sample analysis. Finally, we would like to point out that the Nd3+-UCNPs sensor is an excellent emitter with low autofluorescence and a high penetration depth to biological samples, which holds great potential for applications in biological and analytical fields such as in vivo imaging, sensing, and therapy.

Supplementary Materials

The following are available online at https://www.mdpi.com/2079-4991/9/12/1700/s1, Figure S1: FTIR spectra of (a) OA-coated core@shell UCNPs, and (b) ligand-free core@shell UCNPs, Figure S2: (a) Upconversion fluorescence responses of Nd3+-UCNPs in the absence and presence of 26.73 μM EPI at different pH values, (b) UV absorption spectra of EPI for a pH from 4 to 8, Figure S3: The fluorescence quenching efficiency of the detection system in the presence of (a) cyanidin 3-glucoside, (b) doxorubicin or daunorubicin in coexistence with EPI. I0 represents the fluorescence intensity of Nd3+-UCNPs while I denotes the fluorescence intensity of Nd3+-UCNPs with the addition of EPI (17.24 μM) and other interfering species.

Author Contributions

Conceptualization, J.Z. and Y.C.; methodology, Q.X. and T.H.; formal analysis, L.S. and J.M.; investigation, L.S. and J.Z.; resources, Q.X., J.S. and K.B.; data curation, J.Z.; writing—original draft preparation, J.Z.; writing—review and editing, J.M.; supervision, J.M. and Y.C.

Funding

This research was funded by the National Natural Science Foundation of China under Grant No. (51805082, 51435003, 51605088) and the Natural Science Foundation of Jiangsu Province under Grant No. BK20170683.

Acknowledgments

The authors are grateful for the comments and support provided by Qiyue Shao (Southeast University) and Feng Wang (City University of Hong Kong).

Conflicts of Interest

The authors declare no conflict of interest.

References

  1. Cunningham, D.; Starling, N.; Rao, S.; Iveson, T.; Nicolson, M.; Coxon, F.; Middleton, G.; Daniel, F.; Oates, J.; Norman, A.R. Capecitabine and Oxaliplatin for Advanced Esophagogastric Cancer. N. Engl. J. Med. 2008, 358, 36–46. [Google Scholar] [CrossRef] [PubMed]
  2. Llovet, J.M.; Bruix, J. Systematic review of randomized trials for unresectable hepatocellular carcinoma: Chemoembolization improves survival. Hepatology 2003, 37, 429–442. [Google Scholar] [CrossRef] [PubMed]
  3. Earl, H.; Iddawela, M. Epirubicin as adjuvant therapy in breast cancer. Expert Rev. Anticancer Ther. 2004, 4, 189–195. [Google Scholar] [CrossRef]
  4. Poole, C.J.; Earl, H.M.; Hiller, L.; Dunn, J.A.; Bathers, S.; Grieve, R.J.; Spooner, D.A.; Agrawal, R.K.; Fernando, I.N.; Brunt, A.M.; et al. Epirubicin and Cyclophosphamide, Methotrexate, and Fluorouracil as Adjuvant Therapy for Early Breast Cancer. N. Engl. J. Med. 2006, 355, 1851–1862. [Google Scholar] [CrossRef] [PubMed]
  5. Martín, M.; Rodríguez-Lescure, Á.; Ruiz, A.; Alba, E.; Calvo, L.; Ruiz-Borrego, M.; López García-Asenjo, J.A. Randomized Phase 3 Trial of Fluorouracil, Epirubicin, and Cyclophosphamide Alone or Followed by Paclitaxel for Early Breast Cancer. J. Natl. Cancer Inst. 2008, 100, 805–814. [Google Scholar] [CrossRef]
  6. Bhutani, M.; Kumar, L.; Vora, A.; Bhardwaj, N.; Pathak, A.K.; Singh, R.; Kochupillai, V. Randomized study comparing 4′-epi-doxorubicin (Epirubicin) versus doxorubicin as a part of induction treatment in adult acute lymphoblastic leukemia. Am. J. Hematol. 2002, 71, 241–247. [Google Scholar] [CrossRef] [PubMed]
  7. Zinzani, P.; Tani, M.; Molinari, A.; Stefoni, V.; Zuffa, E.; Alinari, L.; Gabriele, A.; Bonifazi, F.; Salvucci, M.; Tura, S.; et al. Ifosfamide, epirubicin and etoposide regimen as salvage and mobilizing therapy for relapsed/refractory lymphoma patients. Haematologica 2002, 87, 816–821. [Google Scholar]
  8. Lehmann, J.; Retz, M.; Wiemers, C.; Beck, J.; Thüroff, J.; Weining, C.; Albers, P.; Frohneberg, D.; Becker, T.; Funke, P.-J.; et al. Adjuvant Cisplatin Plus Methotrexate Versus Methotrexate, Vinblastine, Epirubicin, and Cisplatin in Locally Advanced Bladder Cancer: Results of a Randomized, Multicenter, Phase III Trial (AUO-AB 05/95). J. Clin. Oncol. 2005, 23, 4963–4974. [Google Scholar] [CrossRef]
  9. Kuroda, M.; Kotake, T.; Akaza, H.; Hinotsu, S.; Kakizoe, T. Efficacy of Dose-intensified MEC (Methotrexate, Epirubicin and Cisplatin) Chemotherapy for Advanced Urothelial Carcinoma: A Prospective Randomized Trial Comparing MEC and M-VAC (Methotrexate, Vinblastine, Doxorubicin and Cisplatin). Jpn. J. Clin. Oncol. 1998, 28, 497–501. [Google Scholar] [CrossRef] [PubMed]
  10. Florescu, M.; Magda, L.S.; Enescu, O.A.; Jinga, D.; Vinereanu, D. Early Detection of Epirubicin-Induced Cardiotoxicity in Patients with Breast Cancer. J. Am. Soc. Echocardiogr. 2014, 27, 83–92. [Google Scholar] [CrossRef]
  11. Guichard, N.; Guillarme, D.; Bonnabry, P.; Fleury-Souverain, S. Antineoplastic drugs and their analysis: A state of the art review. Analyst 2017, 142, 2273–2321. [Google Scholar] [CrossRef] [PubMed]
  12. Mahnik, S.N.; Rizovski, B.; Fuerhacker, M.; Mader, R.M. Development of an analytical method for the determination of anthracyclines in hospital effluents. Chemosphere 2006, 65, 1419–1425. [Google Scholar] [CrossRef] [PubMed]
  13. Maudens, K.E.; Stove, C.P.; Cocquyt, V.F.J.; Denys, H.; Lambert, W.E. Development and validation of a liquid chromatographic method for the simultaneous determination of four anthracyclines and their respective 13-S-dihydro metabolites in plasma and saliva. J. Chromatogr. B 2009, 877, 3907–3915. [Google Scholar] [CrossRef] [PubMed]
  14. Dodde, W.I.; Maring, J.G.; Hendriks, G.; Wachters, F.M.; Groen, H.J.; de Vries, E.G.; Uges, D.R. Determination of epirubicin and its metabolite epirubicinol in saliva and plasma by HPLC. Ther. Drug Monit. 2003, 25, 433–440. [Google Scholar] [CrossRef] [PubMed]
  15. Tariq, M.; Thomas, S.; Singh, A.; Talegaonkar, S. Developed and validated stability indicating HPLC method for the determination of epirubicin in bulk drug, marketed injection and polymeric nanoparticles. Braz. J. Pharm. Sci. 2018, 54. [Google Scholar] [CrossRef]
  16. Gopinath, P.; Veluswami, S.; Thangarajan, R.; Gopisetty, G. RP-HPLC-UV Method for Estimation of Fluorouracil–Epirubicin–Cyclophosphamide and Their Metabolite Mixtures in Human Plasma (Matrix). J. Chromatogr. Sci. 2018, 56, 488–497. [Google Scholar] [CrossRef]
  17. Bermingham, S.; O’Connor, R.; Regan, F.; McMahon, G.P. Simultaneous determination of anthracyclines and taxanes in human serum using online sample extraction coupled to high performance liquid chromatography with UV detection. J. Sep. Sci. 2010, 33, 1571–1579. [Google Scholar] [CrossRef]
  18. Wall, R.; McMahon, G.; Crown, J.; Clynes, M.; O’Connor, R. Rapid and sensitive liquid chromatography–tandem mass spectrometry for the quantitation of epirubicin and identification of metabolites in biological samples. Talanta 2007, 72, 145–154. [Google Scholar] [CrossRef]
  19. Sottani, C.; Tranfo, G.; Bettinelli, M.; Faranda, P.; Spagnoli, M.; Minoia, C. Trace determination of anthracyclines in urine: A new high-performance liquid chromatography/tandem mass spectrometry method for assessing exposure of hospital personnel. Rapid Commun. Mass Spectrom. 2004, 18, 2426–2436. [Google Scholar] [CrossRef]
  20. Sottani, C.; Rinaldi, P.; Leoni, E.; Poggi, G.; Teragni, C.; Delmonte, A.; Minoia, C. Simultaneous determination of cyclophosphamide, ifosfamide, doxorubicin, epirubicin and daunorubicin in human urine using high-performance liquid chromatography/electrospray ionization tandem mass spectrometry: Bioanalytical method validation. Rapid Commun. Mass Spectrom. 2008, 22, 2645–2659. [Google Scholar] [CrossRef]
  21. Li, R.; Dong, L.; Huang, J. Ultra performance liquid chromatography–tandem mass spectrometry for the determination of epirubicin in human plasma. Anal. Chim. Acta 2005, 546, 167–173. [Google Scholar] [CrossRef]
  22. Whitaker, G.; Lillquist, A.; Pasas, S.A.; O’Connor, R.; Regan, F.; Lunte, C.E.; Smyth, M.R. CE-LIF method for the separation of anthracyclines: Application to protein binding analysis in plasma using ultrafiltration. J. Sep. Sci. 2008, 31, 1828–1833. [Google Scholar] [CrossRef] [PubMed]
  23. Mbuna, J.; Kaneta, T.; Imasaka, T. Micellar electrokinetic chromatographic analysis for in vitro accumulation of anthracyclines enhanced by inhibitors of cell membrane transporter-proteins in cancer cells. Biomed. Chromatogr. 2011, 25, 1168–1174. [Google Scholar] [CrossRef] [PubMed]
  24. Mbuna, J.; Kaneta, T.; Imasaka, T. Measurement of intracellular accumulation of anthracyclines in cancerous cells by direct injection of cell lysate in MEKC/LIF detection. Electrophoresis 2010, 31, 1396–1404. [Google Scholar] [CrossRef]
  25. Ronkainen, N.J.; Halsall, H.B.; Heineman, W.R. Electrochemical biosensors. Chem. Soc. Rev. 2010, 39, 1747–1763. [Google Scholar] [CrossRef]
  26. Pingarrón, J.M.; Yáñez-Sedeño, P.; González-Cortés, A. Gold nanoparticle-based electrochemical biosensors. Electrochim. Acta 2008, 53, 5848–5866. [Google Scholar] [CrossRef]
  27. Komorsky-Lovrić, Š. Redox kinetics of adriamycin adsorbed on the surface of graphite and mercury electrodes. Bioelectrochemistry 2006, 69, 82–87. [Google Scholar] [CrossRef]
  28. Zhang, H. Fabrication of a single-walled carbon nanotube-modified glassy carbon electrode and its application in the electrochemical determination of epirubicin. J. Nanoparticle Res. 2004, 6, 665–669. [Google Scholar] [CrossRef]
  29. Bozal-Palabiyik, B.; Kurbanoglu, S.; Gumustas, M.; Uslu, B.; Ozkan, S. Electrochemical Approach for the Sensitive Determination of Anticancer Drug Epirubicin in Pharmaceuticals in the Presence of Anionic Surfactant. Rev. Roum. Chim. 2013, 58, 657–658. [Google Scholar]
  30. Hashkavayi, A.B.; Raoof, J.B. Design an aptasensor based on structure-switching aptamer on dendritic gold nanostructures/Fe3O4@SiO2/DABCO modified screen printed electrode for highly selective detection of epirubicin. Biosens. Bioelectron. 2017, 91, 650–657. [Google Scholar] [CrossRef]
  31. Karimi, F.; Shojaei, A.F.; Tabatabaeian, K.; Shakeri, S. CoFe2O4 nanoparticle/ionic liquid modified carbon paste electrode as an amplified sensor for epirubicin analysis as an anticancer drug. J. Mol. Liq. 2017, 242, 685–689. [Google Scholar] [CrossRef]
  32. Alavi-Tabari, S.A.R.; Khalilzadeh, M.A.; Karimi-Maleh, H.; Zareyee, D. An amplified platform nanostructure sensor for the analysis of epirubicin in the presence of topotecan as two important chemotherapy drugs for breast cancer therapy. New J. Chem. 2018, 42, 3828–3832. [Google Scholar] [CrossRef]
  33. Wang, Y.; Xie, J.; Tao, L.; Tian, H.; Wang, S.; Ding, H. Simultaneous electrochemical determination of epirubicin and methotrexate in human blood using a disposable electrode modified with nano-Au/MWNTs-ZnO composites. Sens. Actuators B Chem. 2014, 204, 360–367. [Google Scholar] [CrossRef]
  34. Wang, S.; Huang, Z.; Liu, M.; Liu, Y.; Ding, H. Application of Disposable Screen-printed Electrode as an Epirubicin Sensor and Relation among Whole Blood and Tissue Concentrations of Epirubicin. Int. J. Electrochem. Sci. 2012, 7, 1543–1555. [Google Scholar]
  35. Kokkinos, C.; Economou, A.; Prodromidis, M.I. Electrochemical immunosensors: Critical survey of different architectures and transduction strategies. TrAC Trends Anal. Chem. 2016, 79, 88–105. [Google Scholar] [CrossRef]
  36. Li, Z.; Zhang, Y.; La, H.; Zhu, R.; El-Banna, G.; Wei, Y.; Han, G. Upconverting NIR Photons for Bioimaging. Nanomaterials 2015, 5, 2148–2168. [Google Scholar] [CrossRef] [Green Version]
  37. Qiu, H.; Tan, M.; Ohulchanskyy, T.Y.; Lovell, J.F.; Chen, G. Recent Progress in Upconversion Photodynamic Therapy. Nanomaterials 2018, 8, 344. [Google Scholar] [CrossRef] [Green Version]
  38. Zhou, J.; Zhou, H.; Tang, J.; Deng, S.; Yan, F.; Li, W.; Qu, M. Carbon dots doped with heteroatoms for fluorescent bioimaging: A review. Microchim. Acta 2017, 184, 343–368. [Google Scholar] [CrossRef]
  39. Specht, E.A.; Braselmann, E.; Palmer, A.E. A Critical and Comparative Review of Fluorescent Tools for Live-Cell Imaging. Annu. Rev. Physiol. 2017, 79, 93–117. [Google Scholar] [CrossRef]
  40. Shang, L.; Dong, S.; Nienhaus, G.U. Ultra-small fluorescent metal nanoclusters: Synthesis and biological applications. Nano Today 2011, 6, 401–418. [Google Scholar] [CrossRef]
  41. Li, P.; Liu, S.; Yan, S.; Fan, X.; He, Y. A sensitive sensor for anthraquinone anticancer drugs and hsDNA based on CdTe/CdS quantum dots fluorescence reversible control. Colloids Surf. A Physicochem. Eng. Asp. 2011, 392, 7–15. [Google Scholar] [CrossRef]
  42. Wei, J.-R.; Chen, H.-Y.; Zhang, W.; Pan, J.-X.; Dang, F.-Q.; Zhang, Z.-Q.; Zhang, J. Ratiometric fluorescence for sensitive and selective detection of mitoxantrone using a MIP@rQDs@SiO2 fluorescence probe. Sens. Actuators B Chem. 2017, 244, 31–37. [Google Scholar] [CrossRef]
  43. Ertas, N.; Satana Kara, H.E. l-Cysteine capped Mn-doped ZnS quantum dots as a room temperature phosphorescence sensor for in-vitro binding assay of idarubicin and DNA. Biosens. Bioelectron. 2015, 70, 345–350. [Google Scholar] [CrossRef] [PubMed]
  44. Wei, X.; Huang, X.; Fang, Y.; Zhang, Q. Determination of Idarubicin Using CdTe Quantum Dots as Fluorescence Probes. J. Nanosci. Nanotechnol. 2016, 16, 6992–6997. [Google Scholar] [CrossRef]
  45. Liu, C.-L.; Hou, C.-J.; Huo, D.-Q. Enhanced Room-Temperature Phosphorescence of Mn-Doped ZnS Quantum Dots Composited with PDDA for Detection of Adriamycin. J. Nanosci. Nanotechnol. 2018, 18, 2993–2999. [Google Scholar] [CrossRef]
  46. Yu, J.-C.; Chen, Y.-L.; Zhang, Y.-Q.; Yao, X.-K.; Qian, C.-G.; Huang, J.; Zhu, S.; Jiang, X.-Q.; Shen, Q.-D.; Gu, Z. pH-Responsive and near-infrared-emissive polymer nanoparticles for simultaneous delivery, release, and fluorescence tracking of doxorubicin in vivo. Chem. Commun. 2014, 50, 4699–4702. [Google Scholar] [CrossRef]
  47. Jiang, X.; Feng, D.-Q.; Liu, G.; Fan, D.; Wang, W. A fluorescent switch sensor for detection of anticancer drug and ctDNA based on the glutathione stabilized gold nanoclusters. Sens. Actuators B Chem. 2016, 232, 276–282. [Google Scholar] [CrossRef]
  48. Chen, C.; Li, C.; Shi, Z. Current Advances in Lanthanide-Doped Upconversion Nanostructures for Detection and Bioapplication. Adv. Sci. 2016, 3, 1600029. [Google Scholar] [CrossRef] [Green Version]
  49. Liu, Q.; Feng, W.; Li, F. Water-soluble lanthanide upconversion nanophosphors: Synthesis and bioimaging applications in vivo. Coord. Chem. Rev. 2014, 273–274, 100–110. [Google Scholar] [CrossRef]
  50. Ang, L.Y.; Lim, M.E.; Ong, L.C.; Zhang, Y. Applications of upconversion nanoparticles in imaging, detection and therapy. Nanomedicine 2011, 6, 1273–1288. [Google Scholar] [CrossRef]
  51. Wang, F.; Banerjee, D.; Liu, Y.; Chen, X.; Liu, X. Upconversion nanoparticles in biological labeling, imaging, and therapy. Analyst 2010, 135, 1839–1854. [Google Scholar] [CrossRef] [PubMed]
  52. Xie, X.; Li, Z.; Zhang, Y.; Guo, S.; Pendharkar, A.I.; Lu, M.; Huang, L.; Huang, W.; Han, G. Emerging ≈ 800 nm Excited Lanthanide-Doped Upconversion Nanoparticles. Small 2017, 13, 1602843. [Google Scholar] [CrossRef] [PubMed]
  53. Xie, X.; Gao, N.; Deng, R.; Sun, Q.; Xu, Q.-H.; Liu, X. Mechanistic Investigation of Photon Upconversion in Nd3+-Sensitized Core–Shell Nanoparticles. J. Am. Chem. Soc. 2013, 135, 12608–12611. [Google Scholar] [CrossRef]
  54. Xie, X.; Liu, X. Upconversion goes broadband. Nat. Mater. 2012, 11, 842. [Google Scholar] [CrossRef] [PubMed]
  55. Wang, Y.-F.; Liu, G.-Y.; Sun, L.-D.; Xiao, J.-W.; Zhou, J.-C.; Yan, C.-H. Nd3+-Sensitized Upconversion Nanophosphors: Efficient In Vivo Bioimaging Probes with Minimized Heating Effect. ACS Nano 2013, 7, 7200–7206. [Google Scholar] [CrossRef]
  56. Wang, F.; Deng, R.; Liu, X. Preparation of core-shell NaGdF4 nanoparticles doped with luminescent lanthanide ions to be used as upconversion-based probes. Nat. Protoc. 2014, 9, 1634. [Google Scholar] [CrossRef]
  57. Cao, T.; Yang, T.; Gao, Y.; Yang, Y.; Hu, H.; Li, F. Water-soluble NaYF4:Yb/Er upconversion nanophosphors: Synthesis, characteristics and application in bioimaging. Inorg. Chem. Commun. 2010, 13, 392–394. [Google Scholar] [CrossRef]
  58. Tong, L.; Li, X.; Hua, R.; Li, X.; Zheng, H.; Sun, J.; Zhang, J.; Cheng, L.; Chen, B. Comparative study on upconversion luminescence and temperature sensing of α- and β-NaYF4:Yb3+/Er3+ nano-/micro-crystals derived from a microwave-assisted hydrothermal route. J. Lumin. 2015, 167, 386–390. [Google Scholar] [CrossRef]
  59. Wang, F.; Liu, X. Upconversion Multicolor Fine-Tuning: Visible to Near-Infrared Emission from Lanthanide-Doped NaYF4 Nanoparticles. J. Am. Chem. Soc. 2008, 130, 5642–5643. [Google Scholar] [CrossRef]
  60. Ocak, I.; Kara, H.E.S. Phosphorescent detection of DNA- drug interaction based on emission quenching of ZnS quantum dots via photoinduced electron transfer. J. Lumin. 2018, 197, 112–118. [Google Scholar] [CrossRef]
  61. Bogdan, N.; Vetrone, F.; Ozin, G.A.; Capobianco, J.A. Synthesis of Ligand-Free Colloidally Stable Water Dispersible Brightly Luminescent Lanthanide-Doped Upconverting Nanoparticles. Nano Lett. 2011, 11, 835–840. [Google Scholar] [CrossRef]
  62. Yordanov, G.; Skrobanska, R.; Evangelatov, A. Entrapment of epirubicin in poly(butyl cyanoacrylate) colloidal nanospheres by nanoprecipitation: Formulation development and in vitro studies on cancer cell lines. Colloids Surf. B Biointerfaces 2012, 92, 98–105. [Google Scholar] [CrossRef]
  63. Kay, C.D.; Mazza, G.; Holub, B.J.; Wang, J. Anthocyanin metabolites in human urine and serum. Br. J. Nutr. 2007, 91, 933–942. [Google Scholar] [CrossRef] [Green Version]
  64. Chen, F.; Chen, H.; Duan, X.; Jia, J.; Kong, J. Molecularly imprinted polymers synthesized using reduction-cleavable hyperbranched polymers for doxorubicin hydrochloride with enhanced loading properties and controlled release. J. Mater. Sci. 2016, 51, 9367–9383. [Google Scholar] [CrossRef]
Figure 1. Schematic representation of the design principle of the Nd3+-upconversion nanoparticles (UCNPs) for epirubicin (EPI) detection. Water-dispersible UCNPs are obtained by removing hydrophobic oleate ligands from the surface of oleic acid coated UCNPs through acid treatment. When EPI is introduced, the UCNPs will attract EPI by electrostatic interactions. The green upconversion emission of the UCNPs is quenched due to the fluorescence resonance energy transfer (FRET) process between EPI and the UCNPS.
Nanomaterials 09 01700 g001
Figure 2. TEM images of (a) oleic acid (OA)-coated core UCNPs; (b) OA-coated core@shell UCNPs; (c) ligand-free core@shell UCNPs; (d) selected area electron diffraction (SAED) pattern of ligand-free core@shell UCNPs.
Nanomaterials 09 01700 g002
Figure 3. X-ray diffraction pattern of ligand-free core@shell UCNPs. The standard pattern of β-NaYF4 (JCPDS no. 16-0334) is also shown.
Nanomaterials 09 01700 g003
Figure 4. The emission spectrum of Nd3+-UCNPs without (green line) and with EPI (green dashed line), and the UV absorption of EPI at pH = 7.4 (red line).
Nanomaterials 09 01700 g004
Figure 5. (a) Quenching efficiency, ( I 0 I ) / I 0 , versus the concentration of Nd3+-UCNPs in phosphate buffered saline (PBS) ( I 0 and I are the upconversion fluorescence intensity of Nd3+-UCNPs monitored at 541 nm in the absence and presence of 26.73 μM EPI, respectively); (b) Time-dependent upconversion fluorescence response of Nd3+-UCNPs in PBS with the addition of 26.73 μM EPI.
Nanomaterials 09 01700 g005
Figure 6. (a) The emission spectra of Nd3+-UCNPs after the addition of various concentrations of EPI, a–l: 0, 0.09, 0.17, 0.86, 1.72, 6.90, 12.07, 17.24, 51.73, 120.69, 189.66, and 258.63 μM in PBS; (b) Normalized fluorescence intensity, I0/I, plotted against EPI concentration (0.09–258.63 μM).
Nanomaterials 09 01700 g006
Figure 7. The relative fluorescence quenching efficiency of the detection system in the presence of other interfering molecules and ions in coexistence with EPI. I 0 represents the fluorescence intensity of Nd3+-UCNPs while I denotes the fluorescence intensity of Nd3+-UCNPs with the addition of EPI and other interfering species.
Nanomaterials 09 01700 g007
Table 1. Comparison of previous methods for EPI analysis. LOD, limit of detection; HPLC/UV, high performance liquid chromatography coupled with ultraviolet; HPLC/MS/MS, high performance liquid chromatography coupled with mass spectrometry; CE/LIF, capillary electrophoresis coupled with laser induced fluorescence; UCNP, upconversion nanoparticle.
MethodsLOD (μM)Linear Range (μM)Refs.
HPLC/Fluorometry0.001290.0043–4.311[13]
HPLC/UV0.050.172–86.2[16]
HPLC/MS/MS0.000170.00034–0.0069[20]
CE/LIF0.0170.086–0.862[22]
Electrochemical/bare electrode0.1260.86–70.0[29]
Electrochemical/nanoparticles0.010.04–450[31]
Electrochemical/carbon nanotube0.020.05–10[28]
Electrochemical/DNA0.040.07–21[30]
Fluorescence/Nd3+-UCNPs0.050.09–189.66This work
Table 2. Recovery experiments of EPI in urine samples.
SampleAdded (μM)Found (μM)Recovery (%, n = 5)RSD (%, n = 5)
Urine 154.998.24.7
Urine 21010.3102.56.1
Urine 32023.297.55.8

