Article

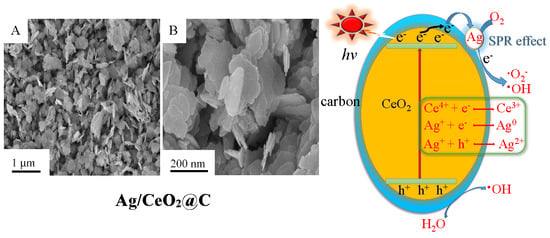
Enhanced Visible-Light Photocatalytic Activity of Ag QDs Anchored on CeO2 Nanosheets with a Carbon Coating

1
Research Center for Eco-Environmental Engineering, Dongguan University of Technology, Dongguan 523808, China
2
College of Chemistry and Chemical Engineering, Neijiang Normal University, Neijiang 641100, China
3
Key Laboratory of Comprehensive and Highly Efficient Utilization of Salt Lake Resources, Key Laboratory of Salt Lake Resources Chemistry of Qinghai Province, Qinghai Institute of Salt Lakes, Chinese Academy of Sciences, Xining 810008, China
4
State Key Laboratory of Water Environment Simulation, School of Environment, Beijing Normal University, Beijing 100875, China
*
Authors to whom correspondence should be addressed.
Nanomaterials 2019, 9(11), 1643; https://doi.org/10.3390/nano9111643
Submission received: 1 October 2019 / Revised: 11 November 2019 / Accepted: 13 November 2019 / Published: 19 November 2019
(This article belongs to the Special Issue Photocatalytic Nanomaterials)

Abstract

:
Ag quantum dots (QDs) anchored on CeO2 nanosheets with a carbon coating (Ag/CeO2@C) (composites) were prepared via an in situ reduction approach for the photocatalytic degradation of Cr(VI) and tetracycline hydrochloride (TCH) in the visible-light region. The photocatalytic activity of Ag/CeO2@C was greatly affected by carbon content, Ag-doping content, Cr(VI) concentration, pH value, and inorganic ions. Enhanced photocatalytic activity was obtained by Ag/CeO2@C (compared to CeO2 and CeO2@C), of which 3-Ag/CeO2@C-2 with an Ag-doping content of 5.41% presented the best removal efficiency and the most superior stability after five cycles. ·O2 and ·OH radicals were crucial for the photocatalytic capacity of 3-Ag/CeO2@C-2. The combined effect of the surface plasma resonance (SPR) of Ag QDs, an electron trapper of carbon shells, and the redox activity of the Ce(III)/Ce(IV) coupling induced efficient charge transfer and separation, suppressing the recombination of electron–hole pairs.

Graphical Abstract

1. Introduction

The wide-ranging use of antibiotics, dyes, and heavy metals and their reckless release in water has drawn intensive attention due to their toxicity and non-biodegradability [1,2,3]. In recent years, many strategies, such as electrochemical oxidation [4], coagulation and flocculation [5], adsorption [6], membrane filtration [7], and advanced oxidation [8], have been applied for water purification. Photocatalysis, a typical advanced oxidation technique, has become the route with the most potential to conquer these intensifying environmental problems via the utilization of solar light [9,10,11]. Hence, various semiconductors, such as g-C3N4, TiO2, ZnS, ZnO, CuS, and MoS2, have been confirmed as cost-effective photocatalysts for the heterogeneous photocatalytic purification of polluted water [12,13,14,15,16,17]. Due to their wide band gap, nontoxicity, and high stability, cerium dioxide (CeO2) and TiO2 have been widely applied in photocatalytic reactions [18,19,20]. In addition, CeO2 exhibits strong UV-light sorption capacity and a high resistance to photocorrosion [21].
The adsorption and desorption capacities of oxygen ions are critical for the catalytic process of CeO2. The oxygen storage capacity of CeO2 is greatly affected by the redox activity of the Ce(III)/Ce(IV) coupling, further depending on the type and content of oxygen vacancies in the lattice structure [22]. The defect structure of Ce3+–Ov–Ce4+ (Ov- oxygen vacancy) and the formation of Ce3+ ions induce a red shift in the band gap of CeO2 [23]. In fact, the crystal defect of CeO2 is greatly related to its crystal structure and morphologies. Various microstructures of CeO2 have been fabricated for practical applications via different approaches in previous works, including bowknot-like crystallites, nanocubes, X-architecture, nanopolyhedra, square-like nanoparticles, nanosheets, nano-octahedrons, ribbon-like nanofibers, urchin-like hierarchical structures, flower-like microspheres, and well-aligned nanorod arrays [24,25,26,27,28,29,30,31,32,33]. Unfortunately, CeO2 with indirect band gap energy (3.2 eV) is strictly limited in the photocatalytic system of the UV-light region. Hence, nonmetal or metal ions such as S, N, P, Er, Fe, Sm, and Y have been doped in CeO2 to extend light harvesting to the visible-light region, leading to enhanced photocatalytic activity [34,35,36,37,38,39,40]. Apart from a doping strategy, noble metals such as Au and Ag loaded on CeO2 have been confirmed to present much better photocatalytic activity [41]. In addition, the fabrication of heterojunctions coupled with other semiconductors can simultaneously enhance the separation efficiency of charge carriers and restrain the recombination rate of photoexcited electron–hole pairs through the interface structure of different semiconductors, especially core–shell structures [42,43,44]. To further avoid photocorrosion in solar energy-driven reaction systems, carbon has been employed for the synthesis of heterojunction composites due to its unique physicochemical properties and low cost [45,46,47,48]. Carbon with a porosity structure and a high surface area not only exhibits excellent affinity for pollutant molecules, but also efficiently captures and transfers the photoexcited electron, leading to an enhancement in photocatalytic activity [49,50]. However, the combined effect of Ag doping and carbon coating on the enhanced photocatalytic capacity of CeO2 nanosheets has been scarcely reported in previous works.
This work focused on the effect of Ag quantum dots (QDs) on the photocatalytic activity of carbon-coated CeO2 (CeO2@C) nanosheets in the visible-light region. In this strategy, Ag QDs were anchored in situ on CeO2@C nanosheets to form Ag/CeO2@C. The photocatalytic capacity of Ag/CeO2@C was affected by the carbon dosage, the Ag-doping content, the Cr(VI) concentration, the pH value, and inorganic ions. The combined effects of the surface plasma resonance (SPR) of Ag QDs, an electron trapper of carbon shells, and the redox activity of the Ce(III)/Ce(IV) coupling were responsible for enhanced visible-light harvesting and efficient charge transfer and separation, leading to excellent photocatalytic activity in the CeO2 nanosheets [39,41,45,51,52]. The possible photocatalytic mechanism of Ag/CeO2@C is discussed in detail.

2. Materials and Methods

2.1. Preparation of Catalysts

CeO2 nanosheets were prepared via a hydrothermal route. Briefly, 1.0 mmol of cerium nitrate hexahydrate (Ce(NO3)3·6H2O) and 2 mmol of hexamethylenetetramine (C6H12N4) were dissolved in 70 mL of deionized water through vigorous stirring. Then, 3 mL of acetic acid (CH3COOH) was added to the above solution and stirred at room temperature for 2 h. This mixture was transferred to a 100 mL Teflon-lined autoclave and treated at 433 K for 9 h. After being cooled down to room temperature, the suspension was filtered, washed with ethanol and deionized water, dried at 333 K for 6 h, and calcined at 773 K for 3.0 h to obtain CeO2 nanosheets.
Carbon-coated CeO2 (CeO2@C) nanosheets were also synthesized through a hydrothermal route. Here, 0.1 g obtained CeO2 bulks, 0.2 g glucose (C6H12O6), and 1.0 g polyvinyl pyrrolidone (PVP, M = 58,000) were dispersed into 30 mL of deionized water through intensive stirring at room temperature for 2.0 h and then treated at 453 K for 15.0 h in a 50 mL Teflon-lined autoclave. After being cooled down to room temperature, the above suspension was centrifuged, washed, dried at 343 K for 5.0 h, and calcined at 773 K for 2.0 h in an N2 flow rate of 40 mL·min−1 to obtain CeO2@C nanosheets (called CeO2@C-1). With the above process, CeO2@C composites with varying carbon contents were obtained with different mass ratios of CeO2/glucose. CeO2@C-2 and CeO2@C-3 were obtained via the addition of glucose contents of 0.4 g and 0.6 g, respectively.
Ag QDs anchored in CeO2@C (Ag/CeO2@C) nanosheets were reduced in situ with the addition of sodium borohydride (NaBH4). In a typical process, 0.1 g CeO2@C bulks and 0.02 g AgNO3 were dispersed into 50 mL deionized water and then stirred at room temperature for 2.0 h. NaBH4 bulks of 0.05 g were added to the above solution through serious stirring at room temperature for 1.0 h. After the suspension was filtered, washed, and dried at 333 K for 6.0 h, Ag/CeO2@C nanosheets were obtained and called 1-Ag/CeO2@C. X-Ag/CeO2@C (X = 2, 3, and 4) nanosheets were respectively obtained via the addition of 0.03 g, 0.04 g, and 0.05 g AgNO3 in accordance with the above process.

2.2. Characterization of Catalysts

CeO2-based nanosheets were evaluated by X-ray diffraction (XRD, Bruker D8, Karlsruhe, Germany), inductively coupled plasma optical emission spectrometry (ICP-OES, Varian 710-ES, PaloAlto, CA, USA), X-ray photoelectron spectroscopy (XPS, Escalab 250, Waltham, MA, USA), physical adsorption (Quantochrome NOVA-2020, Boynton Beach, FL, USA), scanning electron microscopy (SEM, Hitachi S-3400, Tokyo, Japan), transmission electron microscopy (TEM, JEM-2010, Tokyo, Japan), high-resolution transmission electron microscopy (HRTEM, JEM-2100, Tokyo, Japan), Fourier-transform infrared spectra (FT-IR, Bruke Tensor 27, Karlsruhe, Germany), and UV–Vis diffuse reflectance spectra (UV-Vis DRS, Hitachi U-4100, Tokyo, Japan) (with BaSO4 as the reflectance standard and an integrated sphere attachment, Photoluminescence (PL, FLSP 920, Edinburgh, UK), with an excitation wavelength of 325 nm at room temperature and electron spin resonance (ESR, JES-FA200, Tokyo, Japan) with 5,5-Dimethyl-1-pyrroline N-oxide (DMPO) as spin trapping agent. In addition, photocurrents, Mott–Schottky curves, and the electrochemical impedance spectroscopy (EIS) of CeO2-based composites were evaluated in a three-electrode electrochemical workstation, which consisted of Pt film, KCl-saturated calomel, and FTO conductive glass (coated with 1 cm2 of CeO2-based composite films) serving as electrodes and 0.2 mol L−1 Na2SO4 serving as an electrolyte. The photoelectrochemical properties of CeO2-based composites were analyzed on a photoelectric instrument (CEL-PECX2000, Beijing CEL Tech. Co., Ltd., Beijing, China) equipped with a Vertex. C. EIS electrochemistry workstation (Ivium Technologies B.V., Eindhoven, Netherlands) and a visible-light source (an Xe lamp) at room temperature.

2.3. Photocatalytic Activity

CeO2-based composites were applied for the visible-light-driven photodegradation of Cr(VI) ions and tetracycline hydrochloride using an Xe lamp as a light source (300 W). In a typical process, 0.1 g CeO2-based bulks was dispersed into 100 mL of a potassium dichromate (K2CrO4) solution of 20 mg·L−1 (or a tetracycline hydrochloride solution of 20 mg·L−1) and stirred in a dark room to reach an adsorption–desorption equilibrium. After irradiation at certain time intervals, the concentration of Cr(VI) was analyzed using a UNICO UV-4802 UV-Vis spectrophotometer, and the content of tetracycline hydrochloride was obtained by an Agilent 1100 with a 5-μm, 4.6 × 250 mm Venusil HILIC column and an ultraviolet detector of 356 nm. The intermediate products of Cr(VI) ions and tetracycline hydrochloride were detected by an ICP-OES (Varian 710-ES) and a UPLC-MS system (Waters UPLC Acquity, Quattro Premier XE), respectively. The effects of carbon content, Ag content, solution concentration, pH value, and inorganic ions on the photocatalytic activity of CeO2-based composites were investigated using the above process. The photocatalytic durability of the obtained samples was also obtained under the same conditions.

3. Results

The typical peaks of CeO2 phases appeared at 28.57°, 33.08°, 47.47°, 56.42°, 59.18°, 69.42°, 76.95°, and 79.15° in XRD patterns of CeO2, CeO2@C, and Ag/CeO2@C (Figure S1 and Figure 1). These peaks were assigned to the (111), (200), (220), (311), (222), (400), (311), and (420) facets of cubic CeO2 phases (JCPDS No. 34-0394), respectively [20,23,25]. The peaks of Ag/CeO2@C at 38.10°, 44.32°, and 64.49° were ascribed to the (110), (200), and (220) planes of face-centered cubic Ag phases (JCPDS No. 04-0783) [22,23,41]. The diffraction peaks of carbon phases were not detected in the XRD patterns of CeO2@C and Ag/CeO2@C because they had less carbon content (<5%) and weak amorphous carbon intensity [6,53,54]. With an increase in Ag content, the diffraction peak intensities of Ag (110) and CeO2 (111) (Figure 1) respectively increased at around 38.10° and 28.57°, indicating the high crystallinity of Ag/CeO2@C.
XPS was applied to investigate the surface compositions and chemical states of the obtained CeO2 composites. The Ce 3d spectrum (Figure 2A, Figures S2A and S3A) was split into eight Gaussian peaks. The peaks at 900.7 eV (U) and 882.5 eV (V) were respectively assigned to Ce 3d3/2 and Ce 3d5/2, indicating the formation of Ce3+ and Ce4+ [20,21]. The peaks at 902.9 eV (U′) and 884.9 eV (V′) were ascribed to Ce3+ [23]. The peaks at 916.6 eV (U‴), 907.7 eV (U″), 898.2 eV (V‴), and 888.6 eV (V″) were indexed to Ce4+ [20]. The relative content of Ce3+ could be calculated by the following equation (listed in Table S1):
Ce3+ = Ce3+/(Ce3+ + Ce4+) = area (U′ and V′)/Total area.
The surface atomic compositions of these samples were nonstoichiometric values compared to the theoretical values due to the presence of a Ce3+ state (Table S1). The Ce3+ concentrations of CeO2, CeO2@C-2, and 3-Ag/CeO2@C-2 were, respectively, 12.15%, 14.45%, and 16.54%. The charge compensation may have been responsible for the increase in Ce3+ content of CeO2@C-2 and 3-Ag/CeO2@C-2. It was noticed that the Ce3+ content (5.81%) of used 3-Ag/CeO2@C-2 after five cycles was lower than that of a fresh sample. This was attributed to the reduced charge compensation under long-term irradiation, leading to inferior photocatalytic stability [15]. The divided Gaussian peaks at 531.2 eV and 529.6 eV (Figure 2B, Figures S2B and S3B ) were attributed to the defect oxygen (or oxygen vacancy) and lattice oxygen, respectively [15,20,31]. The varied ratios of defect oxygen (or oxygen vacancy) to lattice oxygen were greatly related to the Ce3+ content in the as-obtained samples. The concentration of the defect oxygen (or oxygen vacancy) in the O 1s XPS spectrum of the used 3-Ag/CeO2@C-2 (Figure 2B) was higher than that of a fresh sample. This was due to the released and adsorbed oxygen of CeO2 and the defect structure of Ce3+–Ov–Ce4+ (Ov- oxygen vacancy) under reduction and oxidation conditions [38,42]. The C1 spectra of CeO2@C-2 (Figure 3C) and fresh and used 3-Ag/CeO2@C-2 (Figure 2C) were divided into three Gaussian peaks at 288.4 eV, 285.3 eV, and 284.8 eV, which respectively belonged to C=O, C–OH, and C–C/C=C bonds. The splitting peaks at 374.2 eV and 368.19 eV in the Ag 3d XPS spectrum of fresh and used 3-Ag/CeO2@C-2 (Figure 2D) were assigned to Ag 3d3/2 and Ag 3d5/2, respectively. Although there was no change in the microstructure of used 3-Ag/CeO2@C-2 (Figure S4), long-term irradiation induced a difference in the C 1s and Ag 3d XPS spectra between the fresh and used samples (Figure 3C,D), leading to inferior charge transfer and separation [45,47].
The detailed microstructure and surface morphology of CeO2, CeO2@C, and Ag/CeO2@C were obtained by SEM and TEM. All of these samples were irregular nanosheets with thicknesses ranging from 10 nm to 20 nm (Figures S4 and S5, and Figure 3A,B). Compared to the CeO2 precursor (Figure S5A,B), there were many more fragments detected in the CeO2 after it was treated at high temperature (Figure S5C,D). With the assistance of carbon coating, fewer fragments and agglomerated nanosheets were detected in CeO2@C (Figure S5E–G) and Ag/CeO2@C (Figure S6), which was further confirmed by the TEM images (Figure S7). With an increase in carbon content, the agglomeration of CeO2@C gradually disappeared and even formed single nanosheets, while the specific surface area of CeO2@C decreased (Table S2). Although the nanosheet structure of Ag/CeO2@C was not affected by the Ag doping, the fragment content increased with increasing Ag-doped content due to the damage effect of NaBH4 during the in situ reduction process (Figure S6). In addition, the specific surface area of Ag-doped CeO2@C-2 deceased with increasing Ag-doped content (Table S2). As is shown in Figure 3, 3-Ag/CeO2@C-2 had irregular and fragmented nanosheets (Figure 3A,B), and ultrafine Ag nanoparticles with a diameter of around 3 nm (dark section in the red circle) were anchored on the CeO2@C-2 (Figure 3C,D and Figure S7E,F), which was evidenced by the HRTEM images (Figure 3E,F). The spacing distances between neighboring lattice fringes of the (111) plane of cubic CeO2 and the (111) facet of cubic Ag (Figure 3E,F) were, respectively, 0.312 nm and 0.24 nm, which agreed with the XRD pattern of 3-Ag/CeO2@C-2. The elemental distribution of 3-Ag/CeO2@C-2 was further obtained by the elemental mapping images. As is shown in Figure 3G–J, there were Ce, O, C, and Ag elements existing in the obtained sample and discontinuous and monodisperse distributions of Ag elements on the bulk surface, indicating the formation of Ag QDs anchored in CeO2@C nanosheets.
The molecular structures of the obtained CeO2, CeO2@C, and Ag/CeO2@C were obtained by FT-IR, as shown in Figures S8 and S9. The peaks at 3440 and 1640 cm−1 were ascribed to the stretching vibration and bending vibration of the O–H group of absorbed water and surface hydroxyl [9,11]. The peak at 1539 cm−1 was attributed to the H–O–H bending vibration of water molecules. The band peaks around 2921 cm−1, 2847 cm−1, and 1377 cm−1 were due to the bending vibration of the C–H group. The peaks at 2362 cm−1 and 2340 cm−1 could be assigned to the stretching vibrations of C=O groups of adsorbed CO2 in the air. The peaks at 676 cm−1, 567 cm−1, and 475 cm−1 were attributed to the vibration of metal oxygen bonds [41]. The optical properties of CeO2, CeO2@C-2, and 3-Ag/CeO2@C-2 were obtained by UV-Vis DRS, as shown in Figure 4. Compared to CeO2 and CeO2@C-2, 3-Ag/CeO2@C-2 exhibited strong visible-light-harvesting capacity due to the SPR effect of Ag QDs [18,22,23]. According to the plot of (αhv)1/2 versus (hv), the calculated band gap energy of 3-Ag/CeO2@C-2 (2.47 eV) was lower than those of CeO2 (2.61 eV) and CeO2@C-2 (2.86 eV). The photoluminescence (PL) spectra (Figure 5) indicated that the PL peak intensity of 3-Ag/CeO2@C-2 was also weaker than those of CeO2 and CeO2@C-2 after an excitation at a 300-nm wavelength [25]. On the basis of the standard quantum efficiency of 100% formed from the absorbance at the excitation wavelength and the photoluminescence intensity, the estimated fluorescence efficiency of 3-Ag/CeO2@C-2 (13.21%) was higher than those of CeO2 (5.72%) and CeO2@C-2 (8.36%), meaning a lower recombination of charge carriers over 3-Ag/CeO2@C-2. The broad emission band around 350–550 nm was responsible for Ce3+ ions and oxide defects in CeO2. In addition, the combined effect of carbon coating and Ag QD-doping was helpful for efficient charge transfer and high resistance to the recombination of electron–hole pairs [41,45].
The separation efficiency of photocatalytic electron–hole pairs was evaluated by electrochemical impedance spectroscopy (EIS), in which the arc radius represented the transfer rate of the photocatalyst charge. In contrast to CeO2 and CeO2@C-2, 3-Ag/CeO2@C-2 exhibited a higher transient photocurrent under visible-light irradiation (Figure 6A) and a smaller arc radius of electrochemical impedance (Figure 6B). The small radius of 3-Ag/CeO2@C-2 suggested that the low resistance was suitable for the efficient separation of charge carriers in the obtained 3-Ag/CeO2@C-2 photocatalyst. Although a large specific surface area is favorable in reducing the diffusion length of charge carriers and further prompting charge transfer, the SPR effect of Ag QDs and a tight interface between carbon and CeO2 nanosheets are crucial for the enhanced separation of charge carriers and the restrained recombination of photoexcited electron–hole pairs [47,48]. Mott–Schottky curves of the obtained CeO2, CeO2@C-2, and 3-Ag/CeO2@C-2 were performed for an evaluation of the semiconductor type and flat band potentials (Vfb), where the Vfb values of these samples could be obtained from the x intercept by prolonging the linear part of the Mott–Schottky curves on the potential axis (Figure S10A). The Vfb values of CeO2, CeO2@C-2, and 3-Ag/CeO2@C-2 were −0.83 V, −0.65 V, and −0.58 V versus a KCl-saturated calomel electrode, respectively. Hence, the valence band values of CeO2, CeO2@C-2, and 3-Ag/CeO2@C-2 were −0.59 V, −0.41 V, and −0.34 V, respectively. According to the calculated band gap energy, the conduction band values of CeO2, CeO2@C-2, and 3-Ag/CeO2@C-2 were 2.27 V, 2.20 V, and 2.13 V, respectively. Compared to 3-Ag/CeO2@C-2 alone with a bias voltage of 1.0 V, the addition of visible-light irradiation with a light-power intensity of 240 mW cm−2 (λ > 420 nm) could enhance the current response (Figure S10B), indicating efficient photoinduced charge in the visible light region.
CeO2-based composites were performed for the visible-light-driven photocatalytic reduction of Cr(VI) ions and the photodegradation of tetracycline hydrochloride (TCH). Compared to CeO2 nanosheets, carbon-coated composites exhibited better adsorption–photocatalytic activity under the same conditions, especially CeO2@C-2 (Figure S11). The enhanced adsorption–photocatalysis behaviors of CeO2@C were due to sufficient active sites of carbon shells and the oxygen vacancy of CeO2 cores. In addition, this was ascribed to the trap effect of carbon shells for enhanced charge transfer and efficient charge carrier separation [9,49,50]. With the assistance of carbon shells, the excited electrons could efficiently escape from the conduction band (CB) of CeO2 to amorphous carbon, achieving the separation of electron–hole pairs and restraining their recombination. The SPR effect of Ag QDs could further strengthen the photocatalytic activity of CeO2@C-2 (Figure 7A). The photocatalytic activity of Ag/CeO2@C-2 for Cr(VI) removal increased and then decreased with an increase in Ag-doping content. In addition, Ag/CeO2@C-2 composites also exhibited excellent photocatalytic activity for the visible-light-driven photodegradation of TCH compared to CeO2@C-2, as shown in Figure S12. A similar tendency in the effects of Ag-doping content on photocatalytic activity was obtained for the removal of TCH in the visible-light region. Among these Ag QDs doped composites, CeO2@C-2 and 3-Ag/CeO2@C-2 with an Ag-doping content of 5.41% presented the best photocatalytic activity. Due to the limited active sites, an excess of Cr(VI) ions could not efficiently access the active sites, leading to inferior photocatalytic efficiency. Hence, the removal efficiency of 3-Ag/CeO2@C-2 decreased with increasing concentrations of Cr(VI) ions (ranging from 10 mg L−1 to 40 mg·L−1 (Figure 7B)). The optimum pH value facilitated the reaction between hydroxyl (OH) (or H+) ions and radical species (such as e and h+) to generate ·O2 and ·OH radicals [20,47]. In a photocatalytic reaction system, H+ ions can react with ·O2 to form ·OOH radicals, and ·OOH can react with H+ ions to generate H2O2 [3]. Subsequently, H2O2 is likely to react with e to form ·OH and OH, of which OH ions are scavenged by h+ to produce ·OH [9]. In addition, ·OH is also generated from the reaction between H2O and h+ [15]. An excess of OH ions can quench the above chain reactions, leading to inferior photocatalytic activity (Figure 7C).
Inorganic ions such as chlorine (Cl), sulfite (SO32−), sulfate (SO42−), and phosphate (H2PO4) could affect the photocatalytic activity of 3-Ag/CeO2@C-2 in Cr(VI) removal. As is shown in Figure 7D, inorganic ions could restrain photocatalytic activity compared to 3-Ag/CeO2@C-2 alone in Cr(VI) removal under the same conditions. The removal efficiency of Cr(VI) was remarkably inhibited by H2PO4 in comparison to Cl, SO42−, and SO32−. The impeding effect of inorganic ions was due to ·OH scavengers and reduced active sites [9,10]. On the one hand, inorganic ions served as ·OH scavengers and competed with Cr(VI) ions for ·OH radicals. Although the ion radicals were suitable for the oxidizing pollutants, their low oxidoreductive potential induced inferior photocatalytic rates compared to ·OH, especially in acidic conditions [13]. On the other hand, inorganic ions could adsorb on the surface of 3-Ag/CeO2@C-2, leading to decreased surface-active sites for Cr(VI) ions. As is shown in Figure 8, the photocatalytic activity of 3-Ag/CeO2@C-2 remained slightly changed after five cycles. However, the mass loss of 3-Ag/CeO2@C-2 in the sedimentation and transferring processes induced a decrease in photocatalytic activity in each cycle test. SEM images (Figure S4) confirmed that the structure of the used 3-Ag/CeO2@C-2 remained unchanged after five cycles of photocatalytic reactions. However, the surface compositions and chemical states of the used 3-Ag/CeO2@C-2 (Figure 2) were different from the fresh composites due to long-term photocorrosion.
As is shown in Figure 9, ESR signals of photoinduced radicals such as ·OH and ·O2 were clearly obtained, in which the intensities increased with an increase in the irradiation time of visible light. Quenching testing (Figure S13) indicated that the photocatalytic reaction was suppressed by tert-butyl alcohol (t-BuOH), benzoquinone (BQ), and ethylenediaminetetraacetic acid disodium salt (EDTA-2Na), especially p-BQ and t-BuOH. It was concluded that the ·OH and ·O2 radicals were vital for the photocatalytic activity of 3-Ag/CeO2@C-2. The enhanced photocatalytic capacity was due to the SPR effect of Ag QDs, an electron trapper of carbon shells, and the redox activity of the Ce(III)/Ce(IV) coupling. In other words, the photocatalytic activity was related to the amount of Ag+ serving as an electron acceptor (Ag2+ ↔ Ag0) and/or a hole donor (Ag2+ ↔ Ag +) and the concentration of Ce3+ and oxygen vacancies, which could promote the localization of charge carriers and prolong the separation of electron–hole pairs via trapping at energy levels close to the valance band or conduction band [13]. Previous work has suggested that the temperature-programmed reduction (TPR) of peaks belonging to the conversion of Ag2+ and Ag+ into Ag0 is obtained at 405 K and 421 K, respectively [55]. Hence, a reaction between e/h+ pairs and Ag0/Ag+/Ag2+ ions is likely to promote the photoreduction of Cr(VI) ions. The possible photocatalytic mechanism of the 3-Ag/CeO2@C-2 heterojunction is proposed in Figure 10. Under visible-light irradiation, the photoexcited electrons from the valance band (O2p, VB = −0.56 eV) to the conduction band (Ce4f, CB = 2.30 eV) of CeO2 were trapped by carbon shells and then transferred to Ag QDs (Equation (1)). The SPR effect of Ag QDs could strengthen the amount of photoexcited electron–hole pairs. The photogenerated electrons were scavenged by O2 molecules (EO2/O·2 = −0.33 eV/NHE, normal hydrogen electrode) in the atmosphere and in the water solution to yield ·O2 and •OH radicals (Equations (3)–(5)): meanwhile, h+ and ·O2 could react with H2O molecules to form an ·OH radical (EH2O, OH/•OH = 1.99 eV/NHE) (Equations (6) and (7)) [56,57]. In addition, OH− ions were adsorbed on the h+ of the valance band to generate an ·OH radical. These radicals were responsible for the efficient photocatalytic reduction of Cr(VI) into Cr(III) ions (Equations (8)–(13)), which was confirmed by the Cr 2p XPS spectrum of the used 3-Ag/CeO2@C-2 after five cycles of photocatalytic reaction (Figure S14). The splitting peaks at 588.2 eV and 579.2 eV were indexed to Cr(VI), and the peaks at 586.2 eV and 576.4 eV were indexed to Cr(III), indicating a conversion of Cr(VI) ions into Cr(III) ions according to the electron transfer process [56]. Under acidic conditions, Cr(VI) ions could react with electrons and ·OH to generate Cr(III) ions (Equations (8)–(11)). Under alkaline conditions, low H+ ions could react with Cr(VI) ions to form Cr3+ ions (Equation (12)) and further generate Cr(OH)3 loaded on the surface of 3-Ag/CeO2@C-2 bulks (Equation (13)), leading to inferior light adsorption capacity [58,59,60]. In addition, TCH could react with ·OH and h+ to form small molecules, which was evaluated by UPLC–MS (Figure S15). Under visible-light irradiation, TCH molecules were degraded via N–C bond cleavage and hydroxylation, and then these intermediates could react with the ·OH radical to destroy C2–C3 double bonds and eliminate NH3: they subsequently disintegrated into small molecules and even H2O and CO2 through demethylation, deamination, and ·OH attack [55,56]. Ag QDs doping and carbon shells could serve as an interfacial charge transfer medium and a recombination center, accelerating the photocatalytic reaction:
Ag / CeO 2 @ C + hv h + + e
O 2 + e   · O 2
O 2 + e + H +   · OOH
· O 2   + · OOH + H + 2   · OH + O 2
H 2 O + h +   · OH + H +
· O 2   + 2 H 2 O + h + 4 · OH
14 H + + Cr 2 O 7 2 + 6 e 2 Cr 3 + + 7 H 2 O
7 H + + HCrO 4 + 3 e Cr 3 + + 4 H 2 O
· OH + HCrO 4 + 8 H + + 4 e Cr 3 + + 5 H 2 O
· OH + Cr 2 O 7 2 + 15 H + + 7 e 2 Cr 3 + + 8 H 2 O
8 H + + CrO 4 2 + 3 e Cr 3 + + 4 H 2 O
4 H 2 O + 2 CrO 4 2 + H + 2 Cr ( OH ) 3 + 3 OH

4. Conclusions

Ag/CeO2@C nanosheets presented better photocatalytic activity than did CeO2 and CeO2@C for Cr(VI) removal in the visible-light region. The photocatalytic activity of Ag/CeO2@C increased and then decreased with an increase in carbon content, Ag doping content, and pH value. Inorganic ions and Cr(VI) content had a negative effect on the removal efficiency of Cr(VI) under the same conditions. The best removal efficiency and the most superior photocatalytic stability after five cycles were achieved by 3-Ag/CeO2@C-2 in the visible-light-driven removal of Cr(VI) ions as well as TCH. The SPR effect of Ag QDs, an electron trapper of carbon shells, and the redox activity of the Ce(III)/Ce(IV) coupling played a vital role in the transfer and separation of charge carriers. •O2 and •OH radicals were the primary active species of 3-Ag/CeO2@C-2 in the photocatalytic system.

Supplementary Materials

The following are available online at https://www.mdpi.com/2079-4991/9/11/1643/s1: Figure S1: XRD patterns of CeO2 and CeO2@C; Figure S2: XPS spectra of CeO2; Figure S3: XPS spectra of CeO2@C-2; Figure S4: SEM images of used 3-Ag/CeO2@C-2; Figure S5: SEM images of CeO2 precursor (A,B), CeO2 (C,D), CeO2@C-1 (E,F), CeO2@C-2 (G,H), and CeO2@C-3 (I,J); Figure S6: SEM images of CeO2@C-2 (A,B), 1-Ag/CeO2@C-2 (C,D), 2-Ag/CeO2@C-2 (E,F), 3-Ag/CeO2@C-2 (G,H), and 4-Ag/CeO2@C-2 (I,J); Figure S7: TEM images of CeO2 (A,B), CeO2@C-2 (C,D), and 3-Ag/CeO2@C-2 (E,F); Figure S8: FT-IR spectra of CeO2 and CeO2@C composites; Figure S9: FT-IR spectra of CeO2@C-2 and Ag/CeO2@C-2 composites; Figure S10: Mott–Schottky curves of CeO2, CeO2@C-2, and 3-Ag/CeO2-2 (A) and U–I curves of 3-Ag/CeO2-2 (B); Figure S11: Effect of carbon content on the photocatalytic activity of CeO2@C composites in the removal of Cr(VI) in the visible-light region, (Cr(VI) content of 20 mg·L−1, catalyst dosage of 40 mg, solution volume of 100 mL, and optical power density of 600 mW·cm−2); Figure S12: Effect of Ag content on the photocatalytic activity of Ag/CeO2@C-2 composites in the removal of tetracycline hydrochloride in the visible-light region (tetracycline hydrochloride content of 30 mg·L−1, catalyst dosage of 40 mg, solution volume of 100 mL, and optical power density of 600 mW cm−2); Figure S13: Reactive species trapping experiments over Ag/CeO2@C-2; Figure S14: Cr 2p XPS spectrum of used Ag/CeO2@C-2 after five cycles; Figure S15: HPLC/MS spectrum of TCH over Ag/CeO2@C-2 in visible-light region; Table S1: Atomic ratio and Ce3+ ratio of CeO2-based samples; Table S2: Texture parameters of CeO2-based samples.

Author Contributions

conceptualization, writing—original draft preparation, X.Z.; validation and project administration, S.L. and X.L.; methodology, X.F.; investigation and data curation, Q.C.; resources and supervision, J.W.; writing—review and editing, J.W. and S.L.

Funding

This research was funded by the Sichuan Science and Technology Program, grant number 2018JY0451; the Education Department of Sichuan Province, grant numbers 17CZ0019 and 17ZA0218; and the Youth Innovation Promotion Association CAS, grant number 2019423.

Conflicts of Interest

The authors declare no conflict of interest.

References

  1. Maria Magdalane, C.; Kaviyarasu, K.; Judith Vijaya, J.; Siddhardha, B.; Jeyaraj, B.; Kennedy, J.; Maaza, M. Evaluation on the heterostructured CeO2/Y2O3 binary metal oxide nanocomposites for UV/Vis light induced photocatalytic degradation of Rhodamine-B dye for textile engineering application. J. Alloys Compd. 2017, 727, 1324–1337. [Google Scholar] [CrossRef]
  2. Tian, L.; Rui, Y.; Sun, K.; Cui, W.; An, W. Surface Decoration of ZnWO4 nanorods with Cu2O nanoparticles to build heterostructure with enhanced photocatalysis. Nanomaterials 2018, 8, 33. [Google Scholar] [CrossRef] [PubMed]
  3. Zheng, X.; Fu, W.; Kang, F.; Peng, H.; Wen, J. Enhanced photo-Fenton degradation of tetracycline using TiO2-coated α-Fe2O3 core–shell heterojunction. J. Ind. Eng. Chem. 2018, 68, 14–23. [Google Scholar] [CrossRef]
  4. Nidheesh, P.V.; Zhou, M.; Oturan, M.A. An overview on the removal of synthetic dyes from water by electrochemical advanced oxidation processes. Chemosphere 2019, 197, 210–227. [Google Scholar] [CrossRef] [PubMed]
  5. Wei, H.; Gao, B.; Ren, J.; Li, A.; Yang, H. Coagulation/flocculation in dewatering of sludge: A review. Water Res. 2018, 143, 608–631. [Google Scholar] [CrossRef] [PubMed]
  6. Zheng, X.; Huang, M.; You, Y.; Fu, X.; Liu, Y.; Wen, J. One-pot synthesis of sandwich-like MgO@Carbon with enhanced sorption capacity of organic dye. Chem. Eng. J. 2018, 334, 1399–1409. [Google Scholar] [CrossRef]
  7. Villeneuve, W.; Perreault, V.; Chevallier, P.; Mikhaylin, S.; Bazinet, L. Use of cation-coated filtration membranes for demineralization by electrodialysis. Sep. Purif. Technol. 2019, 218, 70–80. [Google Scholar] [CrossRef]
  8. Sivagami, K.; Sakthivel, K.P.; Nambi, I.M. Advanced oxidation processes for the treatment of tannery wastewater. J. Environ. Chem. Eng. 2018, 6, 3656–3663. [Google Scholar] [CrossRef]
  9. Zheng, X.; Wang, K.; Huang, Z.; Liu, Y.; Wen, J.; Peng, H. MgO nanosheets with N-doped carbon coating for the efficient visible-light photocatalysis. J. Ind. Eng. Chem. 2019, 76, 288–295. [Google Scholar] [CrossRef]
  10. Liu, Y.; Wang, K.; Huang, Z.; Zheng, X.; Wen, J. Enhanced photo-Fenton activity of Sm2O3-NiO heterojunction under visible light irradiation. J. Alloys Compd. 2019, 800, 498–504. [Google Scholar] [CrossRef]
  11. Zhang, B.; Wang, Z.; Peng, X.; Wang, Z.; Zhou, L.; Yin, Q. A novel route to manufacture 2D layer MoS2 and g-C3N4 by atmospheric plasma with enhanced visible-light-driven photocatalysis. Nanomaterials 2019, 9, 1139. [Google Scholar] [CrossRef] [PubMed]
  12. Liu, Y.; Song, Y.; You, Y.; Fu, X.; Wen, J. NiFe2O4/g-C3N4 heterojunction composite with enhanced visible-light photocatalytic activity. J. Saudi Chem. Soc. 2018, 22, 439–448. [Google Scholar] [CrossRef]
  13. Tang, T.; Lu, G.; Wang, W.; Wang, R.; Huang, K.; Qiu, Z.; Tao, X.; Dang, Z. Photocatalytic removal of organic phosphate esters by TiO2: Effect of inorganic ions and humic acid. Chemosphere 2018, 206, 26–32. [Google Scholar] [CrossRef] [PubMed]
  14. Kaur, J.; Gupta, A.; Pandey, O.P. Photocatalytic study of ZnS-Ag2S nanocomposites-effect of thioglycerol. Solar Energy 2018, 176, 678–687. [Google Scholar] [CrossRef]
  15. Zeng, J.; Li, Z.; Peng, H.; Zheng, X. Core-shell Sm2O3@ZnO nano-heterostructure for the visible light driven photocatalytic performance. Colloid. Surf. A 2019, 560, 244–251. [Google Scholar] [CrossRef]
  16. Zheng, X.; Fu, W.; Peng, H.; Wen, J. Preparation and characterization of CuxZn1-xS nanodisks for the efficient visible light photocatalytic activity. J. Environ. Chem. Eng. 2018, 6, 9–18. [Google Scholar] [CrossRef]
  17. Negrin-Montecelo, Y.; Testa-Anta, M.; Marin-Caba, L.; Perez-Lorenzo, M.; Salgueirino, V.; Correa-Duarte, M.A.; Comesana-Hermo, M. Titanate nanowires as one-dimensional hot spot generators for broadband Au-TiO2 photocatalysis. Nanomaterials 2019, 9, 990. [Google Scholar] [CrossRef]
  18. Dao, D.V.; Nguyen, T.T.; Song, H.; Yang, J.; Kim, T.; Yu, Y.; Lee, I. Ionic liquid-assisted preparation of Ag-CeO2 nanocomposites and their improved photocatalytic activity. Mater. Des. 2018, 159, 186–194. [Google Scholar]
  19. Wang, Y.; Bai, X.; Wang, F.; Kang, S.; Yin, C.; Li, X. Nanocasting synthesis of chromium doped mesoporous CeO2 with enhanced visible-light photocatalytic CO2 reduction performance. J. Hazard. Mater. 2019, 372, 69–76. [Google Scholar] [CrossRef]
  20. Zheng, X.; Huang, M.; You, Y.; Peng, H.; Wen, J. Core-shell structured α-Fe2O3@CeO2 heterojunction for the enhanced visible-light photocatalytic activity. Mater. Res. Bull. 2018, 101, 20–28. [Google Scholar] [CrossRef]
  21. Vignesh, S.; Suganthi, S.; Sundar, J.K.; Raj, V. Construction of α-Fe2O3/CeO2 decorated g-C3N4 nanosheets for magnetically separable efficient photocatalytic performance under visible light exposure and bacterial disinfection. Appl. Surf. Sci. 2019, 488, 763–777. [Google Scholar] [CrossRef]
  22. Wen, X.; Niu, C.; Zhang, L.; Liang, C.; Guo, H.; Zeng, G. Photocatalytic degradation of ciprofloxacin by a novel Z-scheme CeO2–Ag/AgBr photocatalyst: Influencing factors, possible degradation pathways, and mechanism insight. J. Catal. 2018, 358, 141–154. [Google Scholar] [CrossRef]
  23. Mittal, M.; Gupta, A.; Pandey, O.P. Role of oxygen vacancies in Ag/Au doped CeO2 nanoparticles for fast photocatalysis. Solar Energy 2019, 488, 763–777. [Google Scholar] [CrossRef]
  24. Xua, B.; Zhang, Q.; Yuan, S.; Zhang, M.; Ohno, T. Morphology control and characterization of broom-like porous CeO2. Chem. Eng. J. 2015, 260, 126–132. [Google Scholar] [CrossRef]
  25. Madkour, M.; Ali, A.A.; Nazeer, A.A.; Sagheer, F.A. A novel natural sunlight active photocatalyst of CdS/SWCNT/CeO2 heterostructure: In depth mechanistic insights for the catalyst reactivity and dye mineralization. Appl. Surf. Sci. 2019, 499, 143988. [Google Scholar] [CrossRef]
  26. Zheng, X.; Huang, S.; Yang, D.; Zhai, H.; You, Y.; Fu, X.; Yuan, J.; Zhou, X.; Wen, J.; Liu, Y. Synthesis of X-architecture CeO2 for the photodegradation of methylene blue under UV-light irradiation. J. Alloys Compd. 2017, 705, 131–137. [Google Scholar] [CrossRef]
  27. Sreeremya, T.S.; Thulasi, K.M.; Krishnan, A.; Ghosh, S. A novel aqueous route to fabricate ultrasmall monodisperse lipophilic cerium oxide nanoparticles. Ind. Eng. Chem. Res. 2012, 51, 318–326. [Google Scholar] [CrossRef]
  28. Xu, B.; Zhang, Q.; Yuan, S.; Zhang, M.; Ohno, T. Morphology control and photocatalytic characterization of yttrium-doped hedgehog-like CeO2. Appl. Catal. B Environ. 2013, 468, 260–268. [Google Scholar] [CrossRef]
  29. Sabzehmeidani, M.M.; Karimi, H.; Ghaedi, M. Visible light-induced photo-degradation of methylene blue by n–p heterojunction CeO2/CuS composite based on ribbon-like CeO2 nanofibers via electrospinning. Polyhedron 2019, 170, 160–171. [Google Scholar] [CrossRef]
  30. Gong, J.; Meng, F.; Yang, X.; Fan, Z.; Li, H. Controlled hydrothermal synthesis of triangular CeO2 nanosheets and their formation mechanism and optical properties. J. Alloys Compd. 2016, 689, 606–616. [Google Scholar] [CrossRef]
  31. Xu, W.; Wang, J.; Wang, L.; Sheng, G.; Liu, J.; Yu, H.; Huang, X. Enhanced arsenic removal from water by hierarchically porous CeO2-ZrO2 nanospheres: Role of surface-and structure-dependent properties. J. Hazard. Mater. 2013, 260, 498–507. [Google Scholar] [CrossRef] [PubMed]
  32. Gong, J.; Meng, F.; Fan, Z.; Li, H.; Du, Z. Template-free controlled hydrothermal synthesis for monodisperse flowerlike porous CeO2 microspheres and their superior catalytic reduction of NO with NH3. J. Alloys Compd. 2017, 690, 677–687. [Google Scholar] [CrossRef]
  33. Stelmachowski, P.; Ciura, K.; Indyka, P.; Kotarba, A. Facile synthesis of ordered CeO2 nanorod assemblies: Morphology and reactivity. Mater. Chem. Phys. 2017, 201, 139–146. [Google Scholar] [CrossRef]
  34. Younis, A.; Chu, D.; Kaneti, Y.V.; Li, S. Tuning the surface oxygen concentration of {111} surrounded ceria nanocrystals for enhanced photocatalytic activities. Nanoscale 2016, 8, 378–387. [Google Scholar] [CrossRef] [PubMed]
  35. Han, G.; Wang, M.; Li, D.; Bai, J.; Diao, G. Novel upconversion Er, Yb-CeO2 hollow spheres as scattering layer materials for efficient dye-sensitized solar cells. Sol. Energy Mater. Sol. Cells 2017, 160, 54–59. [Google Scholar] [CrossRef]
  36. Jia, H.; Li, M.; Li, X.; Ren, B.; Liu, X.; Zhao, J. Effects of nonmetal, F, Si, B, and P, doping on the electronic structure and elastic properties of CeO2: A first-principles study. J. Alloys Compd. 2016, 666, 419–424. [Google Scholar] [CrossRef]
  37. Xu, B.; Zhang, Q.; Yuan, S.; Liu, S.; Zhang, M. Synthesis and photocatalytic performance of yttrium-doped CeO2 with a hollow sphere structure. Catal. Today 2017, 281, 135–143. [Google Scholar] [CrossRef] [Green Version]
  38. Shimada, H.; Yamaguchi, T.; Suzuki, T.; Sumi, H.; Hamamoto, K.; Fujishiro, Y. High power density cell using nanostructured Sr-doped SmCoO3 and Sm-doped CeO2 composite powder synthesized by spray pyrolysis. J. Power Sources 2016, 302, 308–314. [Google Scholar] [CrossRef] [Green Version]
  39. Liu, C.; Sun, H.; Qian, J.; Chen, Z.; Lv, Y.; Chen, F.; Lu, X.; Wu, Z. Biotemplating synthesis and photocatalytic activities of N-doped CeO2 microcapsule tailored by hemerocallis pollen. Adv. Powder Technol. 2017, 28, 2741–2746. [Google Scholar] [CrossRef]
  40. El-Hagary, M.; Shaaban, E.R.; Moustafa, S.H.; Gad, G.M.A. The particle size-dependent optical band gap and magnetic properties of Fe-doped CeO2 nanoparticle. Solid State Sci. 2019, 91, 15–22. [Google Scholar] [CrossRef]
  41. Saravanakumar, K.; Ramjan, M.M.; Suresh, P.; Muthuraj, V. Fabrication of highly efficient visible light driven Ag/CeO2 photocatalyst for degradation of organic pollutants. J. Alloys Compd. 2016, 664, 149–160. [Google Scholar] [CrossRef]
  42. Liu, X.; Lv, S.; Fan, B.; Xing, A.; Jia, B. Ferroelectric polarization-enhanced photocatalysis in BaTiO3-TiO2 core-shell heterostructures. Nanomaterials 2019, 9, 1116. [Google Scholar] [CrossRef] [PubMed] [Green Version]
  43. Chae, B.W.; Amna, T.; Hassan, M.S.; Al-Deyab, S.S.; Khil, M. CeO2-Cu2O composite nanofibers: Synthesis, characterization photocatalytic and electrochemical application. Adv. Powder Technol. 2017, 28, 230–235. [Google Scholar] [CrossRef]
  44. Ma, Y.; Lv, C.; Hou, J.; Yuan, S.; Wang, Y.; Xu, P.; Gao, G.; Shi, J. 3D hollow hierarchical structures based on 1D BiOCl nanorods intersected with 2D Bi2WO6 nanosheets for efficient photocatalysis under visible light. Nanomaterials 2019, 9, 322. [Google Scholar] [CrossRef] [PubMed] [Green Version]
  45. Wang, N.; Fan, H.; Ai, S. Lignin templated synthesis of porous carbon–CeO2 composites and their application for the photocatalytic desulphuration. Chem. Eng. J. 2015, 260, 785–790. [Google Scholar] [CrossRef]
  46. Abdellatif, H.R.S.; Zhang, G.; Wang, X.; Xie, D.; Irvine, J.T.S.; Ni, J.; Ni, C. Boosting photocatalytic oxidation on graphitic carbon nitride for efficient photocatalysis by heterojunction with graphitic carbon units. Chem. Eng. J. 2019, 370, 875–884. [Google Scholar] [CrossRef] [Green Version]
  47. Zheng, X.; Hu, Y.; Li, Z.; Dong, Y.; Zhang, J.; Wen, J.; Peng, H. Sm2O3 nanoparticles coated with N-doped carbon for enhanced visible-light photocatalysis. J. Phys. Chem. Solid. 2019, 130, 180–188. [Google Scholar] [CrossRef]
  48. Markad, G.B.; Kapoor, S.; Haram, S.K.; Thakur, P. Metal free, carbon-TiO2 based composites for the visible light photocatalysis. Sol. Energy 2017, 144, 127–133. [Google Scholar] [CrossRef]
  49. Kakavandi, B.; Bahari, N.; Kalantary, R.R.; Fard, E.D. Enhanced sono-photocatalysis of tetracycline antibiotic using TiO2 decorated on magnetic activated carbon, MAC@T, coupled with US and UV: A new hybrid system. Ultrason. Sonochem. 2019, 55, 75–85. [Google Scholar] [CrossRef]
  50. Mekonnen, B.T.; Meiyazhagan, A.; Ragothaman, M.; Kalirajan, C.; Palanisamy, T. Bi-functional iron embedded carbon nanostructures from collagen waste for photocatalysis and Li-ion battery applications: A waste to wealth approach. J. Clean. Prod. 2019, 55, 75–85. [Google Scholar] [CrossRef]
  51. Radzig, M.; Koksharova, O.; Khmel, I.; Ivanov, V.; Yorov, K.; Kiwi, J.; Rtimi, S.; Tastekova, E.; Aybush, A.; Nadtochenko, V. Femtosecond spectroscopy of Au hot-electron injection into TiO2: Evidence for Au/TiO2 plasmon photocatalysis by bactericidal Au ions and related phenomena. Nanomaterials 2018, 8, 134. [Google Scholar] [CrossRef] [PubMed] [Green Version]
  52. Linh, V.T.N.; Xiao, X.F.; Jung, H.S.; Giannini, V.; Maier, S.A.; Kim, D.H.; Lee, Y.I.; Park, S.G. Compact integration of TiO2 nanoparticles into the cross-points of 3D vertically stacked Ag nanowires for plasmon-enhanced photocatalysis. Nanomaterials 2019, 9, 468. [Google Scholar] [CrossRef] [PubMed] [Green Version]
  53. Shin, D.H.; Lee, J.S.; Jun, J.; Jang, J. Fabrication of amorphous carbon-coated NiO nanofibers for electrochemical capacitor applications. J. Mater. Chem. A 2014, 2, 3364–3371. [Google Scholar] [CrossRef]
  54. Zhu, J.; Li, F.; Liu, G.; Liu, D.; Li, Q.; Kan, E. Synthesis of amorphous carbon film in ethanol inverse diffusion flames. Nanomaterials 2018, 8, 656. [Google Scholar] [CrossRef] [PubMed] [Green Version]
  55. Aboukais, A.; Skaf, M.; Hany, S.; Cousin, R.; Aouad, S.; Labki, M.; Abi-Aad, E. A comparative study of Cu, Ag and Cu doped CeO2 in the total oxidation of volatile organic compounds (VOCs). Mater. Chm. Phys. 2016, 177, 3364–3371. [Google Scholar]
  56. Deng, F.; Lu, X.; Luo, Y.; Wang, J.; Che, W.; Yang, R.; Luo, X.; Luo, S.; Dionysiou, D.D. Novel visible-light-driven direct Z-scheme CdS/CuInS2 nanoplates for excellent photocatalytic degradation performance and highly-efficient Cr (VI) reduction. Chem. Eng. J. 2019, 361, 1451–1461. [Google Scholar] [CrossRef]
  57. Xiong, H.; Zou, D.; Zhou, D.; Dong, S.; Wang, J.; Rittmann, B.E. Enhancing degradation and mineralization of tetracycline using intimately coupled photocatalysis and biodegradation (ICPB). Chem. Eng. J. 2017, 316, 7–14. [Google Scholar] [CrossRef]
  58. Zhang, Y.C.; Li, J.; Xu, H.Y. One-step in situ solvothermal synthesis of SnS2/TiO2 nanocomposites with high performance in visible light-driven photocatalytic reduction of aqueous Cr (VI). Appl. Catal. B Environ. 2012, 123–124, 18–26. [Google Scholar] [CrossRef]
  59. Yang, D.; Sun, Y.; Tong, Z.; Nan, Y.; Jiang, Z. Fabrication of bimodal-pore SrTiO3 microspheres with excellent photocatalytic performance for Cr (VI) reduction under simulated sunlight. J. Hazard. Mater. 2016, 312, 45–54. [Google Scholar] [CrossRef]
  60. Vignesh, K.; Priyanka, R.; Rajarajan, M.; Suganthi, A. Photoreduction of Cr (VI) in water using Bi2O3-ZrO2 nanocomposite under visible light irradiation. Mater. Sci. Eng. B 2013, 178, 149–157. [Google Scholar] [CrossRef]
Figure 1. XRD patterns of CeO2@C-2 and Ag/CeO2@C-2.
Nanomaterials 09 01643 g001
Figure 2. Ce 3d (A), O 1s (B), C 1s (C), and Ag 3d (D) X-ray photoelectron spectroscopy (XPS) spectra of fresh and used 3-Ag/CeO2@C-2.
Nanomaterials 09 01643 g002
Figure 3. SEM images (A,B), TEM images (C,D), high-resolution TEM (HRTEM) images (E,F), and elemental mapping images (GJ) of 3-Ag/CeO2@C-2.
Nanomaterials 09 01643 g003
Figure 4. UV–Vis spectra of CeO2, CeO2@C-2, and 3-Ag/CeO2@C-2.
Nanomaterials 09 01643 g004
Figure 5. Photoluminescence (PL) spectra of CeO2, CeO2@C-2, and 3-Ag/CeO2@C-2.
Nanomaterials 09 01643 g005
Figure 6. Photocurrent–time response (A) and electrochemical impedance spectroscopy (EIS) Nyquist plots (B) of 3-Ag/CeO2@C-2.
Nanomaterials 09 01643 g006
Figure 7. Effect of Ag content on the photocatalytic activity of CeO2@C-2 (A) and the effects of Cr(VI) concentration (B), pH value (C), and inorganic ions (D) on the photocatalytic activity of 3-Ag/CeO2@C-2.
Nanomaterials 09 01643 g007
Figure 8. Photocatalytic stability of 3-Ag/CeO2@C-2 in Cr(VI) removal in the visible-light region.
Nanomaterials 09 01643 g008
Figure 9. Electron spin resonance (ESR) spectra of 3-Ag/CeO2@C-2 for DMPO–·O2 in methanol (A) and DMPO–·OH in aqueous (B).
Nanomaterials 09 01643 g009
Figure 10. Photocatalytic mechanism of 3-Ag/CeO2@C-2.
Nanomaterials 09 01643 g010

