1. Introduction
Inorganic nanocrystals, due to their high mechanical, thermal and chemical stability, have garnered an immense interest from the point of view of their potential implementation in biomedical application, i.e., optical and magnetic resonance imaging, drug delivery, light-induced hyperthermia generation etc. [
1,
2,
3,
4]. Their optical properties may be in a facile way modified by the introduction of the appropriate optically active ions like lanthanide (Ln
3+) and/or transition metals (TM) ions [
5,
6,
7,
8,
9,
10,
11,
12,
13] to the host material. Besides unique chemical and physical features, they reveal size- and shape-dependent spectroscopic properties, which are not observed for organic-based nanomaterials [
1]. Due to the fact that the optical properties of such nanoparticles are strongly affected by the temperature, their luminescence may be employed to non-contact temperature sensing (luminescent thermometry, LT). In LT, temperature readout relies on the analysis of thermally-affected spectroscopic parameters like emission intensity, luminescence lifetime, peak position, band shape and polarization anisotropy [
14,
15,
16]. One of the most important advantages of LT in respect to other temperature measurement techniques is the fact that it provides a real-time temperature readout with unprecedented spatial and thermal resolution [
15,
17,
18]. Additionally, temperature readout is provided in an electrically passive mode what enables to achieve the information about, i.e., the condition of living organisms where even small temperature fluctuations are usually accompanied by serious health diseases and improper cellular biochemical processes [
16,
19,
20,
21,
22]. The use of the nanosized LTs enables the improvement of the spatial resolution of temperature readout. However, in order to obtain high thermal resolution of temperature measurement, different approaches, which enable to increase the relative sensitivity of LT to temperature changes, were proposed up to date. As was recently demonstrated, the utilization of transition metal ions luminescence with lanthanide co-dopant as a luminescent reference enables the enhancement of temperature sensing sensitivity, luminescence brightness and the broadening of usable temperature range in which LT operates [
23,
24,
25]. For this purpose, optical properties of different TM were investigated, such as V
3+/V
4+/V
5+ [
23,
26], Co
2+ [
27], Ti
3+/Ti
4+ [
28], Cr
3+ [
24,
25], Mn
3+/Mn
4+ [
29] and Ni
2+ [
30]. Another advantage of using TM is the susceptibility of their optical properties to the modification of the crystal field strength via host stoichiometry due to the fact that
d electrons, located on the valence shell, are exposed to the local environment and crystal field changes. This phenomenon was investigated in detailed in case of temperature sensing performance of Cr
3+ ions where the structure of host materials were varying from Gd
3Al
5O
12 (GAG) to Gd
3Ga
5O
12 (GGG), and from Y
3Al
5O
12 (YAG) to Y
3Ga
5O
12 (YGG) via changing the Al
3+ to Ga
3+ ratio [
24,
25]. As was recently shown for Cr
3+ ions, such modification enables not only enhancement of the sensitivity of LT but also tuning of the spectral position of emission band [
25]. These kinds of studies have not yet been conducted for V-based luminescent thermometers.
Therefore, in this work, we present for the first time a strategy that enables the improvement of temperature-sensing properties of V-based luminescent nanothermometers via modification of the host material composition. This approach bases on the gradual substitution of Al3+ ions by Ga3+ ions into YAG nanocrystals. The introduction of gallium ions, which possess larger ionic radii in respect to Al3+ ones leads to the lowering of crystal field (CF) strength. This arises from the elongation of the metal-oxygen (M-O) distance along with the enhancement of the contribution of Ga3+ ions. The modification of the crystal field strength should strongly influence the temperature-dependent luminescent properties of V ions of different oxidation state (V5+, V4+, V3+). Moreover, the introduction of the gallium ions facilitates the stabilization of V4+ oxidation state that possesses favorable performance for luminescent thermometry. However, these expectations have not yet been experimentally verified. Therefore, the aim of this work is to study the influence of the Ga3+ ions concentration of the temperature dependent luminescent properties of vanadium ions in Y3Al5−xGaxO12:V nanocrystals, with the special emphasize put on their application in luminescent thermometry.
3. Results and Discussion
The yttrium aluminum/gallium garnets crystallize in a cubic structure of Ia3d space group. The general formula of garnets is expressed as follows: A
3B
2C
3O
12, where three different metallic sites are represented by dodecahedral site (A), octahedral site (B) and tetrahedral site (C), which in our case are occupied by eight-fold coordinated Y
3+ ions, six-fold coordinated Al
3+/Ga
3+ ions and four-fold coordinated Al
3+/Ga
3+ ions, respectively. The optically active ions introduced to the structure may occupy different crystallographic sites, which results from the similarities in the coordination number, ionic radii and ionic charge between the host and dopant metal. Therefore, lanthanides (Ln
3+) prefer to replace A site, while (TM) mainly substitute B and C sites. Additionally, depending on the size of TM ion, they occupy larger (B) (ionic radii 0.67 Å for Al
3+ and 0.76 Å for Ga
3+) or smaller (C) (0.53 Å for Al
3+and 0.61 Å for Ga
3+) metallic sites. An XRD analysis was used to verify the phase purity of synthesized materials. It is evident that the obtained diffraction peaks of V-doped Y
3Al
5−xGa
xO
12 nanocrystals correspond to the reference patterns of cubic structures of adequate host materials (
Figure 1a). Observed peaks broadening can be assigned to the small size of the nanoparticles. The
a cell parameter increases linearly as the Ga
3+-dopant concentration increased, which results from the enlargement of the crystallographic cell associated with the difference in the ionic radii of Al
3+and Ga
3+ ions (rAl
3+ < rGa
3+) (
Figure 1b). However, it was found that Ga
3+ ions preferentially occupy four-fold coordinated sites of Al
3+ rather than the octahedral counterpart. This phenomenon can be explained based on the stronger covalency of Ga
3+-O
2− bonds with respect to the Al
3+-O
2− ones and the lowering of repulsive forces between cations, providing stabilization of the crystal structure [
31,
32]. On the other hand, the slight shift of the XRD peaks with respect to the reference pattern arises from the implementation of V ions into Y
3Al
5−xGa
xO
12 lattice. It was found that Y
3Al
5−xGa
xO
12 matrix is a suitable host material for three different V oxidation states, namely V
3+ and V
5+ [
23,
26,
33]. The replacement of Ga
3+ and Al
3+ ions by V ions is possible due to their comparable ionic radii, which in the case of four-fold coordinated V
5+ and V
3+ ions are 0.54 Å, 0.64 Å, respectively, and for six-fold coordinated V
5+,V
4+ and V
3+ ions are 0.68 Å, 0.72 Å and 0.78 Å, respectively. As can be seen from the TEM images, synthesized powders consist of well-crystalized and highly agglomerated nanocrystals (
Figure 1c,e,g,i,k). The hydrodynamic sizes of the aggregates of Y
3Al
5−xGa
xO
12 nanocrystals examined using DLS analysis were found to be around 300 nm (
Figure 1d,f,h,j,l).
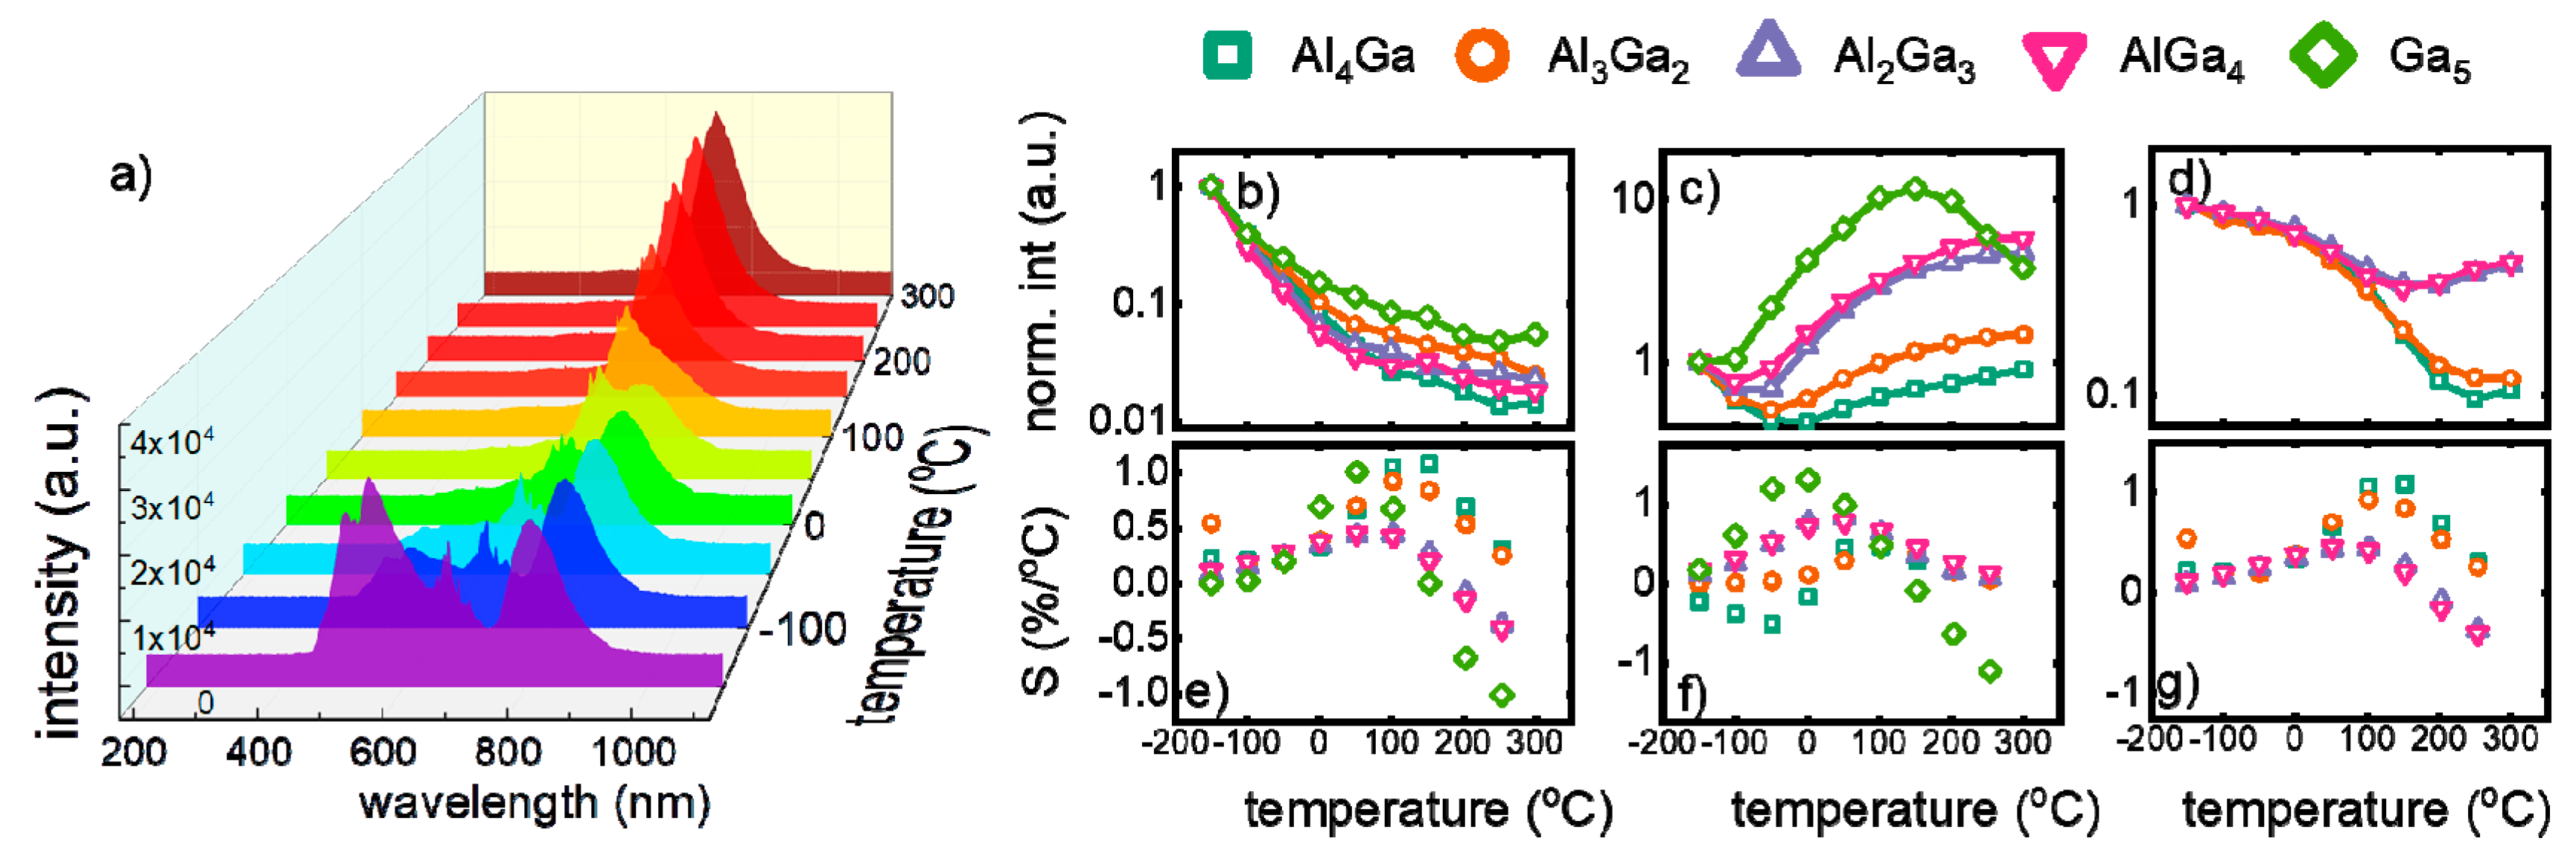
Luminescent properties of V- doped Y
3Al
5−xGa
xO
12 nanocrystals were investigated upon 266 nm of excitation in the −150 °C to 300 °C (123.15 K to 573.15 K) temperature range (
Figure 2a). The emission spectrum obtained at −150 °C consists of three transition bands, for materials with Ga
3+ concentration from 1 to 4, and of two emission bands for YGG, being related to the presence of different V oxidations states - V
5+, V
4+ and V
3+. In the course of our previous investigation, it was found that due to the difference in the ionic radii and the charge, V
5+ ions preferentially occupy surface sites of Al
3+, while V
3+ and V
4+ are mainly located in the core part of the nanoparticles [
26,
33]. The first broad emission band at 520 nm is attributed to the charge transfer transition of V
5+(V
4+ → O
2−). The second band at 640 nm originates from
2E →
2T
2 radiative transition of V
4+ ions, while the band at 820 nm is associated with
1E
2 →
3T
1g transition of V
3+ ions. As can be seen, the addition of Ga
3+ ions significantly affects the luminescent properties of Y
3Al
5−xGa
xO
12:V nanocrystals (
Figure 2b). The presented results stay in agreement with the observations obtained for the vanadium doped yttrium aluminum oxide and lanthanum gallium oxide nanoparticles [
23,
26]. The representative emission spectra measured at −150 °C indicate that the increase of Ga
3+ concentration caused the enhancement of the V
4+ emission intensity in respect to the V
5+ and V
3+ ones. This effect results from the large ionic radii of V
4+, which significantly exceeds Al
3+ ones. Therefore, V
4+ cannot efficiently replace Al
3+ in the structure. However, when the concentration of Ga
3+ ions gradually increases, the number of the crystallographic sites that can be occupied by V
4+ rises up, leading to the enhancement of
2E →
2T
2 emission intensity. Moreover, the Ga-doping induces the reduction of the distance between V
4+ and V
5+ ions facilitating the energy transfer between them, which contributed to the V
4+ luminescent intensity increase. It is worth noticing that the emission of trivalent V dominates in the spectrum up to x = 4, while in the case of YGG V
4+, the emission band prevails. To quantify these changes the histogram presenting the contribution of the emission intensities (calculated as an integral emission intensity in appropriate spectral range) of particular oxidation state of vanadium ions to the overall emission intensity as a function of Ga
3+ concentration is presented in
Figure 2c. The observed enhancement of V
4+ emission intensity with respect to the V
5+ with an increase of Ga
3+ concentration causes tuning of the emission color toward red emission (
Figure 2d). However, for YGG:V, orange emission was found. As has been already proven, the V
5+ ions are located mainly in the surface part of the nanocrystals [
23]. Since the morphology and the size of the nanoparticle is independent on the Ga
3+ concentration, the number of V
5+ can be assumed to be constant. The confirmation of this hypothesis is the fact that its lifetime (<τ
V5+> = 6.4 ms) is independent on the host stoichiometry (
Figure S1). On the other hand, the average lifetime of V
3+ and V
4+ shortens consequently from 7.6 ms to 7.0 ms and 1.2 ms to 0.5 ms, respectively, with Ga
3+ concentration (x changed from 1 to 5).
In order to evaluate how the spectral changes of Y
3Al
5−xGa
xO
12 nanocrystal, induced by the stoichiometry modification, affect the performance of analyzed nanoparticles for noncontact temperature sensing, their luminescence spectra were analyzed in a wide range of temperature (from −150 °C to 300 °C) (
Figure 3a,
Figure S2). In the course of these studies, it was found that emission intensity of each V ion is quenched by temperature; however, their luminescence thermal quenching rates differ (
Figure 3b–d). In the case of V
5+, emission intensity is gradually quenched by almost two orders of magnitude with temperature. However, correlation between Ga
3+ introduction and temperature of thermal quenching was not observed. This effect is understandable, since, as has been shown before, V
5+ occupy mainly surface part of the nanoparticles. In turn, the emission intensity of V
4+ initially decreases with temperature and above some critical temperature, it significantly increases as the temperature grows, which results from the efficient V
5+ → V
4+ energy transfer. It was found that the threshold temperature above which rise up of intensity was observed lowers with Ga
3+ concentration (from around 10 °C for Y
3Al
4GaO
12 to −100 °C for Y
3AlGa
4O
12 and YGG). Additionally the magnitude of the intensity increase growths with Ga
3+ content. This phenomenon can be explained by the increase of the V
5+ → V
4+ energy transfer probability. Higher numbers of Ga
3+ sites in the structures promote the stabilization of the V
4+ ions, which, as a consequence, shortens the average distance between V
5+ and V
4+ facilitating interionic interactions. Due to the fact that energy of V
5+ excited state is higher than that of V
4+, the energy transfer between them occurs with the assistance of the phonon. According to the Miyakava-Dexter theory, the probability of this process is strongly dependent on temperature, which is in agreement with our data [
34]. It needs to be noted that although V
5+ ions serve as a sensitizers for V
4+, there is no correlation between Ga
3+ concentration and the V
5+ luminescence thermal quenching. This comes from the fact that in the case of V
5+ intensity the luminescence thermal quenching process plays dominant role over V
5+ → V
4+ energy transfer. The correlation between Ga
3+ concentration and the luminescent thermal quenching rate is also evident in the case of V
3+ ions. The higher the amount of Ga
3+, the lower the thermal quenching rate of the
1E
2 →
3T
1g emission band. Above 100 °C, the V
4+ emission intensity becomes so efficient that its intensity dominates over the V
3+ ones and thus hinders its emission intensity analysis. In the case of YGG, the V
3+ emission is impossible to detect.
Since the emission intensity of V ions in Y
3Al
5−xGa
xO
12 nanocrystals is strongly affected by the temperature changes, a quantitative analysis, which verify their performance for non-contact temperature sensing, was performed. For this purpose, the relative sensitivities (
S) of three different intensity-based luminescent thermometers were calculated according to the following Equation (1):
where Ω corresponds to the temperature dependent spectroscopic parameter, which in this case is represented by emission of adequate V ions (S
1 for V
5+, S
2 for V
4+ and S
3 for V
3+), and
ΔΩ and
ΔT indicate to the change of Ω and temperature, respectively.
The maximal values of relative sensitivity (S
1) of V
5+-based luminescent thermometer, which exceed 2%/°C, were found at temperatures below −100 °C and with increase of temperature S
1 gradually decreases reaching 1.34%/°C, 1.12%/°C, 1.13%/°C, 1.30%/°C and 0.76%/°C for Y
3Al
4GaO
12, Y
3Al
3Ga
2O
12, Y
3Al
2Ga
3O
12, Y
3AlGa
4O
12 and Y
3Ga
5O
12, respectively, in the biological temperature range (0 °C–50 °C). The highest value of the S
1 was found at −150 °C for Y
3Ga
5O
12, which is in agreement with our expectation that short distance between V
5+ and V
4+ facilitates the interionic energy transfer between them. The presented correlations confirm that relative sensitivity of temperature sensors based on V
5+ emission intensity can be modulated by varying the Ga
3+-concentration (
Figure 3e). In case of Y
3Al
5−xGa
xO
12:V
4+ temperature sensors, the highest value of sensitivity reveal the YGG nanocrystals (S
2max = 1.34%/°C at −15 °C), and its value gradually decreases with the lowering of Ga
3+ concentration. Moreover, the temperature at which maximal S
2 was found decreases with Ga
3+ concentration from 75 °C for Y
3Al
4GaO
12 to −15 °C for YGG. This phenomenon is also observed in the case of biological temperature range, where reducing the Ga
3+ concentration the S value decreases from 1.32%/°C at 0 °C to 0.2%/°C at 30 °C for Y
3Ga
5O
12 to Y
3Al
4GaO
12 (
Figure 3f). It should be mentioned here that usable temperature range for this luminescent thermometer (temperature range in which Ω reveals monotonic change) is limited, and the most narrow one was found for YGG (from −100 °C to 120 °C). The negative values of S
2 come from the fact of the intensity trend reversal. Hence, the balance between relative sensitivity and the usable temperature range can be optimized by the appropriate host material composition. Therefore, depending on the type of application of such luminescent thermometer, including required relative sensitivity and operating temperatures range, different stoichiometry of host material can be proposed. Since the V
3+ emission intensity monotonically decreases in the temperature range below 200 °C the relative sensitivity S
3 reveals positive values with the single maxima at temperature which is dependent on the Ga
3+ concentration (
Figure 3g). The increase of Ga
3+ amount causes the reduction of both value of the S
3 and the temperature of S max from 1.08%/°C at 152 °C for Y
3Al
4GaO
12 to 0.45%/°C at 51 °C for Y
3AlGa
4O
12.
Although the performance of the intensity-based luminescent thermometer, which take advantage from V
5+, V
4+ and V
3+ emission, are very promising, the reliability of accurate temperature readout is limited due to the fact that emission intensity of a single band may be affected by the number of experimental and physical parameters. Therefore, most of the studies concern the bandshape luminescent thermometer, for which relative emission intensity of two bands is used for temperature sensing. Taking advantage of the fact that emission intensities of V
5+ and V
4+ ions reveal opposite temperature dependence, their luminescence intensity ratio (
LIR) can be used as a sensitive thermometric parameter:
Analysis of the thermal evolution of
LIR reveals that for each stoichiometry of the host material the decrease of
LIR’s value by over three orders of magnitude can be found for −150–300 °C temperature range (
Figure 4a). Observed thermal changes of
LIR significantly exceed those noticed for single ion emission. The relative sensitivities of LIR-based luminescent thermometers (
S4) were defined as follows:
Thereby, the relative sensitivities calculated for LIR-based luminescent thermometers reached values that exceed 2%/°C (
Figure 4b). Thermal evolution of
S4 attains single maxima at temperature T
Smax. As was shown before, both the
S4max and T
Smax can be successfully modified by the incorporation of the Ga
3+ ions. The increase of the Ga
3+ concentration causes the lowering of the T
Smax from 20 °C for Y
3Al
4GaO
12 to −100 °C for Y
3Ga
5O
12, while the maximal relative sensitivity increases from 1.47%/°C for Y
3Al
4GaO
12 to 2.48%/°C for Y
3Ga
5O
12 (
Figure 4c,d). However, the maximal value of
S4 = 2.64%/°C was found for Y
3Al
2Ga
3O
12. It needs to be mentioned here that, to the best of our knowledge, described nanocrystals reveal the highest values of relative sensitivity for vanadium-based luminescent thermometers up to date. Moreover, it was found that the higher the Ga
3+ content (Y
3Al
4GaO
12- Y
3AlGa
4O
12), the more significant the change of CIE 1931 chromatic coordinates is (
Figure 4e,f).


