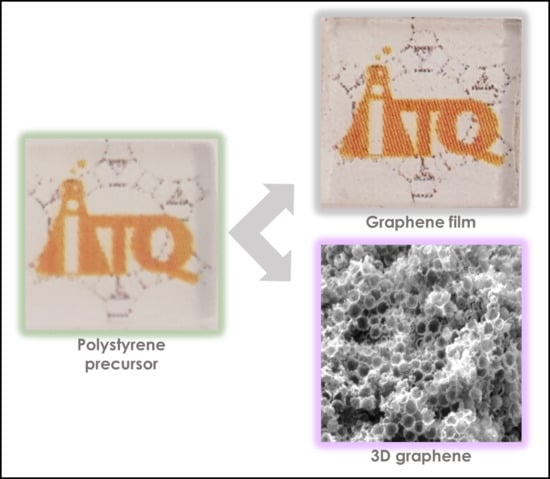
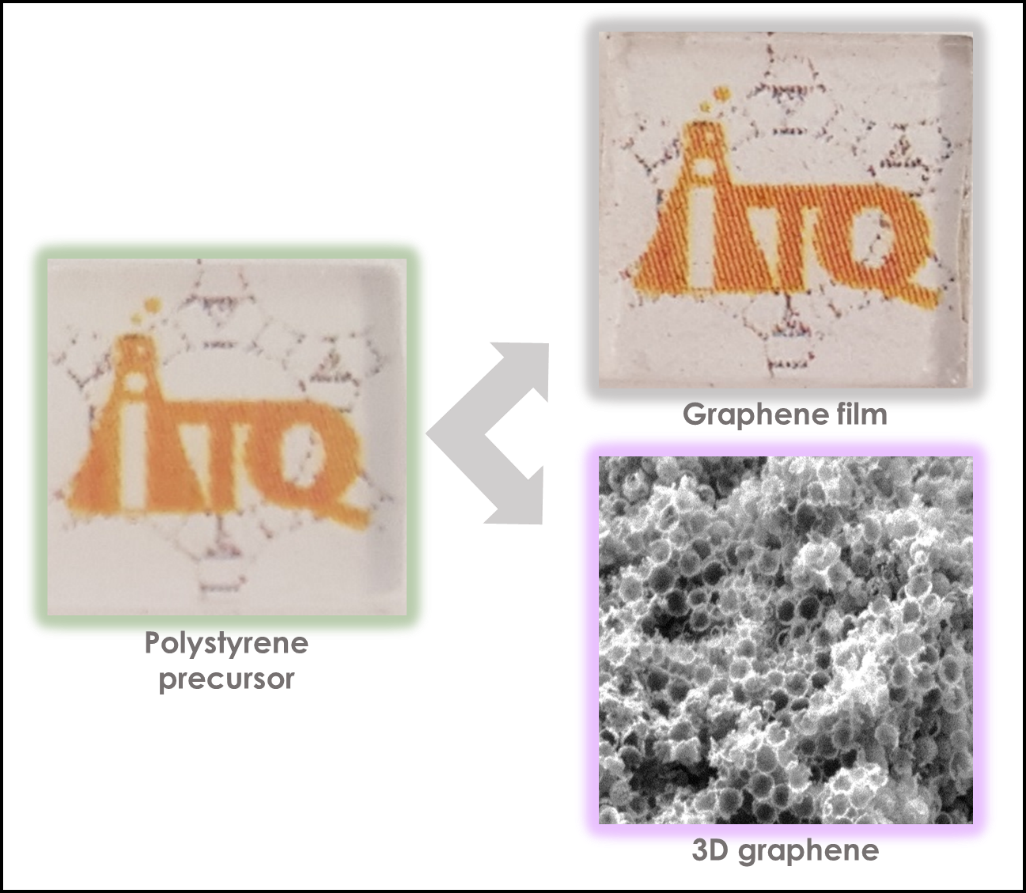
Polystyrene as Graphene Film and 3D Graphene Sponge Precursor


 ,
,  and
and
Abstract
:
1. Introduction
2. Materials and Methods
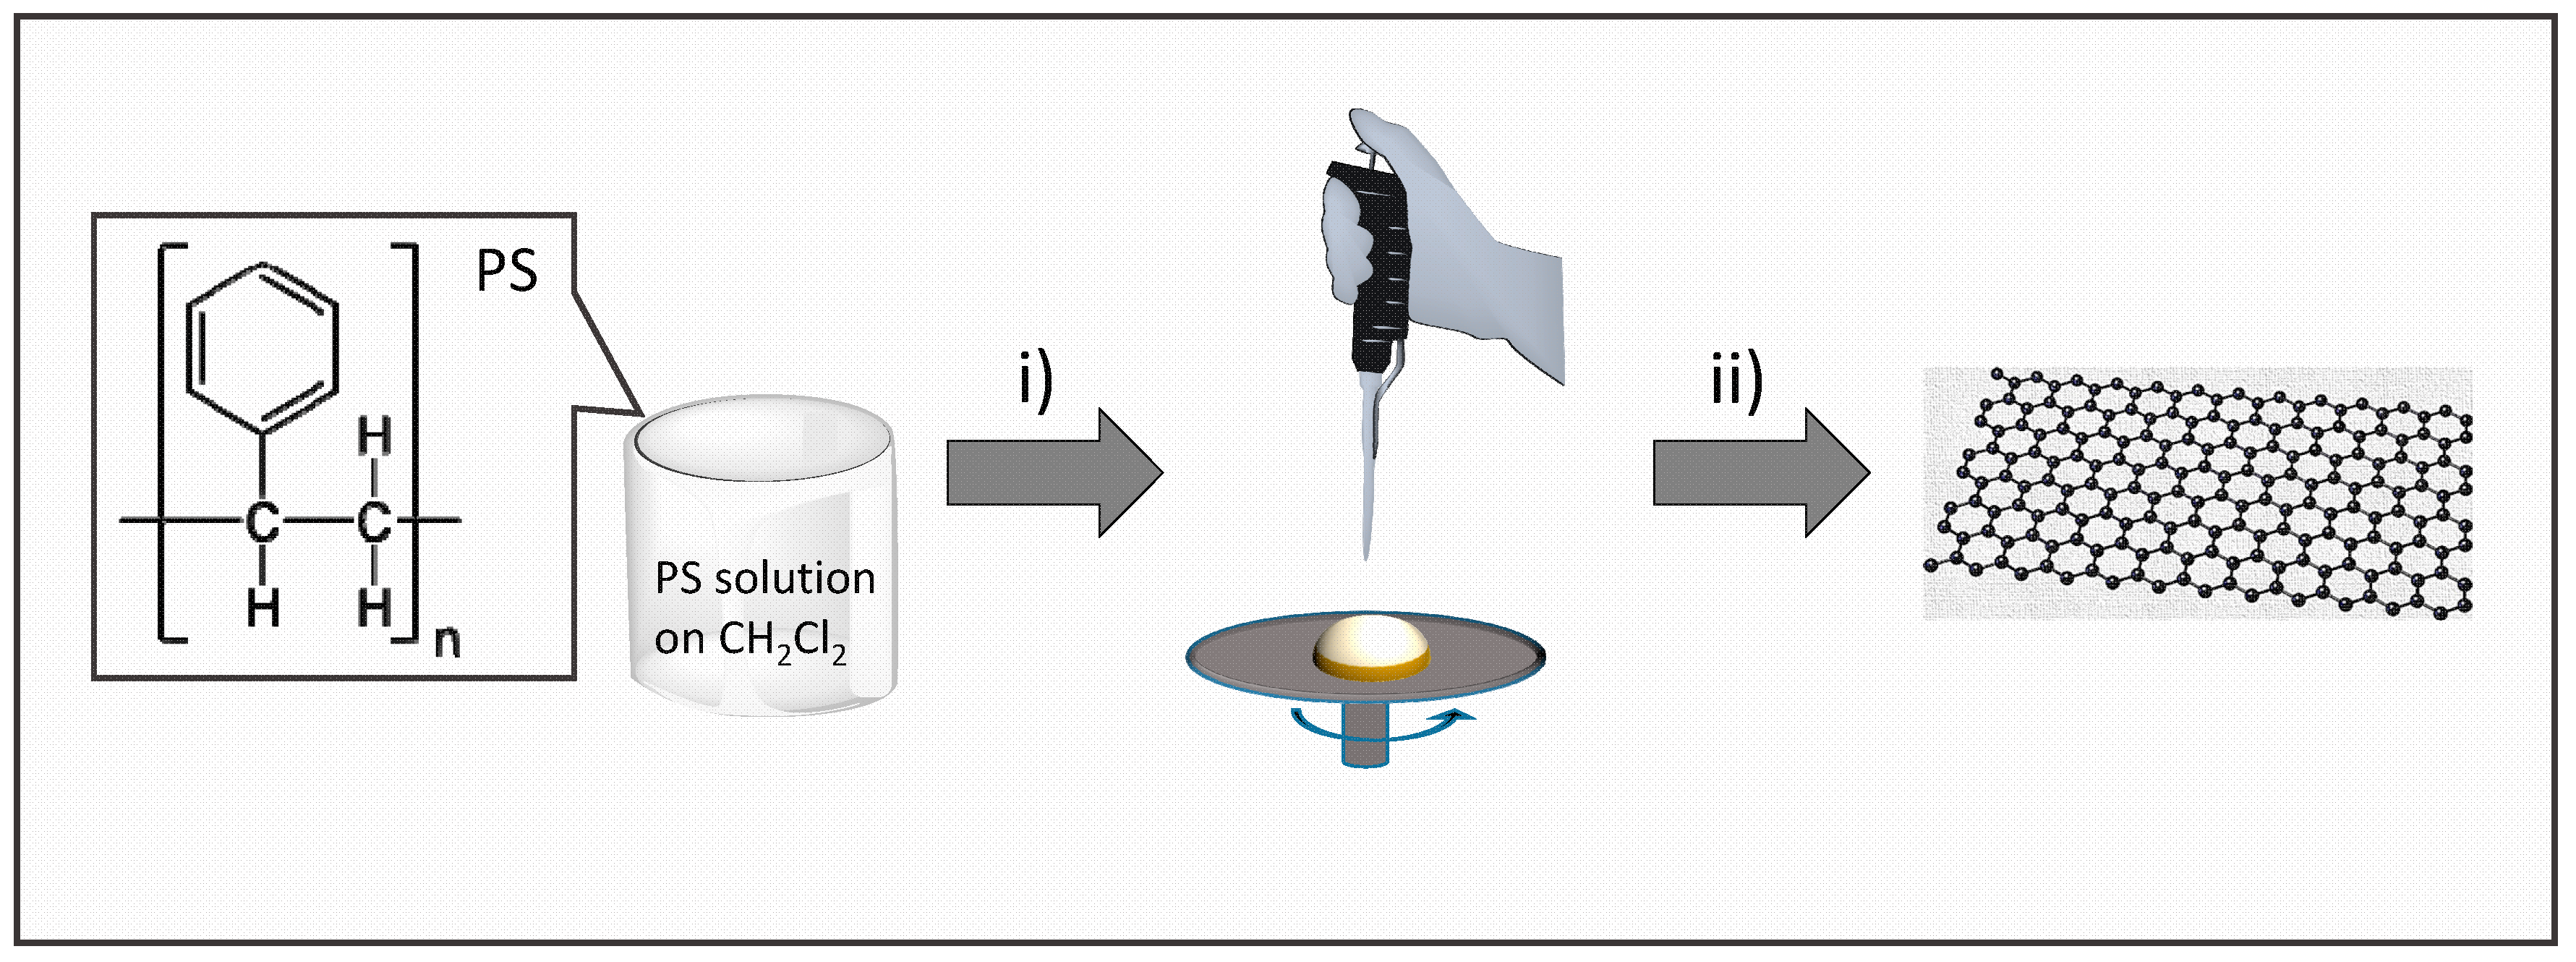
2.1. Preparation of Graphene Films
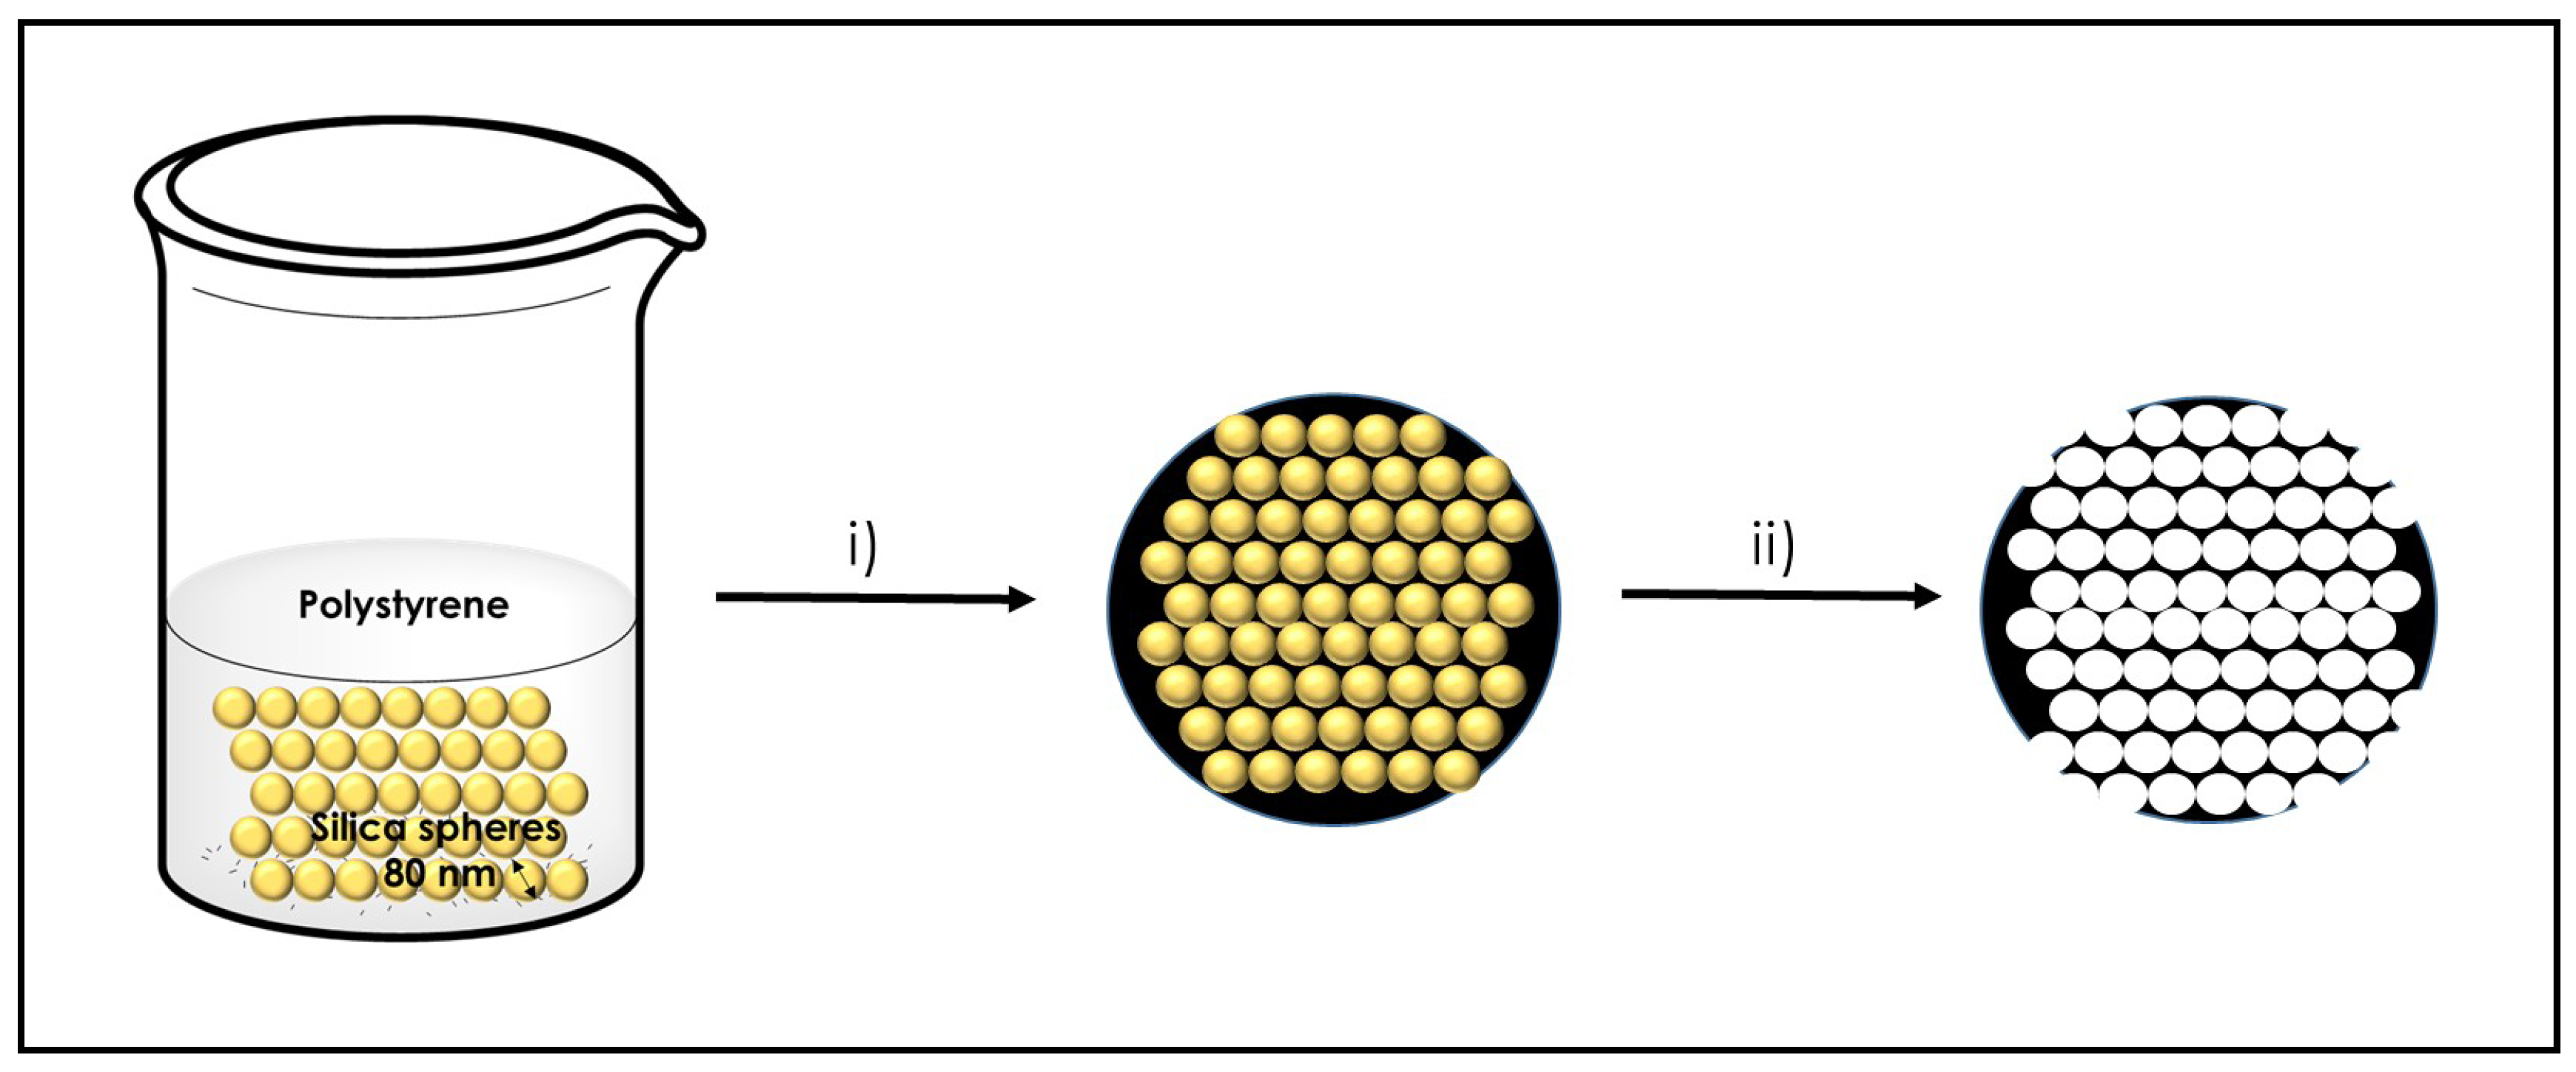
2.2. Preparation of Graphene Sponges
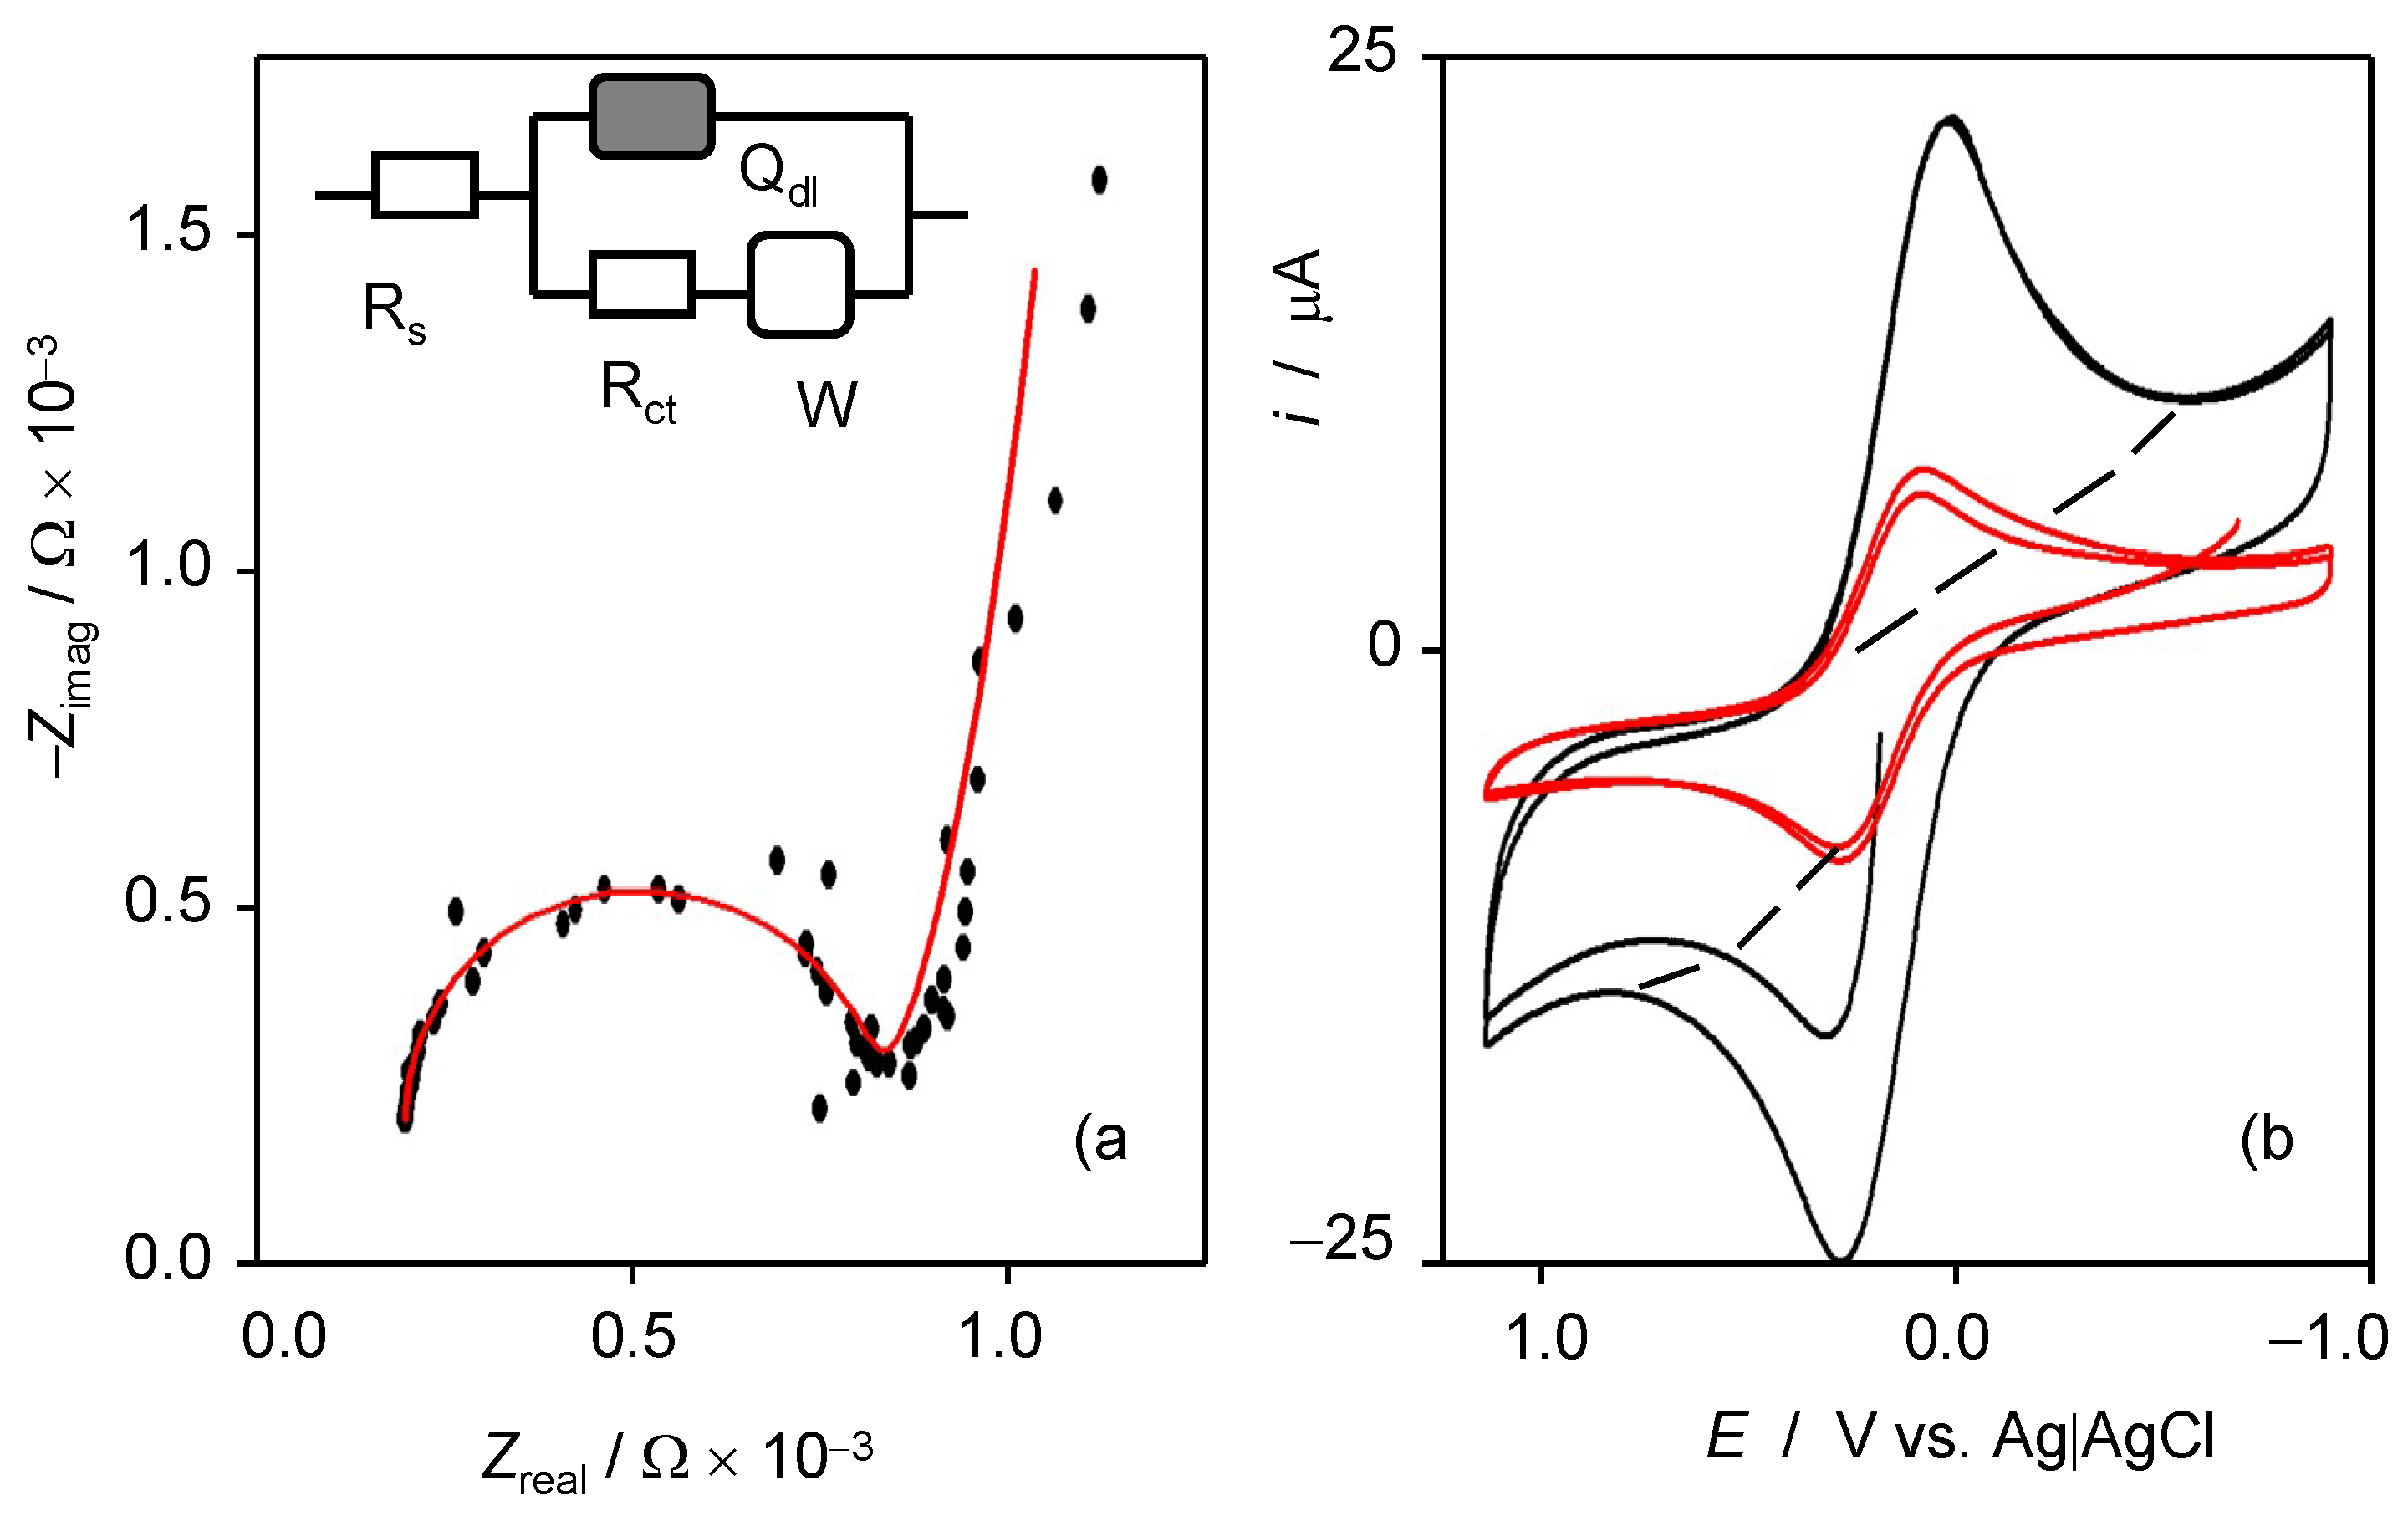
2.3. Electrocatalytic Measurements
3. Results
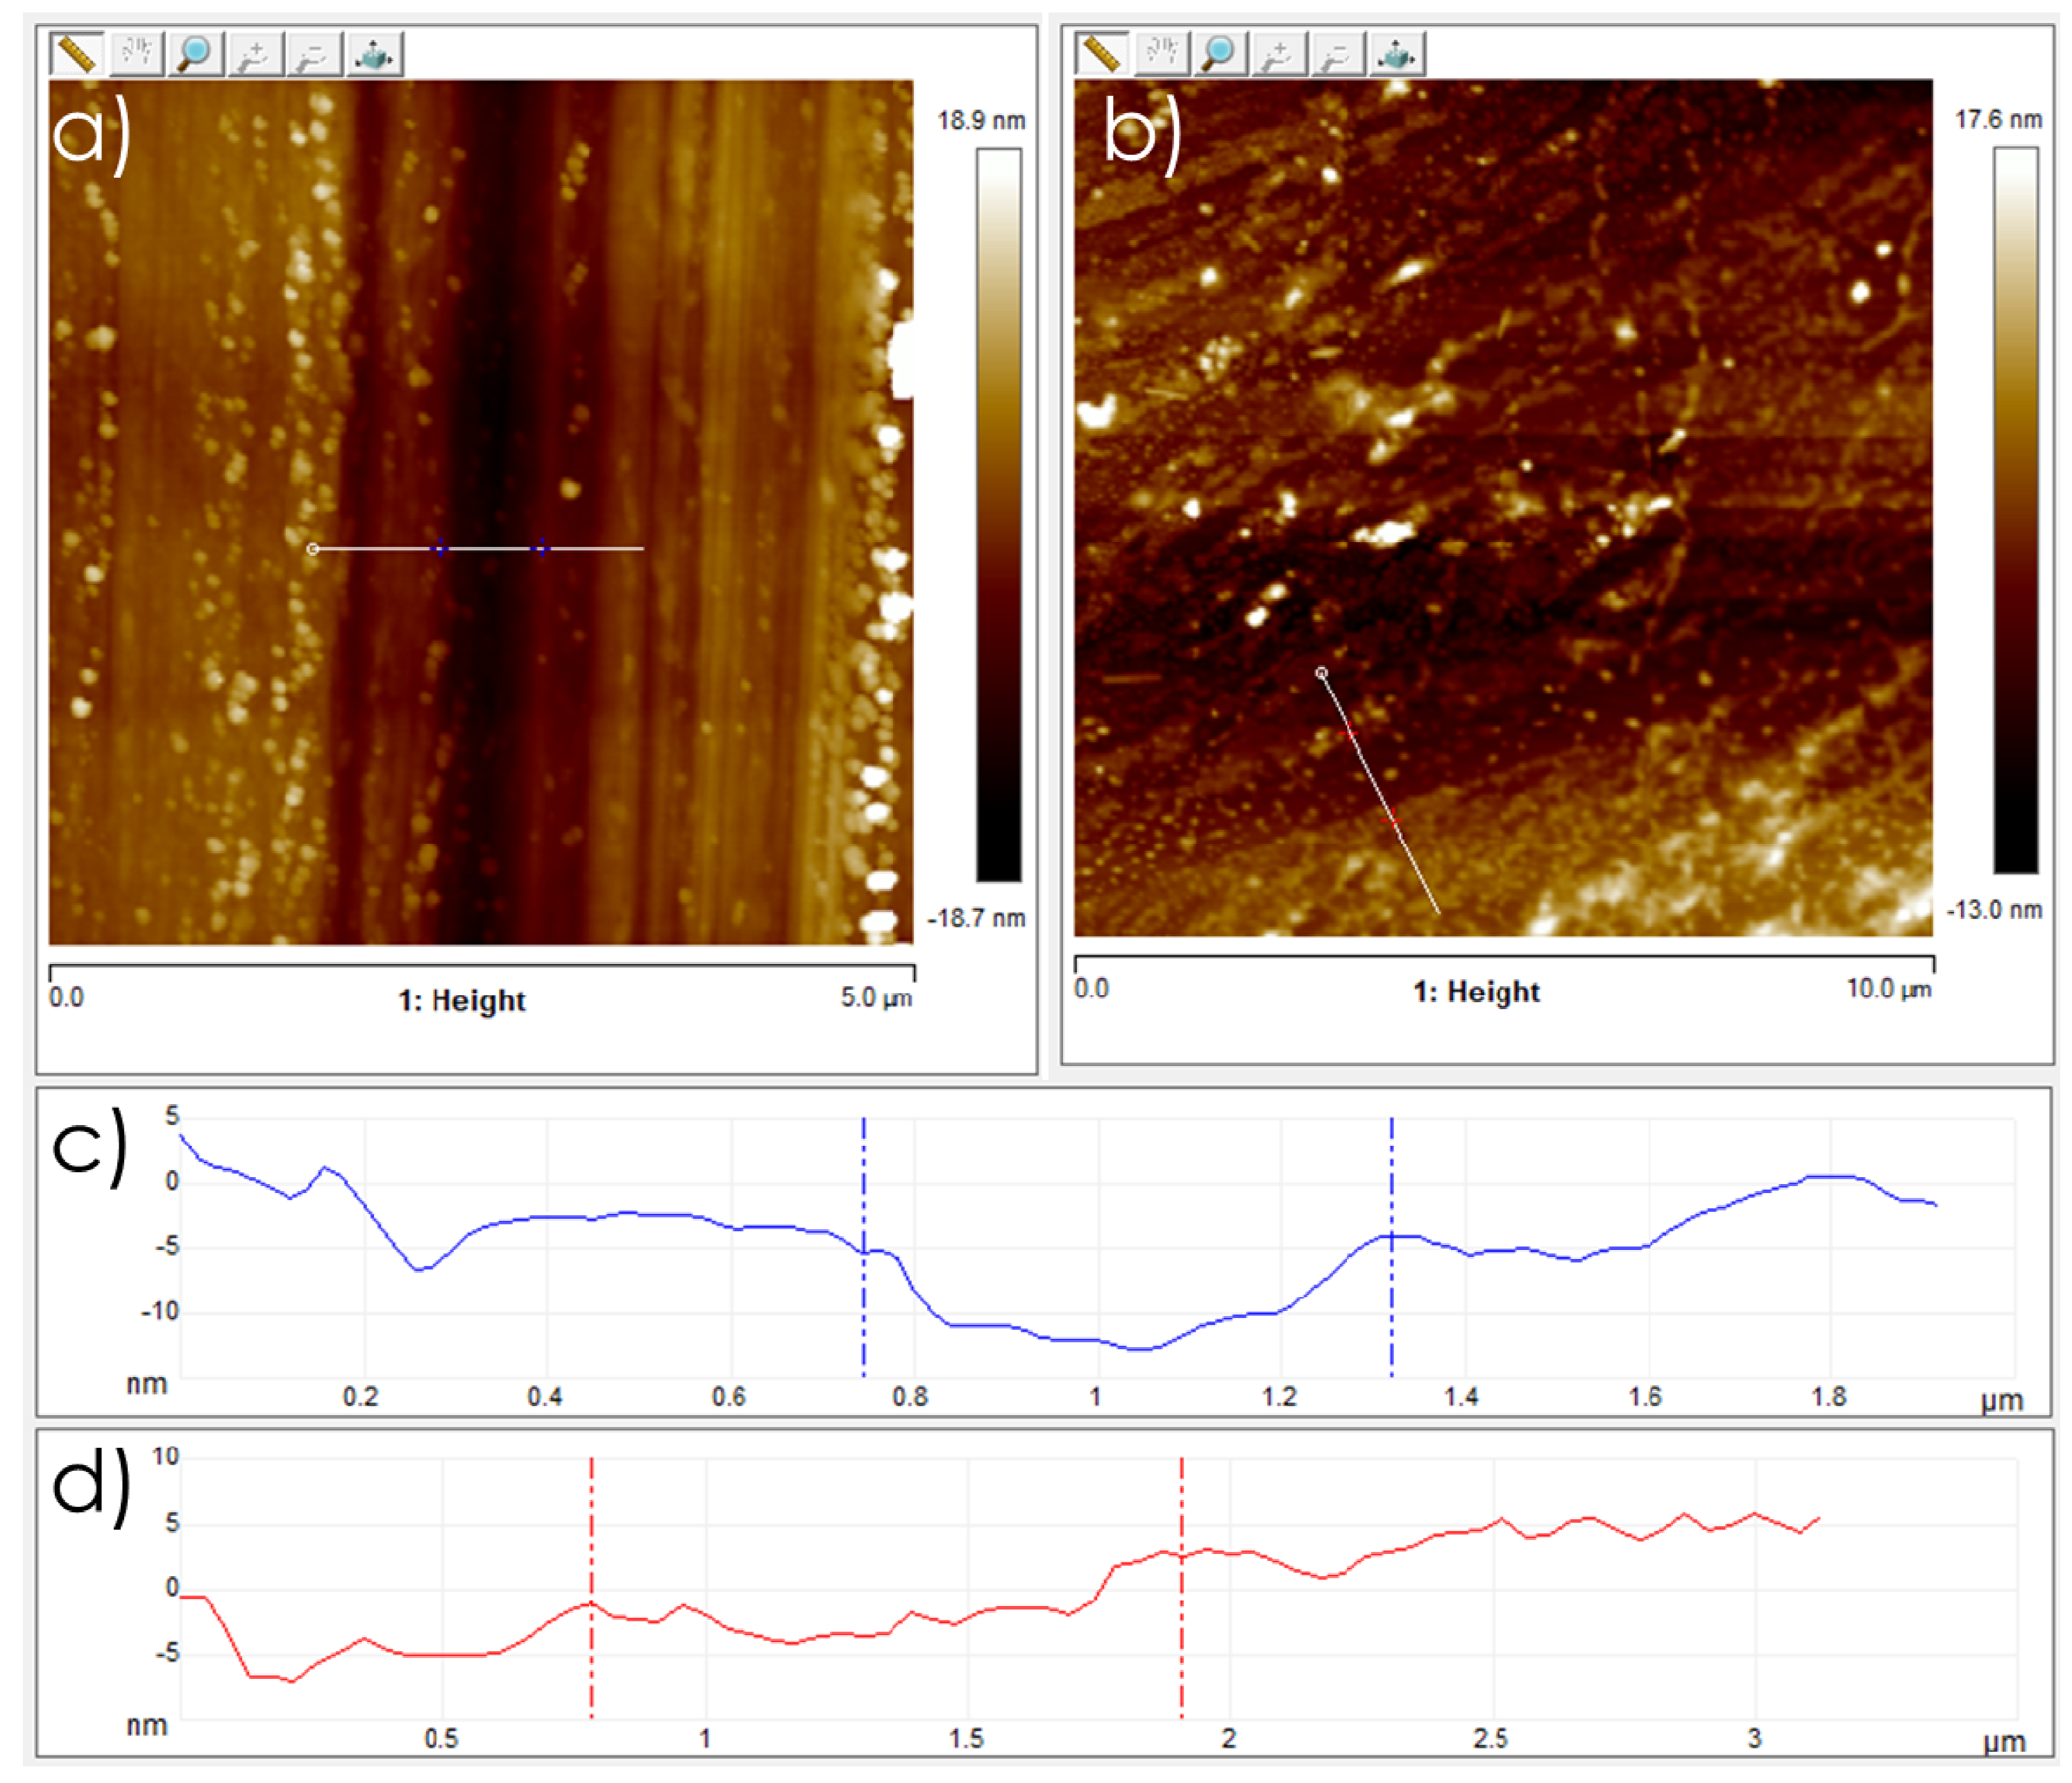
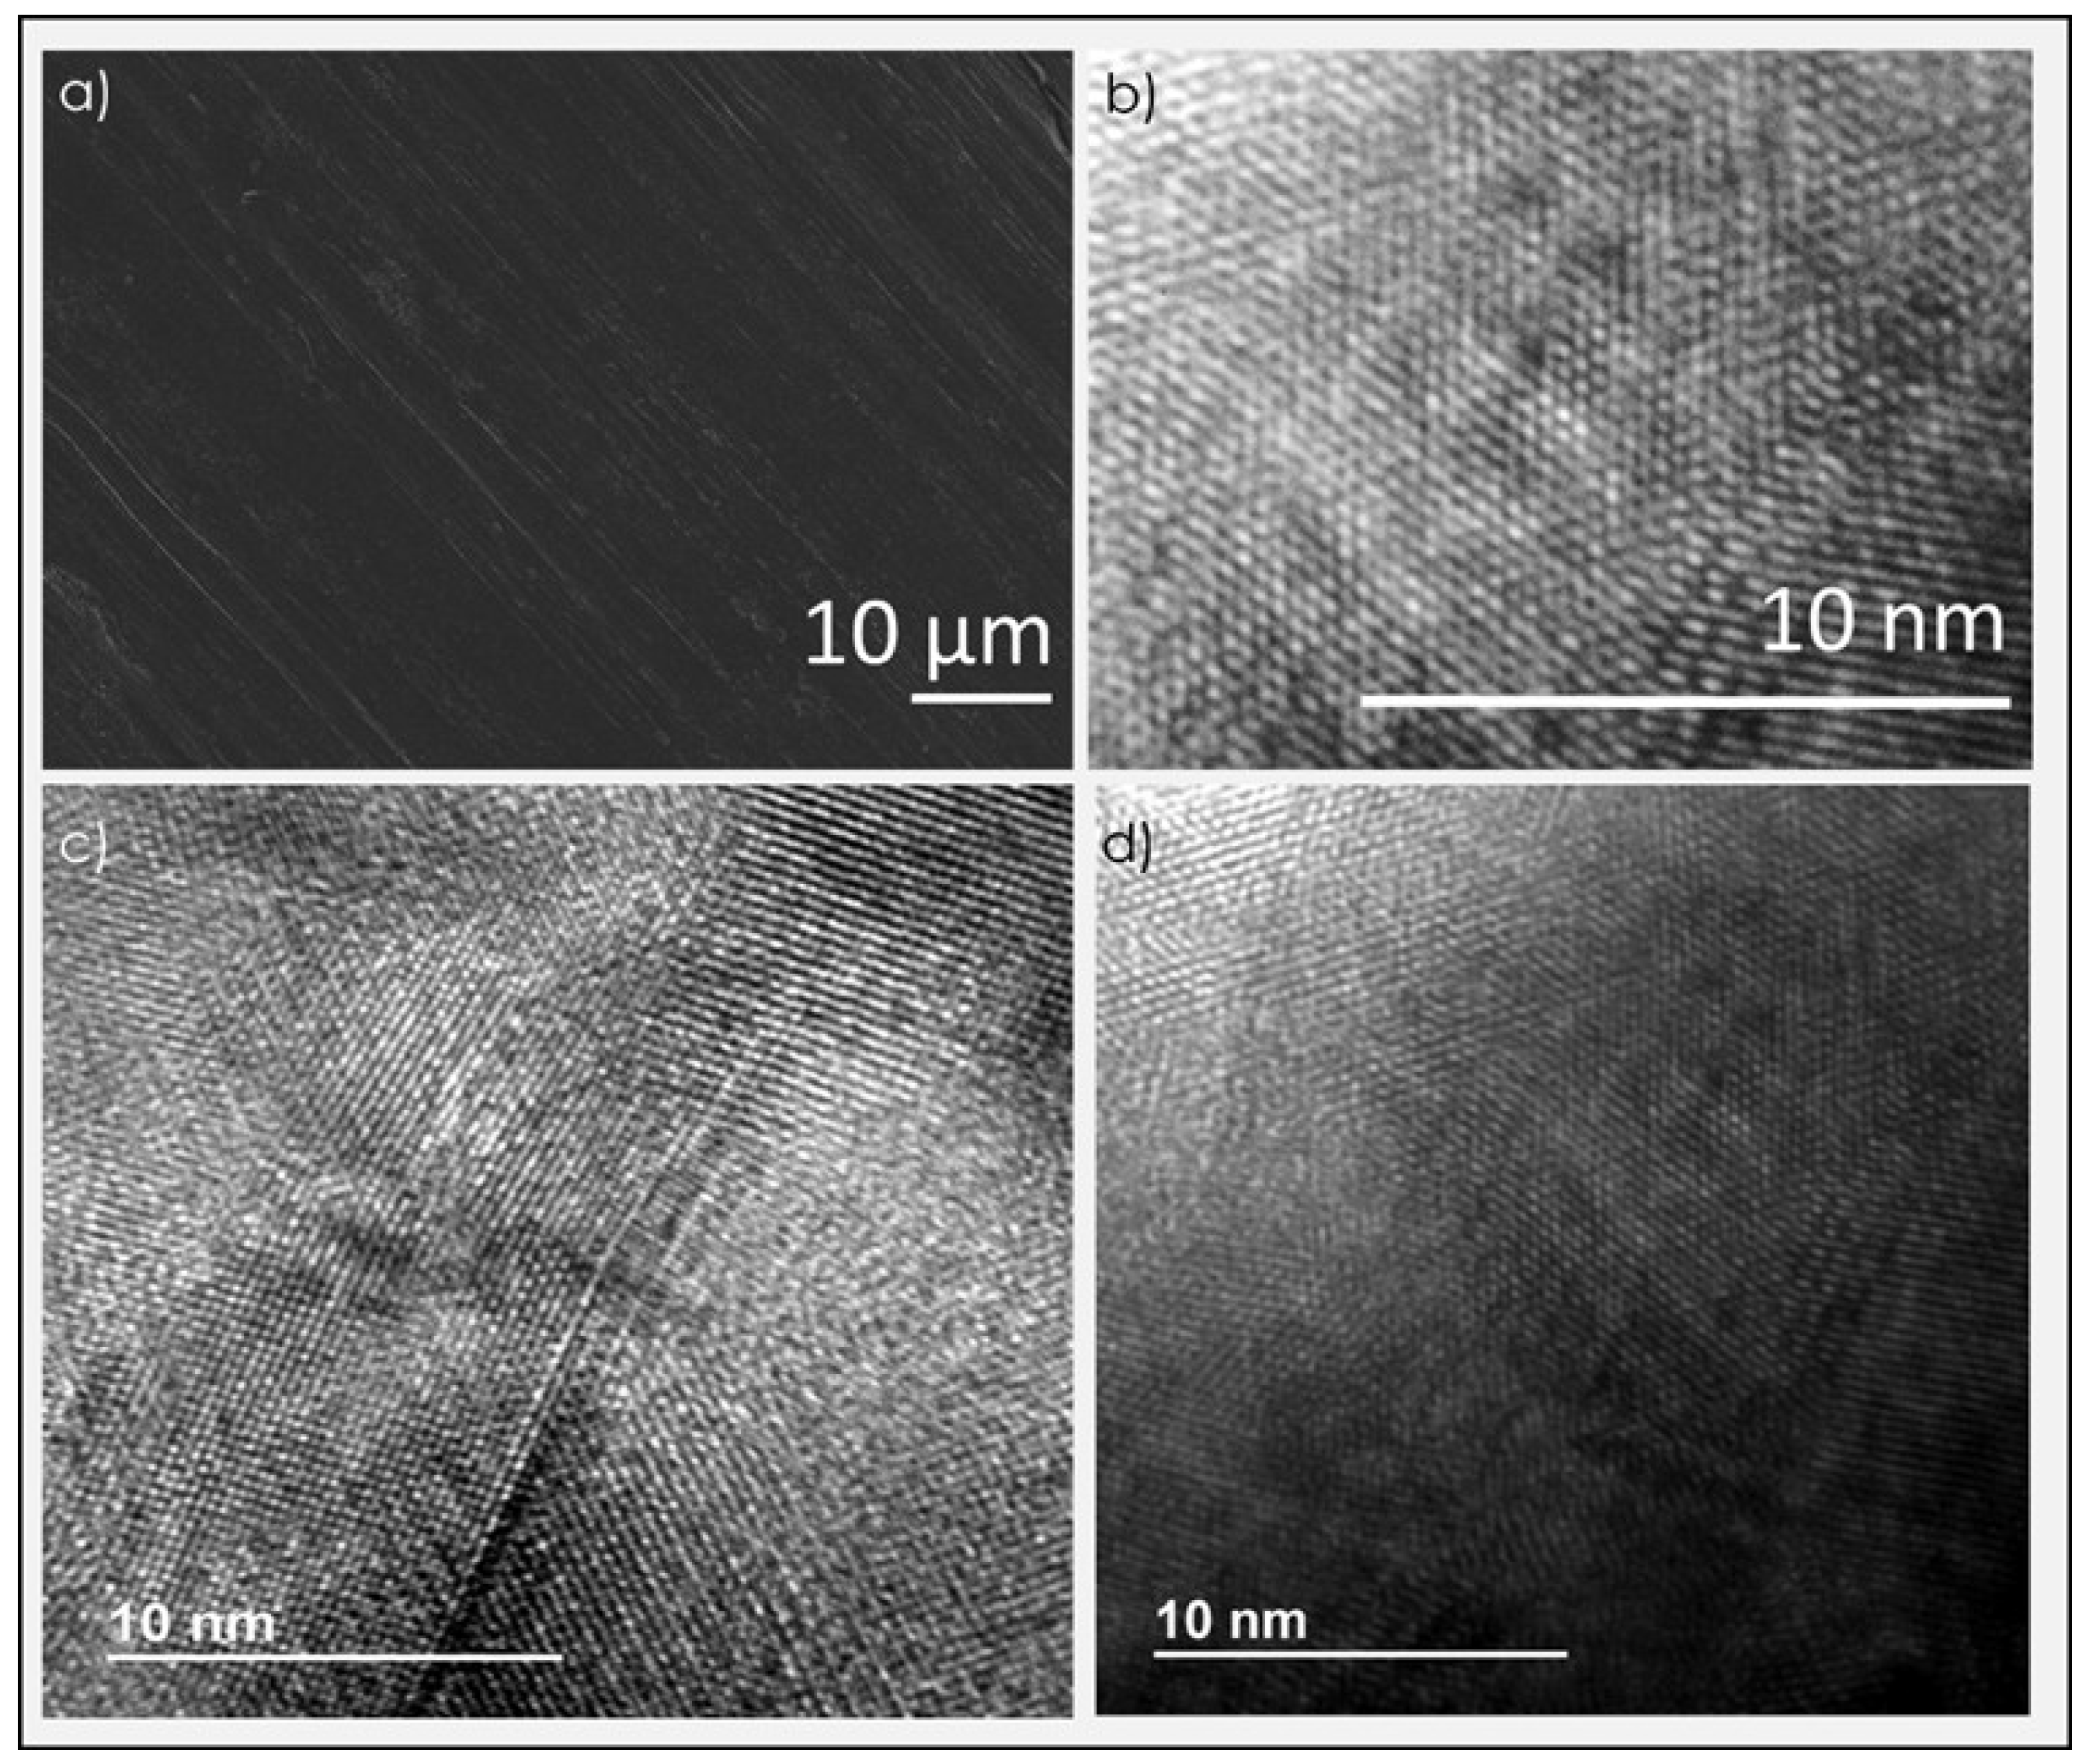
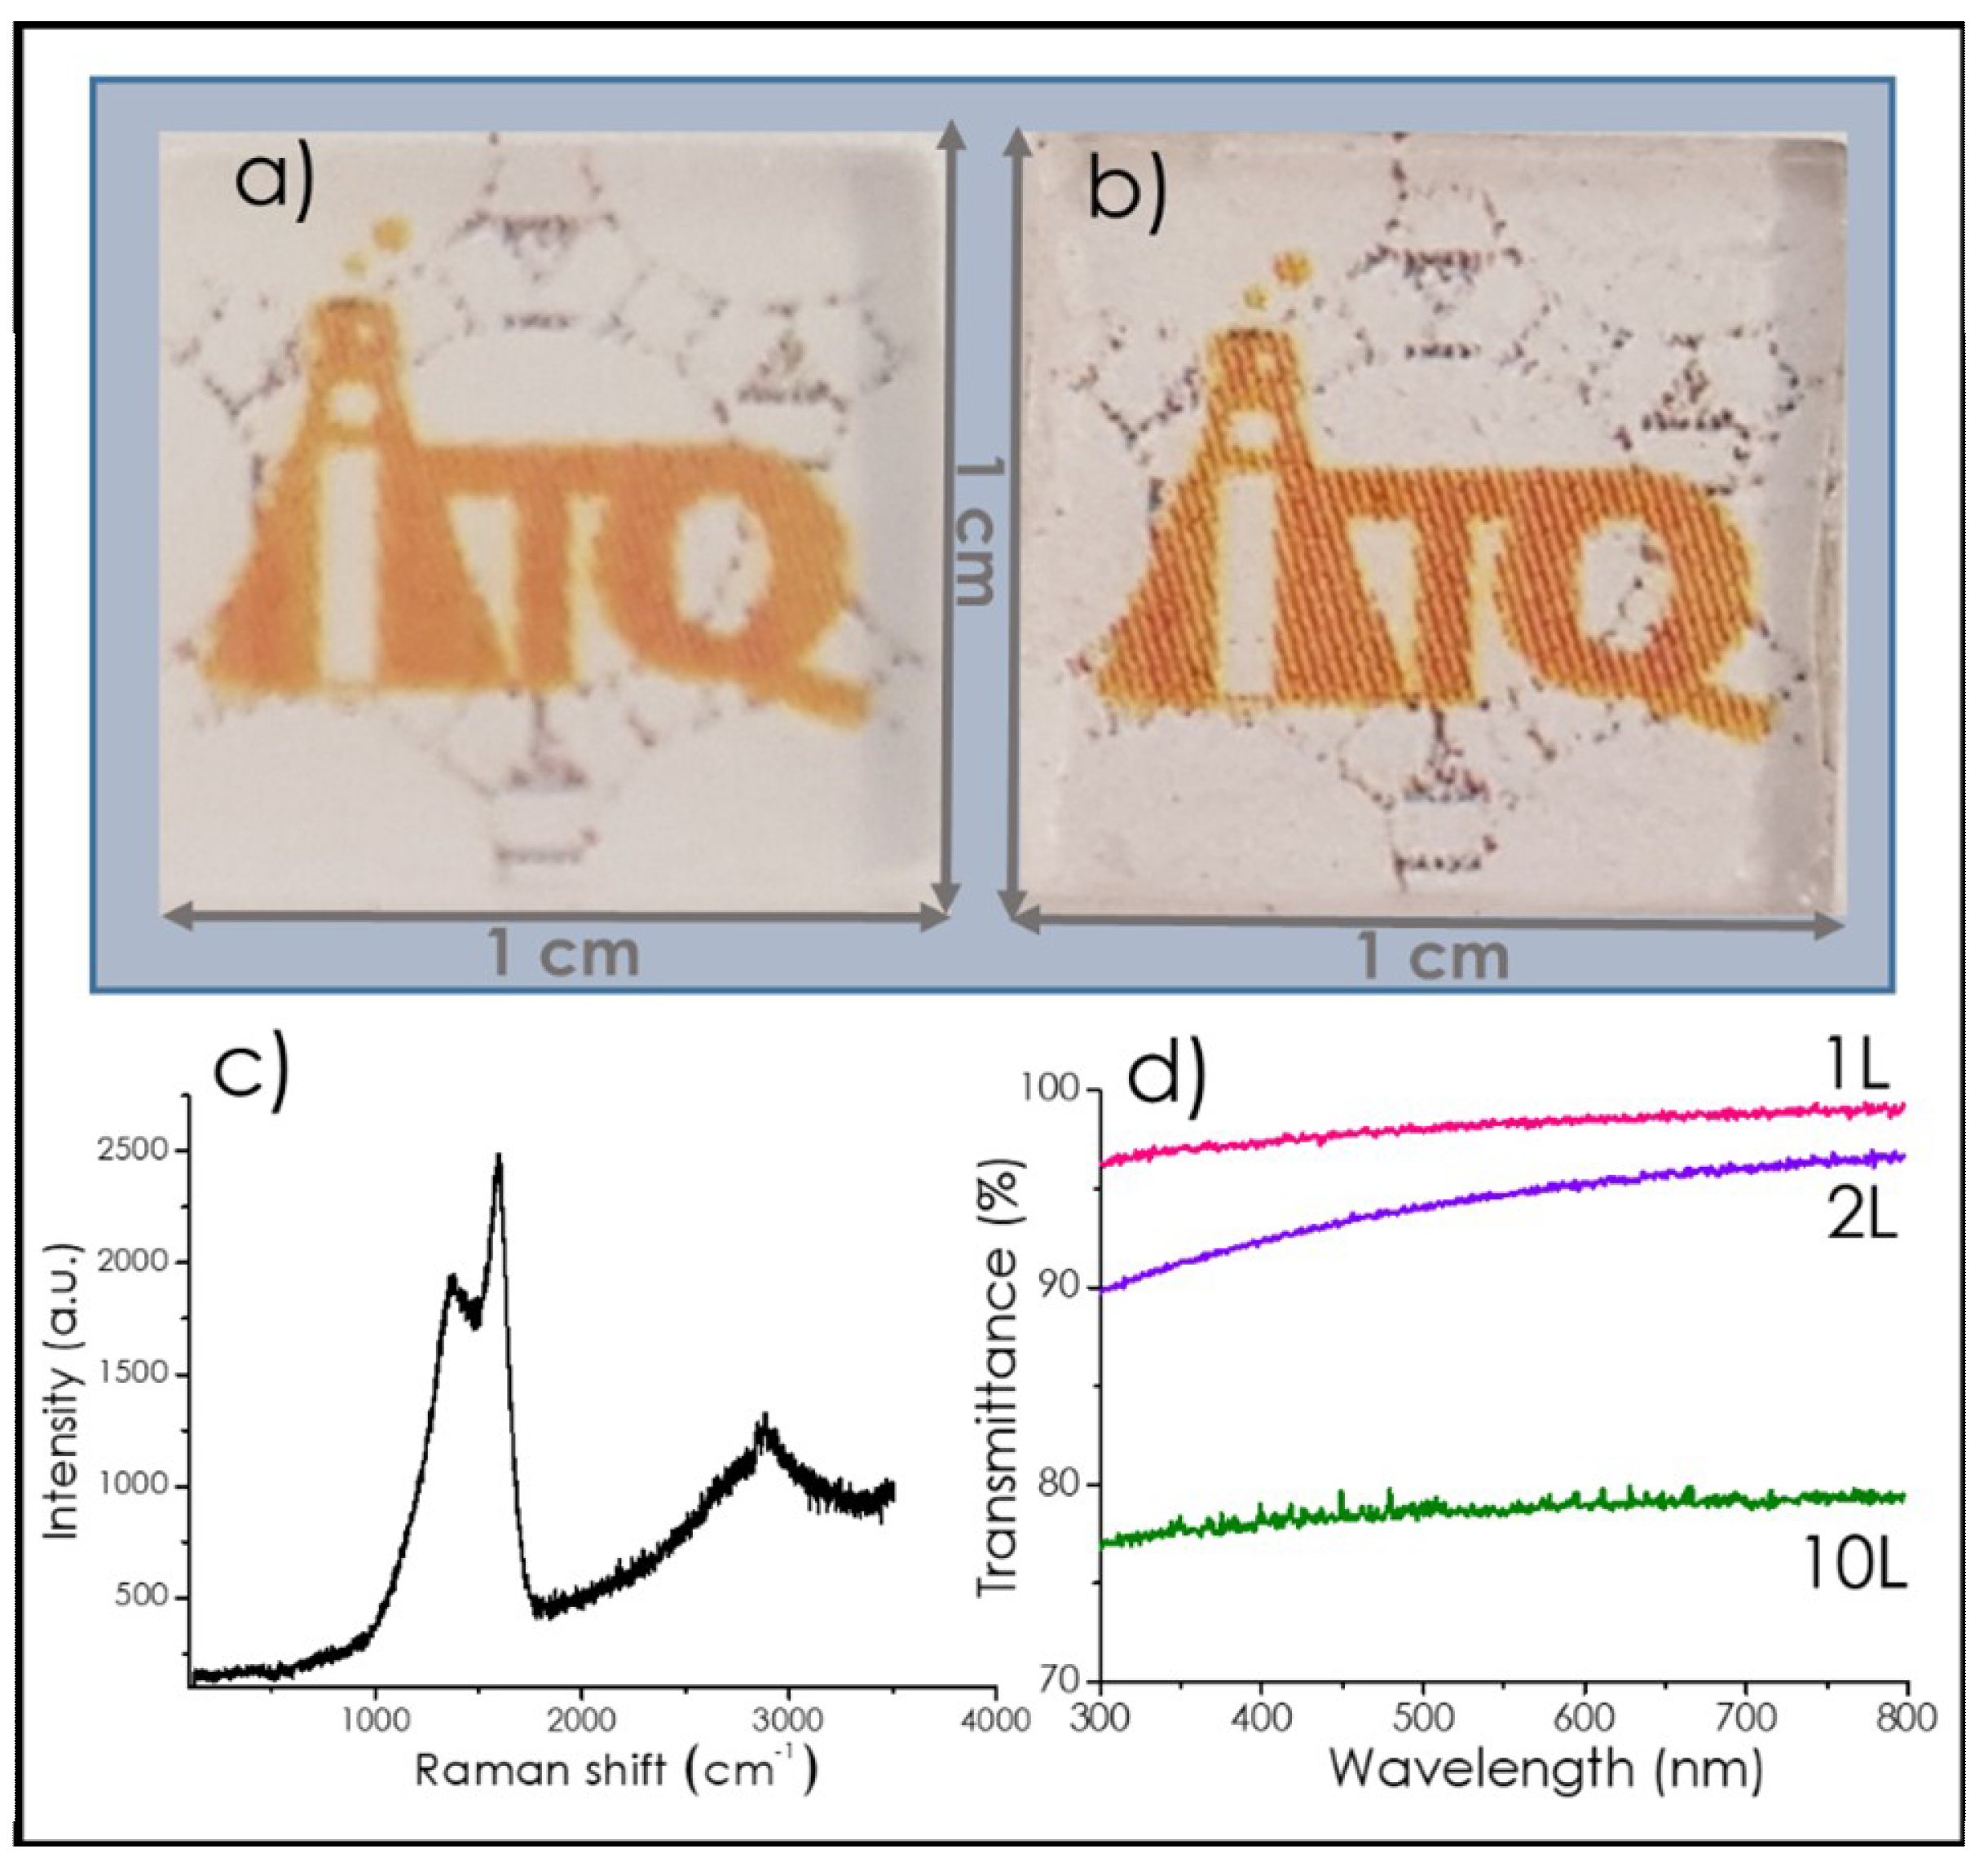
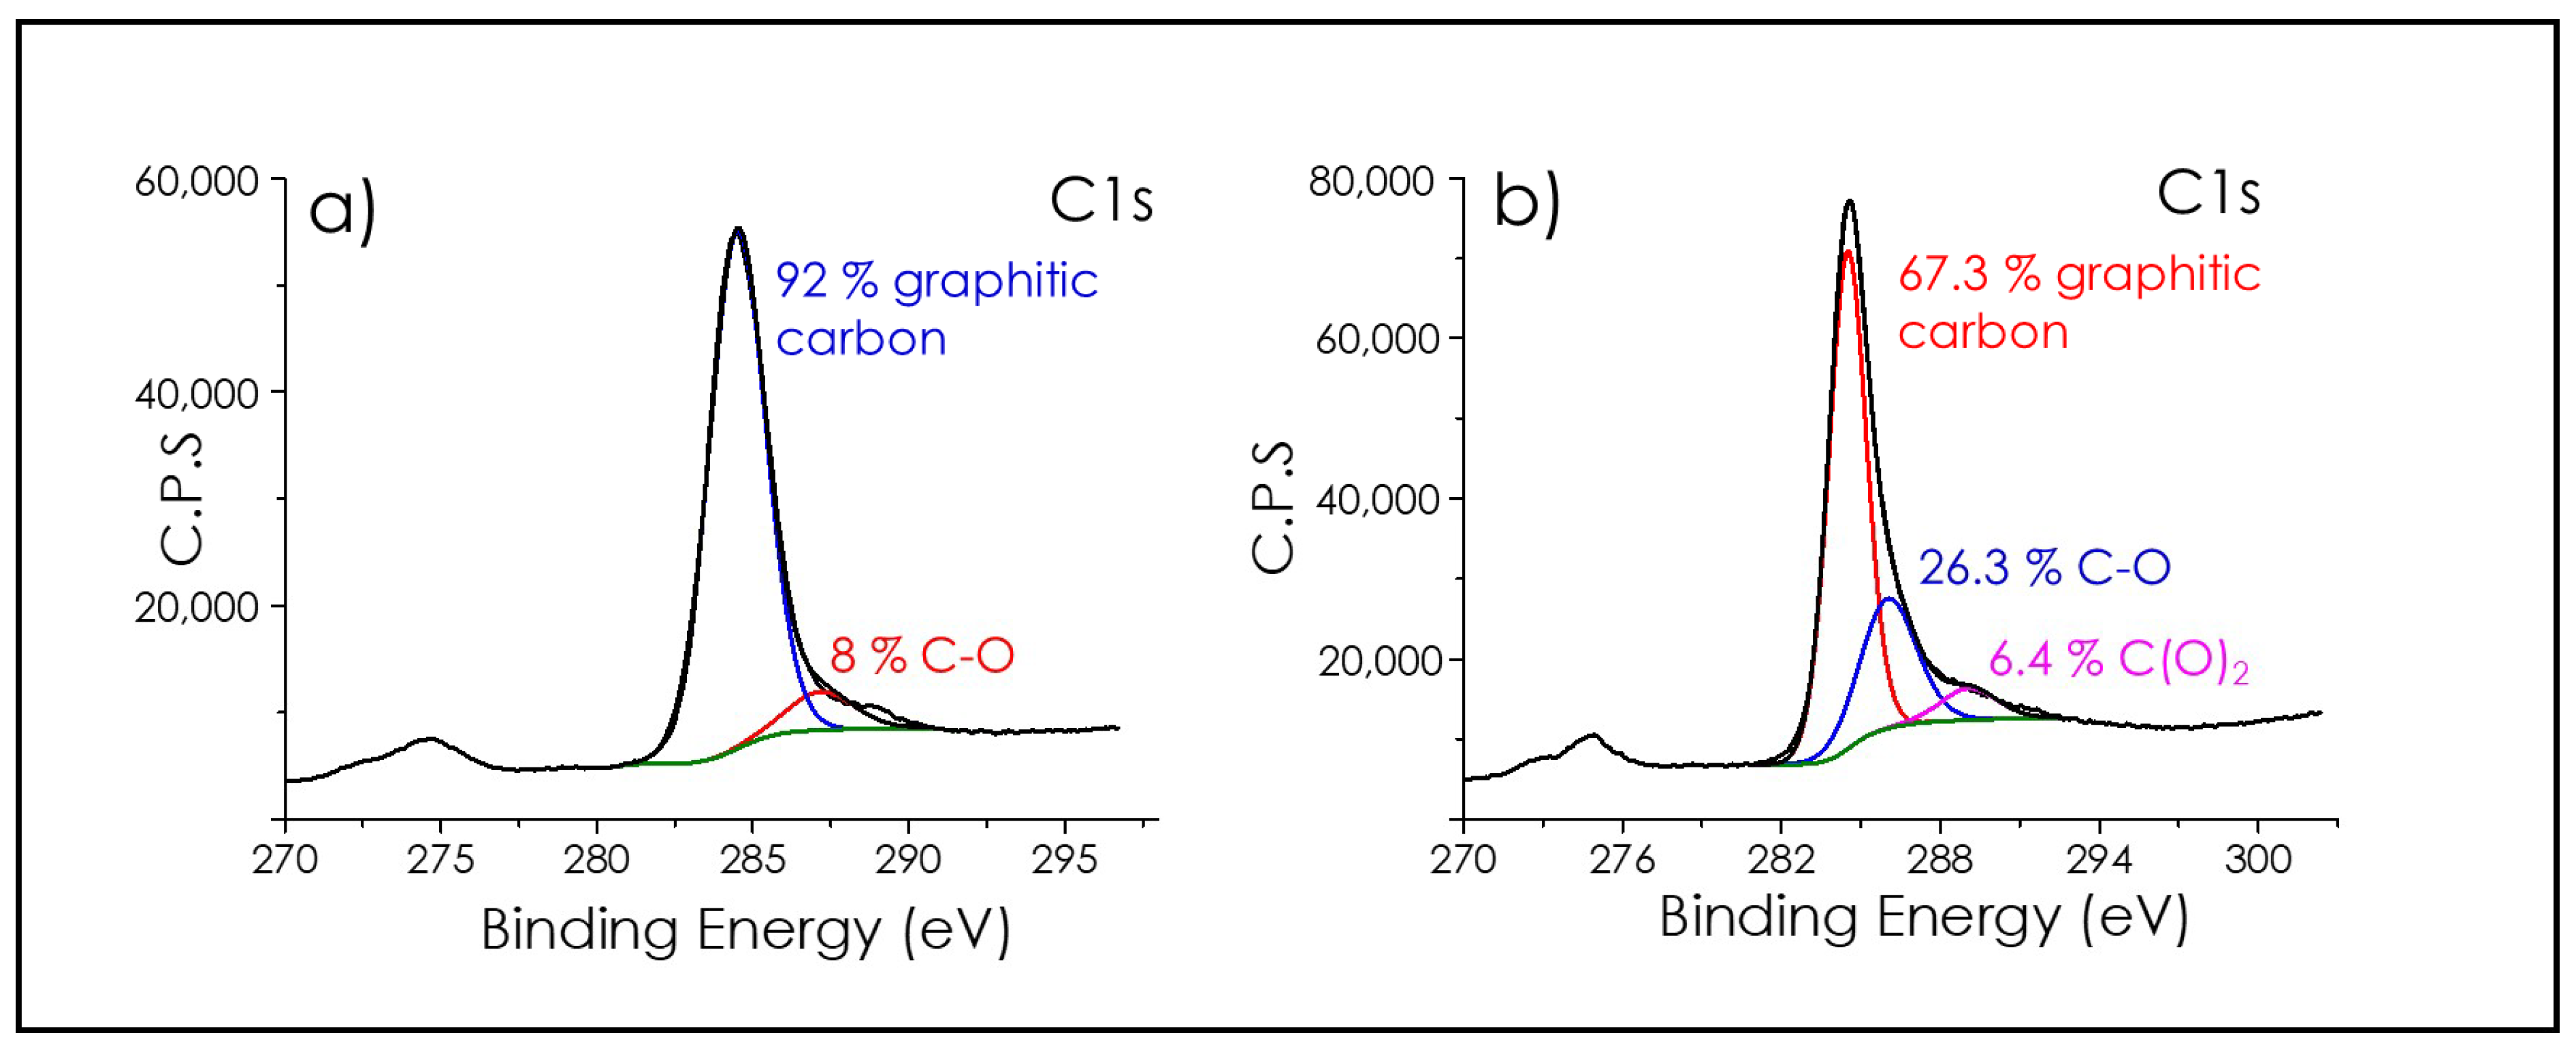
3.1. Graphene Films
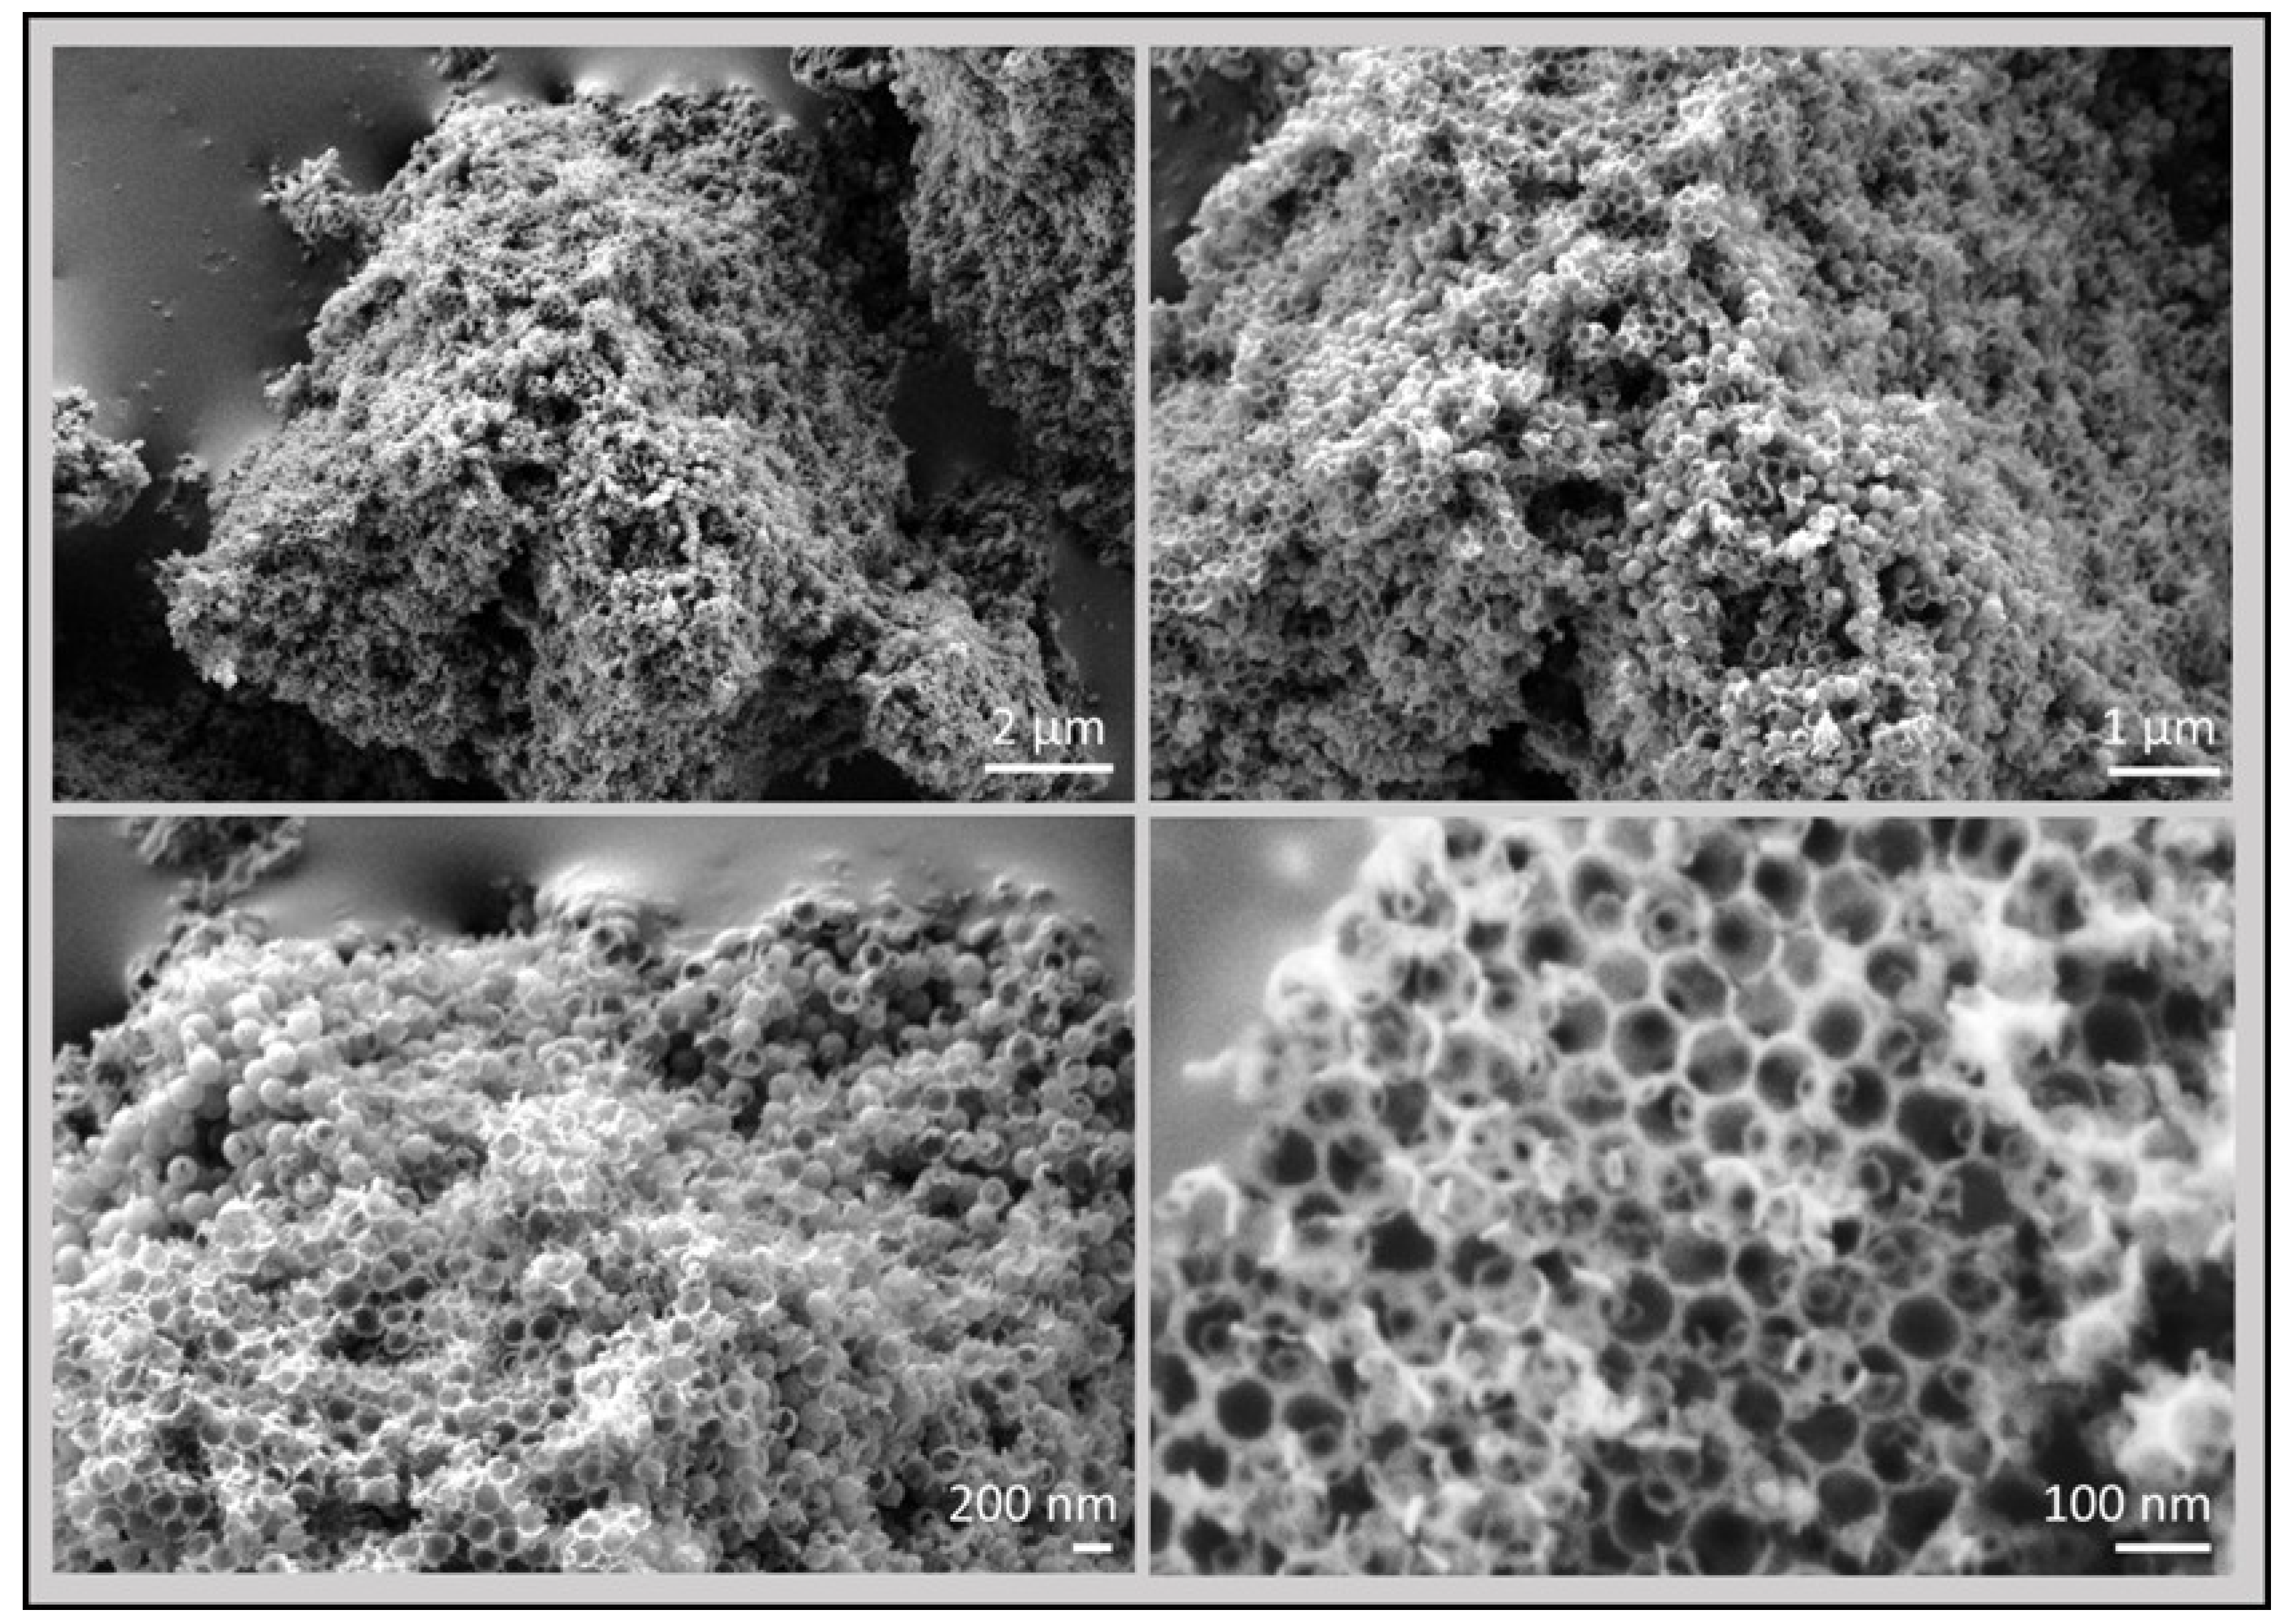
3.2. 3D Graphene Sponges
4. Conclusions
Supplementary Materials
Author Contributions
Funding
Acknowledgments
Conflicts of Interest
References
- Scheirs, J.; Kaminsky, W. Feedstock Recycling and Pyrolysis of Waste Plastics; John Wiley & Sons: Chichester, UK, 2006. [Google Scholar]
- Kaminsky, W. Chemical recycling of mixed plastics of pyrolysis. Adv. Polym. Technol. J. Polym. Process. Inst. 1995, 14, 337–344. [Google Scholar] [CrossRef]
- Atherton, E. Pyrolysis of polystyrene. J. Polym. Sci. 1950, 5, 378–379. [Google Scholar] [CrossRef]
- Karaduman, A.; Şimşek, E.; Cicek, B.; Bilgesü, A. Flash pyrolysis of polystyrene wastes in a free-fall reactor under vacuum. J. Anal. Appl. Pyrolysis 2001, 60, 179–186. [Google Scholar] [CrossRef]
- Kim, S.-S.; Kim, S. Pyrolysis characteristics of polystyrene and polypropylene in a stirred batch reactor. Chem. Eng. J. 2004, 98, 53–60. [Google Scholar] [CrossRef]
- Liu, Y.; Qian, J.; Wang, J. Pyrolysis of polystyrene waste in a fluidized-bed reactor to obtain styrene monomer and gasoline fraction. Fuel Process. Technol. 2000, 63, 45–55. [Google Scholar] [CrossRef]
- Bradt, P.; Dibeler, V.H.; Mohler, F.L. A new technique for the mass spectrometric study of the pyrolysis products of polystyrene. J. Res. Natl. Bur. Stand. 1953, 50, 201–202. [Google Scholar] [CrossRef]
- Cameron, G. Mechanism of volatile production during pyrolysis of polystyrene. Die Makromol. Chem. Macromol. Chem. Phys. 1967, 100, 255–261. [Google Scholar] [CrossRef]
- Hussain, Z.; Khan, K.M.; Perveen, S.; Hussain, K.; Voelter, W. The conversion of waste polystyrene into useful hydrocarbons by microwave-metal interaction pyrolysis. Fuel Process. Technol. 2012, 94, 145–150. [Google Scholar] [CrossRef]
- Onwudili, J.A.; Insura, N.; Williams, P.T. Composition of products from the pyrolysis of polyethylene and polystyrene in a closed batch reactor: Effects of temperature and residence time. J. Anal. Appl. Pyrolysis 2009, 86, 293–303. [Google Scholar] [CrossRef]
- Kaminsky, W.; Predel, M.; Sadiki, A. Feedstock recycling of polymers by pyrolysis in a fluidised bed. Polym. Degrad. Stab. 2004, 85, 1045–1050. [Google Scholar] [CrossRef]
- Angyal, A.; Miskolczi, N.; Bartha, L. Petrochemical feedstock by thermal cracking of plastic waste. J. Anal. Appl. Pyrolysis 2007, 79, 409–414. [Google Scholar] [CrossRef]
- Miandad, R.; Nizami, A.; Rehan, M.; Barakat, M.; Khan, M.; Mustafa, A.; Ismail, I.; Murphy, J. Influence of temperature and reaction time on the conversion of polystyrene waste to pyrolysis liquid oil. Waste Manag. 2016, 58, 250–259. [Google Scholar] [CrossRef] [PubMed]
- Primo, A.; Atienzar, P.; Sanchez, E.; Delgado, J.M.; García, H. From biomass wastes to large-area, high-quality, n-doped graphene: Catalyst-free carbonization of chitosan coatings on arbitrary substrates. Chem. Commun. 2012, 48, 9254–9256. [Google Scholar] [CrossRef]
- Primo, A.; Sánchez, E.; Delgado, J.M.; García, H. High-yield production of n-doped graphitic platelets by aqueous exfoliation of pyrolyzed chitosan. Carbon 2014, 68, 777–783. [Google Scholar] [CrossRef]
- Latorre-Sánchez, M.; Primo, A.; García, H. P-doped graphene obtained by pyrolysis of modified alginate as a photocatalyst for hydrogen generation from water–methanol mixtures. Angew. Chem. Int. Ed. 2013, 52, 11813–11816. [Google Scholar] [CrossRef]
- Dhakshinamoorthy, A.; Primo, A.; Concepcion, P.; Alvaro, M.; Garcia, H. Doped graphene as a metal-free carbocatalyst for the selective aerobic oxidation of benzylic hydrocarbons, cyclooctane and styrene. Chem. Eur. J. 2013, 19, 7547–7554. [Google Scholar] [CrossRef]
- Dhakshinamoorthy, A.; Latorre-Sanchez, M.; Asiri, A.M.; Primo, A.; Garcia, H. Sulphur-doped graphene as metal-free carbocatalysts for the solventless aerobic oxidation of styrenes. Catal. Commun. 2015, 65, 10–13. [Google Scholar] [CrossRef]
- Shearer, C.J.; Slattery, A.D.; Stapleton, A.J.; Shapter, J.G.; Gibson, C.T. Accurate thickness measurement of graphene. Nanotechnology 2016, 27, 125704. [Google Scholar] [CrossRef]
- Ferrari, A.C.; Meyer, J.; Scardaci, V.; Casiraghi, C.; Lazzeri, M.; Mauri, F.; Piscanec, S.; Jiang, D.; Novoselov, K.; Roth, S. Raman spectrum of graphene and graphene layers. Phys. Rev. Lett. 2006, 97, 187401. [Google Scholar] [CrossRef]
- Cançado, L.G.; Jorio, A.; Ferreira, E.M.; Stavale, F.; Achete, C.; Capaz, R.; Moutinho, M.; Lombardo, A.; Kulmala, T.; Ferrari, A. Quantifying defects in graphene via raman spectroscopy at different excitation energies. Nano Lett. 2011, 11, 3190–3196. [Google Scholar] [CrossRef]
- Eigler, S.; Dotzer, C.; Hirsch, A. Visualization of defect densities in reduced graphene oxide. Carbon 2012, 50, 3666–3673. [Google Scholar] [CrossRef]
- Stankovich, S.; Dikin, D.A.; Piner, R.D.; Kohlhaas, K.A.; Kleinhammes, A.; Jia, Y.; Wu, Y.; Nguyen, S.T.; Ruoff, R.S. Synthesis of graphene-based nanosheets via chemical reduction of exfoliated graphite oxide. Carbon 2007, 45, 1558–1565. [Google Scholar] [CrossRef]
- Reina, A.; Jia, X.; Ho, J.; Nezich, D.; Son, H.; Bulovic, V.; Dresselhaus, M.S.; Kong, J. Large area, few-layer graphene films on arbitrary substrates by chemical vapor deposition. Nano Lett. 2008, 9, 30–35. [Google Scholar] [CrossRef] [PubMed]
- Wassei, J.K.; Kaner, R.B. Graphene, a promising transparent conductor. Mater. Today 2010, 13, 52–59. [Google Scholar] [CrossRef]
- Panchakarla, L.; Subrahmanyam, K.; Saha, S.; Govindaraj, A.; Krishnamurthy, H.; Waghmare, U.; Rao, C. Synthesis, structure, and properties of boron-and nitrogen-doped graphene. Adv. Mater. 2009, 21, 4726–4730. [Google Scholar] [CrossRef]
- Varykhalov, A.; Sánchez-Barriga, J.; Shikin, A.; Biswas, C.; Vescovo, E.; Rybkin, A.; Marchenko, D.; Rader, O. Electronic and magnetic properties of quasifreestanding graphene on ni. Phys. Rev. Lett. 2008, 101, 157601. [Google Scholar] [CrossRef]
- Casero, E.; Parra-Alfambra, A.; Petit-Domínguez, M.; Pariente, F.; Lorenzo, E.; Alonso, C. Differentiation between graphene oxide and reduced graphene by electrochemical impedance spectroscopy (eis). Electrochem. Commun. 2012, 20, 63–66. [Google Scholar] [CrossRef]
- Bonanni, A.; Pumera, M. High-resolution impedance spectroscopy for graphene characterization. Electrochem. Commun. 2013, 26, 52–54. [Google Scholar] [CrossRef]
- Song, Y.; Feng, M.; Zhan, H. Geometry-dependent electrochemistry of graphene oxide family. Electrochem. Commun. 2015, 56, 38–42. [Google Scholar] [CrossRef]
- Zhang, L.; Zhang, F.; Yang, X.; Long, G.; Wu, Y.; Zhang, T.; Leng, K.; Huang, Y.; Ma, Y.; Yu, A. Porous 3d graphene-based bulk materials with exceptional high surface area and excellent conductivity for supercapacitors. Sci. Rep. 2013, 3, 1408. [Google Scholar] [CrossRef]
- Zhao, J.; Ren, W.; Cheng, H.-M. Graphene sponge for efficient and repeatable adsorption and desorption of water contaminations. J. Mater. Chem. 2012, 22, 20197–20202. [Google Scholar] [CrossRef]
- Gao, H.; Duan, H. 2d and 3d graphene materials: Preparation and bioelectrochemical applications. Biosens. Bioelectron. 2015, 65, 404–419. [Google Scholar] [CrossRef] [PubMed]
- Zhou, G.; Paek, E.; Hwang, G.S.; Manthiram, A. Long-life li/polysulphide batteries with high sulphur loading enabled by lightweight three-dimensional nitrogen/sulphur-codoped graphene sponge. Nat. Commun. 2015, 6, 7760. [Google Scholar] [CrossRef] [PubMed]
- Han, S.; Wu, D.; Li, S.; Zhang, F.; Feng, X. Porous graphene materials for advanced electrochemical energy storage and conversion devices. Adv. Mater. 2014, 26, 849–864. [Google Scholar] [CrossRef] [PubMed]
- Huang, X.; Qian, K.; Yang, J.; Zhang, J.; Li, L.; Yu, C.; Zhao, D. Functional nanoporous graphene foams with controlled pore sizes. Adv. Mater. 2012, 24, 4419–4423. [Google Scholar] [CrossRef] [PubMed]
- Xia, X.; Chao, D.; Zhang, Y.Q.; Shen, Z.X.; Fan, H.J. Three-dimensional graphene and their integrated electrodes. Nano Today 2014, 9, 785–807. [Google Scholar] [CrossRef]
- Stöber, W.; Fink, A.; Bohn, E. Controlled growth of monodisperse silica spheres in the micron size range. J. Colloid Interface Sci. 1968, 26, 62–69. [Google Scholar] [CrossRef]


© 2019 by the authors. Licensee MDPI, Basel, Switzerland. This article is an open access article distributed under the terms and conditions of the Creative Commons Attribution (CC BY) license (http://creativecommons.org/licenses/by/4.0/).
Share and Cite
Rendón-Patiño, A.; Niu, J.; Doménech-Carbó, A.; García, H.; Primo, A. Polystyrene as Graphene Film and 3D Graphene Sponge Precursor. Nanomaterials 2019, 9, 101. https://doi.org/10.3390/nano9010101
Rendón-Patiño A, Niu J, Doménech-Carbó A, García H, Primo A. Polystyrene as Graphene Film and 3D Graphene Sponge Precursor. Nanomaterials. 2019; 9(1):101. https://doi.org/10.3390/nano9010101
Chicago/Turabian StyleRendón-Patiño, Alejandra, Jinan Niu, Antonio Doménech-Carbó, Hermenegildo García, and Ana Primo. 2019. "Polystyrene as Graphene Film and 3D Graphene Sponge Precursor" Nanomaterials 9, no. 1: 101. https://doi.org/10.3390/nano9010101
APA StyleRendón-Patiño, A., Niu, J., Doménech-Carbó, A., García, H., & Primo, A. (2019). Polystyrene as Graphene Film and 3D Graphene Sponge Precursor. Nanomaterials, 9(1), 101. https://doi.org/10.3390/nano9010101