Article

Failure Characteristics and Mechanism of Nano-Modified Oil-Impregnated Paper Subjected to Repeated Impulse Voltage

1
State Key Laboratory of Power Transmission Equipment & System Security and New Technology, Chongqing University, Chongqing 400030, China
2
College of Engineering Materials, Chongqing University, Chongqing 400030, China
3
Department of Electrical and Computer Engineering, University of Florida, Gainesville, FL 32611, USA
*
Author to whom correspondence should be addressed.
Nanomaterials 2018, 8(7), 504; https://doi.org/10.3390/nano8070504
Submission received: 12 June 2018 / Revised: 4 July 2018 / Accepted: 4 July 2018 / Published: 7 July 2018
(This article belongs to the Special Issue Impacts of Nanomaterial Modifications)

Abstract

:
Nano-modification is a prospective method for improving the electrical properties of transformer oil. In most situations, transformer oil combined with cellulose paper is used to construct an insulation system for power equipment, such as power transformers. However, the influence of nanoparticles on the electrical performance of oil-impregnated paper is still unclear. Therefore, in this paper, we identify the failure characteristics of both fresh and nano-modified oil/paper. Specifically, the accumulative failure characteristics of nano-oil-impregnated paper (NOIP) are experimentally determined. The space charge distribution and trap characteristics of fresh paper and NOIP were measured, and the effect of nanoparticles on the space charge behavior are then analyzed. Finally, we measure the microstructure of fresh paper and NOIP subjected to repeated impulses. The test results indicate that nano-titanium oxide (TiO2) particles have a limited effect on the breakdown voltage of NOIP. However, the particles can dramatically improve the resistant ability of NOIP against repeated impulses. For the NOIP with a nano-concentration of 0.25 g/L, the improvement reaches 62.5% compared with fresh paper. Under repeated applications of impulse voltages, the space charge density of NOIP is much lower than that of fresh paper. The deep trap density of NOIP is much higher than that of fresh OIP, whereas shallow trap density is relatively lower. Micropores are generated in paper insulation subjected to repeated impulses. The amount of the generated micropores in NOIP is lower than that in fresh paper. Nano-TiO2 particles suppress the accumulation of space charge in the oil paper insulation, which weakens the electric field distortion in the dielectric. However, nanoparticles reduce the accumulative damage caused by repeated impulses. The above two points are considered the main reasons to improve the resistant ability against repeated impulses.

1. Introduction

A particularly novel approach to improving the properties of transformer oil has been developed by suspending nanoparticles in transformer oil. The test results indicate that the insulating performance, heat dissipation performance, and anti-aging performance of nano-modified oil are improved to different degrees [1,2,3,4,5,6]. Segal et al. successively found that the breakdown voltages of nano-modified transformer oils increase by different degrees (the test nanoparticles include Al2O3, TiO2, Fe3O4, SiO2, carbon nanotube and so on) [7,8,9,10,11]. The breakdown voltage of nano-oils can even reach 3.3 times that of pure oil [12]. Some disadvantages of nano-oil were also found including increasing dielectric loss [13], agglomeration [14], decreasing the negative breakdown voltage [15] and migration under external electric/magnetic field [16]. Although the industrial application of nano-fluids still requires development due to these limitations, the application of nanoparticles in the insulation area is still considered as having potential [17,18,19,20,21].
For over 100 years, cellulose paper combined with insulation oil have been used as the insulation system for power transformers. Cellulose paper is impregnated with transformer oil to create a composite insulation called oil-impregnated paper (OIP) with good electrical performance. Many studies have focused on nano-modified transformer oil, but cellulose paper impregnated with nano-modified transformer oil (nano-oil-impregnated paper, NOIP) has rarely been studied, including the effects of nano-modified transformer oil on the performance of NOIP and the mechanism of nanoparticles.
Among the characteristics of OIP, breakdown under impulse voltage is an important indicator for evaluating the modification effect of nanoparticles. We have been monitoring a 110 kV power transformer in China for a long time. Monitoring results revealed that more than 50 lightning impulses invaded this transformer each year [22,23,24,25]. The number of recorded switching impulses was even higher at four to five per day. If we assume the lifetime of a power transformer is 30 years, this transformer will be subjected to more than 40,000 impulses. Such repeated impulses may cause irreversible damage to insulation dielectrics, or even premature failure. This phenomenon is known as accumulative dielectric failure, which was studied in our previous work [21,22,23,24,25,26]. Therefore, focusing on the above problems, the breakdown characteristics and accumulative failure characteristics of both OIP and NOIP were determined in this work. The corresponding mechanisms behind the observed phenomena were also analyzed.
Here, we present our work in this area with respect to the effect of nano-TiO2 particles on the accumulative failure of OIP. First, we determine the breakdown characteristics of nano-modified transformer oil (NMTO), fresh transformer oil (FTO), NOIP, and OIP. The accumulative failure characteristics of NOIP and OIP are also identified. Then, we measure the space charge distribution in OIP and NOIP subjected to repeated impulses. The total space charge amount and space charge decay rate of both OIP and NOIP with different nanoparticle concentrations are calculated. Finally, we measure the surface morphology and micropore structure of fresh OIP and OIP/NOIP subjected to repeated impulses.
The remainder of the paper is structured as follows. The experimental setup is presented in Section 2, and the tests for the breakdown characteristics are described in Section 3. The mechanisms are discussed in Section 4, and finally conclusions end the paper in Section 5.

2. Experimental Setup

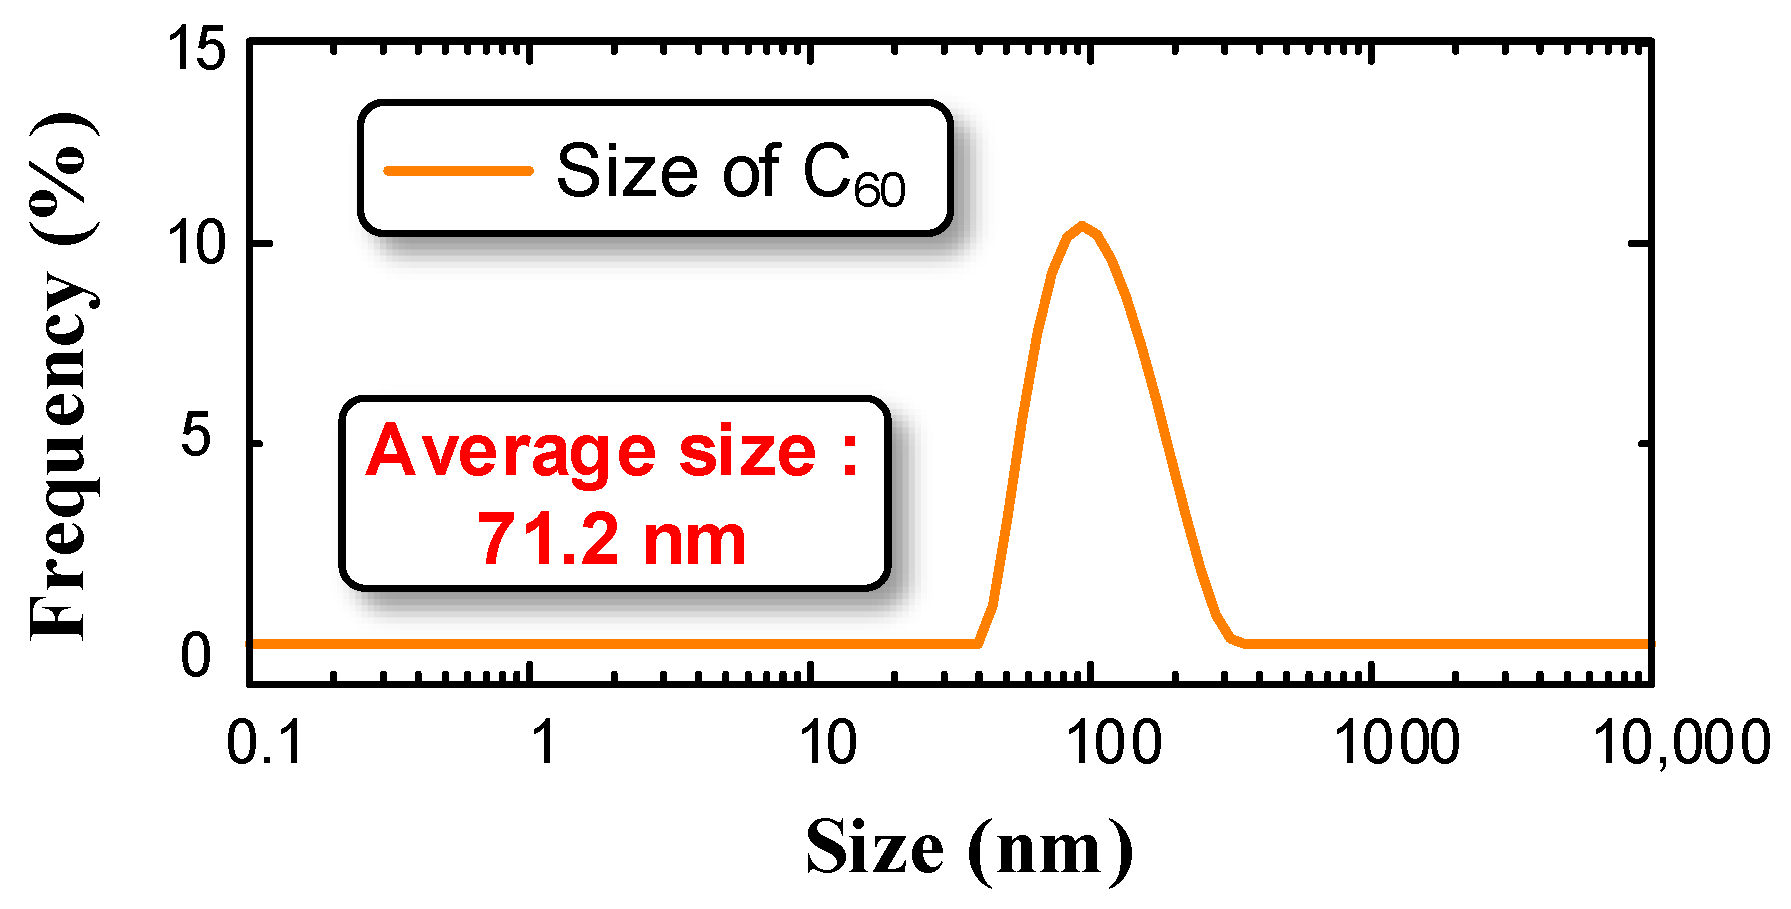
2.1. Preparation of Nanofluids

Karamay transformer mineral oil (#25) was selected as the base oil. All the test oil was filtered by a vacuum oil-filter to remove the impurities. The technical specifications of the test materials satisfy the international standard ASTM D3487-2000(II) [27] and the value recommended by the CIGRE working group 12.17 [28]. The nanofluid was prepared as follows.
Stearic acid was used as surface modifier. TiO2 nanoparticles were mixed with stearic acid and placed in a water bath case at 60 °C. The mixture was stirred by a mechanical agitator for 2 h. When the mixture was evenly mixed, we added transformer oil to the beaker containing the nano-TiO2 mixture. Ultrasonic dispersion was then conducted for 45 min. All the nano-modified transformer oil (NMTO) was dried at 90 °C for 48 h in a vacuum drying oven. After the pre-treatments, all the samples were sealed in glassware stored in a cool, dry, isolated, and well-ventilated storage area.
We measured the size distribution of nano-TiO2 particles contained in nanofluid as shown in Figure 1. The average particle size was 71.2 nm.
A laser beam was shot into the nanofluid to measure the stability of nanoparticles. Light-transmission coefficient of nanofluids, which is the ratio of output light intensity to incident light intensity, was measured every 8 h. The light-transmission coefficient remained stable after 120 h. The test results indicate that the nano-TiO2 particles dispersed steadily in the base oil.
The pre-treatments of OIP and NOIP were as follows: first, cellulose paper and transformer oil/NMTO were separately dried at 90 °C for 48 h in a vacuum drying oven. Oil impregnation was then conducted for another 48 h using FTO/NMTO that had been purified and vacuum degassed.

2.2. Breakdown Test Platform and Test Method

The test setup is shown in Figure 2. A cylindrical steel test cell with a good sealing performance was used to hold the electrodes and test samples. Needle-plate electrodes and column-column electrodes were selected for the oil breakdown test and OIP breakdown test, respectively [29,30,31]. Two copper rods connecting to the electrodes were fixed on the test cell, serving as the high voltage terminal and grounding terminal. Given that oil paper is normally used as multilayer insulation in power transformers, three layers of the OIP samples (thickness: 55 μm per layer) were placed between the electrodes. An impulse generator was used to output standard impulse voltage (30 kJ/400 kV). Voltage and current signals were measured by a high voltage divider and current sensor, respectively. The data were recorded by a TDS2024C impulse analysis system. The parameters of the electrodes are shown in Table 1.
The up and down method was used to determine the 50% breakdown voltage (U50) of the test samples [32,33]. The number of valid data for each test was more than 50. The test procedure for the accumulative effect test is outlined in detail in our previous work [22,23,24,26].

2.3. Measurement Parameters

2.3.1. Pulsed Electro-Acoustic (PEA)

The space charge distribution of NOIP/OIP subjected to repeated impulse voltage was measured using the PEA method. The schematic diagram of the PEA test system is shown in Figure 3. Our testing procedures are as follows:
  • Apply repeated impulse voltage to the OIP sample and NOIP sample with different nanoparticle concentrations.
  • Transfer the test sample to the PEA measurement system. The transfer interval time is less than 15 s.
  • Measure the space charge distribution of NOIP/OIP sample at a specified time.

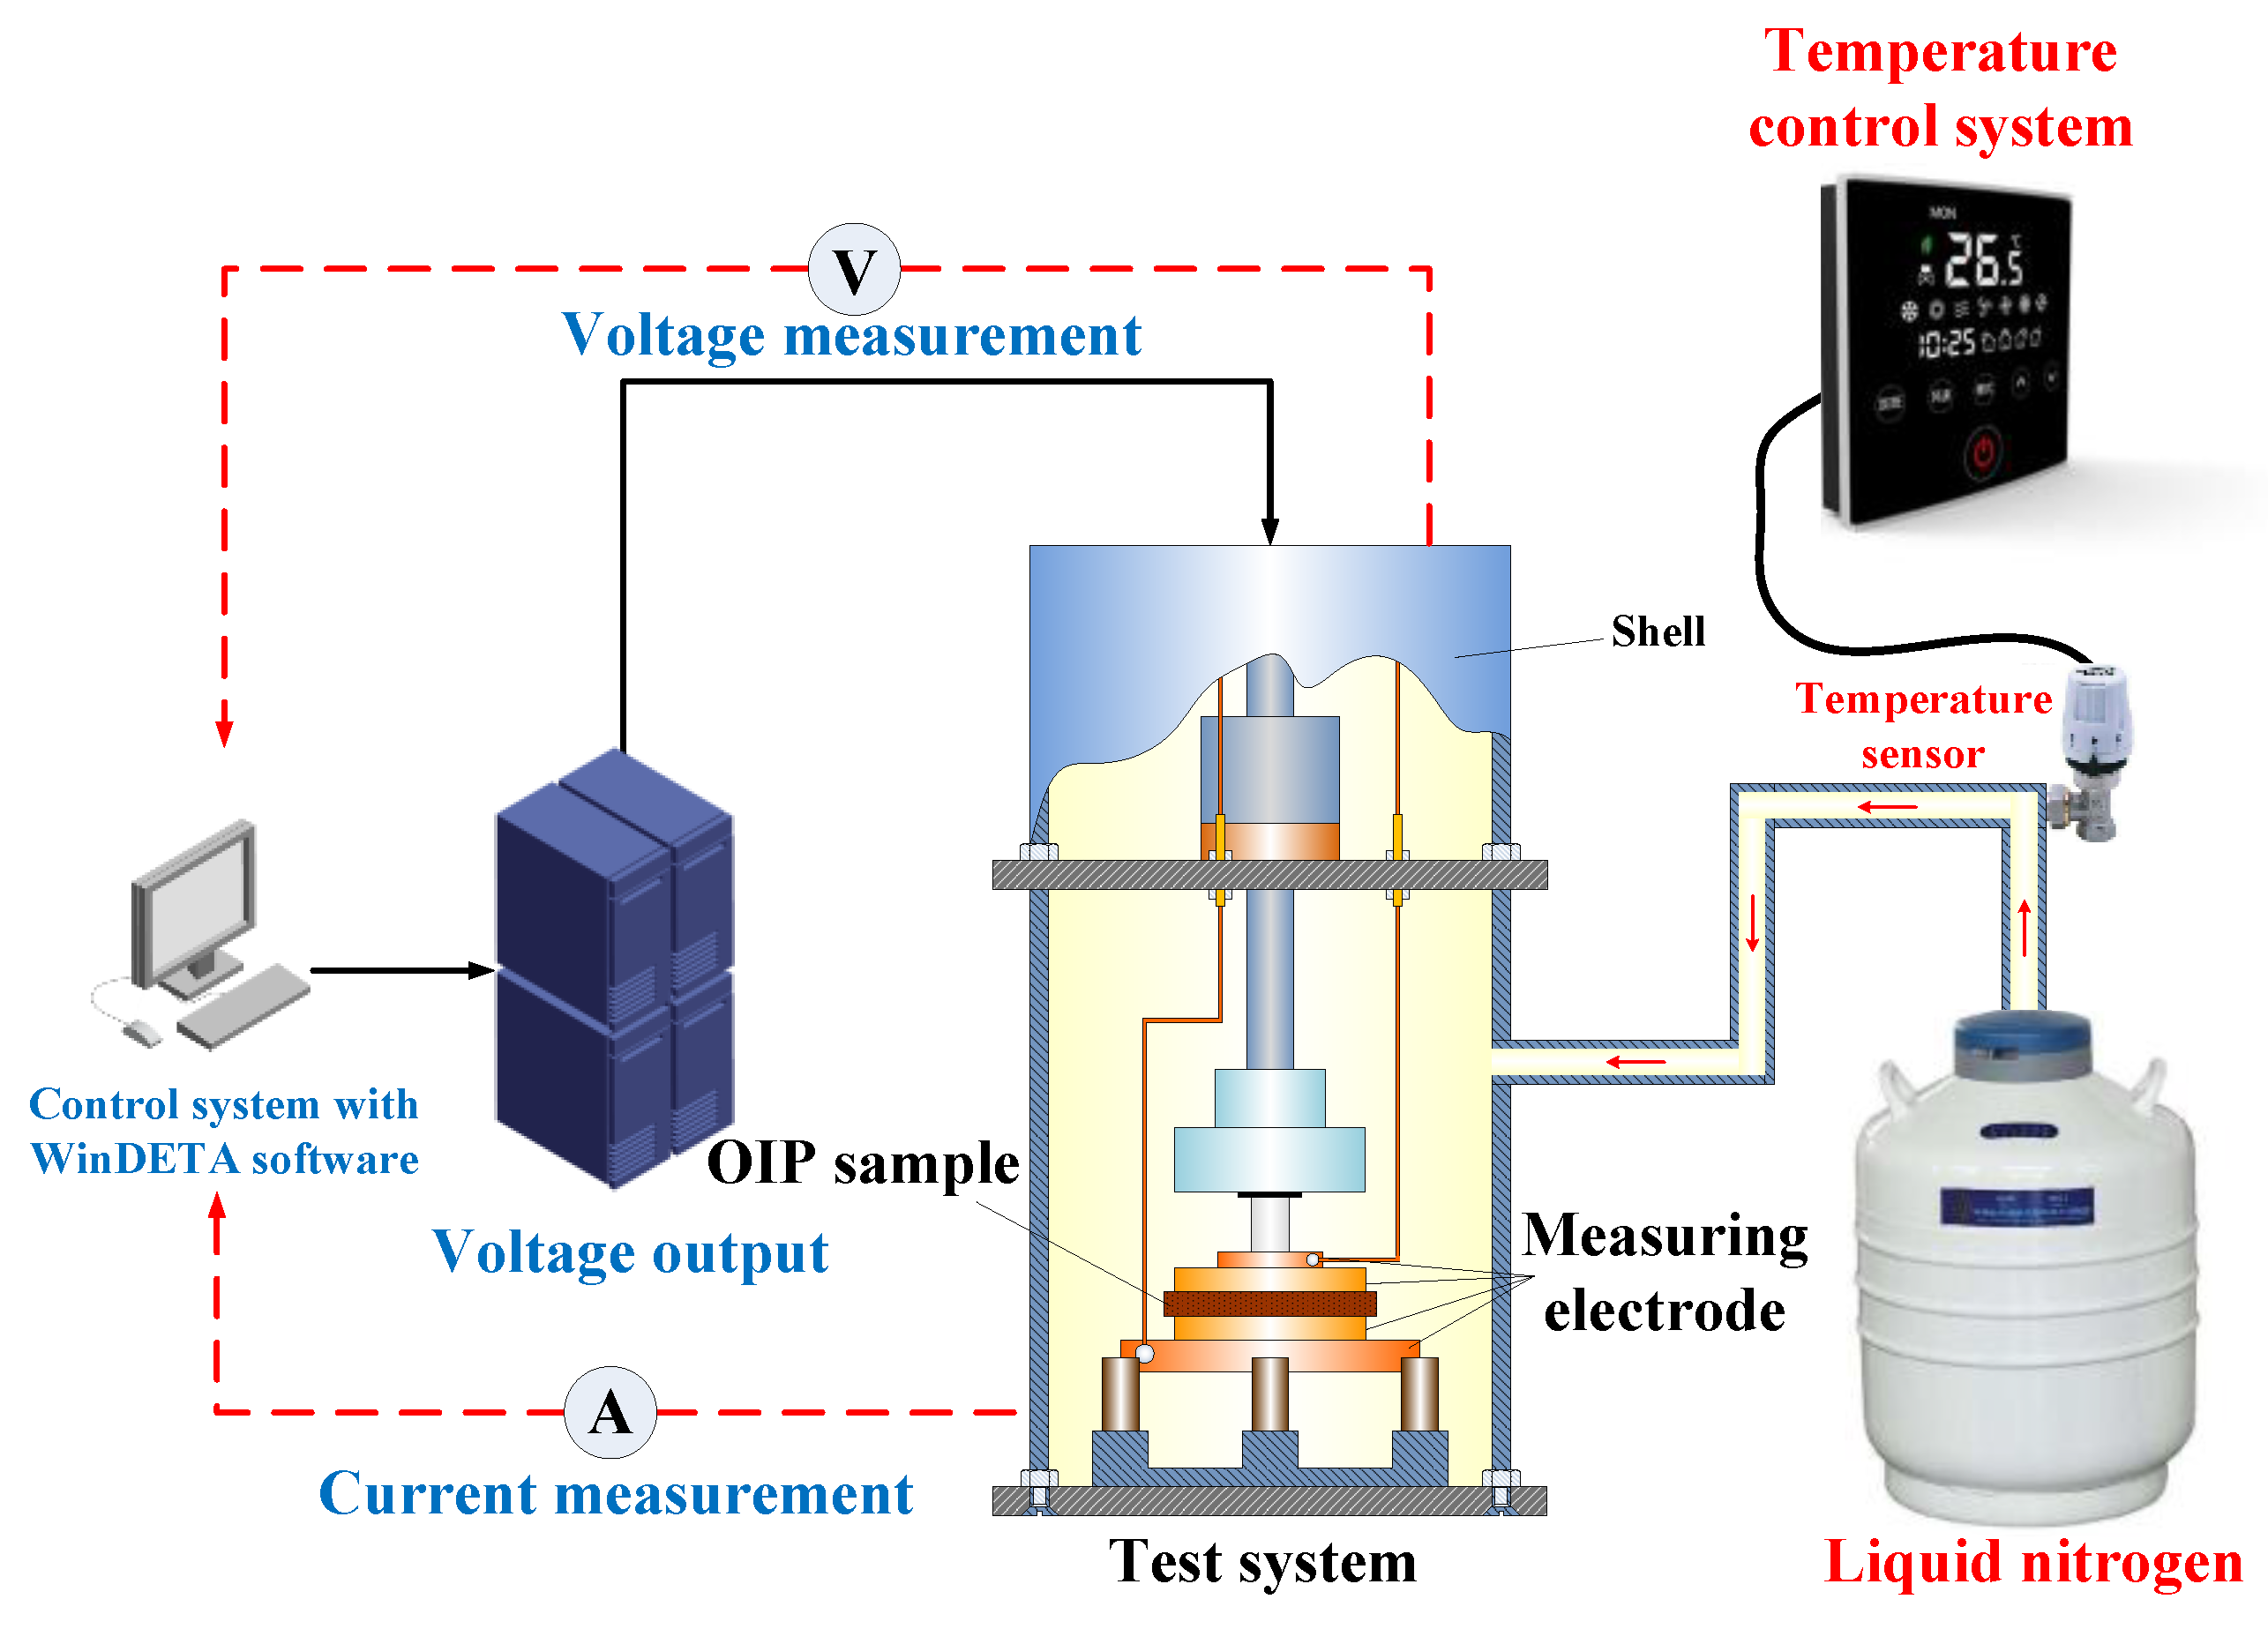
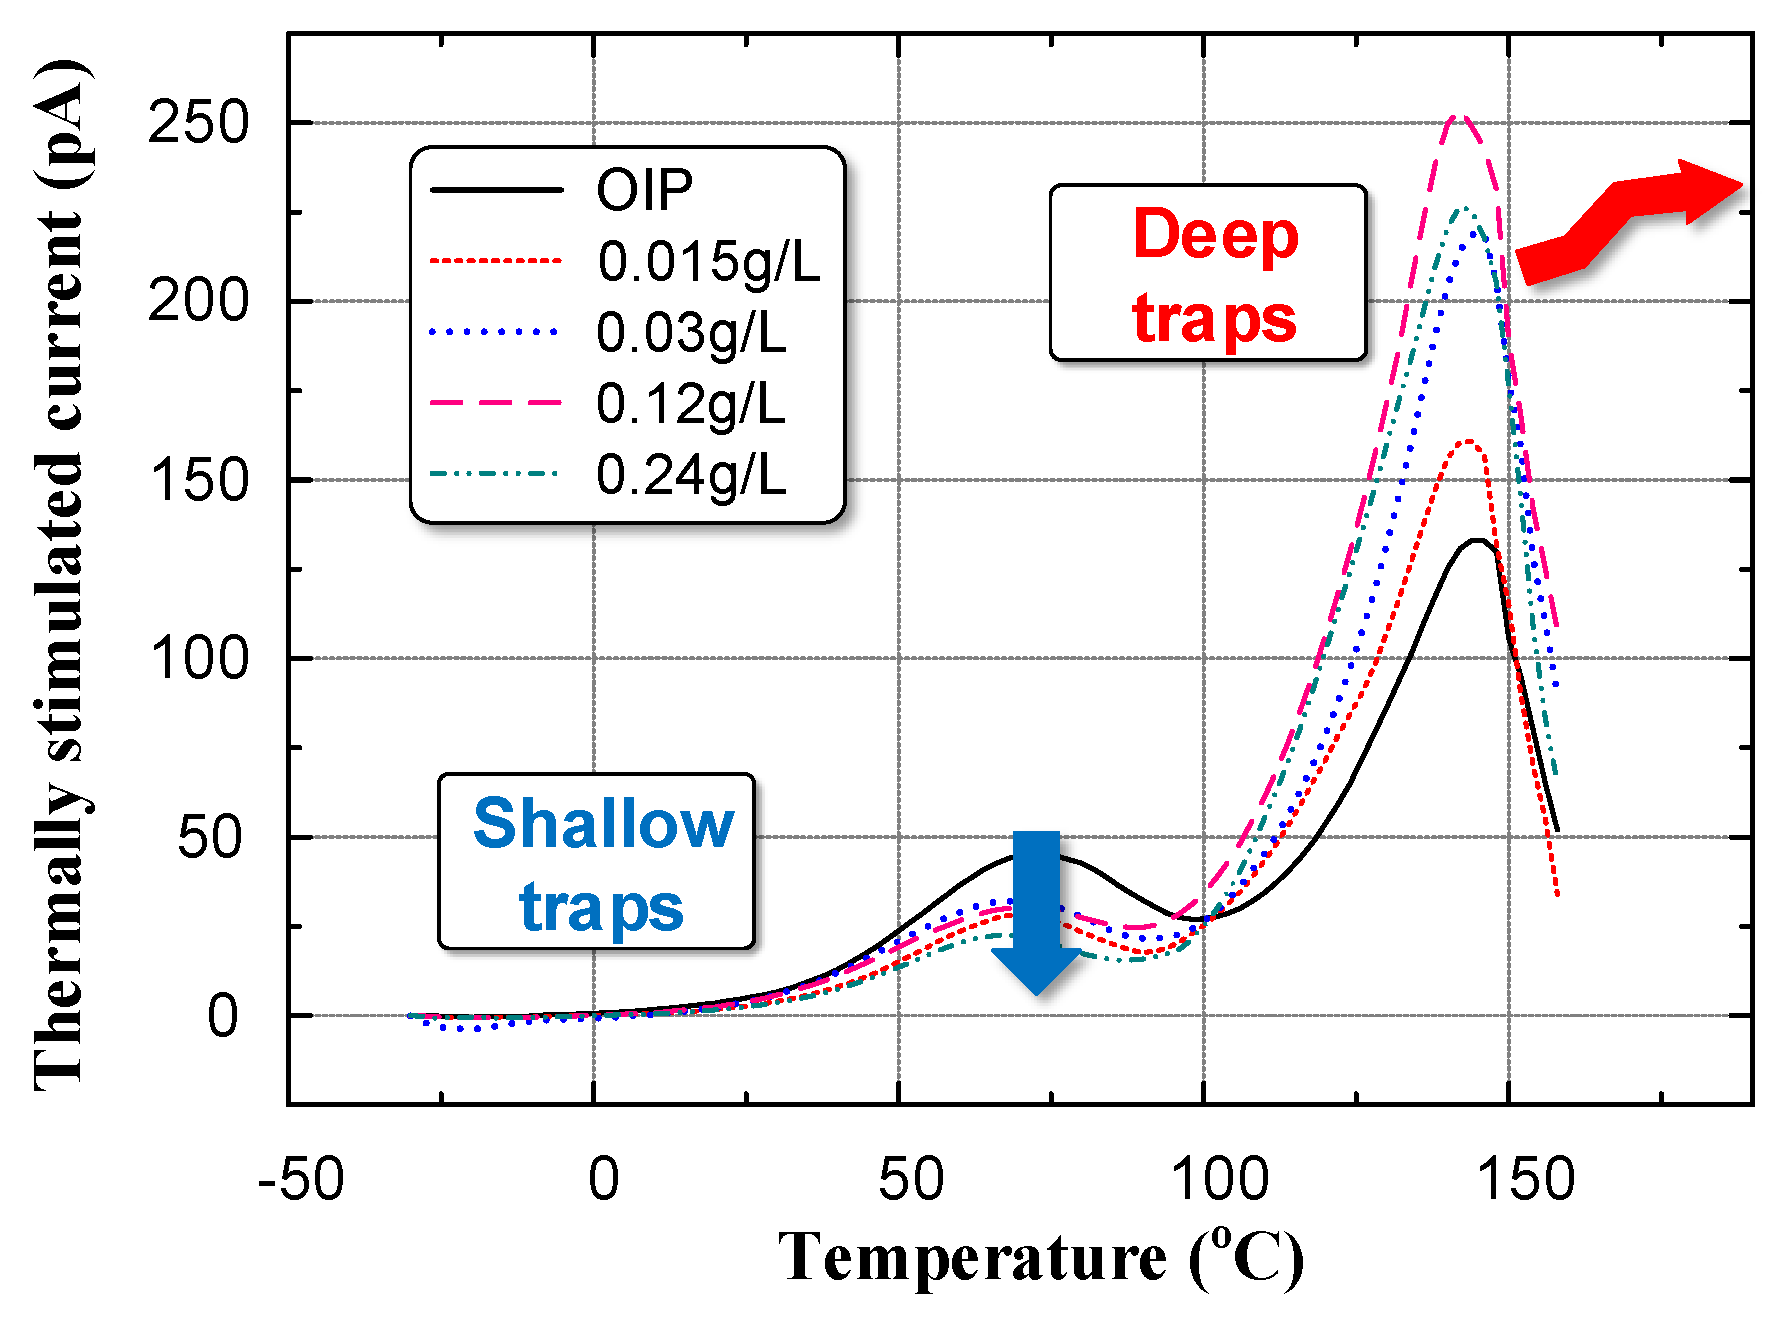
2.3.2. Thermally Stimulated Current (TSC)

Thermally Stimulated Current (TSC) was measured by a Novocontrol TSC measurement system that is composed of microcurrent measurement system, DC electrical source, temperature control system, and a temperature/current real-time recording system. Liquid nitrogen was used to control the temperature. The structure of the TSC measurement system is shown in Figure 4.

2.3.3. Atomic Force Microscope Measurement (AFM)

The maximal precision of the atomic force microscope (IPC-208B, Oxford Instruments company, Concord, MA, USA) used in the test is 0.1 nm in cross direction and 0.01 nm in lengthwise direction, and the maximal scanned area is 90 μm × 90 μm.

2.3.4. Mercury Intrusion Micropore Structure Measurement

The micropore structures of OIP and NOIP were determined using the mercury intrusion method. The measuring principle was as follows. Mercury can easily fill the micropores inside a solid under applied pressure. The energy consumed by the increase in mercury equals to the work done by external forces, which is the surface free energy of the mercury-solid interface under the same thermodynamic condition. The external pressure equals the capillary pressure: the smaller the pore, the higher the capillary pressure, and thus the higher the corresponding external pressure. By measuring the pressure and volume of the mercury, we were able to calculate the diameter distribution, pore surface areas, and porosity.
A fully automatic mercury injection apparatus was used in this paper. The maximum pressure was 414 MPa and the measurement range of the pore radius varied from 6 nm to 339 μm.

3. Effect of Nanoparticles on the Electrical Performance of NMTO and NOIP

3.1. Breakdown Characteristics of NMTO

Nanoparticles are thought to have a positive effect on the liquid dielectrics’ electrical performance. In this section, we first determine the U50 of FTO and NMTO with different nanoparticle concentrations. The test voltage was the standard lightning impulse voltage (1.2/50 μs). The test results are shown in Figure 5.
Due to the polarity effect, the U50 for the negative voltage was much higher than for the positive voltage. Please note that as the nanoparticle concentration increases, the U50 increases first and then decreases slightly when the positive impulse voltage is applied to the NMTO. The U50 of NMTO reached a maximum when the concentration of nano-TiO2 particles was 0.06 g/L. However, when the negative impulse voltage was applied to the NMTO, the U50 of NMTO decreased gradually as the nanoparticle concentration increased.

3.2. Breakdown Characteristics of NOIP

According to the pre-treatment procedure we obtained NOIP samples with different nano-TiO2 particle concentration and determined their U50. The test results are summarized in Figure 6.
Notably, although nano-TiO2 particles exert a significantly positive effect on the transformer oil’s electrical performance, its influence on the cellulose paper was limited. The U50 of NOIP barely changed when the nano-TiO2 particles concentration varied. This phenomenon may depend on the breakdown mechanism of cellulose paper: the OIP has many pores. Since the relative permittivity of oil is much lower than that of cellulose paper, the electric field intensity in the oil pores is extremely high when lightning impulse voltage is applied to the OIP. Breakdown occurs first in these oil pores. When the breakdown channel runs through the oil pores, the impressed voltage is completely applied to the cellulose dielectric. If the impressed voltage exceeds the critical value, the OIP breaks down; otherwise, the arc in the oil pores extinguishes. Therefore, the breakdown characteristics of OIP depend on the electrical performance of cellulose rather than the transformer oil. Although the nano-TiO2 particles enhanced the electrical performance of the oil pores, the breakdown voltage of the cellulose fibers remains unchanged. Hence, the U50 of NOIP barely changed when the nano-TiO2 particles concentration varied.

3.3. Accumulative Failure Characteristics of NOIP

The relation between amplitude of applied impulse voltage (V) and number of applied impulses before breakdown (N), the V–N characteristic, is an essential index reflecting the electrical performance of OIP [22,23,24]. We identified the V–N characteristics of OIP and NOIP with different nano-TiO2 particle concentrations. The test results are shown in Figure 7.
Notably, the V–N characteristics curve of OIP differs from that of NOIP. When the amplitude of applied voltage was relatively low, the difference among the V–N characteristics curves became obvious. This observed phenomenon indicates that nanoparticles play a positive role in the accumulative failure process of OIP and improve the OIP’s resistant ability against repeated impulses. To exclude the effect of the surface modifier (stearic acid) on the test results, we determined the V–N characteristics of stearic-acid-oil mixture-impregnated paper, represented by the grey dashed line in Figure 7. The grey dashed line coincides with the black dotted line, which indicates that the surface modifier has no effect on the V–N characteristics. Based on the test results presented in Figure 7, we summarized the number of applied impulses before breakdown occurred (N) in Figure 8. The amplitude of the applied voltage was 15 kV.
Figure 8 shows that the N of NOIP significantly improved compared with that of OIP. As the nanoparticle concentration increased, the N of NOIP decreased first, and then increased slightly. The N was 62.5% higher for NOIP (0.25 g/L nanoparticle concentration) compared to that of OIP. In the following sections, we conduct further studies to reveal the affecting mechanism of nanoparticles on the resistant ability of NOIP against repeated impulses.

4. Analysis and Discussion

4.1. Failure Mechanism of OIP under Repeated Impulses

Many studies have proven that nanoparticles have a positive effect on the electrical performance of liquid dielectrics [1,2,34,35,36]. Many scholars think that surface charges are formed on the nanoparticles via induction or polarization. This leads to the forming of a potential barrier surrounding the nanoparticles. Therefore, nanoparticles can easily capture electrons in the steamer, thereby reducing the number of electrons in the steamer. This reduces the speed of the streamer and improves the breakdown voltage of the liquid dielectric. The modification mechanism of nanoparticles on the transformer oil are being widely studied. We mainly focused on the modification mechanism of nanoparticles on oil paper insulation in this paper.
To reveal the mechanism by which nano-TiO2 particles influence the accumulative failure characteristics of cellulose paper, we first wanted to determine the accumulative failure mechanism of OIP. In our previous study, space charge accumulation and accumulative damage caused by repeated lightning impulses were considered two main reasons for accumulative failure of OIP [26]:
  • Space charge accumulation: under repeated lightning impulse voltage, positive space charges are injected into the OIP sample and migrate toward cathode. In this process, some of the positive space charges are trapped in the dielectric. Conversely, negative charges, which mainly consist of electrons, can easily pass through the dielectric and be neutralized in the anode. The existence of positive charges in the bulk strengthen the electric field near the cathode, thereby contributing to the breakdown of the OIP.
  • Dielectric accumulative damage: when the impulse voltage is applied to the OIP sample, the electric field intensity in the oil pores becomes extremely high. Partial discharge occurs repeatedly in the oil pores. When the charged particles and electrons collide, some of the cellulose fibers break and form a new substance. In this process, the cellulose paper suffers unrecoverable damage, thereby leading to the decrease in the breakdown voltage of the OIP [22].
Based on the above research results, we attempted to reveal the influencing mechanism of nano-TiO2 particles on cellulose paper by studying the space charge distribution and dielectric accumulative damage characteristics of NOIP.

4.2. Space Charge Distribution in OIP and NOIP

According to the test procedure in Section 2.3, we identified the space charge distribution in OIP and NOIP. The amplitude and number of applied impulses were set to 15 kV and 500, respectively. The test results are shown in Figure 9.
Notably, in OIP, large quantities of charges were injected into the bulk from the repeated impulses. Positive charges migrated toward the cathode and accumulated on the paper interface between the first and second layers. Some of the positive charges break through the interface barrier and accumulate on the paper interface between the second and third layers. Compared with OIP, the space charge distribution in NOIP was different in two aspects:
  • The space charge density of NOIP is much lower than that of OIP.
  • Positive charges were detected on the paper interface between the 2nd layer and the 3rd layer in the OIP sample. Whereas in the NOIP sample, negative charges were observed on this paper interface.
Total charges in the dielectric, independent of polarity, can be calculated by the following equation [37].
Q ( t ) = 0 d | ρ ( x , t ) | S d x
where ρ is the charge density, x is the position, d is the thickness of the sample, and S is the effective area of the specimen.
Based on the test results presented in Figure 9, we calculated the total charges in the OIP and NOIP samples as shown in Figure 10.
The total space charge amount in NOIP was considerably lower than in OIP. As the nanoparticle concentration increased, the total space charge amount in NOIP decreased first, and then increased slightly when the nanoparticle concentration exceeded 0.18 g/L.
We measured the TSC of both OIP and NOIP to determine the trap characteristics of the dielectrics. The test results are shown in Figure 11.
We chose Gaussian fitting to separate the current peaks. Then the average energy level of shallow traps and deep traps were calculated using [38,39]:
E t r = 2.47 T m 2 k B Δ T
The quantity of trapped charge was calculated using the following equation [38,39]:
Q t r = t 0 t 1 I ( t ) d t = 60 β T 0 T 1 I ( T ) d T
where β is the temperature rate in K/min, Tm is the temperature corresponding to the crest in K, and ΔT is the temperature difference corresponding to the half-values. The trap energy and quantity of trapped charge are summarized in Figure 12.
As shown in Figure 12, the nanoparticles had limited effects on the energy levels of traps. The deep trap energy level and shallow trap energy level fluctuated near 0.57 eV and 1.16 eV, respectively. The amount of trapped charges, related to trap density in the dielectric, changed as the nanoparticle concentration varied. As the nanoparticle concentration increased, the deep trap density increased initially and then decreased slightly. However, the shallow trap density decreased with increasing nanoparticle concentration. Pourrahimi et al. proved that a “strong” interface forms between the dielectric and nanoparticle [40]. The interfaces introduced by nanoparticles are directly related to the trap characteristics of the nano-composite dielectric. Moreover, polar groups on the particle surface and a disturbed polymer molecular order at the particle surface were also considered to provide charge traps [40]. Therefore, the change in trap density in the dielectric is considered to be dominated by the nanoparticles, which change the charge transportation characteristics. Based on the work by Nelson et al., two possible nanoparticle mechanisms that could affect charge transportation are presented as follows [41,42].
Firstly, when two different materials contact each other, free carriers flow from one material to the other due to their different Fermi levels. This free carrier transportation ends when a new balance is established. Charges are hard to inject from a metal electrode into a dielectric due to the barrier potential between these two materials. When the external electric field exceeds a critical value, Schottky charges are injected into the dielectric. The electric field between column-column electrodes is quasi-homogeneous, which is much lower than the critical value of field-emission tunneling. The injection current is expressed as [43,44]:
I = i 0 e Φ / k T × e e e E e / 4 π ε 0 ε r k T
where Φ(x) is the barrier potential for charge injection, Ee is the electrode field, and εr is relative permittivity of the samples. The barrier potential at the electrode-dielectric interface is expressed by the following equation [43,44]:
Φ ( x ) = Φ m χ q 2 16 π ε 0 ε r x q E e x
where Φm is the work function of the metal electrode, χ is the electron affinity, q is the electron charge, and x is the distance.
Free charges are captured by the traps. The trapping time, which is the time between trapping and de-trapping, increases with increasing trap depth [45]. As shown in Figure 12, nanoparticles introduce deep traps into the dielectric. More deep traps emerge near the electrode, which capture homocharges and thereby weaken the local electric field near the electrode [42,46]. According to Equation (5), such a decrease in the electrode field contributes to increasing the injection barrier potential, which leads to a decrease in the space charge density in NOIP.
Secondly, Tanaka et al. proposed a multilayer description of the particle-polymer interface, as shown in Figure 13. This interface consists of a “bonded” layer closest to the particle, a “bound” layer further out, and finally a “loose” layer [47]. The interfacial regions are claimed to be scattering centers for charge carriers. Free charges migrate in the dielectric, motivated by the external electric field. Some of the free charges are scattered at surfaces of the nanoparticles, which reduces the energy of free charges and results in an overall reduced charge accumulation (Figure 13) [42,48].
We then determined the space charge decay characteristics of OIP and NOIP with a nanoparticle concentration of 0.015 g/L, as shown in Figure 14 and Figure 15.
Please note that the space charges in the dielectric decayed rapidly once the sample was short circuited. An exponential function was used to characterize the relation between total charges and decay time.
Q ( t ) = Q 0 + A e τ t
where t is decay time and τ is the decay time constant. The decay time constants of space charges in OIP and NOIP (0.015 g/L) were 365.3 and 412.5, respectively. Therefore, the space charge decay rate for OIP was 12.9% higher than that of NOIP (0.015 g/L). To reveal the effects of nanoparticles on the space charges dissipation, space charge decay characteristics of NOIP with various nanoparticle concentrations were determined. The decay time constants of the NOIP samples are presented in Figure 16.
Please note that the decay constants of the NOIP samples are higher than that of the OIP sample. However, nanoparticle concentration demonstrated a limited effect on the space charge dissipation process. The trend in the decay constants of the NOIP fluctuated with increasing nanoparticle concentration. Deep traps in the dielectric are thought to reduce the mobility of free charges and increase the charge decay rate by capturing free charges. Therefore, the decay constants of the NOIP are higher due to high deep trap density. However, we still cannot present a rational explanation for the limited effects of nanoparticle concentration on the decay constant.
We conclude from the above test results that the nanoparticles enter cellulose paper during the impregnation process. Due to interfaces introduced by the nanoparticles, a considerable number of deep traps emerge in the NOIP dielectric that capture free charges near the electrode. This behavior weakens the local electric field near the electrode and thereby suppresses the injection of space charges. Moreover, a scattering effect caused by nanoparticles can reduce the energy of free charges and thereby suppress the charge accumulation in the dielectric. According to our previous study, positive charges in the bulk can strengthen the electric field intensity near the cathode, which contributes to the accumulative failure of the OIP sample. Therefore, we suspect that by reducing the space charge density in cellulose paper, nanoparticles improve the OIP’s resistant ability against repeated impulses, which led to the results presented in Figure 7. In addition, in NOIP, negative charges were detected near the cathode, which can further reduce the electric field near the cathode and improve the OIP’s resistant ability against repeated impulses.

4.3. Microstructure of OIP/NOIP

To study the effect of repeated impulses on the microstructure of OIP and NOIP, we measured the surface micromorphology and micropore structure of OIP/NOIP subjected to repeated impulses.

4.3.1. Surface Micromorphology

We obtained the surface micromorphology of fresh OIP and OIP/NOIP subjected to repeated impulses by using an atomic force measurement (AFM) system. The scanned area was 2 μm × 2 μm. The amplitude and number of applied impulses were set as 15 kV and 500, respectively. The test results are shown in Figure 17.
Notably, the surface of fresh OIP is flat and smooth. When we applied repeated impulses to the OIP sample, some red bumps arose on the surface of the dielectric, as shown in Figure 17b. Compared with that of OIP, the surface of the NOIP subjected to repeated impulses was much rougher. Some relatively high peaks were observed on the surface of NOIP samples whose nanoparticle concentrations were 0.015 and 0.06 g/L. When the nanoparticle concentration increased further to 0.12 and 0.24 g/L, the red peaks became higher and some pits appeared on the surface of the dielectric.
To quantitatively analyze the change of micromorphology, we randomly measured eight points on a test sample and calculated the average values of surface roughness (RMS) [49,50,51]. The relationship between surface roughness and nanoparticle concentration is plotted in Figure 18.
The surface roughness of both OIP and NOIP subjected to repeated impulses was much higher than that of the fresh OIP sample. This indicates that repeated impulses can cause damage to the surface of dielectric. According to our previous study, since the relative permittivity of oil is lower than that of cellulose paper, the electric field in the oil film between the electrode and cellulose paper (Figure 19) is extremely high when impulse voltage is applied to the sample [52]. Therefore, partial discharge occurs in this oil film, which causes damage to the surface and variation in the surface morphology [22,26].
Please note that the surface roughness increases with an increasing nanoparticle concentration, which indicates that nanoparticles contribute to the damage of the OIP surface. This is because the relative permittivity of NOIP increases with the nanoparticle concentration, as demonstrated previously [53]. As such, the relative permittivity difference between oil film and cellulose paper becomes larger when the nanoparticle concentration increases. The electric field in the oil film thereby rises and partial discharge becomes more severe, which leads to the increase in the surface roughness as nanoparticle concentration increases.

4.3.2. Micropore Structure

By measuring the pressure and volume of the mercury, we can calculate the diameter distribution, pore surface area, and porosity of OIP/NOIP. Assuming the radius of the micro pores in OIP and NOIP is r, contact angle is θ, pressure is p, surface tension of mercury is γ, the length of the micro pores is L, volume change of mercury is ΔV, and the surface area of the micro pores is S, we have the following equation:
p π r 2 L = 2 γ π r L cos θ = p Δ V
Then, we can obtain:
r = 2 γ / cos θ p
The surface area of the micro pores is expressed as:
S = p Δ V γ / cos θ
We determined the pore area in fresh OIP and OIP and NOIP subjected to 500 impulse voltage with an amplitude of impulse voltage of 15 kV, as shown in Figure 20.
The pore area of OIP subjected to repeated impulses (1.653 m2/g), directly related to the number of pores, was much higher than that of fresh OIP (0.792 m2/g). This phenomenon indicates that repeated impulses can damage the dielectric and change the microstructure of OIP. However, when we impregnated the cellulose paper with nano-modified oil, the nanoparticles had a significant positive effect on the dielectric by reducing the accumulative damage. The pore area of NOIP subjected to repeated impulses was obviously lower than that of OIP subjected to repeated impulses. This may be because the nanoparticles in the NOIP can capture free electrons when repeated impulse voltage is applied. This contributes to weakening the accumulative damage caused by the collision of charged particles and electrons. In addition, nanoparticles can improve the relative permittivity of oil in the pores contained in the NOIP, thereby reducing the electric field in oil pores. This also helps to suppress partial discharge in the dielectric and reduce the accumulative damage caused by repeated impulses. Given the above, we concluded that nanoparticles can reduce the accumulative damage caused by repeated impulses and improve the OIP’s resistant ability against repeated impulses.
However, the pore area of NOIP increased as the nanoparticle concentration increased. To explain this phenomenon, we determined the diameter distribution of micropores in fresh OIP and OIP/NOIP subjected to 500 impulse voltage, as shown in Figure 21.
Please note that as the nanoparticle concentration increased, the number of pores in NOIP, especially for the papers whose diameter was several μm or hundreds of nm, increased gradually. However, the number of pores whose diameters were less than 80 nm barely changed. This is because nanoparticles have a large specific surface area. The existence of nanoparticles in the dielectric can increase the surface area of pores. Some of the nanoparticles adsorb on the wall of micropores that cannot be displaced out of the sample in the acetone extracting treatment. All the samples in this test were immersed in acetone for 72 h and then dried at 90 °C for another 72 h before the micropore structure measurement. Therefore, the higher the nanoparticle concentration, the more nanoparticles stay in the micropores, and thus the larger the pore area. Since the nanoparticles can hardly enter nanopores whose diameter is too small, the number of pores whose diameter is less than 80 nm barely changes with an increasing nanoparticle concentration (Figure 21).
To further study the micropore structure of NOIP, we observed the inside morphology of both OIP and NOIP subjected to 500 impulse voltage. The surface layers of the samples were removed to facilitate inside observation. All the test samples were immersed in acetone after accumulation test. The test results are shown in Figure 22.
Please note that the structure of fresh OIP is very compact. The gap between cellulose fibers are small, as shown in Figure 22a,b. However, when apply repeated impulses to the dielectric, large gaps emerged between the fibers. Several pores were detected as shown in Figure 22c. The diameter of large pores reached several micrometers (Figure 22d). This indicates that repeated applications of impulse voltage affect the microstructure of OIP and lead to an increase in the micropores. In Figure 22e, some small gaps between the fibers in the NOIP area visible, but the amount and size of the micropores is obviously smaller than that of OIP subjected repeated impulses. As shown in Figure 22f, we detected some nanoparticles on the cellulose fibers. They are considered to remain in the cellulose paper after acetone extracting treatment, which further proves our previous analysis in Section 4.3.2.

5. Conclusions

The positive U50 of NMTO increased first and then decreased slightly with increasing nanoparticle concentration. The negative U50 of NMTO decreased with the increasing nanoparticle concentration. Nano-TiO2 particles had a limited effect on the U50 of NOIP. However, nano-TiO2 particles can dramatically improve the resistant ability of NOIP against repeated impulses. When the amplitude of the applied impulse voltage was 15 kV, the N was 62.5% higher for NOIP (0.25 g/L nanoparticle concentration) compared with that of OIP.
Nano-TiO2 particles can suppress the accumulation of space charge in the oil paper insulation, which weakens the electric field distortion in the dielectric, which improves the resistant ability against repeated impulses. We observed the following important phenomena. The space charge density of NOIP was much lower than that of OIP. Deep traps were introduced in the NOIP as the nanoparticle concentration increased; the deep trap density increased initially and then decreased slightly, whereas the shallow trap density decreased slightly. Deep traps in NOIP both suppress the charge injection and suppress charge accumulation by scattering effect. Negative charges were detected on the paper interface between the second and third layers in the NOIP sample, which is contrary to the phenomenon in OIP. The space charge decay rates of the NOIP samples were higher than in the OIP sample.
Repeated impulses can cause accumulative damage to the cellulose paper surface, thereby leading to the increase in the surface roughness. Due to the increase in the relative permittivity of NOIP caused by nanoparticles, the electric field in the oil film between the electrode and cellulose paper decreased. This results in the surface roughness of NOIP increasing with increasing nanoparticle concentration. Repeated impulses can damage the cellulose paper and change the microstructure of the cellulose paper, which is directly shown by the increase in the amount of micropores in the cellulose paper. Nanoparticles can reduce the accumulative damage caused by repeated impulses and decrease the increase in the number of micropores in the cellulose paper.

6. Follow-Up Work and Research Progress

In this paper, we determined the failure characteristics of both OIP and NOIP and revealed the effects of nano-TiO2 particles on the space charge behavior and accumulative damage characteristics. The NOIP only shows a good resistant capability against repeated impulse voltages, but its breakdown voltage barely changes. In the near future, we intend to focus on the overall improvement of nano-modified paper, which important for improving the oil paper insulation system properties.
In addition, some of the latest research advances are essential to share with readers:
To find a NOIP with a good ability to resist repeated impulses, we successively tried Al2O3, Fe3O4, ZnO, SiO2, and C60. The breakdown voltage of NOIP modified by the above nanoparticles barely changed. The capability against repeated impulses was better than that of fresh OIP, to some extent. However, the improvement was still relatively limited compared with NOIP modified by nano-TiO2.
If we dramatically increased the nanoparticle concentration, although the stability could not be guaranteed at all, the breakdown voltage of NOIP with extremely high nanoparticle concentration was even higher than that of fresh OIP. This is a preliminary test result. More tests and analysis are needed to explore the stability of new-found NOIP and to reveal its modification mechanisms.
By adding some nanoparticles into paper pulp, we directly manufactured nano-modified cellulose paper. The electrical performance of nano-modified paper has been preliminarily proved to be better than fresh paper.

Author Contributions

Conceptualization by P.S.; Methodology by P.S.; Investigation by P.S.; Writing—Original Draft Preparation by P.S.; Writing—Review and Editing by W.S. and D.Z.; Visualization by P.S., X.J. and H.Z.; Validation by P.S. and Z.Y.; Revisions and additional experiments by P.S., W.S., and D.Z.

Funding

This research was funded by the National Natural Science Foundation of China (51707023), National Basic Research Program (973 Program) (2015CB251003), National Key Basic Research Program of China (2017YFB0902702), China’s Post-doctoral Science Fund (2017M622962) and Chongqing Postdoctoral Science Special Foundation (Xm2017197).

Conflicts of Interest

The authors declare no conflict of interest.

References

  1. Mansour, D.A.; Elsaeed, A.M.; Izzularab, M.A. The role of interfacial zone in dielectric properties of transformer oil-based nanofluids. IEEE Trans. Dielectr. Electr. Insul. 2016, 23, 3364–3372. [Google Scholar] [CrossRef]
  2. Du, B.; Li, X.; Xiao, M. High thermal conductivity transformer oil filled with BN nanoparticles. IEEE Trans. Dielectr. Electr. Insul. 2015, 22, 851–858. [Google Scholar] [CrossRef]
  3. Shukla, G.; Aiyer, H. Thermal conductivity enhancement of transformer oil using functionalized nanodiamonds. IEEE Trans. Dielectr. Electr. Insul. 2015, 22, 2185–2190. [Google Scholar] [CrossRef]
  4. Lin, S.; Liu, L.; Liang, Y.; Cui, W.; Zhang, Z. Oil-in-water self-assembled synthesis of Ag@AgCl nano-particles on flower-like Bi2O2CO3 with enhanced visible-light-driven photocatalytic activity. Materials 2016, 9, 486. [Google Scholar] [CrossRef] [PubMed]
  5. Zheng, L.; Yuan, L.; Guan, Q.; Gu, A.; Liang, G. Fabrication and origin of asymmetric polyvinylidene fluoride-carbon nanotube/cyanate ester materials with high dielectric constant and low dielectric loss through building double-layered structure. IET High Volt. 2017, 2, 32–38. [Google Scholar] [CrossRef]
  6. Wan, F.; Shi, H.; Chen, W.; Gu, Z.; Du, L. Charge transfer effect on Raman and surface enhanced Raman spectroscopy of furfural molecules. Nanomaterials 2017, 7, 210. [Google Scholar] [CrossRef] [PubMed]
  7. Segal, V.; Hjortsberg, A.; Rabinovich, A.; Nattrass, D. AC (60 Hz) and impulse breakdown strength of a colloidal fluid based on transformer oil and magnetite nanoparticles. In Proceedings of the IEEE International Symposium on Electrical Insulation, Eindhoven, The Netherlands, 17–21 August 1998; pp. 619–622. [Google Scholar]
  8. George Hwang, J.; Zahn, M.; O’Sullivan, F.M.; Pettersson, L.A.A.; Hjortstam, O.; Liu, R. Effects of nanoparticle charging on streamer development in transformer oil-based nanofluids. J. Appl. Phys. 2010, 107, 014310. [Google Scholar] [CrossRef]
  9. Jin, H.; Andritsch, T.; Tsekmes, I.; Kochetov, R.; Morshuis, P. Properties of mineral oil based silica nanofluids. IEEE Trans. Dielectr. Electr. Insul. 2014, 21, 1100–1108. [Google Scholar]
  10. Du, Y.; Lv, Y.; Li, C.; Chen, M.; Zhou, Y.; Zhou, J.; Li, X.; Zhou, Y. Effect of semiconductive nanoparticles on insulating performances of transformer oil. IEEE Trans. Dielectr. Electr. Insul. 2012, 19, 770–776. [Google Scholar]
  11. Amiri, A.; Kazi, S.; Shanbedi, M.; Zubir, M.; Yarmand, H. Transformer oil based multi-walled carbon nanotube–hexylamine coolant with optimized electrical, thermal and rheological enhancements. RSC Adv. 2015, 5, 107222–107236. [Google Scholar] [CrossRef]
  12. Lee, J.C.; Lee, W.H.; Lee, S.H.; Lee, S. Positive and negative effects of dielectric breakdown in transformer oil based magnetic fluids. Mater. Res. Bull. 2012, 47, 2984–2987. [Google Scholar] [CrossRef]
  13. Sartoratto, P.; Neto, A.; Lima, E.; Lima, E. Preparation and electrical properties of oil-based magnetic fluids. J. Appl. Phys. 2005, 97, 513. [Google Scholar] [CrossRef]
  14. Atiya, E.G.; Mansour, D.E.A.; Khattab, R.M.; Azmy, A.M. Dispersion behavior and breakdown strength of transformer oil filled with TiO2 nanoparticles. IEEE Trans. Dielectr. Electr. Insul. 2015, 22, 2463–2472. [Google Scholar] [CrossRef]
  15. Sun, P.; Sima, W.; Chen, J.; Zhang, D.; Jiang, X.; Chen, Q. An application area of C60: Overall improvement of insulating oil’s electrical performance. Appl. Phys. Lett. 2018, 112, 142902. [Google Scholar] [CrossRef]
  16. Kudelcik, J.; Bury, P.; Kopcansky, P.; Timko, M. Dielectric breakdown in mineral oil ITO 100 based magnetic fluid. Phys. Proced. 2010, 9, 78–81. [Google Scholar] [CrossRef]
  17. Wang, Y.; Wang, C.; Zhang, Z.; Xiao, K. Effect of nanoparticles on the morphology, thermal, and electrical properties of low-density polyethylene after thermal aging. Nanomaterials 2017, 7, 320. [Google Scholar] [CrossRef] [PubMed]
  18. Alvarez, N.; Ochmann, T.; Kienzle, N.; Ruff, B.; Haase, M. Polymer coating of carbon nanotube fibers for electric microcables. Nanomaterials 2014, 4, 879–893. [Google Scholar] [CrossRef] [PubMed]
  19. Shang, N.; Chen, Q.; Wei, X. Preparation and dielectric properties of SiC/LSR nanocomposites for insulation of high voltage direct current cable accessories. Materials 2018, 11, 403. [Google Scholar] [CrossRef] [PubMed]
  20. Jing, Z.; Li, C.; Zhao, H.; Zhang, G.; Han, B. Doping effect of graphene nanoplatelets on electrical insulation properties of polyethylene: From macroscopic to molecular scale. Materials 2016, 9, 680. [Google Scholar] [CrossRef] [PubMed]
  21. Wei, Y.; Zhao, J.; Phung, B.; Faupel, F.; Ostrikov, K. High-voltage insulation organic-inorganic nanocomposites by plasma polymerization. Materials 2014, 7, 563. [Google Scholar]
  22. Sima, W.; Sun, P.; Yang, Q.; Yuan, T.; Lu, C.; Yang, M. Study on the accumulative effect of repeated lightning impulses on insulation characteristics of transformer oil impregnated paper. IEEE Trans. Dielectr. Electr. Insul. 2014, 21, 1933–1941. [Google Scholar] [CrossRef]
  23. Sima, W.; Sun, P.; Yang, M.; Yang, Q.; Wu, J. Effect of space charge on the accumulative characteristics of oil paper insulation under repeated lightning impulses. IEEE Trans. Dielectr Electr Insul. 2015, 22, 2483–2490. [Google Scholar] [CrossRef]
  24. Sun, P.; Sima, W.; Yang, M.; Lan, X.; Wu, J. Study on voltage-number characteristics of transformer insulation under transformer invading non-standard lightning impulses. IEEE Trans. Dielectr. Electr. Insul. 2015, 22, 3582–3591. [Google Scholar] [CrossRef]
  25. Sima, W.; Sun, P.; Yang, M.; Wu, J.; Hua, J. Impact of time parameters of lightning impulse on the breakdown characteristics of oil paper insulation. IET. High Volt. 2016, 1, 18–24. [Google Scholar] [CrossRef]
  26. Sun, P.; Sima, W.; Yang, M.; Wu, J.; Hua, J. Accumulative effect of repeated lightning impulses on transformer insulation: Mechanism analysis. IEEE Trans. Dielectr. Electr. Insul. 2016, 23, 2430–2437. [Google Scholar] [CrossRef]
  27. Standard Test Method for Dielectric Breakdown Voltage of Insulating Oils of Petroleum Origin under Impulse Conditions; ASTM D3487-2000(II); ASTM International: West Conshohocken, PA, USA, 2000.
  28. CIGRE. Effect of Particles on Transformer Dielectric Strength; Working Group 17 of Study Committee 12; CIGRE: Paris, France, 2000. [Google Scholar]
  29. Li, Y.; Zhu, M.; Mu, H.; Deng, J.; Zhang, G.; Jadidian, J.; Zahn, M.; Zhang, W.; Li, Z. Transformer oil breakdown dynamics stressed by fast impulse voltages: Experimental and modeling investigation. IEEE Trans. Plasma Sci. 2014, 24, 3004–3013. [Google Scholar] [CrossRef]
  30. Finis, G.; Claudi, A. On the dielectric breakdown behavior of silicone gel under various stress conditions. IEEE Trans. Dielectr. Electr. Insul. 2007, 14, 487–494. [Google Scholar] [CrossRef]
  31. Borsi, H. Dielectric behavior of silicone and ester fluids for use in distribution transformers. IEEE Trans. Dielectr. Electr. Insul. 1991, 26, 755–762. [Google Scholar] [CrossRef]
  32. Liu, Q.; Wang, Z.D. Breakdown and withstand strengths of ester transformer liquids in a quasi-uniform field under impulse voltages. IEEE Trans. Dielectr. Electr. Insul. 2013, 20, 571–579. [Google Scholar] [CrossRef]
  33. Liu, R.; Jaksts, A. Breakdown processes in transformer insulation under LI voltages. In Proceedings of the IEEE Conference on Dielectric Liquids, Coimbra, Portugal, 26 June–1 July 2005; pp. 75–78. [Google Scholar]
  34. Lv, Y.; Zhou, Y.; Li, C.; Wang, Q.; Qi, B. Recent progress in nanofluids based on transformer oil: Preparation and electrical insulation properties. IEEE Trans. Dielectr. Electr. Insul. 2014, 30, 23–32. [Google Scholar] [CrossRef]
  35. Du, B.; Li, X.; Li, J. Thermal conductivity and dielectric characteristics of transformer oil filled with BN and Fe3O4 nanoparticles. IEEE Trans. Dielectr. Electr. Insul. 2015, 22, 2530–2536. [Google Scholar] [CrossRef]
  36. Swati, K.; Yadav, K.S.; Sarathi, R.; Vinu, R.; Danikas, M.G. Understanding Corona discharge activity in titania nanoparticles dispersed in transformer oil under AC and DC voltages. IEEE Trans. Dielectr. Electr. Insul. 2017, 24, 2325–2336. [Google Scholar] [CrossRef]
  37. Vu, T.T.N.; Teyssedre, G.; Vissouvanadin, B.; Roy, S.L.; Laurent, C. Correlating conductivity and space charge measurements in multi-dielectrics under various electrical and thermal stresses. IEEE Trans. Dielectr. Electr. Insul. 2015, 22, 117–127. [Google Scholar] [CrossRef]
  38. Luo, H.; Jiao, J.; Liu, K.; Yue, Y.; Wang, X. Characteristics of shallow traps in the dielectric surface and their effects on diffuse dielectric barrier discharge in air. IEEE Trans. Dielectr. Electr. Insul. 2017, 45, 749–753. [Google Scholar] [CrossRef]
  39. Luo, H.; Liu, K.; Ran, J.; Yue, Y.; Wang, X.; Yap, S.; Wong, C. Study of dielectric barrier Townsend discharge in 3-mm air gap at atmospheric pressure. IEEE Trans. Plasma Sci. 2014, 42, 1211–1215. [Google Scholar]
  40. Pourrahimi, A.M.; Hoang, T.A.; Liu, D.; Pallon, L.K.; Gubanski, S.; Olsson, R.T.; Gedde, U.W.; Hedenqvist, M.S. Highly efficient interfaces in nanocomposites based on polyethylene and ZnO nano/hierarchical particles: A novel approach toward ultralow electrical conductivity insulations. Adv. Mater. 2016, 28, 8651. [Google Scholar] [CrossRef] [PubMed]
  41. Nelson, J.K. Dielectric Polymer Nanocomposites; Springer: New York, NY, USA, 2010. [Google Scholar]
  42. Pourrahimi, A.M.; Olsson, R.T.; Hedenqvist, M.S. The role of interfaces in polyethylene/metal-oxide nanocomposites for ultrahigh-voltage insulating materials. Adv. Mater. 2018, 30, 1703624. [Google Scholar] [CrossRef] [PubMed]
  43. Dissado, L.A.; Griseri, V.; Peasgood, W.; Cooper, E.S.; Fukunaga, K.; Fothergill, J.C. Decay of space charge in a glassy epoxy resin following voltage removal. IEEE Trans. Dielectr. Electr. Insul. 2006, 13, 903–916. [Google Scholar] [CrossRef] [Green Version]
  44. Zhou, Y.; Huang, M.; Chen, W.; Lu, L.; Jin, F.; Huang, J. Space charge behavior evolution with thermal aging of oil-paper insulation. IEEE Trans. Dielectr. Electr. Insul. 2015, 22, 1381–1388. [Google Scholar] [CrossRef]
  45. Pourrahimi, A.M.; Pallon, L.K.; Liu, D.; Hoang, T.A.; Gubanski, S.; Hedenqvist, M.S.; Olsson, R.T.; Gedde, U.W. Polyethylene nanocomposites for the next generation of ultra-low transmission-loss HVDC cables: Insulations containing moisture-resistant MgO nanoparticles. ACS Appl. Mater. Interfaces 2016, 8, 14824. [Google Scholar] [CrossRef] [PubMed]
  46. Min, D.; Wang, W.; Li, S. Numerical analysis of space charge accumulation and conduction properties in LDPE nanodielectrics. IEEE Trans. Dielectr. Electr. Insul. 2015, 22, 1483. [Google Scholar] [CrossRef]
  47. Tanaka, T.; Kozako, M.; Fuse, N.; Ohki, Y. Proposal of a multi-core model for polymer nanocomposite dielectrics. IEEE Trans. Dielectr. Electr. Insul. 2005, 12, 669. [Google Scholar] [CrossRef]
  48. Takada, T.; Hayase, Y.; Tanaka, Y. Space charge trapping in electrical potential well caused by permanent and induced dipoles for LDPE/MgO nanocomposite. IEEE Trans. Dielectr. Electr. Insul. 2008, 15, 152. [Google Scholar] [CrossRef]
  49. Ruffino, F.; Torrisi, V.; Marletta, G.; Grimaldi, M. Kinetic growth mechanisms of sputter-deposited Au films on mica: From nanoclusters to nanostructured microclusters. Appl. Phys. A 2010, 100, 7–13. [Google Scholar] [CrossRef]
  50. Ruffino, F.; Torrisi, V.; Marletta, G.; Grimaldi, M. Atomic force microscopy investigation of the kinetic growth mechanisms of sputtered nanostructured Au film on mica: Towards a nanoscale morphology control. Nanoscale Res. Lett. 2011, 6, 112. [Google Scholar] [CrossRef] [PubMed]
  51. You, H.; Chiarello, R.; Kim, H.; Vandervoort, K. X-ray reflectivity and scanning-tunneling-microscope study of kinetic roughening of sputter-deposited gold films during growth. Phys. Rev. Lett. 1993, 70, 2900. [Google Scholar] [CrossRef] [PubMed]
  52. Sun, P.; Sima, W.; Yang, M.; Wu, J. Influence of thermal aging on the breakdown characteristics of transformer oil impregnated paper. IEEE Trans. Dielectr. Electr. Insul. 2017, 23, 3373–3381. [Google Scholar] [CrossRef]
  53. Sun, P.; Sima, W.; Jiang, X.; Zhang, D.; He, J.; Chen, Q. Failure of nano-modified oil impregnated paper under repeated impulse voltage: Effects of TiO2 nanoparticles on space charge characteristics. IEEE Trans. Dielectr. Electr. Insul. 2018. accepted. [Google Scholar]
Figure 1. Size distribution of nano-titanium oxide (TiO2) particles.
Nanomaterials 08 00504 g001
Figure 2. Sketch of impulse voltage test setup.
Nanomaterials 08 00504 g002
Figure 3. Schematic diagram of Pulsed Electro-Acoustic (PEA) test system.
Nanomaterials 08 00504 g003
Figure 4. Thermally Stimulated Current (TSC) measurement system.
Nanomaterials 08 00504 g004
Figure 5. The 50% breakdown voltage (U50) of fresh transformer oil (FTO) and nano-modified transformer oil (NMTO) under standard lightning impulse voltage.
Nanomaterials 08 00504 g005
Figure 6. U50 of oil-impregnated paper (OIP) and nano-OIP (NOIP) with different nano-TiO2 particle concentrations.
Nanomaterials 08 00504 g006
Figure 7. Amplitude of applied impulse voltage (V) and number of applied impulses before breakdown (N), the V–N characteristics, of OIP and NOIP with different nano-TiO2 concentrations.
Nanomaterials 08 00504 g007
Figure 8. Number of applied impulses before breakdown occur for OIP and NOIP.
Nanomaterials 08 00504 g008
Figure 9. Space charge distribution in OIP and NOIP.
Nanomaterials 08 00504 g009
Figure 10. Total charge amount in the OIP sample and NOIP sample.
Nanomaterials 08 00504 g010
Figure 11. Thermally stimulated current of OIP and NOIP.
Nanomaterials 08 00504 g011
Figure 12. Effects of nanoparticle concentration of the trap parameters.
Nanomaterials 08 00504 g012
Figure 13. Multicore model and scattering of nanoparticles.
Nanomaterials 08 00504 g013
Figure 14. Space charge decay characteristics of OIP.
Nanomaterials 08 00504 g014
Figure 15. Space charge decay characteristics of NOIP at a nanoparticle concentration of 0.015 g/L.
Nanomaterials 08 00504 g015
Figure 16. Decay time constants of the OIP and NOIP samples.
Nanomaterials 08 00504 g016
Figure 17. Surface morphology of OIP and NOIP: (a) fresh OIP, (b) fresh OIP subjected to 500 impulses, (cf) NOIP subjected to 500 impulses, with nanoparticle concentrations of 0.015, 0.06, 0.12, and 0.24 g/L, respectively.
Nanomaterials 08 00504 g017
Figure 18. Relation between surface roughness and nanoparticle concentration.
Nanomaterials 08 00504 g018
Figure 19. Oil film between electrode and cellulose paper.
Nanomaterials 08 00504 g019
Figure 20. Pore area in fresh OIP and OIP/NOIP subjected to 500 impulse voltage.
Nanomaterials 08 00504 g020
Figure 21. Diameter distribution of micro pores in OIP and NOIP.
Nanomaterials 08 00504 g021
Figure 22. Scanning electron microscope (SEM) images of OIP and NOIP: (a,b) fresh OIP (magnified 500 and 10,000 times, respectively), (c,d) fresh OIP subjected to 500 impulses (magnified 500 and 10,000 times, respectively), (e,f) NOIP subjected to 500 impulses (magnified 500 and 10,000 times, respectively).
Nanomaterials 08 00504 g022
Table 1. Parameters for the electrodes.
ElectrodeDiameterHeightEdge RadiusTip RadiusMaterialGap Distance
Needle---60 ± 10 μsBrass4 mm
Plate60 mm8 mm2.5 mm-Brass
Column25 mm25 mm1 mm-Brass-

