Article

High Frequency Hysteresis Losses on γ-Fe2O3 and Fe3O4: Susceptibility as a Magnetic Stamp for Chain Formation

1
Instituto de Magnetismo Aplicado (UCM-ADIF-CSIC), P.O. Box 155, Las Rozas, 28230 Madrid, Spain
2
Instituto de Ciencia de Materiales de Madrid/CSIC, Sor Juana Inés de la Cruz 3, 28049 Madrid, Spain
3
Université de Toulouse, INSA, UPS, Laboratoire de Physique et Chimie des Nano-Objets (LPCNO), 135 Avenue de Rangueil, F-31077 Toulouse, France and CNRS, UMR 5215, LPCNO, F-31077 Toulouse, France
4
Departamento de Física de Materiales, Universidad Complutense de Madrid, 28048 Madrid, Spain
*
Author to whom correspondence should be addressed.
Nanomaterials 2018, 8(12), 970; https://doi.org/10.3390/nano8120970
Submission received: 21 October 2018 / Revised: 10 November 2018 / Accepted: 21 November 2018 / Published: 24 November 2018
(This article belongs to the Collection Applications of Magnetic Nanomaterials)

Abstract

:
In order to understand the properties involved in the heating performance of magnetic nanoparticles during hyperthermia treatments, a systematic study of different γ-Fe2O3 and Fe3O4 nanoparticles has been done. High-frequency hysteresis loops at 50 kHz carried out on particles with sizes ranging from 6 to 350 nm show susceptibility χ increases from 9 to 40 for large particles and it is almost field independent for the smaller ones. This suggests that the applied field induces chain ordering in large particles but not in the smaller ones due to the competition between thermal and dipolar energy. The specific absorption rate (SAR) calculated from hysteresis losses at 60 mT and 50 kHz ranges from 30 to 360 W/gFe, depending on particle size, and the highest values correspond to particles ordered in chains. This enhanced heating efficiency is not a consequence of the intrinsic properties like saturation magnetization or anisotropy field but to the spatial arrangement of the particles.

Graphical Abstract

1. Introduction

Magnetic fluid hyperthermia has been intensively investigated since, in 1993, Jordan et al. [1] reported on the potential applications of colloidal monodomain ferrite particle suspensions (“magnetic-fluid”) subjected to an alternating magnetic field as nanoheaters for hyperthermia cancer treatment. Thenceforth, the investigation on particle composition, size and shape, size distribution [2,3,4,5], physicochemical properties [6,7,8,9], media viscosity [10,11,12,13], magnetic properties [14,15,16], toxicity and biocompatility [17,18], field amplitude and frequency [19], in-vivo and in-vitro experiments [20,21,22], and human trials [23,24] have grown exponentially looking to optimize this new thermal treatment.
The heating efficiencies of nanomaterials are mainly and mostly investigated using calorimetry, i.e., the magnetic fluid is subject to an ac-field and its temperature increase is measured as a function of time [23]. Under adiabatic conditions, the temperature increase of the colloid is proportional to the power loss of the nanoparticles, which in turn is related to their magnetic properties. However, adiabatic setups are unusual [25] and most of the experiments are performed on home-made or commercial setups, which give rise to many uncertainties [26,27] with the consequence of less reproducible experimental results due to the differences in thermal isolation of the colloids. Furthermore, calorimetric experiments give information regarding the influence of magnetic properties on the heating performance but only in an indirect way.
Few years ago, homemade ac-magnetometers have been developed in order to measure hysteresis loops under radiofrequency fields [28,29]. This new technology allows for deeper investigation in the understanding of the magnetic properties that optimizes the nanoparticle heating efficiencies and, due to the short measurement times (few seconds), allows a magnetic characterization at almost constant temperature, giving more reliable results than calorimetry characterizations, in which magnetic properties change with a temperature increase. For example, with this technique, it is possible to study the effect of size, effective anisotropy, colloidal viscosity, or dipolar interactions on the hysteresis cycles [12,30,31,32,33,34,35]. Additionally, by means of numerical simulations, it is possible to investigate different physical conditions that lead to hysteresis losses improvement and compare simulation results with high-frequency hysteresis loops [31,36].
In this work, the heating efficiency of maghemite (γ-Fe2O3) and magnetite (Fe3O4) with sizes ranging from 6 to 350 nm are investigated under ac- and dc-magnetometry. The hysteresis loops under high-frequency field for particle of 35 nm in size show an increase of the volume susceptibility, χ, with applied field that can be associated to chain formation, making these particles the most efficient nanoheaters. On the contrary, for smaller particles, thermal energy inhibits chain formation.

2. Materials and Methods

2.1. Synthesis of the Iron Oxide Nanoparticles

Magnetite particles of 35 nm (Fe3O4-35nm) are synthesized by oxidative precipitation of FeSO4 in the presence of ethanol [37]. The FeSO4 precipitation and the subsequent aging are carried out in a globe box to avoid the formation of other undesirable secondary iron phases due to an oxidizing atmosphere. To synthesize the Fe3O4-35nm sample, two solutions were prepared: a basic solution consisting on a mixture of 25 mL NaNO3 (2 M) and NaOH (4.2 M), 88 mL of distilled water and 62.5 mL of ethanol, and an acid solution formed by 13.9 g of FeSO4·7H2O dissolved in 50 mL of H2SO4 (0.01 M). N2 gas was previously passed through all the solutions to ensure that only Fe3O4 was present in the final precipitate. The basic solution was rapidly added to the acid solution and stirred for 15 min, forming a turquoise-colored compound known as green rust. When the precipitation was completed, green rust was introduced in a jacketed glass bottle previously heated to 90 °C, and the system was closed and undisturbed at this temperature for 24 h. Aging time was fixed at 24 h in order to reach conditions near equilibrium. At this point, the sample was cooled down at room temperature and the solid was separated by magnetic decantation and washed several times with distilled water.
To synthesize magnetite nanoparticles of 14 nm in diameter (Fe3O4-14nm), 75 mL of a NH4OH solution (25%) was rapidly added to a solution of FeCl2 (0.175 M) and FeCl3 (0.334 M). The addition was carried out rapidly at room temperature under vigorous stirring. Later, the sample was washed three times with distilled water using magnetic decantation.
To obtain the largest nanoparticles (Fe3O4-350nm), additional time was added as much as possible. Thus, urea (CO(NH2)2) was used as a base instead of NH4OH. The slow hydrolytic degradation of urea in acidic conditions generated ammonia (NH3), which increased the reaction pH very slowly, leading to the precipitation of large Fe3O4 nanoparticles. The reaction vessel was a 100 mL Duran® glass laboratory bottle, which can be used as a low-temperature hydrothermal reactor. An amount of 4.8 g of urea was added to 70 mL of distilled water and stirred vigorously. Then, 2.7 g de FeCl3·6H2O was added and, once it was totally dissolved, 1.06 g of FeCl2·4H2O was added to the mixture. To synthesize this sample, N2 was bubbled through the solution during the precursor’s addition to reduce the presence of oxygen as much as possible, which produces the oxidation of the iron intermediates and induces the formation of other iron phases different from Fe3O4. Then, the bottle was closed and introduced in a pre-heated oil bath at 90 °C for 48 h. Sample was under magnetic stirring during the whole process. After this time, the sample was cooled down to room temperature and the resulting black precipitate consisting of Fe3O4 particles was decanted using magnetic settling and washed several times until the supernatant was totally clear and transparent.
The other types of particles have been synthesized using coprecipitation of a mixture of the Fe(II) and Fe(III) salts in alkaline medium as previously described by other authors in detail [38]. The size of the particles can be controlled by the addition rate and order and also by the aging time and temperature (among others).
In order to enhance the colloidal properties of the particles and to oxidize Fe3O4 nanoparticles to γ-Fe2O3, which is more stable at room temperature and atmosphere, an acid treatment was carried out [39]. This treatment consisted of three steps: First, the Fe3O4 nanoparticles previously synthesized were mixed with 300 mL of HNO3 (2 M) and stirred for 15 min. In a second step, the supernatant was removed and Fe(NO3)3 1 M (75 mL) and distilled water (130 mL) were added. The mixture was stirred and heated up to the boiling point for 30 min. Then, it was cooled down to room temperature. Finally, in a third step, the supernatant was removed and another 300 mL of HNO3 (2 M) were added. The mixture was stirred for 15 min, the supernatant was removed and particles were washed three times with acetone and redispersed in distilled water. Acetone wastes were removed with a rotary evaporator. The maghemite nanoparticles obtained as a result of the oxidation of magnetite were named as γFe2O3-8nm. Longer stirring times during the third step led to the smallest nanoparticles (sample γFe2O3-6nm) as the particle surface was partially dissolved by nitric acid.
Slight modifications of this synthesis protocol led to larger nanoparticles. Thus, to synthesize the γFe2O3-12nm sample, Fe(II)-Fe(III) solution was added to the basic solution as slow as possible (drop by drop). In addition, the aging time was increased from 5 min to 1 h and the aging temperature was fixed to 90 °C. Afterwards, the oxidizing acid treatment was carried out as explained previously [10].

2.2. Structural and Colloidal Characterization

The crystal structure of the samples was identified by X-ray diffraction (XRD) performed in a Bruker D8 Advance diffractometer with a graphite monochromator using CuKα radiation (λ = 1.5406 Å). The patterns were collected within 10° and 90° in 2θ. The XRD spectra were indexed to an inverse spinel structure. The average particle size is calculated using Scherrer´s formula using the half width of the (311) X-ray diffraction line, except for sample Fe3O4-350nm, whose large size prevented the use of Scherrer´s formula for size determination.
Particles size and shape were studied by transmission electron microscopy (TEM) using two different apparatuses: a JEM-200 FX microscope operated at 200 keV and a JEM1010 microscope operated at 100 kV (both from Japan Electron Optics Laboratory Company Limited; Tokyo, Japan). TEM samples were prepared by placing one drop of a dilute particle suspension on an amorphous carbon-coated copper grid and evaporating the solvent at room temperature. The mean particle size of each sample was calculated by measuring the largest internal dimension of at least 100 particles. Afterward, data were fitted to a log normal distribution by obtaining the mean size d and standard deviation σ.
Infrared spectra of the samples diluted in KBr at 1% were recorded between 3600 and 300 cm−1 in a IFS 66V-S from Bruker (Massachusetts, United States). Iron concentration determination of all the samples is carried out on an inductively coupled plasma—optical emission spectrometer (ICP-OES) model OPTIME 2100DV from Perkin Elmer, Massachusetts, United States.
Colloidal properties of the samples were studied in a Zetasizer Nano S, from Malvern Instruments (Malvern, Worcestershire, United Kingdom). The hydrodynamic size of the particles in suspension was measured using dynamic light scattering (DLS) in intensity (Z-average) in acidic medium. Each hydrodynamic value was the result of three different measurements at different dilutions to avoid errors coming from back scattering and using the scattering index of water.

2.3. Magnetic Characterization

The dc-magnetic characterization was performed in a MPMS-5S SQUID magnetometer from Quantum Design, San Diego, California, United States. The measurements were carried out in special sample holders with 50 μL of the colloidal suspensions. For those samples with a blocking temperature close to room temperature, 5 μL of samples were dropped in a cotton to let the liquid to evaporate. Magnetization curves at 5 T and 10 K, 250 K, or 300 K are measured, as well as zero field-cooled and field-cooled (ZFC-FC) curves with an applied field of 10 mT from 10 to 250 K, in order to keep the sample frozen during the magnetic characterization, or up to 350 K in case of samples in cotton.
The ac-high frequency magnetization curves were measured in a home-made hysteresis loop meter, with a frequency of 50 kHz and magnetic field amplitude ranging between 10 and 60 mT [29].

3. Results and Discussion

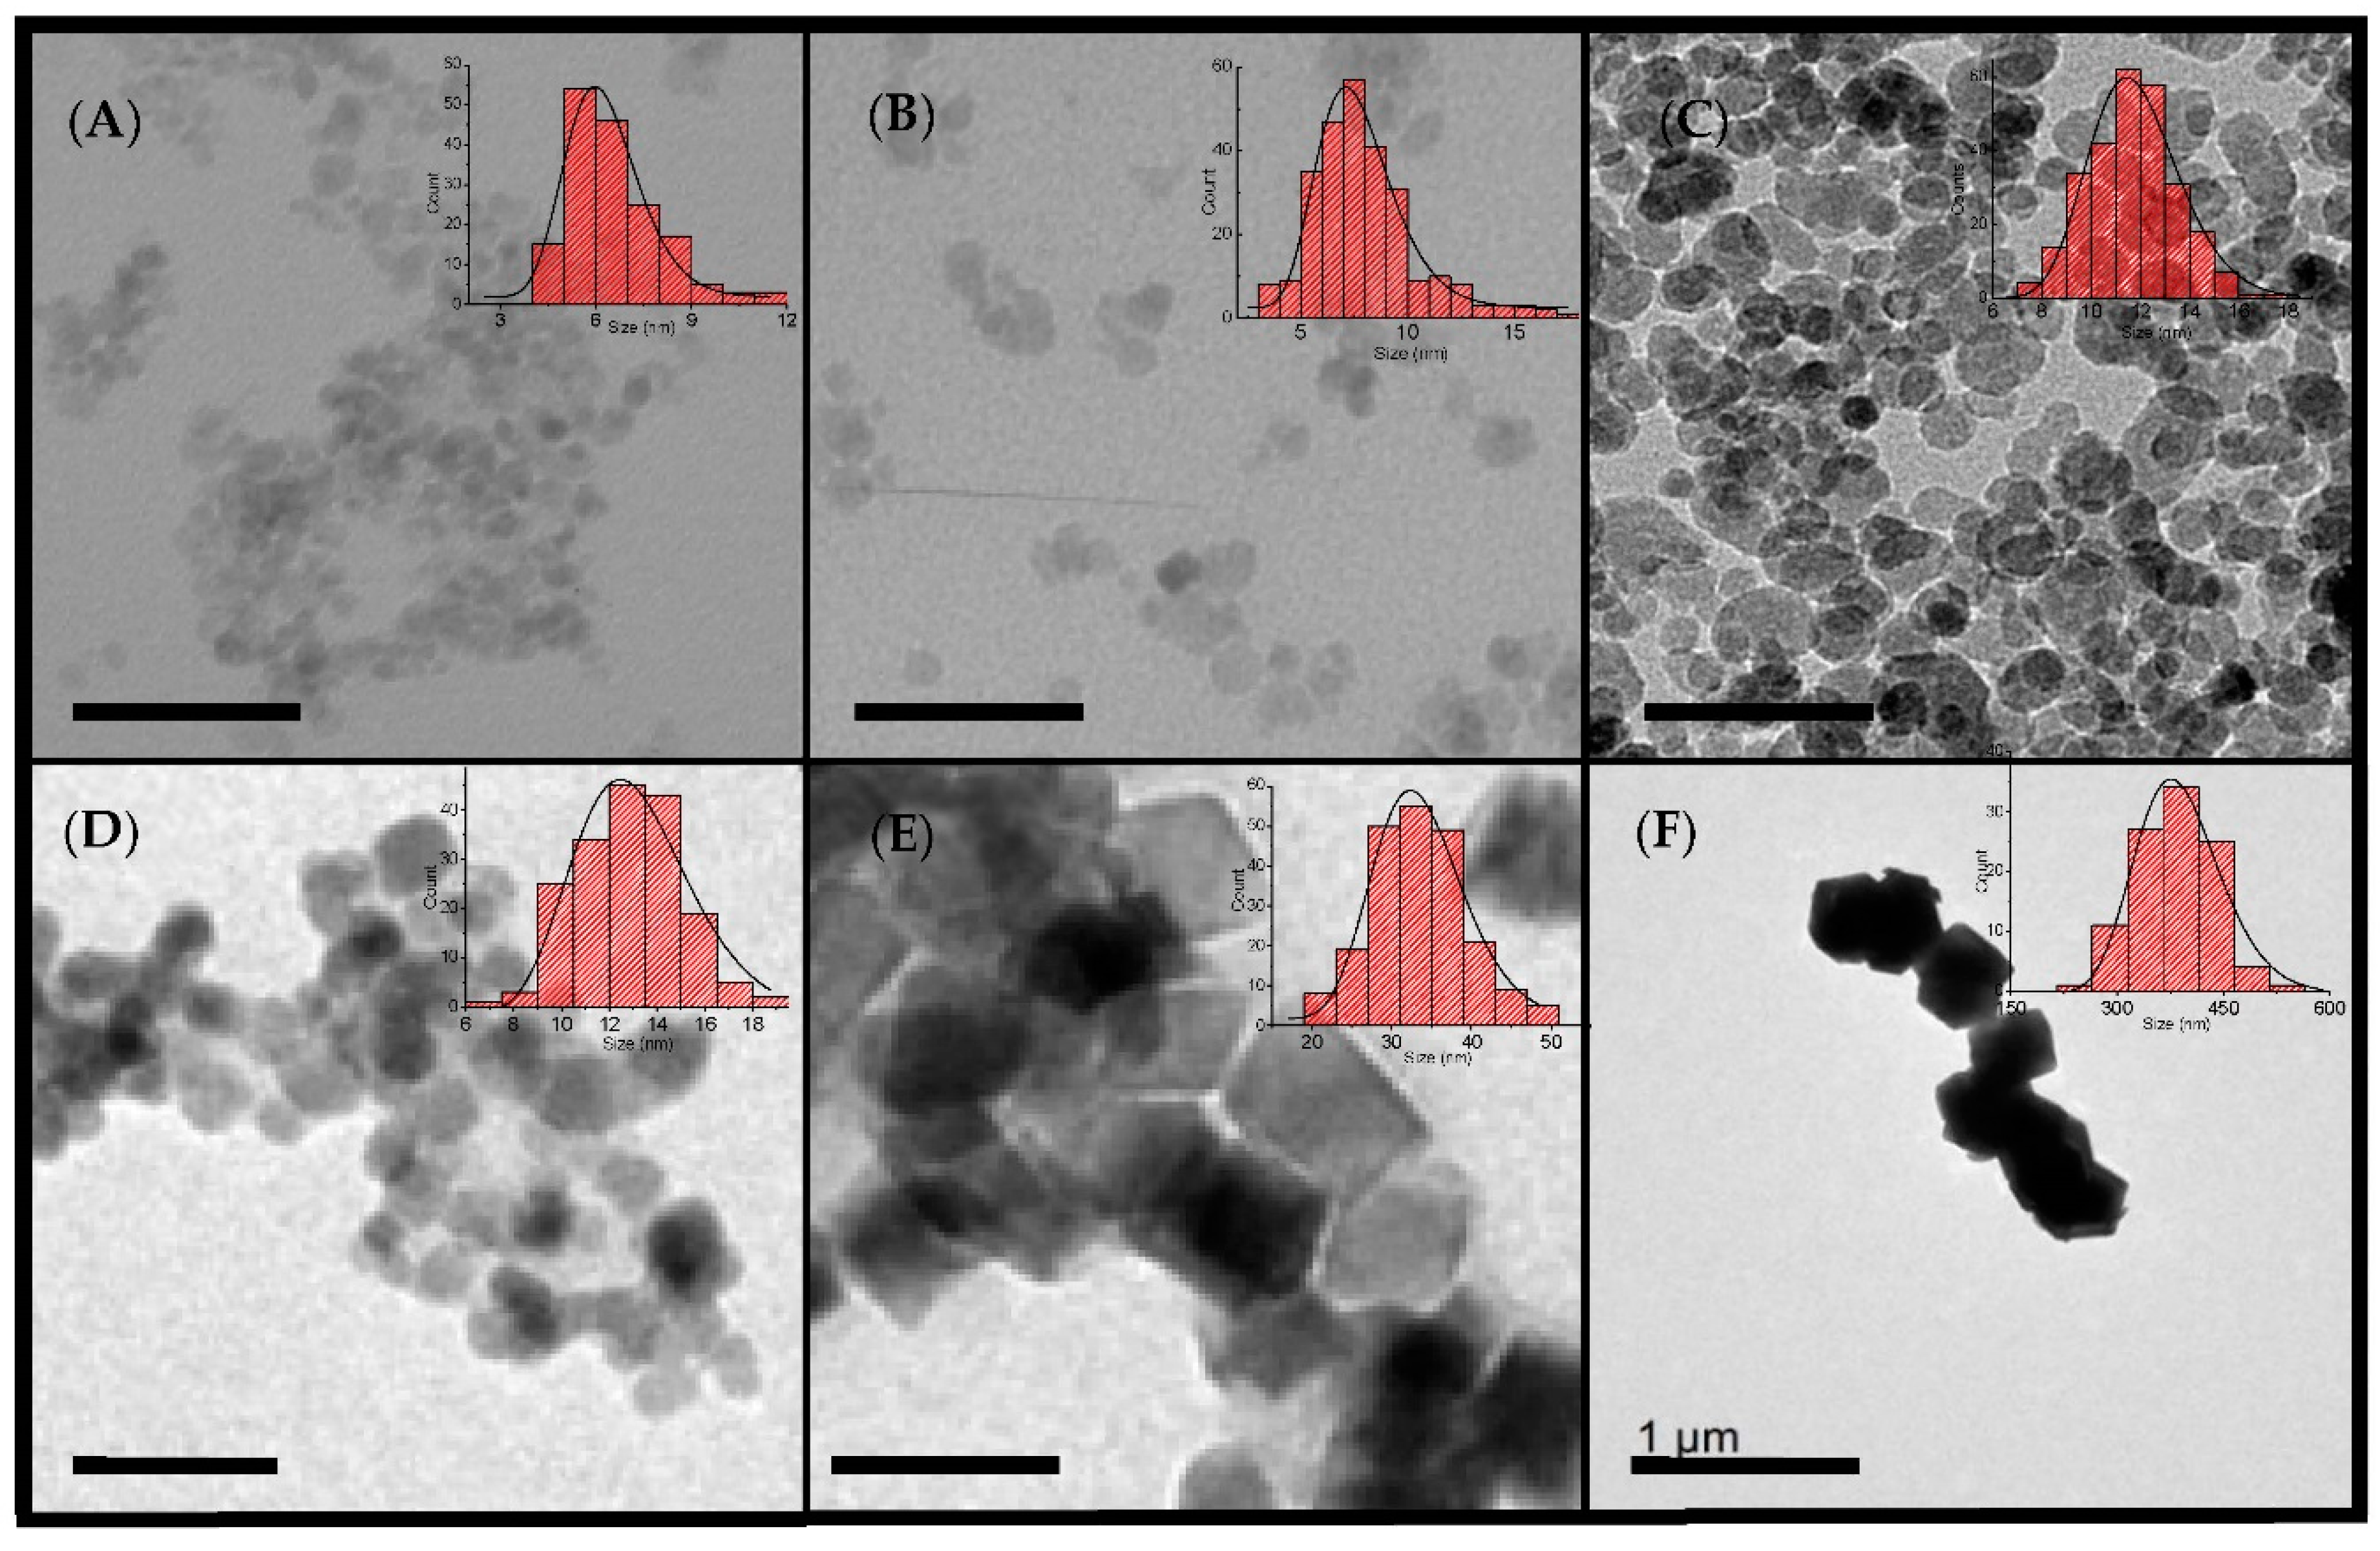
3.1. Structural and Colloidal Characterization

Morphological characteristics of the samples are shown in the TEM micrographs of Figure 1, where the insets show the particle sizes and distributions. As can be seen from Table 1, the size distribution was below the polydispersity degree (standard deviation/mean size) of 0.2 for all particles except the largest ones. Smaller particles (γFe2O3-6nm, γFe2O3-8nm, γFe2O3-12nm, and γFe2O3-14nm) had a rounded shape, whereas the largest particles (Fe3O4-35nm and Fe3O4-350nm) showed rhombohedric or cubic profiles. In light of these micrographs, it seems that particles were not isolated but formed aggregates. In addition, the large particles (Fe3O4-35nm and specially Fe3O4-350nm) tended to form chains, as observed in the micrographs (see more TEM images in Figure S1 from Supporting Information). The particle size observed using TEM was in good agreement with the average crystallite size calculated from the (311) reflection in the XRD pattern by means of Scherrer´s formula, suggesting that the particles were monocrystalline (Table 1) with the exception of Fe3O4-350nm. A progressive decrease of the diffraction peaks width can be observed in the XRD diffractograms as the particle size increases (see Figure S2). XRD patterns can be indexed to a cubic inverse spinel, either Fe3O4 or γ-Fe2O3.
The Fe3O4 and γ-Fe2O3 phases could not be discriminated using XRD. Magnetization measurements and Fourier transform infrared spectroscopy analysis (FTIR) were used for this purpose. Saturation magnetization values for samples Fe3O4-35nm and Fe3O4-350nm were close to the expected bulk value for Fe3O4. Concerning sample Fe3O4-14nm, previous studies have shown that particles produced by coprecipitation were usually formed using a large Fe3O4 core surrounded by an iron oxide shell as a result of the surface oxidation and disorder [37]. In this case, FTIR helped to determine the phases. Figure S3 shows in sample Fe3O4-14nm two broad bands at 580 and 400 cm−1, which is typical for Fe3O4 [40]. In addition, there was a change in the ratio between bands at 540 cm−1 (Fe-O tetrahedral coordination) and 450 cm−1 (Fe-O octahedral coordination), which was related to a change in the vacancies distribution during an oxidation process [41]. Therefore, sample γFe2O3-8nm seemed to be more oxidized than sample Fe3O4-14nm, and the last one was composed of both iron oxides.
DLS characterization of the γ-Fe2O3 nanoparticles showed an increase of the hydrodynamic size as particle size increased, with a polydispersity degree σ close to 0.2 for all the samples, suggesting that the nanoparticle aggregation degree was relative low (see Table 1 and Figure S4). In the case of Fe3O4, the 35 nm nanoparticles formed aggregates of a few particles, contrary to what was expected for large particle sizes (see Table 1 and Figure S5). On the contrary, the 14 nm particles formed larger aggregates than the 35 nm nanoparticles, probably due to the synthesis methods. On the other hand, the aggregates size of the 350 nanoparticles was larger than 2 μm with σ ≈ 0.5, as can be seen in Table 1 and Figure S5. In summary, with the exception of Fe3O4-350nm, all samples showed hydrodynamic sizes below 100 nm with low polydispersity at acidic pH, indicating good colloidal stability.

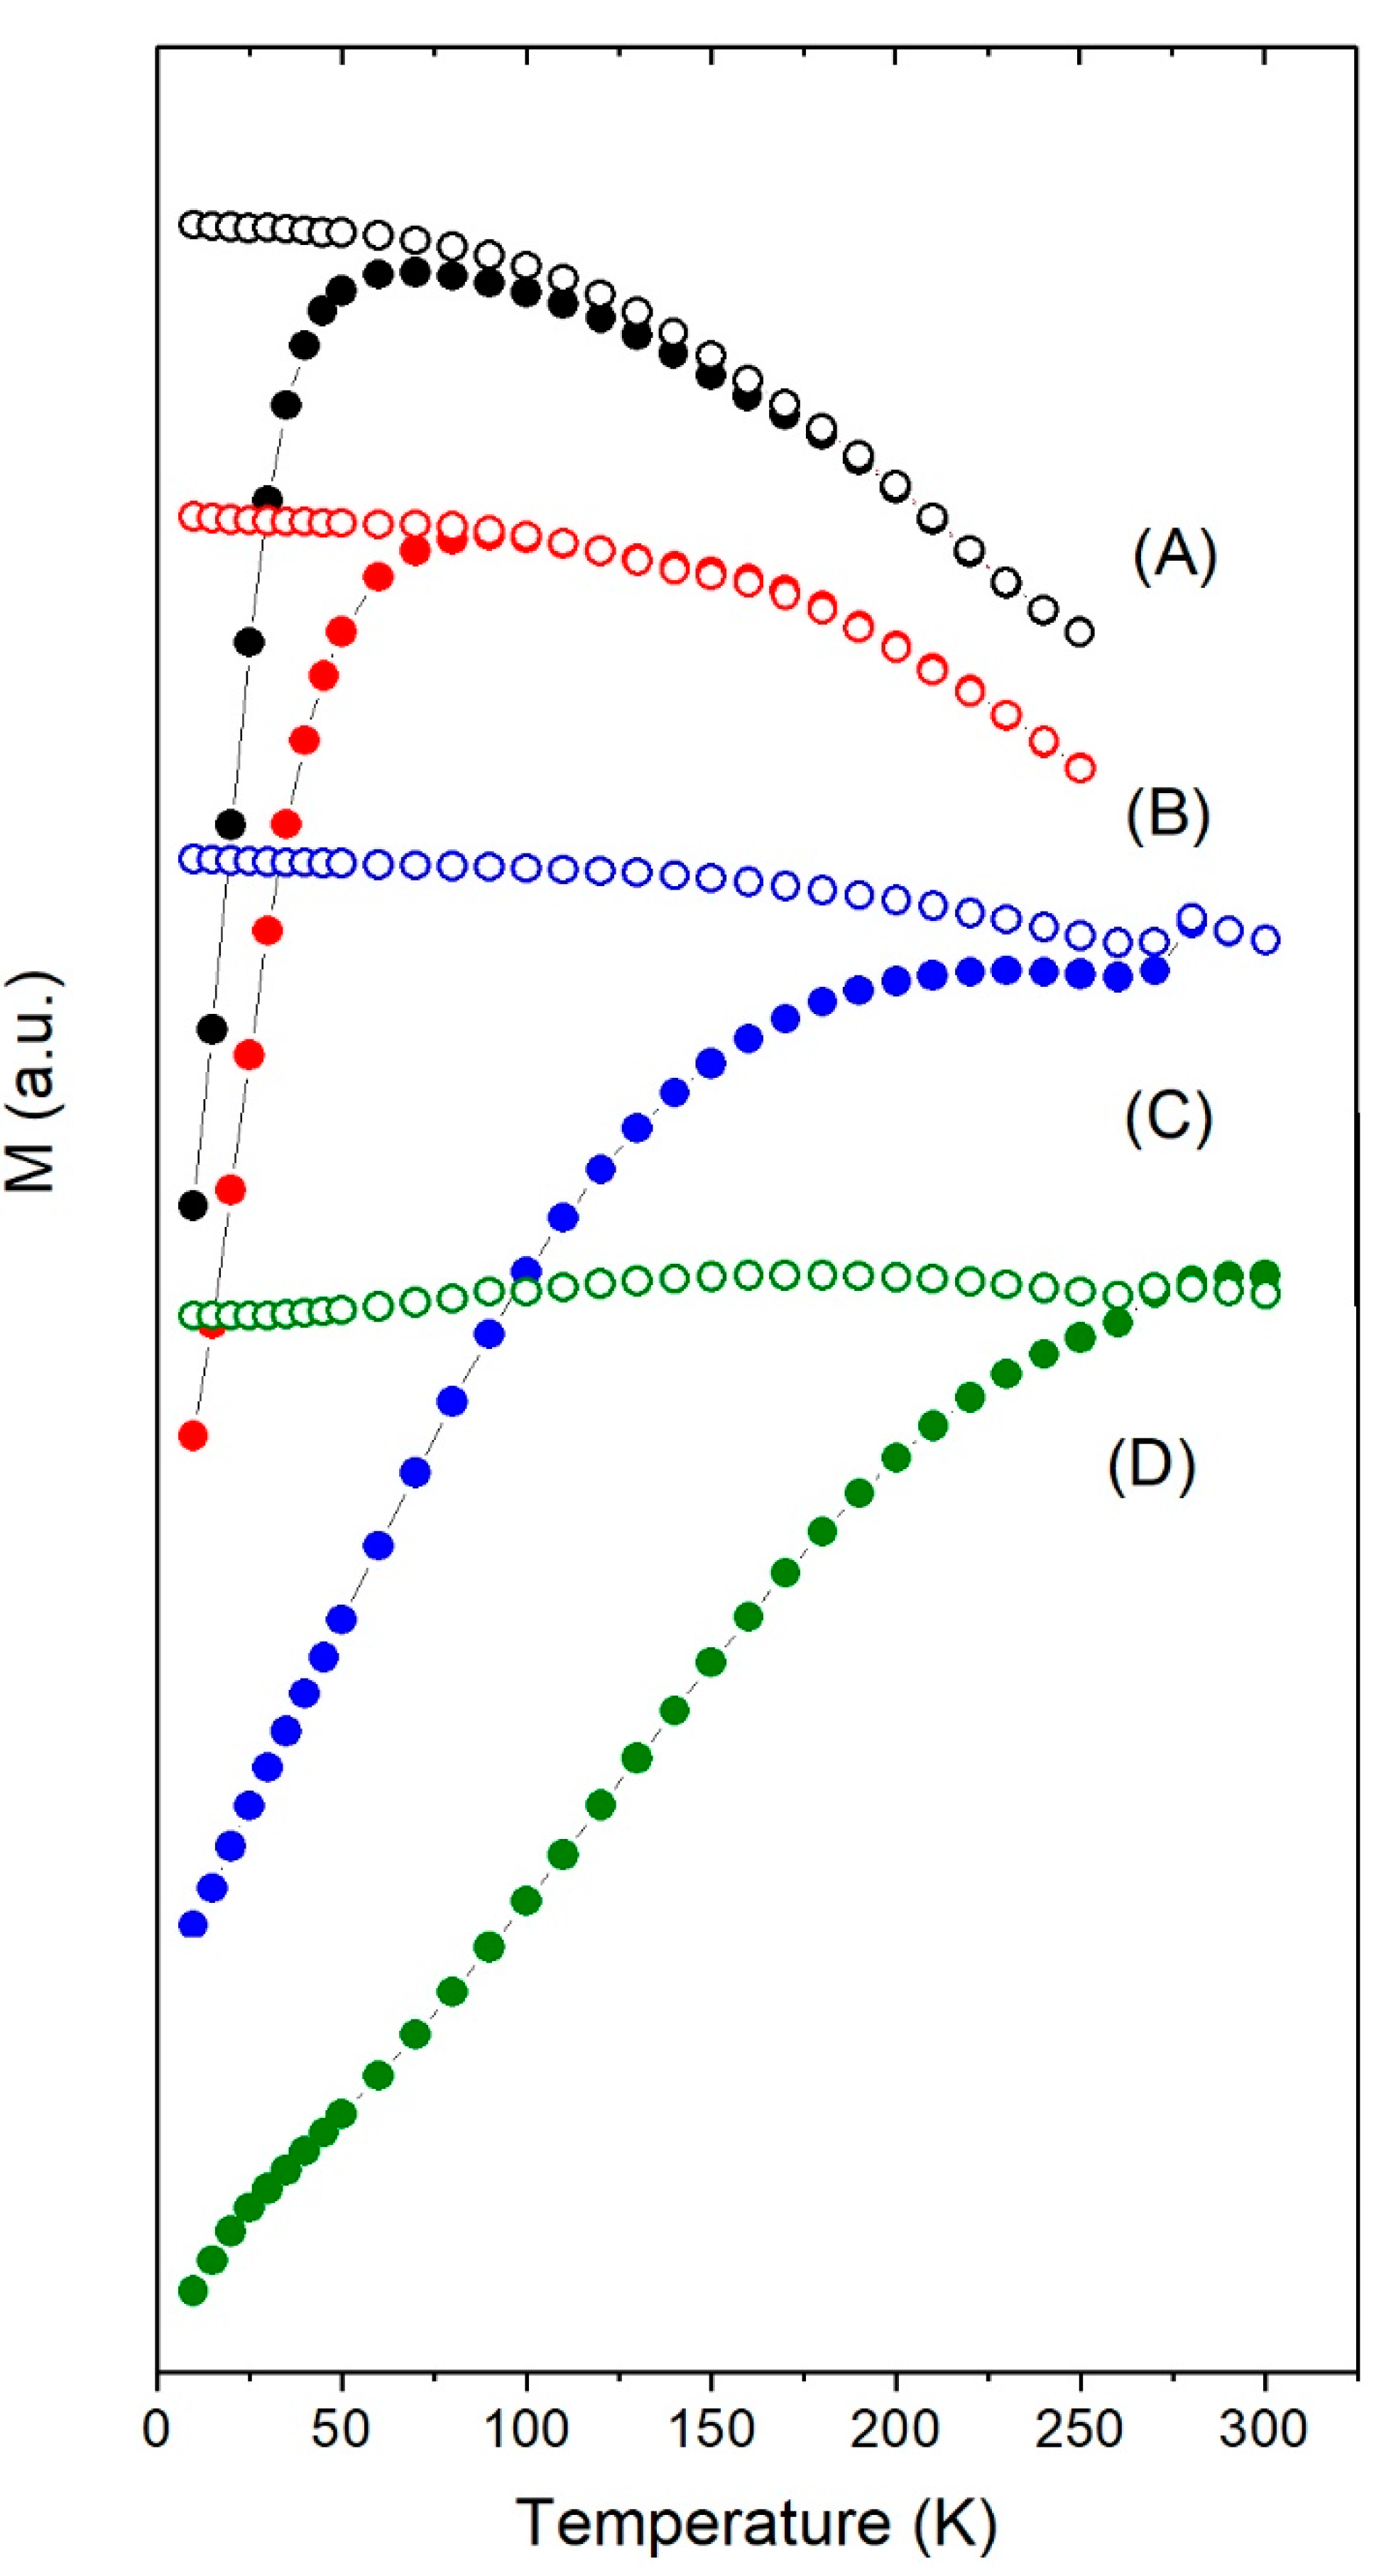
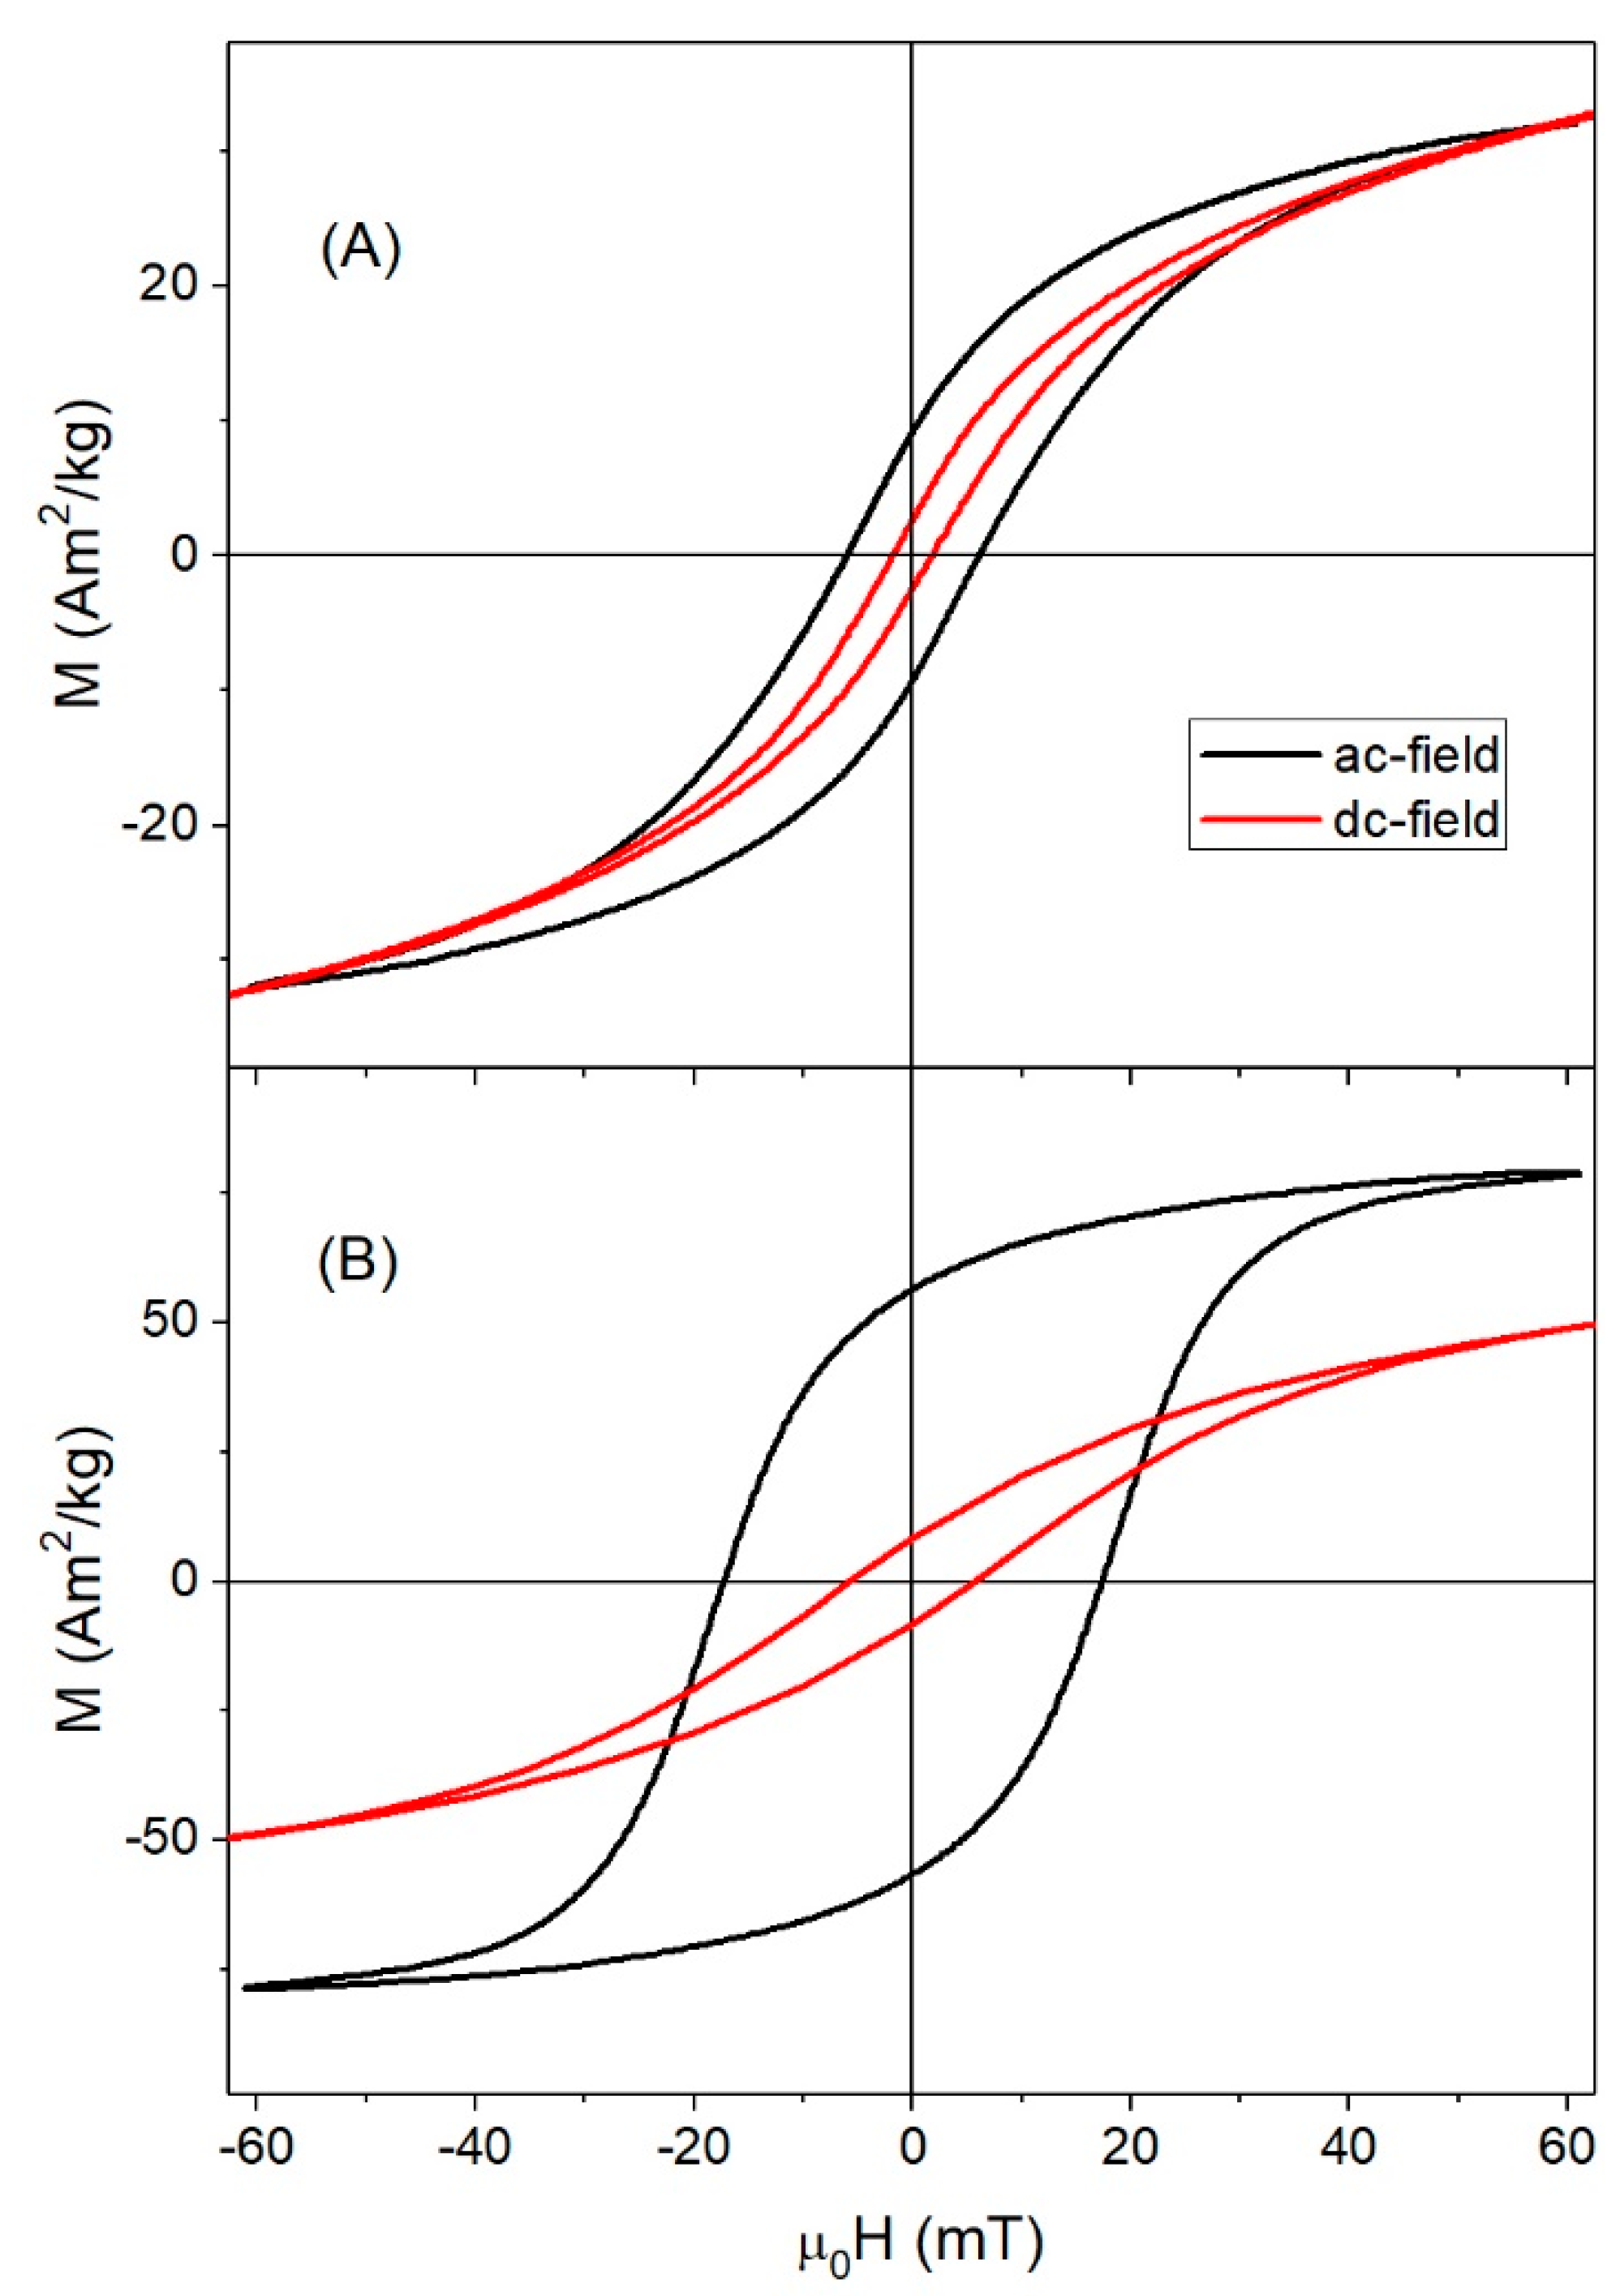
3.2. Magnetic Properties under dc-Field

Thermal dependence of magnetization and hysteresis loops of Fe3O4 and γ-Fe2O3 nanoparticles are shown in Figure 2 and Figure 3 and Figures S6 and S7. The saturation magnetization Ms, remanence Mr, blocking temperature Tb, and coercive field Hc values at 10 K extracted from the experimental data are shown in Table 1. Considering the Stoner–Wohlfarth model for a system of uniaxial non-interacting random oriented nanoparticles in single-domain regime, the effective magnetic anisotropy Keff and blocking temperature can be estimated as follows [42]:
K e f f μ 0 H c M s and T B K e f f V 25 k B
In the case of small particle sizes, thermal fluctuation can be significant for the calculation of the anisotropy field Hk and it has to be considered. The following formula gives the contribution of the thermal effects to Hc [16]:
μ 0 H c = 0.48 μ 0 H k ( 1 κ 0.8 ) κ = k B T K e f f V ln ( k B T μ 0 H max M s V f τ 0 ) lim T 0 μ 0 H c = 0.48 μ 0 H k
where f 10 4   Hz is the measuring frequency of the SQUID.
For the smallest particles of 6 and 8 nm, the Ms values in the hysteresis loops (see insets Figures S6 and S7) were smaller than the bulk values [43] but close to the expected ones for small particles [10]. For sizes larger than 12 nm, Ms was close to the bulk.
Mr was another relevant property of the hysteresis loops that gives information about the magnetic particles interactions. Following the Stoner–Wohlfarth model [42], M r / M s =   0.5 for a system of non-interacting single domain (SD) particles; thus, any deviation from this ratio gives information about the sort of interactions between particles. If this ratio is smaller than 0.5, dipolar interactions of random oriented nanoparticles can be considered responsible for the decrease; however, if the ratio is larger than 0.5, it is a signal of magnetic coupling as in the case of chain arrangement [31,44,45]. Under dc-field, M r / M s   0.3 for most of the nanoparticles, suggesting that they were randomly oriented and subjected to dipolar interactions. However, for the 6 and 8 nm nanoparticles, M r / M s <   0.3 because there were still unblocked magnetic moments at 10 K due to thermal fluctuations.
From Figure 2, it is observed that, in the case of γ-Fe2O3, Tb increased with particles size, as expected: 70 K for the 6 nm particles, 90 K for the 8 nm, 220 K for 12 nm, and around room temperature for the 14 nm. However, Tb >> 300 K for Fe3O4 nanoparticles of 14 and 35 nm. Note that Fe3O4 and γ-Fe2O3 of 14 nm have quite different Tb despite having the same size. For temperatures below 50 K, the incipient change in the ZFC slope of Fe3O4-35nm is characteristic for magnetic nanoparticles with sizes ranging from 20 to 50 nm and associated to the Verwey transition [46,47]. For the largest Fe3O4-350nm particles, the Verwey transition was observed around 120 K.
Hysteresis loops at room temperature show nearly superparamagnetic behavior with negligible Hc (<1 mT) and Mr for particles smaller than 14 nm (see Figures S6 and S7). At low temperatures, Hc increased with particle size in the case of γ-Fe2O3: 7.5, 11.0, 25.5, and 25.1 mT for the 6, 8, 12, and 14 nm sizes, respectively. In contrast, in the case of Fe3O4, Hc showed the opposite behavior: it decreased when increasing the particle size probably due to the formation of a flux closure state with small remanence. Figure 4 shows the size dependence of Hc. It is well established that the SD size d S D < 90   nm for Fe3O4 and γ-Fe2O3 [48], and as shown in Figure 4, all samples were SD with the exception of Fe3O4-350nm.
For the 6 and 8 nm nanoparticles, the decrease of Hc with decreasing particle size was given mainly by thermal fluctuations. As can be seen in Figure 5, the thermal fluctuations were significant for particles smaller than 8 nm, but negligible for particles larger than 12 nm with μ 0 H c 0.48   H K , as in the 0 K problem. By means of Equation (2), Hk could be calculated as a function of particle size d (see Table 1) or as a function of variable κ that contained information regarding the temperature and the intrinsic magnetic properties.
As can be seen from Figure 2 and Figure 3, for particle sizes close to 14 nm, γ-Fe2O3 showed superparamagnetic behaviour but Fe3O4 did not: Tb was close to room temperature for γ-Fe2O3 but above 350 K in the case of Fe3O4 (see Figure 3). Even when the sample Fe3O4-14nm was not subjected to any oxidative process, FTIR results showed a mixture of Fe3O4 and γ-Fe2O3 (see Figure S3), which suggested that the as-synthesized sample Fe3O4 suffered a spontaneous oxidation at the surface, giving rise to a kind of core/shell structure. In the case of nanoparticles, the presence of a shell can induce surface anisotropy that increases Keff due to the high surface-to-volume ratio [41], which was reflected in a high Hc of this sample. Besides magnetic interactions, this enhanced Keff could also explain the higher Tb in Fe3O4-14nm compared to γFe2O3-14nm.

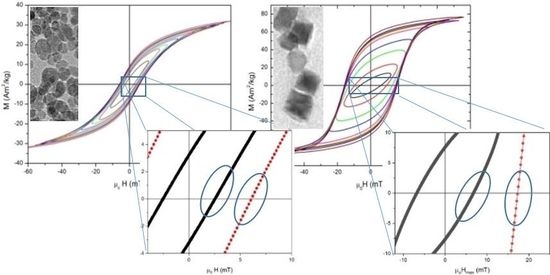
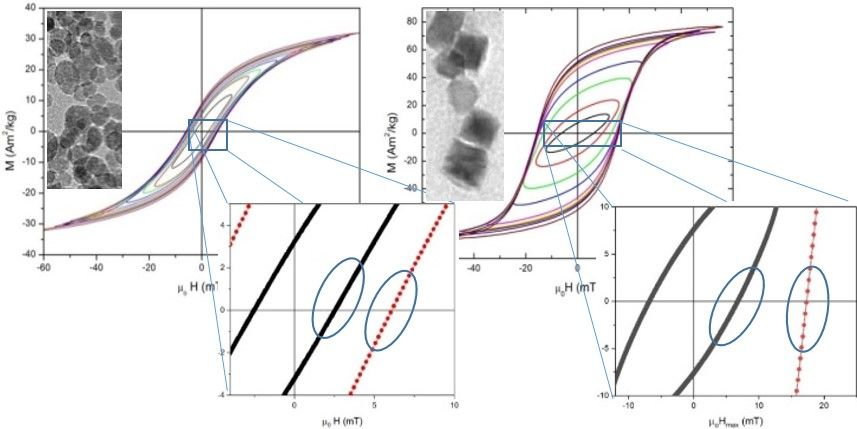
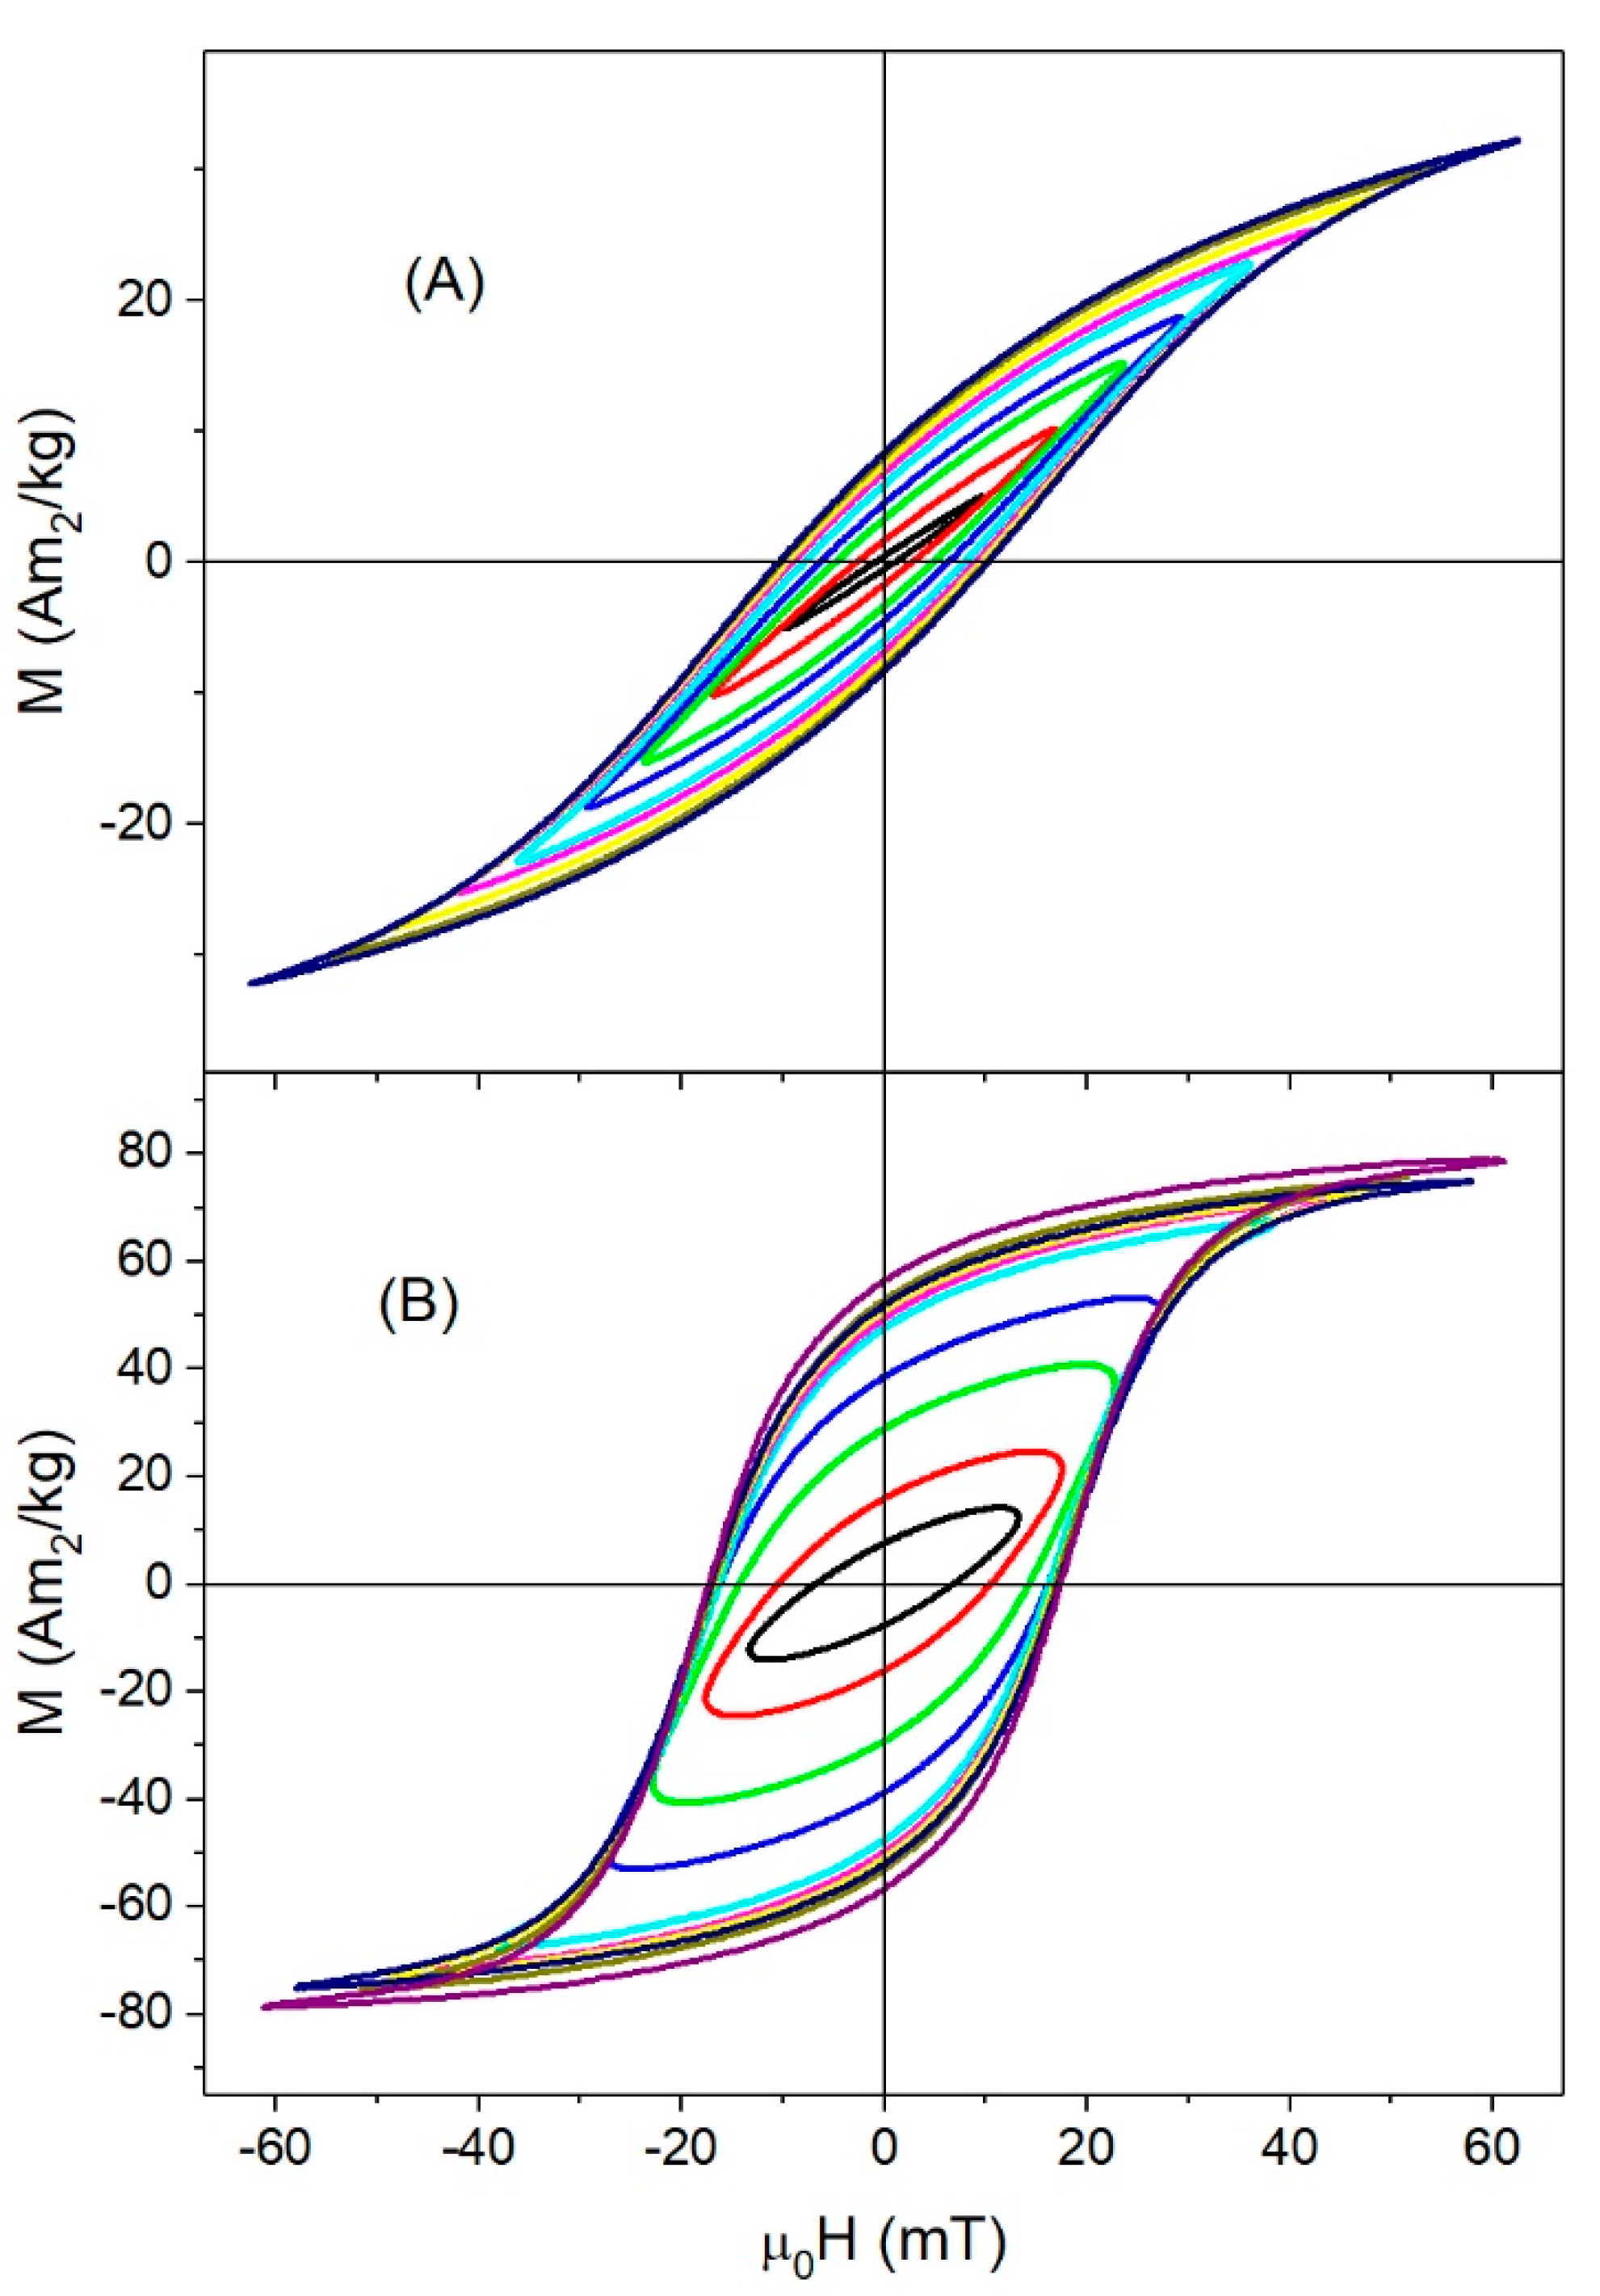
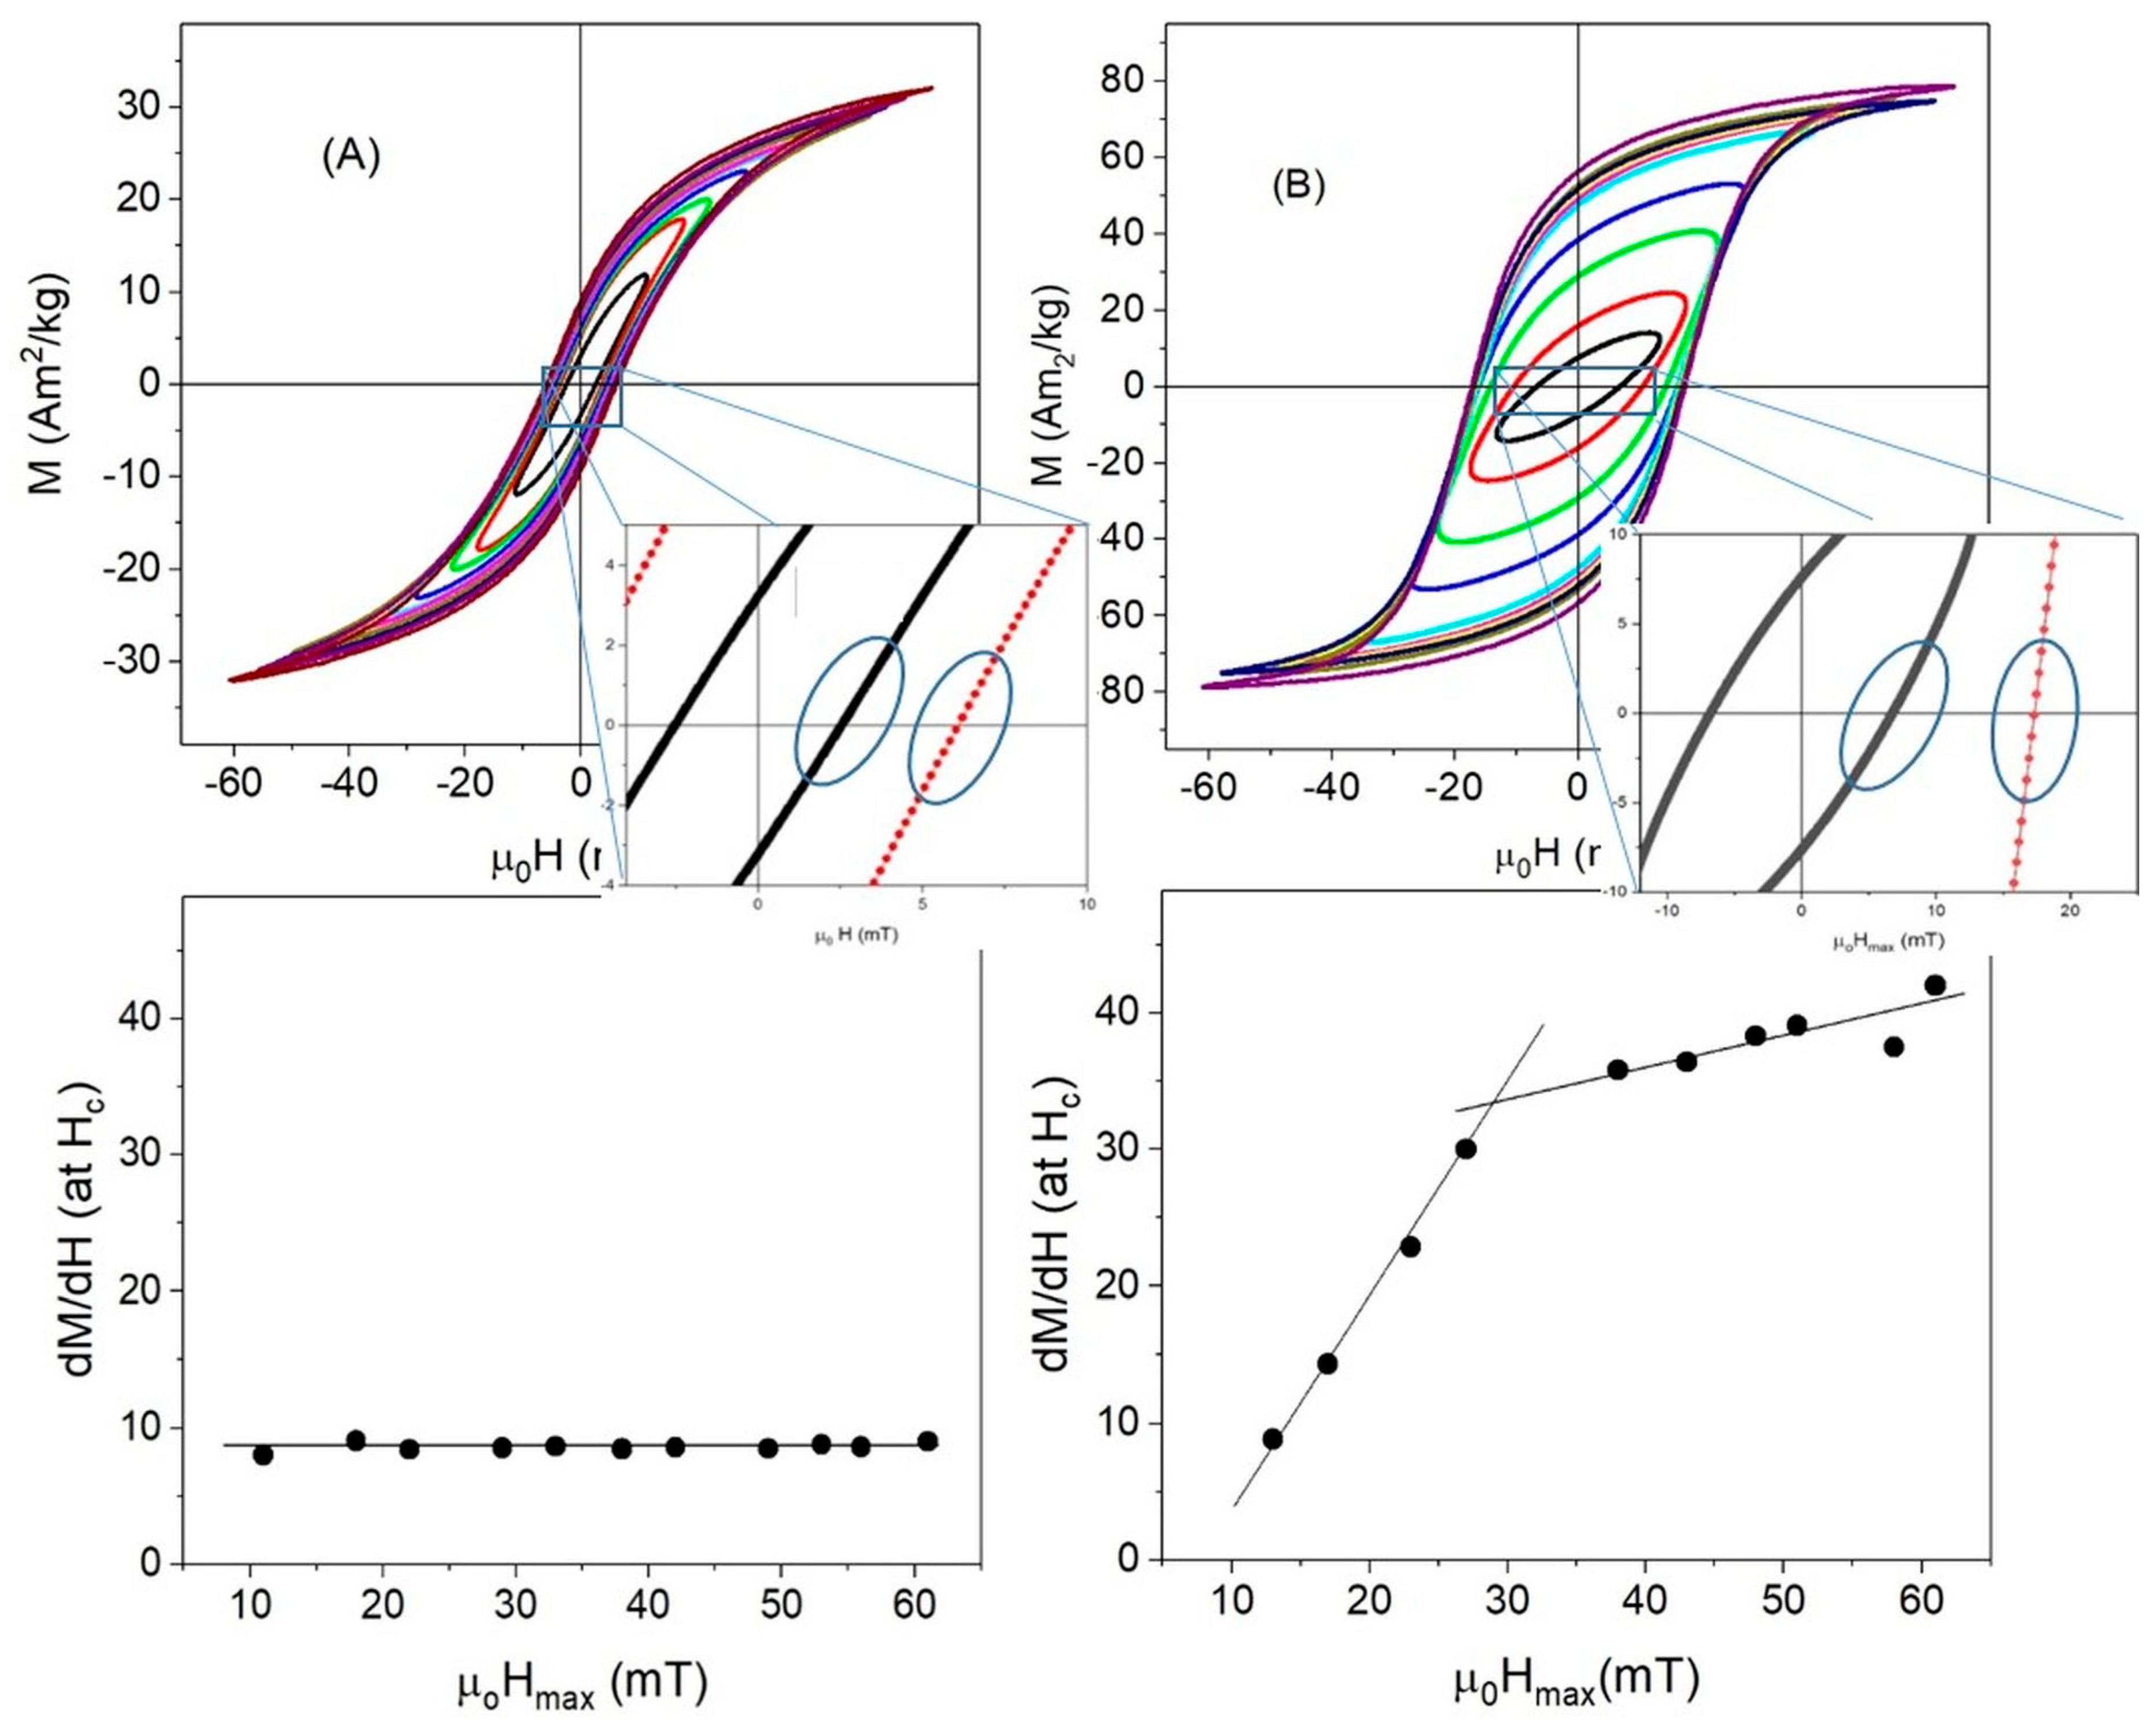
3.3. High-Frequency Hysteresis Loop Measurements

Unlike dc-measurements where the particles are in a solid matrix (either ice or cotton) and the only possible relaxation mechanism is by Neel, the ac-measurements are performed in the colloidal suspension; therefore, both Neel and Brown relaxations can be present. It has been previously reported that the relaxation mechanism of γ-Fe2O3 synthesized using a co-precipitation method is by Neel for particles with a size below 12 nm, whereas, due to size distribution, Neel and Brown relaxations are present for particles larger than 12 nm [10]. In the case of Fe3O4, the large magnetic anisotropy of the 14 nm nanoparticles allows one to assume that the main relaxation mechanism is Brownian, as well as that of the 35 nm nanoparticles, but in this case it was due to the size.
High-frequency hysteresis loops were measured at different applied fields in order to determine the dependence of hysteresis losses with field amplitude. The γ-Fe2O3-6nm and multidomain Fe3O4-350nm were excluded from this analysis because it was not possible to obtain reproducible hysteresis loops due to the low magnetization of the samples under an ac-field. Figure 6 and Figure 7 show the hysteresis curves for the γ-Fe2O3 and Fe3O4 samples, respectively. As can be seen, the areas under the curves increased with increasing applied field, with the exception of γFe2O3-8nm, which displayed an almost perfectly reversible hysteresis loop, due to the low Tb of this sample (Tb ≈ 90 K) (see Figure 6A). According to the linear response theory, the maximum area of the hysteresis loops took place when ωτR ≈ 1 [16]. By calculating the relaxation time τR of the 8 nm maghemite nanoparticles as τ R = τ 0 e K e f f V k B T with τ0 ≈ 10−9–10−11 and Keff calculated using Equation (1), it is found that ωτR << 1. Therefore, the sample had a fast relaxation even at high frequency, so the ac-hysteresis cycles still showed near superparamagnetic behavior at this frequency.
Samples γFe2O3-12nm and γFe2O3-14nm showed non-saturated ac-hysteresis cycles (Figure 6B,C), even for μ 0 H max > μ 0 H k . The coercive field values at maximum ac-field were 5.5 and 10.6 mT for the γFe2O3-12nm and γFe2O3-14nm, respectively, indicating that there were more particles blocked in γFe2O3-14nm. Considering that the samples had similar μ 0 H k under a dc-field (see Table 1) but Tb was smaller for γFe2O3-12nm than γFe2O3-14nm, it is clear that, due to size distribution, there existed a higher superparamagnetic contribution in γFe2O3-12nm.
High-frequency hysteresis loops for magnetite samples are shown in Figure 7. At low fields, Fe3O4-14nm showed an almost linear dependence of magnetization with magnetic field, the loops began to open for moderate fields, and finally, non-saturated hysteresis loops were observed at high fields. There were two possible reasons for the observation of non-saturated hysteresis loop: (i) a superparamagnetic behavior of the magnetization, because a Langevin function could not saturate even if μ 0 H max >   μ 0 H k , as in the previous cases, or (ii) μ 0 H max <   μ 0 H k , i.e., a much higher ac-field was needed for reaching the saturation.
Under a dc-field, this sample showed Tb > 350 K and μ 0 H c ( 10   K ) = 39   mT   ( μ 0 H k <   84   mT ) ; therefore, superparamagnetic behavior could be discarded and the origin of non-saturated hysteresis loops under an ac-field seems to lie in the high Hk, with μ 0 H max <   μ 0 H k .
On the contrary, Fe3O4-35nm showed almost ellipsoidal hysteresis loops for low fields, the areas became higher as applied field increases, and, finally, the saturation magnetization was reached for the maximum applied field μ 0 H max = 60   mT , a value close to the anisotropy field μ 0 H k = 57.7   mT . For these large particles, the main relaxation mechanism was Brownian.
It is worth noting that, at room temperature, M s a c for ac-fields were much smaller than M s d c for dc-fields for all samples except Fe3O4-35nm (see Table 1). For most samples, this was a consequence of the value of the applied field, μ 0 H max = 60   mT , as can be seen in Figure 8A for γFe2O3-12nm. When μ 0 H max = 60   mT , the samples showed the same magnetization for either ac- or dc-fields. However, for the largest particles, M s a c = 78   Am 2 / kg at 60 mT was close to M s d c = 75   Am 2 / kg reached when the dc-field was as high as 3 T, suggesting that particle interactions taking place at ac-field could have been responsible for the saturation of the magnetization in lower fields in an ac-field.
In this sample, M r / M s 0.7 , which is in contrast to the other ones, for which M r / M s 0.3 under ac-fields. These enhanced values of Ms and Mr/Ms suggest that, for large particles, a possible chain ordering took place under ac-fields, as it has been shown that chain formation improves the hysteresis losses [31,36,44,45,49]. Moreover, it has recently been reported that a cubic iron oxide nanoparticle arranged in a chain can display an extremely augmented anisotropy due to the collective response of the system [5]. In fact, this augmented anisotropy is not an intrinsic property of the particle but could be given by the demagnetizing factor of the chain.
In order to analyze the evident differences in the magnetic response under an ac-field, the susceptibility χ at Hc was calculated by fitting the slope of the hysteresis loops around Hc for samples γFe2O3-12nm and Fe3O4-35nm, as shown in Figure 9. Two very different behaviors were observed for small and large particles: (i) for 12 nm NPs, χ ≈ 9 was independent of the applied field, (ii) in the case of the large ones, χ ≈ 9 for low fields and increased up to χ ≈ 40 in high fields. Additionally, for the large particles, the susceptibility increase had two different rates: below 30 mT, χ increased at a rate of 1.5 mT−1 and above 30 mT at 0.2 mT−1. Chain formation changed the demagnetizing field and induced an easy axis in the direction of the field producing a larger squaring of the hysteresis loops, as observed in Figure 9. Consequently, a possible chain formation could be associated with the increase of the susceptibility in the large particles.
The question is why this effect was only observed in the large particles but not in the smaller ones. The competition between dipolar energy E d = μ 0 m 2 4 π r 3 , with m and r being the average magnetic moment and separation, respectively, and thermal energy E T = k B T could explain the inhibition of chain formation for the smaller particles. Assuming homogeneously distributed nanoparticles, the dipolar energy can be estimated by setting E d E T and E d 100   E T for the 12 nm and 35 nm NPs, respectively. It seems that, in the case of iron oxides, thermal fluctuations inhibited the formation of chains when the thermal energy was comparable to the dipolar one. If this is the case, the chain formation depended not only on V, Ms, and H, but also on T. Low temperatures would promote the formation of chains, and high temperatures would inhibit them. The two different regimes in the susceptibility increase could be associated to different processes involved in the chain formation: (i) the minimum energy to overcoming the dipolar interactions of initially random oriented nanoparticles, and (ii) the length of the chain, as reported by Serantes at al. [44]: the longer the chain, the higher the susceptibility and remanence are.

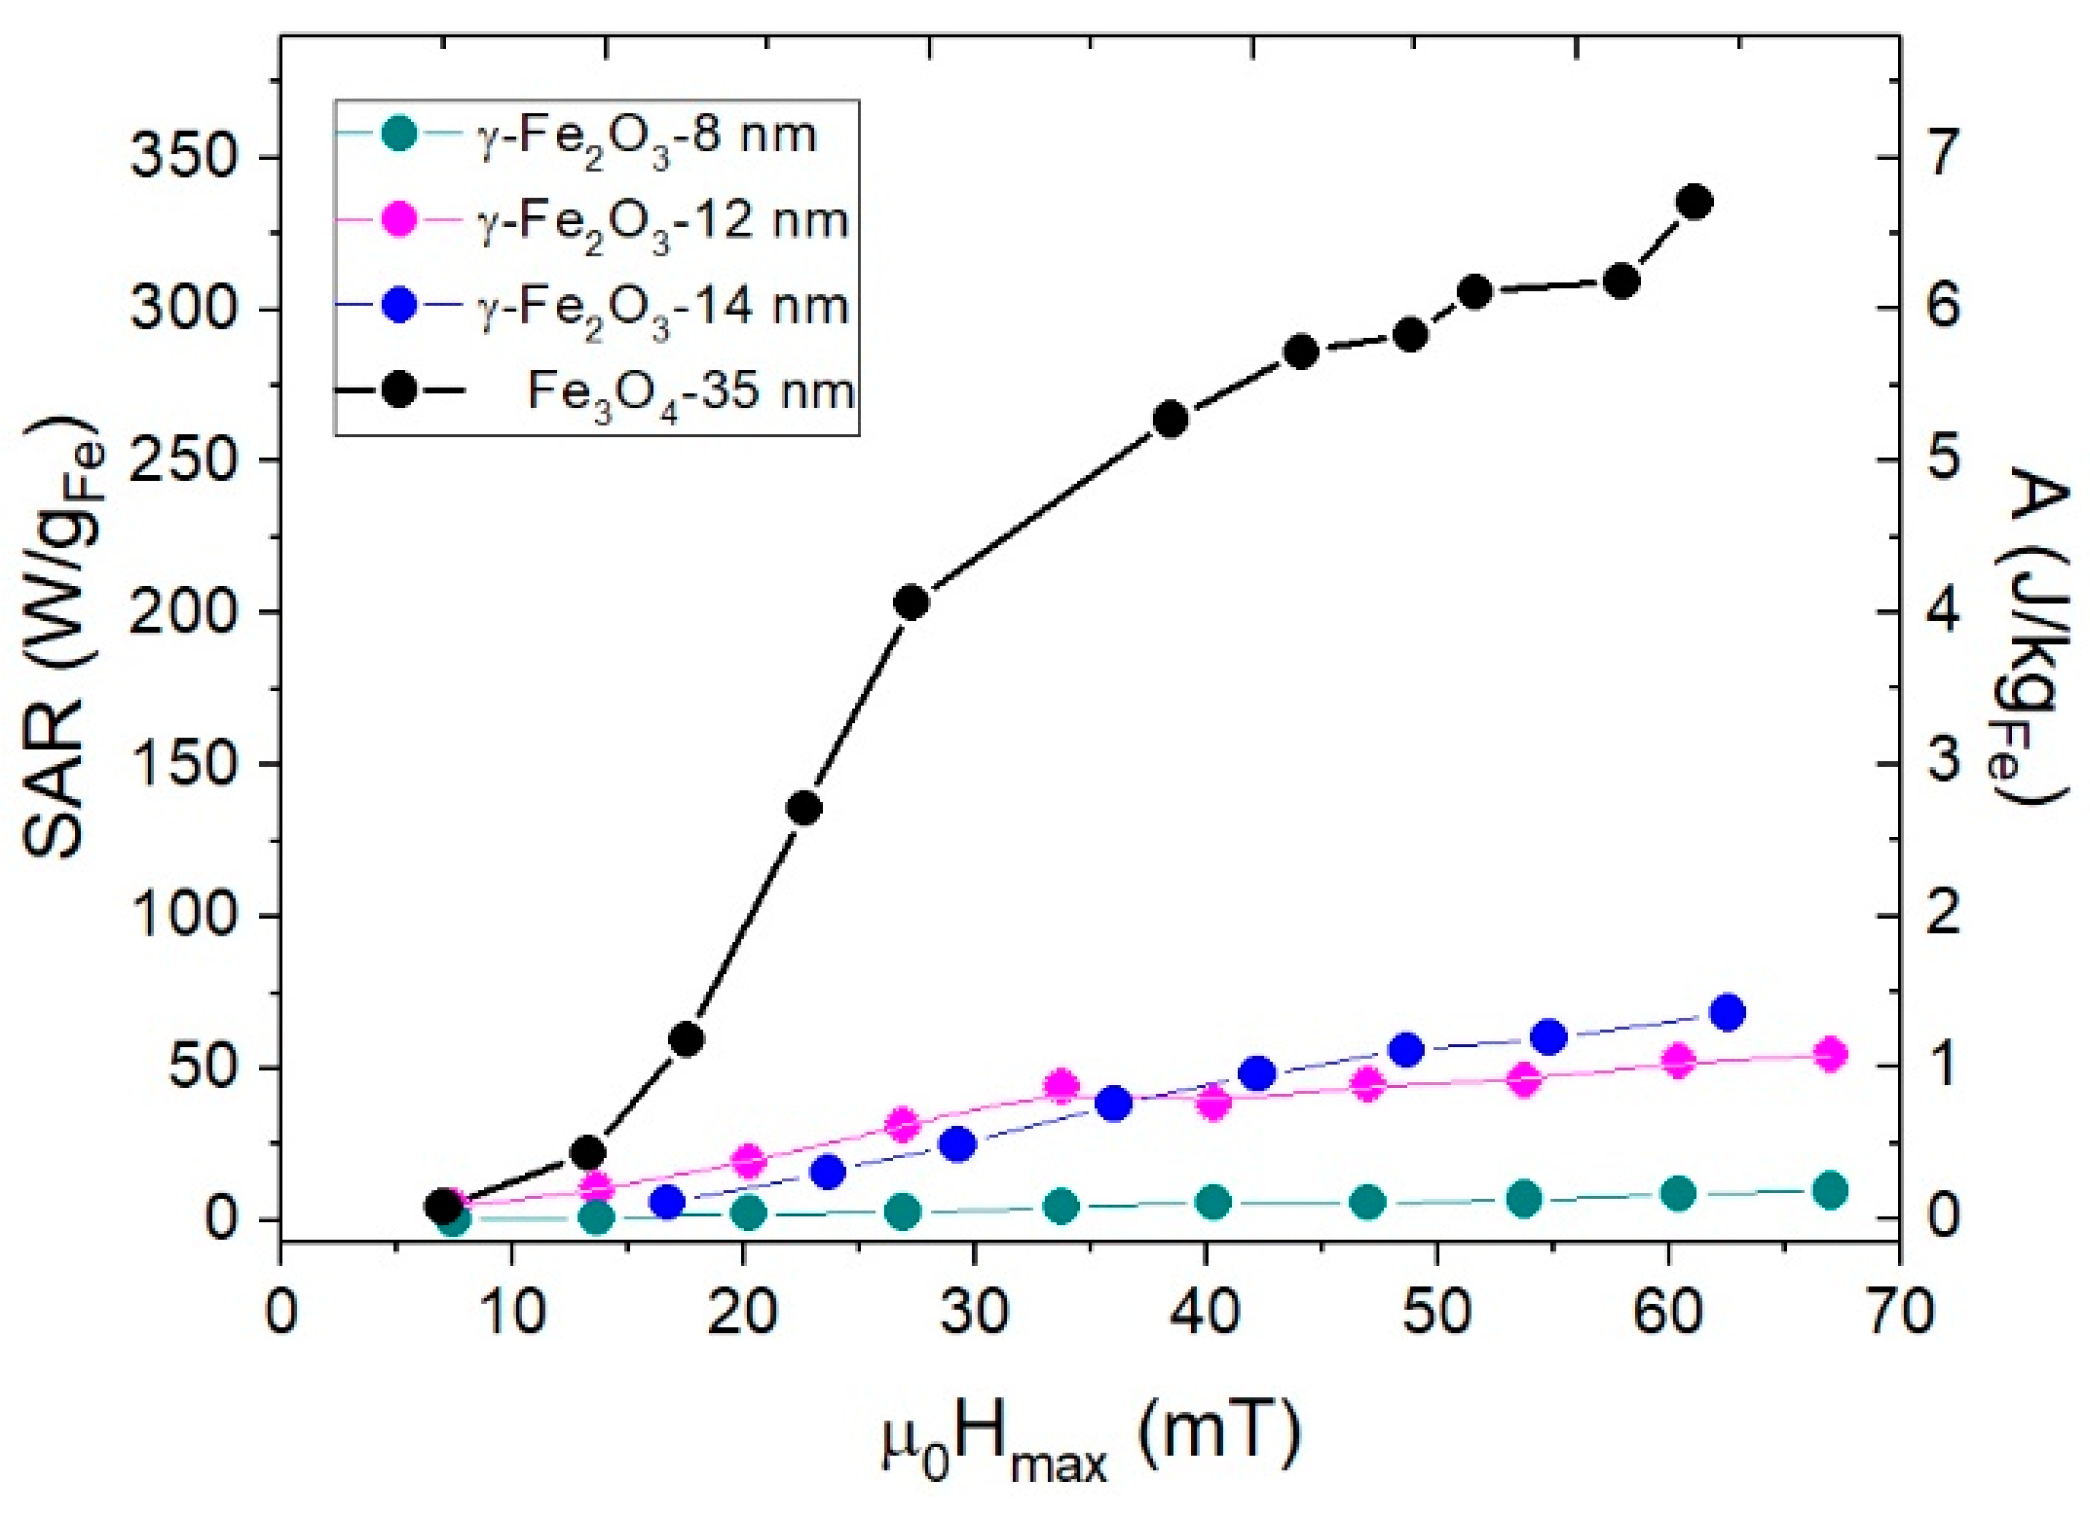
3.4. Specific Absorption Rate (SAR)

SAR can be determined by the area A of the high-frequency hysteresis loops [16] as S A R = A · f , where f = 50 kHz for these experiments. Figure 10 shows SAR and A values for samples γFe2O3-8nm, γFe2O3-12nm, γFe2O3-14nm, and Fe3O4-35nm, with both values given per Fe mass in order to compare with other reported results. It is worth noting that the differences in heating efficiency for the last sample compared to the rest of them. For field values close to the biomedical application range (μ0H < 20 mT), the SAR values were below 100 W/g, close to that reported previously for iron oxides synthesized by co-precipitation method [10,50]. For higher fields, the Fe3O4-35nm was much more efficient than the smaller ones; it is worth noting that this was not related to the intrinsic properties of the particles but to the capability of these particles to form chains and thus increasing the area under the hysteresis loops [51]. As can be seen from Figure 11, SAR shows a quadratic dependence with applied field up to μ 0 H = 30   mT . For higher fields, as the hysteresis loops reached saturation, there was still a weak linear dependence of the SAR with the applied field, which can be related to the susceptibility increase (see Figure 9).
To illustrate the effect of the anisotropy field on the heating efficiency, the SARs and A of the samples γFe2O3-14nm and Fe3O4-14nm with the same size but different Hk are compared in Figure 12. Even when they have the same size, γFe2O3-14nm was more efficient in heating because μ 0 H max μ 0 H k , whereas for Fe3O4-14nm, μ 0 H max 0.7   μ 0 H k , which is far from saturation.

4. Conclusions

This work presents results on the heating efficiencies of Fe3O4 and γ-Fe2O3 particles produced using a co-precipitation method with sizes ranging from 6 to 350 nm. The results show that particles of 8 nm still showed superparamagnetic behaviour under an ac-field of 60 mT at 50 kHz, showing very low heating efficiency. For 12, 14, and 35 nm particles, the heating efficiencies strongly depended on their magnetic properties. γ-Fe2O3 of 12 nm with Tb ≈ 220 K show non-saturated hysteresis losses under an ac-field due to a superparamagnetic contribution coming from still unblocked nanoparticles, even for a field as high as 60 mT. Fe3O4 and γ-Fe2O3 of the same size (d = 14 nm) have a markedly different magnetic response under ac-fields due to the relationship between μ 0 H max and μ 0 H k : μ 0 H max μ 0 H k for the 14 nm γ-Fe2O3 whereas μ 0 H max < μ 0 H k for the 14 nm Fe3O4, making the former much more efficient than the latter ones.
From all particles studied here, 35 nm magnetite particles were the best nanoheaters. The application of high-frequency fields increased χ from 9 to 40. This effect was attributed to the formation of chains under the influence of the applied magnetic field. This chain formation was not observed in smaller particles due to the competition between dipolar and thermal energy: for small particles, the thermal energy was comparable to the dipolar one, inhibiting the formation of chains, whereas in large particles, the magnetic energy overcame the thermal energy. It is worth noting this enhanced heating efficiency was not only a consequence of the particle’s intrinsic properties (like Ms, Hk, etc.), but it was also given by the kind of particle interactions. Therefore, the increase of magnetic susceptibility in the coercive field could be considered as a magnetic stamp for chain formation.

Supplementary Materials

The following are available online at https://www.mdpi.com/2079-4991/8/12/970/s1, Figure S1: TEM images of nanoparticles, Figure S2: XRD diffractions, Figure S3: FTIR spectra, Figure S4: DLS of γ-Fe2O3, Figure S5: DLS of Fe3O4, Figure S6: Hysteresis loops of γ-Fe2O3, Figure S7: Hysteresis loops of Fe3O4.

Author Contributions

Investigation and resources, I.M., R.C., G.B.d.S. and N.M.; formal analysis, A.H.; writing, visualization and supervision, J.C.; conceptualization, supervision, project administration and funding, P.d.l.P.

Funding

This research was funded by COST action RADIOMAG (TD1402), supported by COST (European Cooperation in Science and Technology), by the Spanish Ministry of Economy and Competitiveness (MAT2015-67557-C2-1-P), and by Nanomag European project (604448) seventh framework program. In addition, N.M. and J.C. thank ERC Advanced Grant (MONACAT 2015-694159) for financial support.

Acknowledgments

Y. Luengo is thankfully acknowledged for helping during the nanoparticle synthesis and M.P. Morales is thanked for kindly borrow her lab for particle synthesis and characterization and for fruitful discussions. XRD, DLS, TEM, FTIR, and chemical analysis were carried out in the Instituto de Ciencia de Materiales de Madrid (ICMM-CSIC) facilities.

Conflicts of Interest

The authors declare no conflict of interest.

References

  1. Jordan, A.; Wust, P.; Fahling, H.; John, W.; Hinz, A.; Felix, R. Inductive heating of ferrimagnetic particles ad magnetic fluids: Physical evaluation of their potential for hyperthermia. Int. J. Hyperth. 1993, 9, 51–68. [Google Scholar] [CrossRef]
  2. Gupta, A.K.; Gupta, M. Synthesis and surface engineering of iron oxide nanoparticles for biomedical applications. Biomaterials 2005, 26, 3995–4021. [Google Scholar] [CrossRef] [PubMed]
  3. Simeonidis, K.; Morales, M.P.; Marciello, M.; Angelakeris, M.; de la Presa, P.; Lazaro-Carrillo, A.; Tabero, A.; Villanueva, A.; Chubykalo-Fesenko, O.; Serantes, D. In-situ particles reorientation during magnetic hyperthermia application: Shape matters twice. Sci. Rep. 2016, 6, 38382. [Google Scholar] [CrossRef] [PubMed] [Green Version]
  4. Das, R.; Alonso, J.; Porshokouh, Z.N.; Kalappattil, V.; Torres, D.; Phan, M.H.; Garaio, E.; Garcia, J.A.; Llamazares, J.L.S.; Srikanth, H. Tunable High Aspect Ratio Iron Oxide Nanorods for Enhanced Hyperthermia. J. Phys. Chem. C 2016, 120, 10086–10093. [Google Scholar] [CrossRef]
  5. Wetterskog, E.; Jonasson, C.; Smilgies, D.-M.; Schaller, V.; Johansson, C.; Svedlindh, P. Colossal Anisotropy of the Dynamic Magnetic Susceptibility in Low-Dimensional Nanocube Assemblies. ACS Nano 2018, 12, 1403–1412. [Google Scholar] [CrossRef] [PubMed]
  6. Tartaj, P.; Morales, M.D.; Veintemillas-Verdaguer, S.; Gonzalez-Carreno, T.; Serna, C.J. The preparation of magnetic nanoparticles for applications in biomedicine. J. Phys. D Appl. Phys. 2003, 36, R182–R197. [Google Scholar] [CrossRef]
  7. Wilhelm, C.; Billotey, C.; Roger, J.; Pons, J.N.; Bacri, J.C.; Gazeau, F. Intracellular uptake of anionic superparamagnetic nanoparticles as a function of their surface coating. Biomaterials 2003, 24, 1001–1011. [Google Scholar] [CrossRef]
  8. Berry, C.C.; Curtis, A.S.G. Functionalisation of magnetic nanoparticles for applications in biomedicine. J. Phys. D Appl. Phys. 2003, 36, R198–R206. [Google Scholar] [CrossRef]
  9. Goya, G.F.; Grazu, V.; Ibarra, M.R. Magnetic nanoparticles for cancer therapy. Curr. Nanosci. 2008, 4, 1–16. [Google Scholar] [CrossRef]
  10. de la Presa, P.; Luengo, Y.; Multigner, M.; Costo, R.; Morales, M.P.; Rivero, G.; Hernando, A. Study of Heating Efficiency as a Function of Concentration, Size, and Applied Field in gamma-Fe2O3 Nanoparticles. J. Phys. Chem. C 2012, 116, 25602–25610. [Google Scholar] [CrossRef]
  11. Fortin, J.P.; Wilhelm, C.; Servais, J.; Menager, C.; Bacri, J.C.; Gazeau, F. Size-sorted anionic iron oxide nanomagnets as colloidal mediators for magnetic hyperthermia. J. Am. Chem. Soc. 2007, 129, 2628–2635. [Google Scholar] [CrossRef] [PubMed]
  12. Cabrera, D.; Lak, A.; Yoshida, T.; Materia, M.E.; Ortega, D.; Ludwig, F.; Guardia, P.; Sathya, A.; Pellegrino, T.; Teran, F.J. Unraveling viscosity effects on the hysteresis losses of magnetic nanocubes. Nanoscale 2017, 9, 5094–5101. [Google Scholar] [CrossRef] [PubMed]
  13. Ota, S.; Kitaguchi, R.; Takeda, R.; Yamada, T.; Takemura, Y. Rotation of Magnetization Derived from Brownian Relaxation in Magnetic Fluids of Different Viscosity Evaluated by Dynamic Hysteresis Measurements over a Wide Frequency Range. Nanomaterials 2016, 6, 170. [Google Scholar] [CrossRef] [PubMed]
  14. Rosensweig, R.E. Heating magnetic fluid with alternating magnetic field. J. Magn. Magn. Mater. 2002, 252, 370–374. [Google Scholar] [CrossRef]
  15. Ma, M.; Wu, Y.; Zhou, H.; Sun, Y.K.; Zhang, Y.; Gu, N. Size dependence of specific power absorption of Fe3O4 particles in AC magnetic field. J. Magn. Magn. Mater. 2004, 268, 33–39. [Google Scholar] [CrossRef]
  16. Carrey, J.; Mehdaoui, B.; Respaud, M. Simple models for dynamic hysteresis loop calculations of magnetic single-domain nanoparticles: Application to magnetic hyperthermia optimization. J. Appl. Phys. 2011, 109, 083921. [Google Scholar] [CrossRef]
  17. Mornet, S.; Vasseur, S.; Grasset, F.; Duguet, E. Magnetic nanoparticle design for medical diagnosis and therapy. J. Mater. Chem. 2004, 14, 2161–2175. [Google Scholar] [CrossRef]
  18. Gupta, A.K.; Naregalkar, R.R.; Vaidya, V.D.; Gupta, M. Recent advances on surface engineering of magnetic iron oxide nanoparticles and their biomedical applications. Nanomedicine 2007, 2, 23–39. [Google Scholar] [CrossRef] [PubMed]
  19. Hergt, R.; Dutz, S.; Muller, R.; Zeisberger, M. Magnetic particle hyperthermia: Nanoparticle magnetism and materials development for cancer therapy. J. Phys. Condes. Matter 2006, 18, S2919–S2934. [Google Scholar] [CrossRef]
  20. Dobson, J. Magnetic nanoparticles for drug delivery. Drug Dev. Res. 2006, 67, 55–60. [Google Scholar] [CrossRef]
  21. Asin, L.; Ibarra, M.R.; Tres, A.; Goya, G.F. Controlled Cell Death by Magnetic Hyperthermia: Effects of Exposure Time, Field Amplitude, and Nanoparticle Concentration. Pharm. Res. 2012, 29, 1319–1327. [Google Scholar] [CrossRef] [PubMed]
  22. Villanueva, A.; de la Presa, P.; Alonso, J.M.; Rueda, T.; Martínez, A.; Crespo, P.; Morales, M.P.; Gonzalez-Fernandez, M.A.; Valdés, J.; Rivero, G. Hyperthermia HeLa Cell Treatment with Silica-Coated Manganese Oxide Nanoparticles. J. Phys. Chem. C 2010, 114, 1976–1981. [Google Scholar] [CrossRef] [Green Version]
  23. Jordan, A.; Scholz, R.; Maier-Hauff, K.; Johannsen, M.; Wust, P.; Nadobny, J.; Schirra, H.; Schmidt, H.; Deger, S.; Loening, S.; et al. Presentation of a new magnetic field therapy system for the treatment of human solid tumors with magnetic fluid hyperthermia. J. Magn. Magn. Mater. 2001, 225, 118–126. [Google Scholar] [CrossRef]
  24. Johannsen, M.; Gneveckow, U.; Eckelt, L.; Feussner, A.; Waldofner, N.; Scholz, R.; Deger, S.; Wust, P.; Loening, S.A.; Jordan, A. Clinical hyperthermia of prostate cancer using magnetic nanoparticles: Presentation of a new interstitial technique. Int. J. Hyperth. 2005, 21, 637–647. [Google Scholar] [CrossRef] [Green Version]
  25. Natividad, E.; Castro, M.; Mediano, A. Accurate measurement of the specific absorption rate using a suitable adiabatic magnetothermal setup. Appl. Phys. Lett. 2008, 92, 093116. [Google Scholar] [CrossRef] [Green Version]
  26. Lahiri, B.B.; Ranoo, S.; Philip, J. Uncertainties in the estimation of specific absorption rate during radiofrequency alternating magnetic field induced non-adiabatic heating of ferrofluids. J. Phys. D Appl. Phys. 2017, 50, 455005. [Google Scholar] [CrossRef] [Green Version]
  27. Natividad, E.; Castro, M.; Mediano, A. Adiabatic vs. non-adiabatic determination of specific absorption rate of ferrofluids. J. Magn. Magn. Mater. 2009, 321, 1497–1500. [Google Scholar] [CrossRef]
  28. Garaio, E.; Collantes, J.M.; Garcia, J.A.; Plazaola, F.; Mornet, S.; Couillaud, F.; Sandre, O. A wide-frequency range AC magnetometer to measure the specific absorption rate in nanoparticles for magnetic hyperthermia. J. Magn. Magn. Mater. 2014, 368, 432–437. [Google Scholar] [CrossRef]
  29. Connord, V.; Mehdaoui, B.; Tan, R.P.; Carrey, J.; Respaud, M. An air-cooled Litz wire coil for measuring the high frequency hysteresis loops of magnetic samples-A useful setup for magnetic hyperthermia applications. Rev. Sci. Instrum. 2014, 85, 093904. [Google Scholar] [CrossRef] [PubMed]
  30. Le, A.T.; Giang, C.D.; Tam, L.T.; Tuan, T.Q.; Phan, V.N.; Alonso, J.; Devkota, J.; Garaio, E.; Garcia, J.A.; Martin-Rodriguez, R.; et al. Enhanced magnetic anisotropy and heating efficiency in multi-functional manganese ferrite/graphene oxide nanostructures. Nanotechnology 2016, 27, 155707. [Google Scholar] [CrossRef] [PubMed] [Green Version]
  31. Mehdaoui, B.; Tan, R.P.; Meffre, A.; Carrey, J.; Lachaize, S.; Chaudret, B.; Respaud, M. Increase of magnetic hyperthermia efficiency due to dipolar interactions in low-anisotropy magnetic nanoparticles: Theoretical and experimental results. Phys. Rev. B 2013, 87, 174419. [Google Scholar] [CrossRef]
  32. Ovejero, J.G.; Cabrera, D.; Carrey, J.; Valdivielso, T.; Salas, G.; Teran, F.J. Effects of inter- and intra-aggregate magnetic dipolar interactions on the magnetic heating efficiency of iron oxide nanoparticles. Phys. Chem. Chem. Phys. 2016, 18, 10954–10963. [Google Scholar] [CrossRef] [PubMed]
  33. Nemati, Z.; Alonso, J.; Rodrigo, I.; Das, R.; Garaio, E.; García, J.Á.; Orue, I.; Phan, M.-H.; Srikanth, H. Improving the Heating Efficiency of Iron Oxide Nanoparticles by Tuning Their Shape and Size. J. Phys. Chem. C 2018, 122, 2367–2381. [Google Scholar] [CrossRef]
  34. Cabrera, D.; Coene, A.; Leliaert, J.; Artés-Ibáñez, E.J.; Dupré, L.; Telling, N.D.; Teran, F.J. Dynamical Magnetic Response of Iron Oxide Nanoparticles Inside Live Cells. ACS Nano 2018, 12, 2741–2752. [Google Scholar] [CrossRef] [PubMed]
  35. Ovejero, J.G.; Morales, I.; de la Presa, P.; Mille, N.; Carrey, J.; Garcia, M.A.; Hernando, A.; Herrasti, P. Hybrid nanoparticles for magnetic and plasmonic hyperthermia. Phys. Chem. Chem. Phys. 2018, 20, 24065–24073. [Google Scholar] [CrossRef] [PubMed]
  36. Mehdaoui, B.; Meffre, A.; Carrey, J.; Lachaize, S.; Lacroix, L.-M.; Gougeon, M.; Chaudret, B.; Respaud, M. Optimal Size of Nanoparticles for Magnetic Hyperthermia: A Combined Theoretical and Experimental Study. Adv. Funct. Mater. 2011, 21, 4573–4581. [Google Scholar] [CrossRef]
  37. Vergés, M.A.; Costo, R.; Roca, A.G.; Marco, J.F.; Goya, G.F.; Serna, C.J.; Morales, M.P. Uniform and water stable magnetite nanoparticles with diameters around the monodomain–multidomain limit. J. Phys. D Appl. Phys. 2008, 41, 134003. [Google Scholar] [CrossRef]
  38. Massart, R.; Cabuil, V. Efect of some parameters on the formation of colloidal magnetite in alkaline medium-yield and particle size control. J. Chim. Phys. Chim. Biol. 1987, 84, 967–973. [Google Scholar] [CrossRef]
  39. Costo, R.; Bello, V.; Robic, C.; Port, M.; Marco, J.F.; Morales, M.P.; Veintemillas-Verdaguer, S. Ultrasmall Iron Oxide Nanoparticles for Biomedical Applications: Improving the Colloidal and Magnetic Properties. Langmuir 2012, 28, 178–185. [Google Scholar] [CrossRef] [PubMed]
  40. Cornell, R.; Schwertmann, U. The Iron Oxides: Structure, Properties, Reactions, Occurrences and Uses, 2nd ed.; Wiley: Weinheim, Geramny, 2006; p. 706. [Google Scholar]
  41. Morales, M.P.; Veintemillas-Verdaguer, S.; Montero, M.I.; Serna, C.J.; Roig, A.; Casas, L.; Martinez, B.; Sandiumenge, F. Surface and internal spin canting in γ-Fe2O3 nanoparticles. Chem. Mater. 1999, 11, 3058–3064. [Google Scholar] [CrossRef]
  42. Stoner, E.C.; Wohlfarth, E.P. A mechanism of magnetic hysteresis in heterogenous alloys. Philos. Trans. R. Soc. Lond. Ser. A Math. Phys. Sci. 1948, 240, 599–642. [Google Scholar] [CrossRef]
  43. Serna, C.J.; Morales, M.P. Maghemite (γ-Fe2O3): A Versatile Magnetic Colloidal Material. In Surface and Colloid Science; Matijević, E., Borkovec, M., Eds.; Springer: Boston, MA, USA, 2004; pp. 27–81. [Google Scholar]
  44. Serantes, D.; Simeonidis, K.; Angelakeris, M.; Chubykalo-Fesenko, O.; Marciello, M.; Morales, M.D.; Baldomir, D.; Martinez-Boubeta, C. Multiplying Magnetic Hyperthermia Response by Nanoparticle Assembling. J. Phys. Chem. C 2014, 118, 5927–5934. [Google Scholar] [CrossRef] [Green Version]
  45. Alphandery, E.; Ding, Y.; Ngo, A.T.; Wang, Z.L.; Wu, L.F.; Pileni, M.P. Assemblies of Aligned Magnetotactic Bacteria and Extracted Magnetosomes: What Is the Main Factor Responsible for the Magnetic Anisotropy? ACS Nano 2009, 3, 1539–1547. [Google Scholar] [CrossRef] [PubMed]
  46. Lemine, O.M.; Omri, K.; Iglesias, M.; Velasco, V.; Crespo, P.; de la Presa, P.; El Mir, L.; Bouzid, H.; Yousif, A.; Al-Hajry, A. γ-Fe2O3 by sol-gel with large nanoparticles size for magnetic hyperthermia application. J. Alloys Compd. 2014, 607, 125–131. [Google Scholar] [CrossRef]
  47. Maldonado, K.L.L.; de la Presa, P.; de la Rubia, M.A.; Crespo, P.; de Frutos, J.; Hernando, A.; Aquino, J.A.M.; Galindo, J.T.E. Effects of grain boundary width and crystallite size on conductivity and magnetic properties of magnetite nanoparticles. J. Nanopart. Res. 2014, 16, 2482. [Google Scholar] [CrossRef]
  48. Colombo, M.; Carregal-Romero, S.; Casula, M.F.; Gutierrez, L.; Morales, M.P.; Bohm, I.B.; Heverhagen, J.T.; Prosperi, D.; Parak, W.J. Biological applications of magnetic nanoparticles. Chem. Soc. Rev. 2012, 41, 4306–4334. [Google Scholar] [CrossRef] [PubMed]
  49. Mehdaoui, B.; Meffre, A.; Lacroix, L.M.; Carrey, J.; Lachaize, S.; Gougeon, M.; Respaud, M.; Chaudret, B. Large specific absorption rates in the magnetic hyperthermia properties of metallic iron nanocubes. J. Magn. Magn. Mater. 2010, 322, L49–L52. [Google Scholar] [CrossRef] [Green Version]
  50. de la Presa, P.; Luengo, Y.; Velasco, V.; Morales, M.P.; Iglesias, M.; Veintemillas-Verdaguer, S.; Crespo, P.; Hernando, A. Particle Interactions in Liquid Magnetic Colloids by Zero Field Cooled Measurements: Effects on Heating Efficiency. J. Phys. Chem. C 2015, 119, 11022–11030. [Google Scholar] [CrossRef] [Green Version]
  51. Andreu, I.; Natividad, E.; Solozábal, L.; Roubeau, O. Nano-objects for Addressing the Control of Nanoparticle Arrangement and Performance in Magnetic Hyperthermia. ACS Nano 2015, 9, 1408–1419. [Google Scholar] [CrossRef] [PubMed] [Green Version]
Figure 1. TEM micrographs of γ-Fe2O3 (A) γ-Fe2O3-6nm, (B) γ-Fe2O3-8nm, and (C) γ-Fe2O3-12nm, and Fe3O4 particles (D) Fe3O4-14nm, (E) Fe3O4-35nm, and (F) Fe3O4-350nm. Scale bar represents 50 nm except for sample LAU8, where it represents 1 μm.
Nanomaterials 08 00970 g001
Figure 2. ZFC (fill circles) and FC (open circles) curves under 10 mT applied field for samples (A) γFe2O3-6nm, (B) γFe2O3-8nm, (C) γFe2O3-12nm, and (D) γFe2O3-14nm.
Nanomaterials 08 00970 g002
Figure 3. ZFC (filled circles) and FC (open circles) curves under 10 mT applied field for samples (A) Fe3O4-14nm, (B) Fe3O4-35nm, and (C) Fe3O4-350nm.
Nanomaterials 08 00970 g003
Figure 4. Coercive field vs particle size for all the samples. The vertical line indicates the separation between single-domain and multidomain particles.
Nanomaterials 08 00970 g004
Figure 5. Variation of Hc/Hk with κ (black axis and points) and d due to thermal fluctuations (red axis and points) as calculated using Equation (2).
Nanomaterials 08 00970 g005
Figure 6. ac-hysteresis loops at room temperatures for γ-Fe2O3 samples: (A) γFe2O3-8nm, (B) γFe2O3-12nm, and (C) γFe2O3-14nm.
Nanomaterials 08 00970 g006
Figure 7. ac-hysteresis loops at room temperatures for Fe3O4: (A) Fe3O4-14nm, and (B) Fe3O4-35nm.
Nanomaterials 08 00970 g007
Figure 8. Comparison of magnetization at 60 mT for ac- (black) and dc- (red) measurements in (A) γFe2O3-12nm , and (B) Fe3O4-35nm samples. (Note: The dc-hysteresis curves were measured at 250 K).
Nanomaterials 08 00970 g008
Figure 9. χ calculated at Hc with increasing ac-fields in samples (A) γFe2O3-12nm, and (B) Fe3O4-35nm.
Nanomaterials 08 00970 g009
Figure 10. Areas A of the hysteresis cycles and SARs calculated from magnetometric measurements for γFe2O3-8nm, γFe2O3-12nm, γFe2O3-14nm, and Fe3O4-35nm.
Nanomaterials 08 00970 g010
Figure 11. SAR (left) and A (right) calculated from ac-magnetometry for Fe3O4-35nm. The vertical line at 30 mT is a visual guide.
Nanomaterials 08 00970 g011
Figure 12. Comparison of areas A and SAR values calculated as A·f for samples γFe2O3-14nm (red circles) and Fe3O4-14nm (black circles), both 14 nm in size.
Nanomaterials 08 00970 g012
Table 1. Size, Structural Phase, and Magnetic Properties of the Nanoparticles 1
f ≈ 10−4 HzT = 10 K, f ≈ 10−4 HzT = 300 K, f = 50 kHz
Sample NameTEM Particle Size d (nm) (σ)Hydrodynamic Size Dh (nm) (σ)Iron Oxide Majority PhaseTB (K)μ0HC (mT)μ0HK (mT)Ms (Am2/kg)Mr/Msμ0Hc (mT)MS (Am2/kg)Mr/Ms
γFe2O3-6nm6.3 (0.19)25.4 (0.27)γ-Fe2O3~707.5 550.16
γFe2O3-8nm7.6 (0.20)29.9 (0.23)γ-Fe2O3~9011.042590.200.9260.05
γFe2O3-12nm11.7 (0.16)58.4 (0.25)γ-Fe2O3~220 K25.557.3650.305.5320.28
γFe2O3-14nm13.8 (0.18)96.8 (0.19)γ-Fe2O3~300 K25.154.7790.2910.6320.45
Fe3O4-14nm13.5 (0.19)160.7 (0.20)Fe3O4/γ-Fe2O3>300 K39.084.1710.3110.0320.26
Fe3O4-35nm35 (0.20)88.1 (0.18)Fe3O4>300 K27.757.9800.2915.8770.72
Fe3O4-350nm350 (0.24)2751 (0.45)Fe3O4>>300 K24.1 900.17
1 Particle size d and its polydispersity σ, hydrodynamic size in Z average Dh and its polydispersity σ, iron majority phase, blocking temperature Tb, coercive field Hc, anisotropy field Hk, saturation magnetization Ms, and remanence ratio Mr/Ms of the samples measured at 10 K at low frequency (estimated SQUID measuring time of a hysteresis cycle t ≈ 3600 s, therefore f ≈ 10−4 s) and at 300 K at high frequency (f = 52 kHz).

