Radiation and Energetic Analysis of Nanofluid Based Volumetric Absorbers for Concentrated Solar Power


Abstract
1. Introduction
2. Numerical Results and Discussion
2.1. Discussion of the Radiation Field
2.2. Discussion of the Temperature Field
3. Numerical Methods
3.1. Geometrical Description
3.2. Flow Field
3.3. Nanofluid Modeling
3.4. Thermal Modeling
3.5. Radiation Modeling
4. Experimental Validation
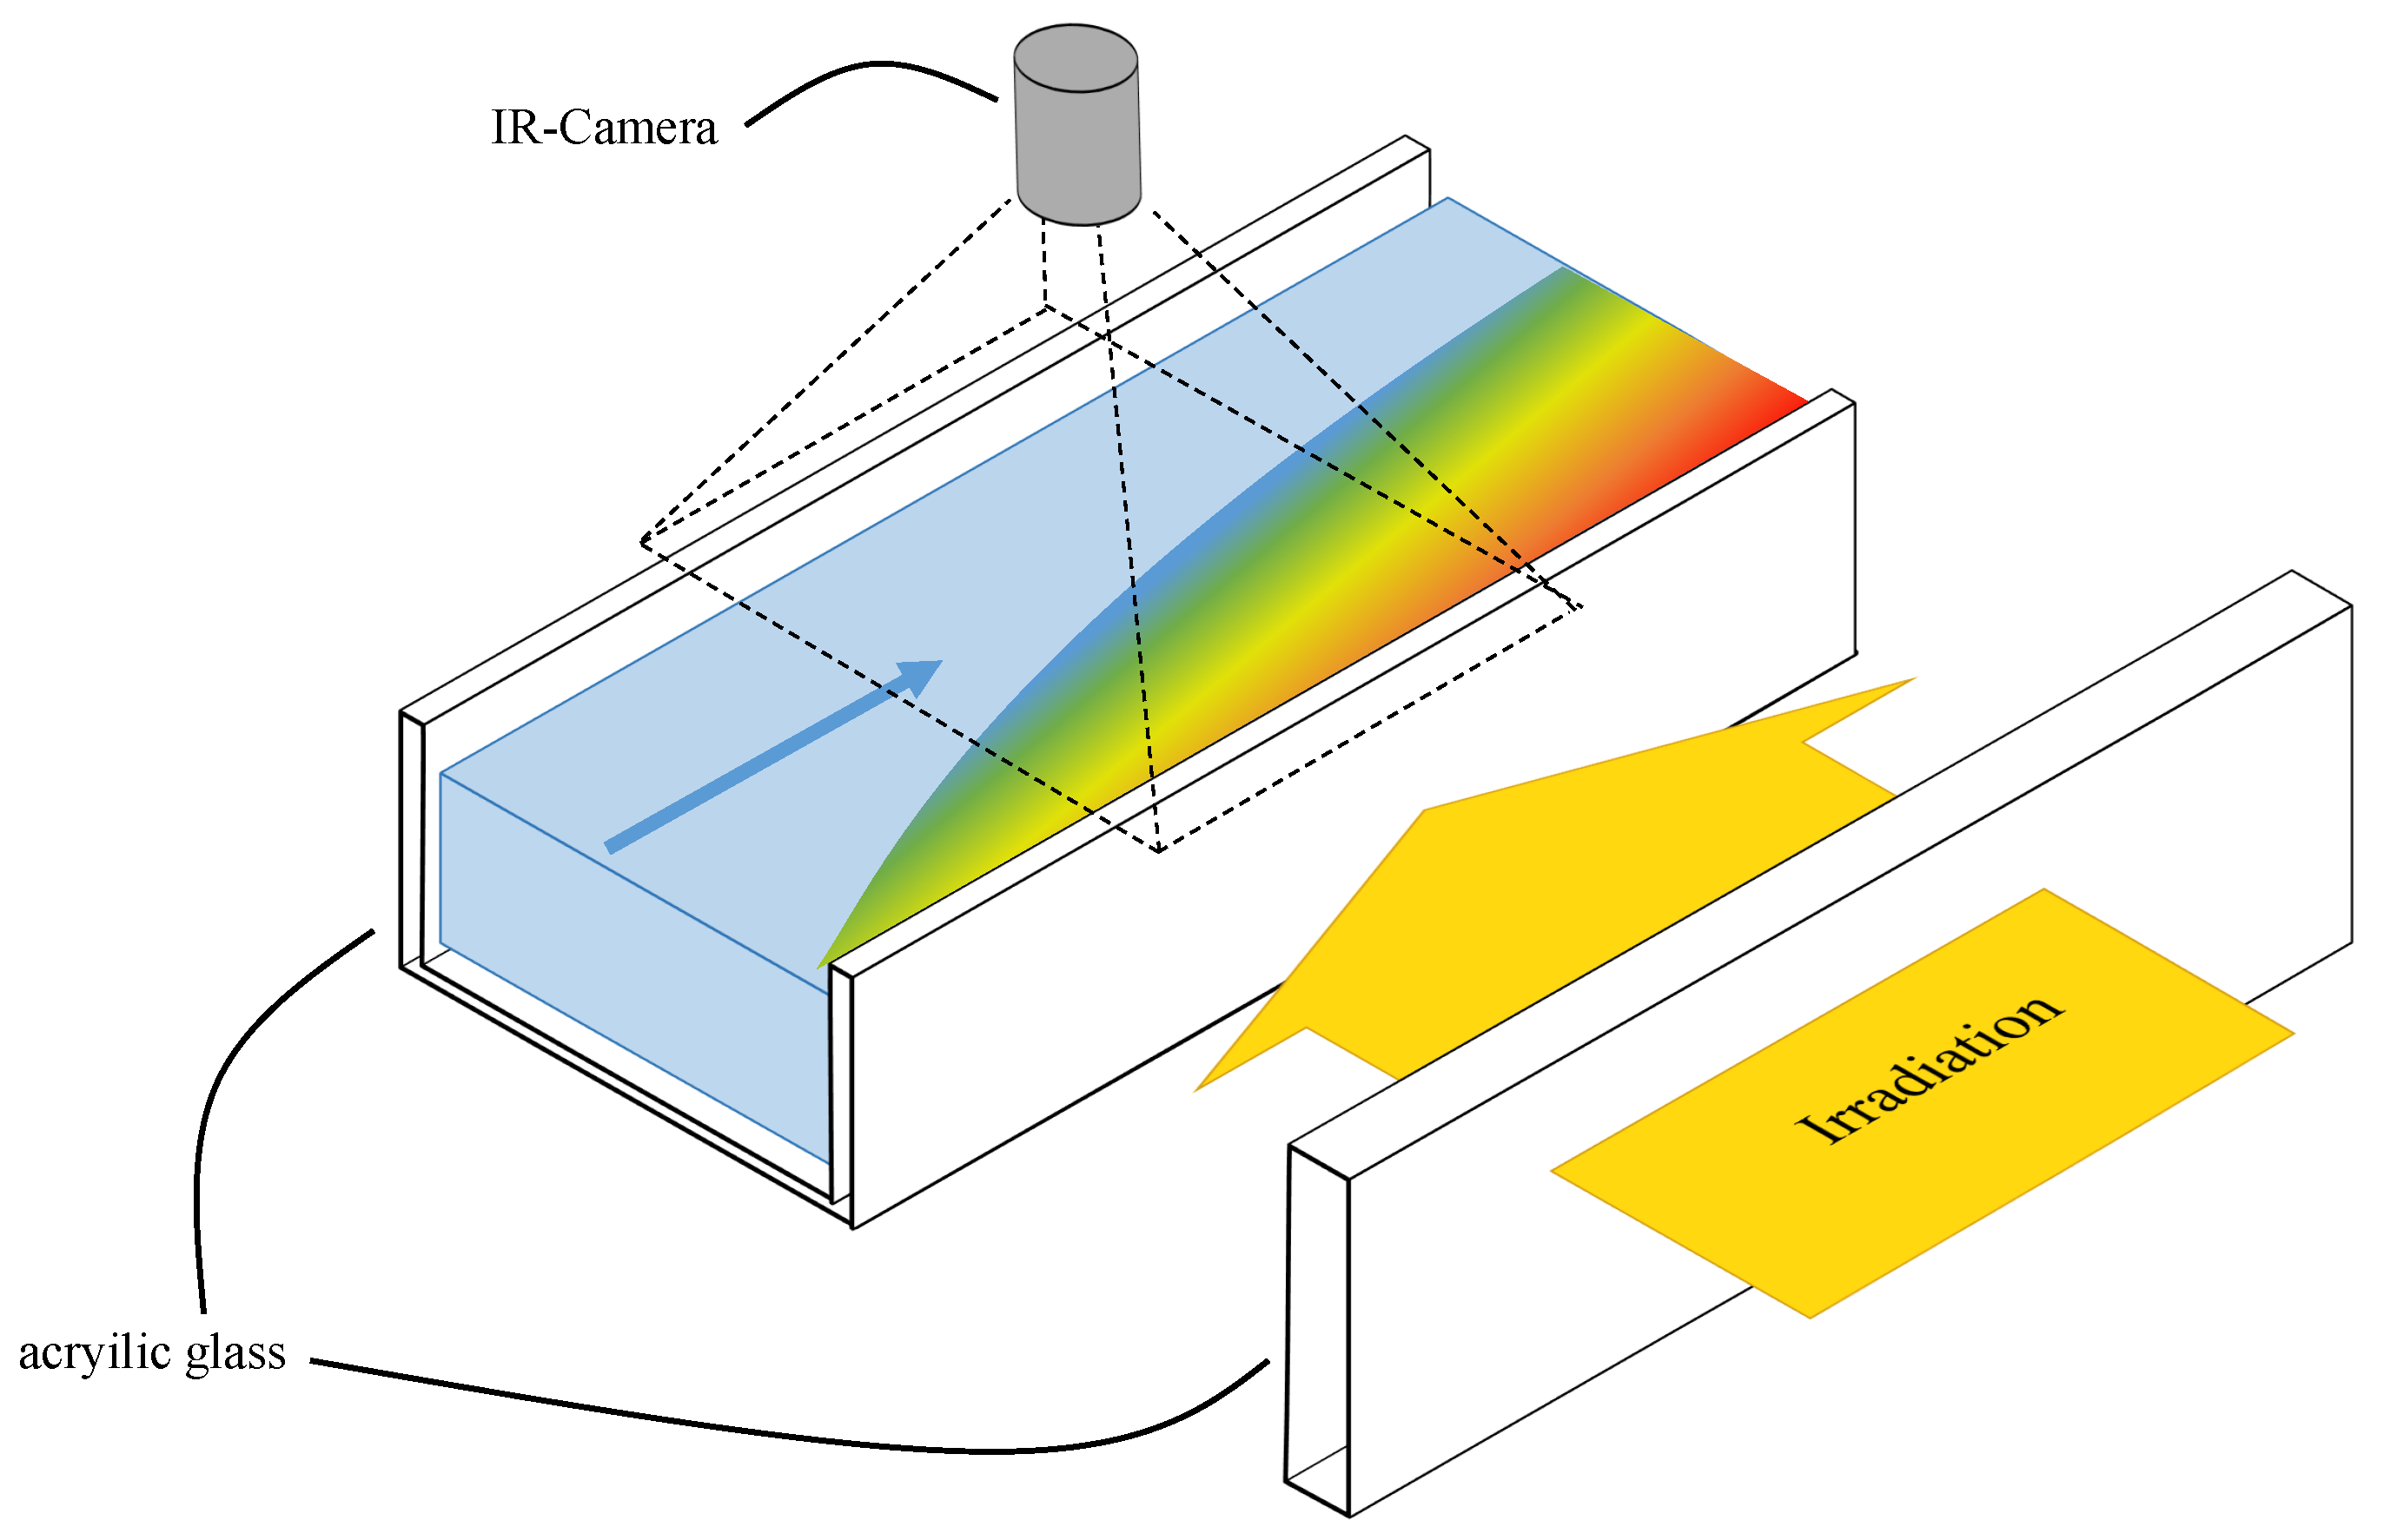
4.1. Experimental Setup
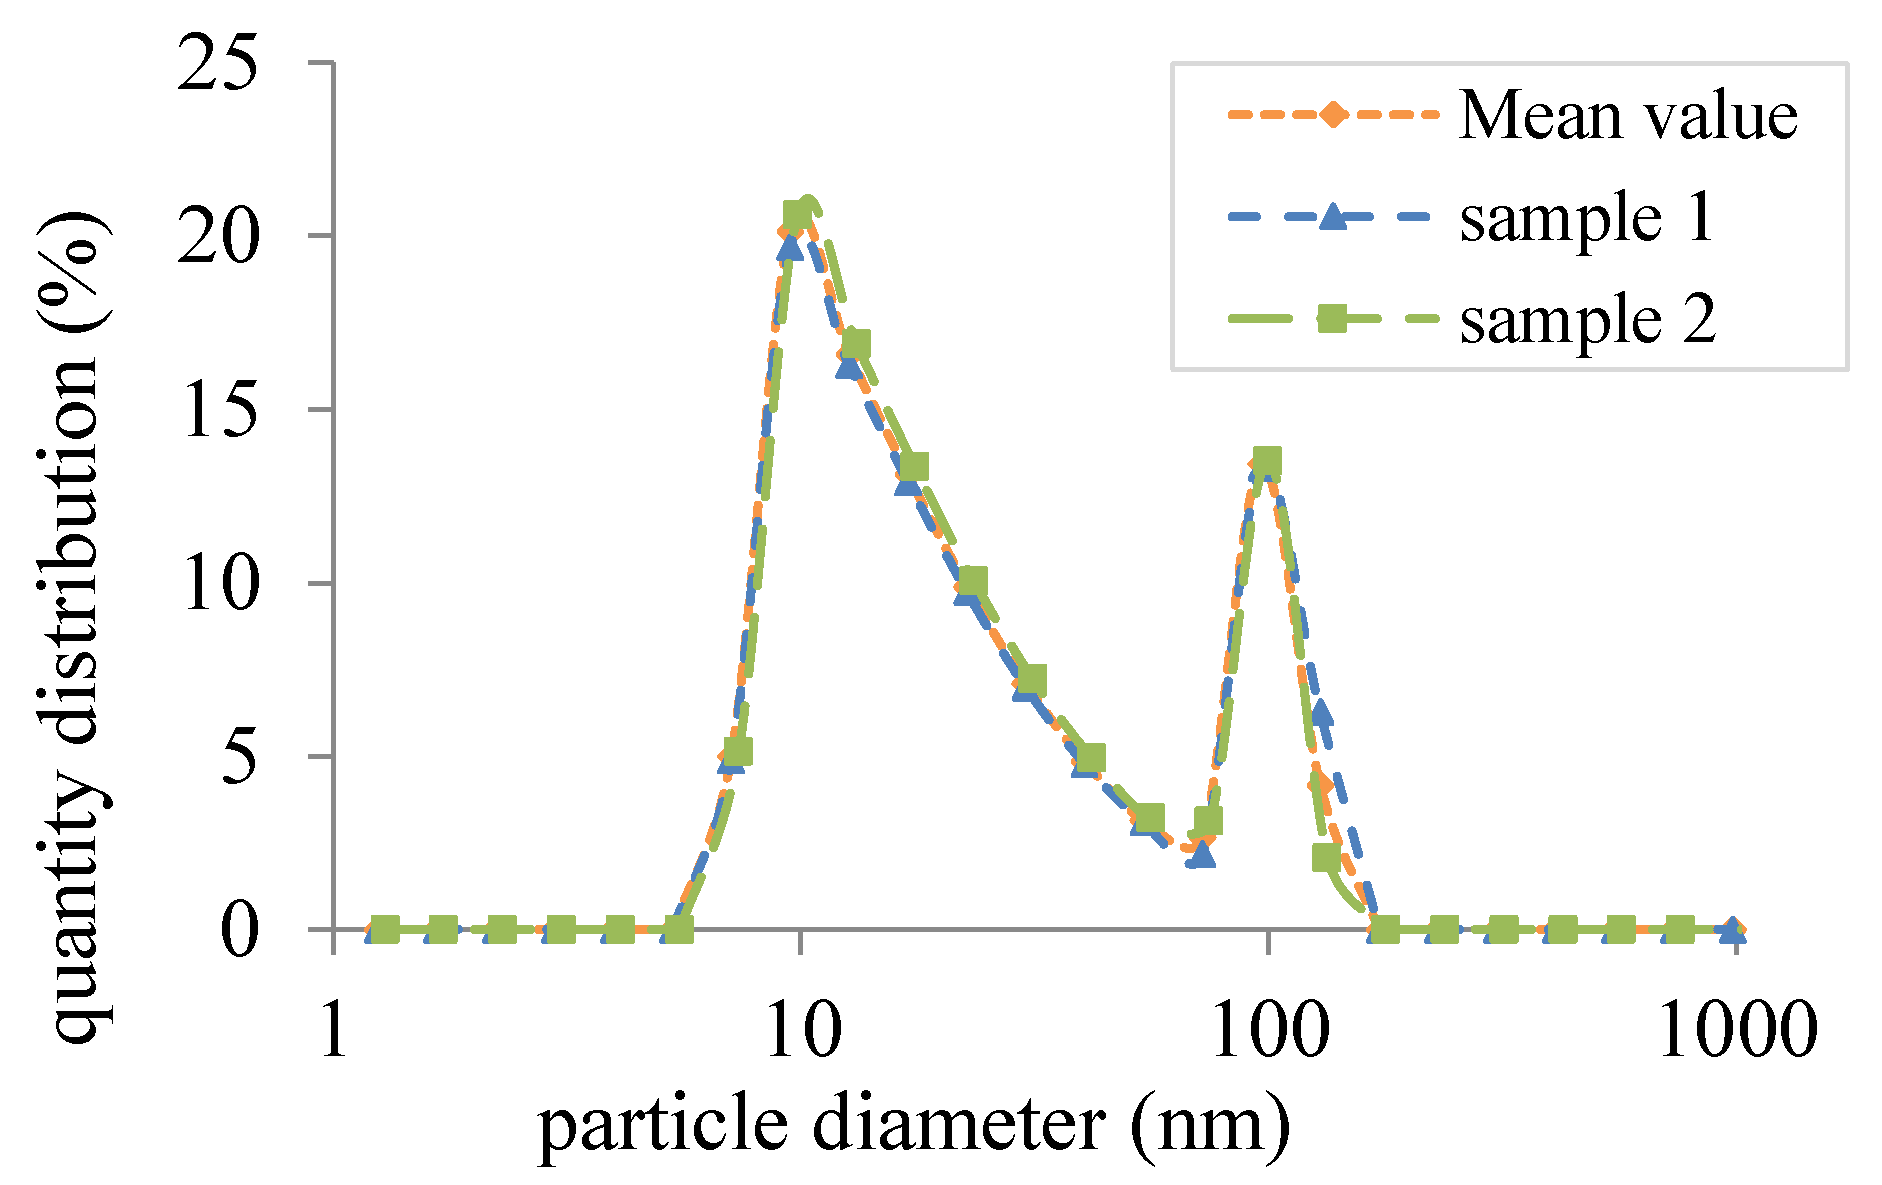
4.2. Nanofluid Preparation
4.3. Validation Measurements
5. Conclusions
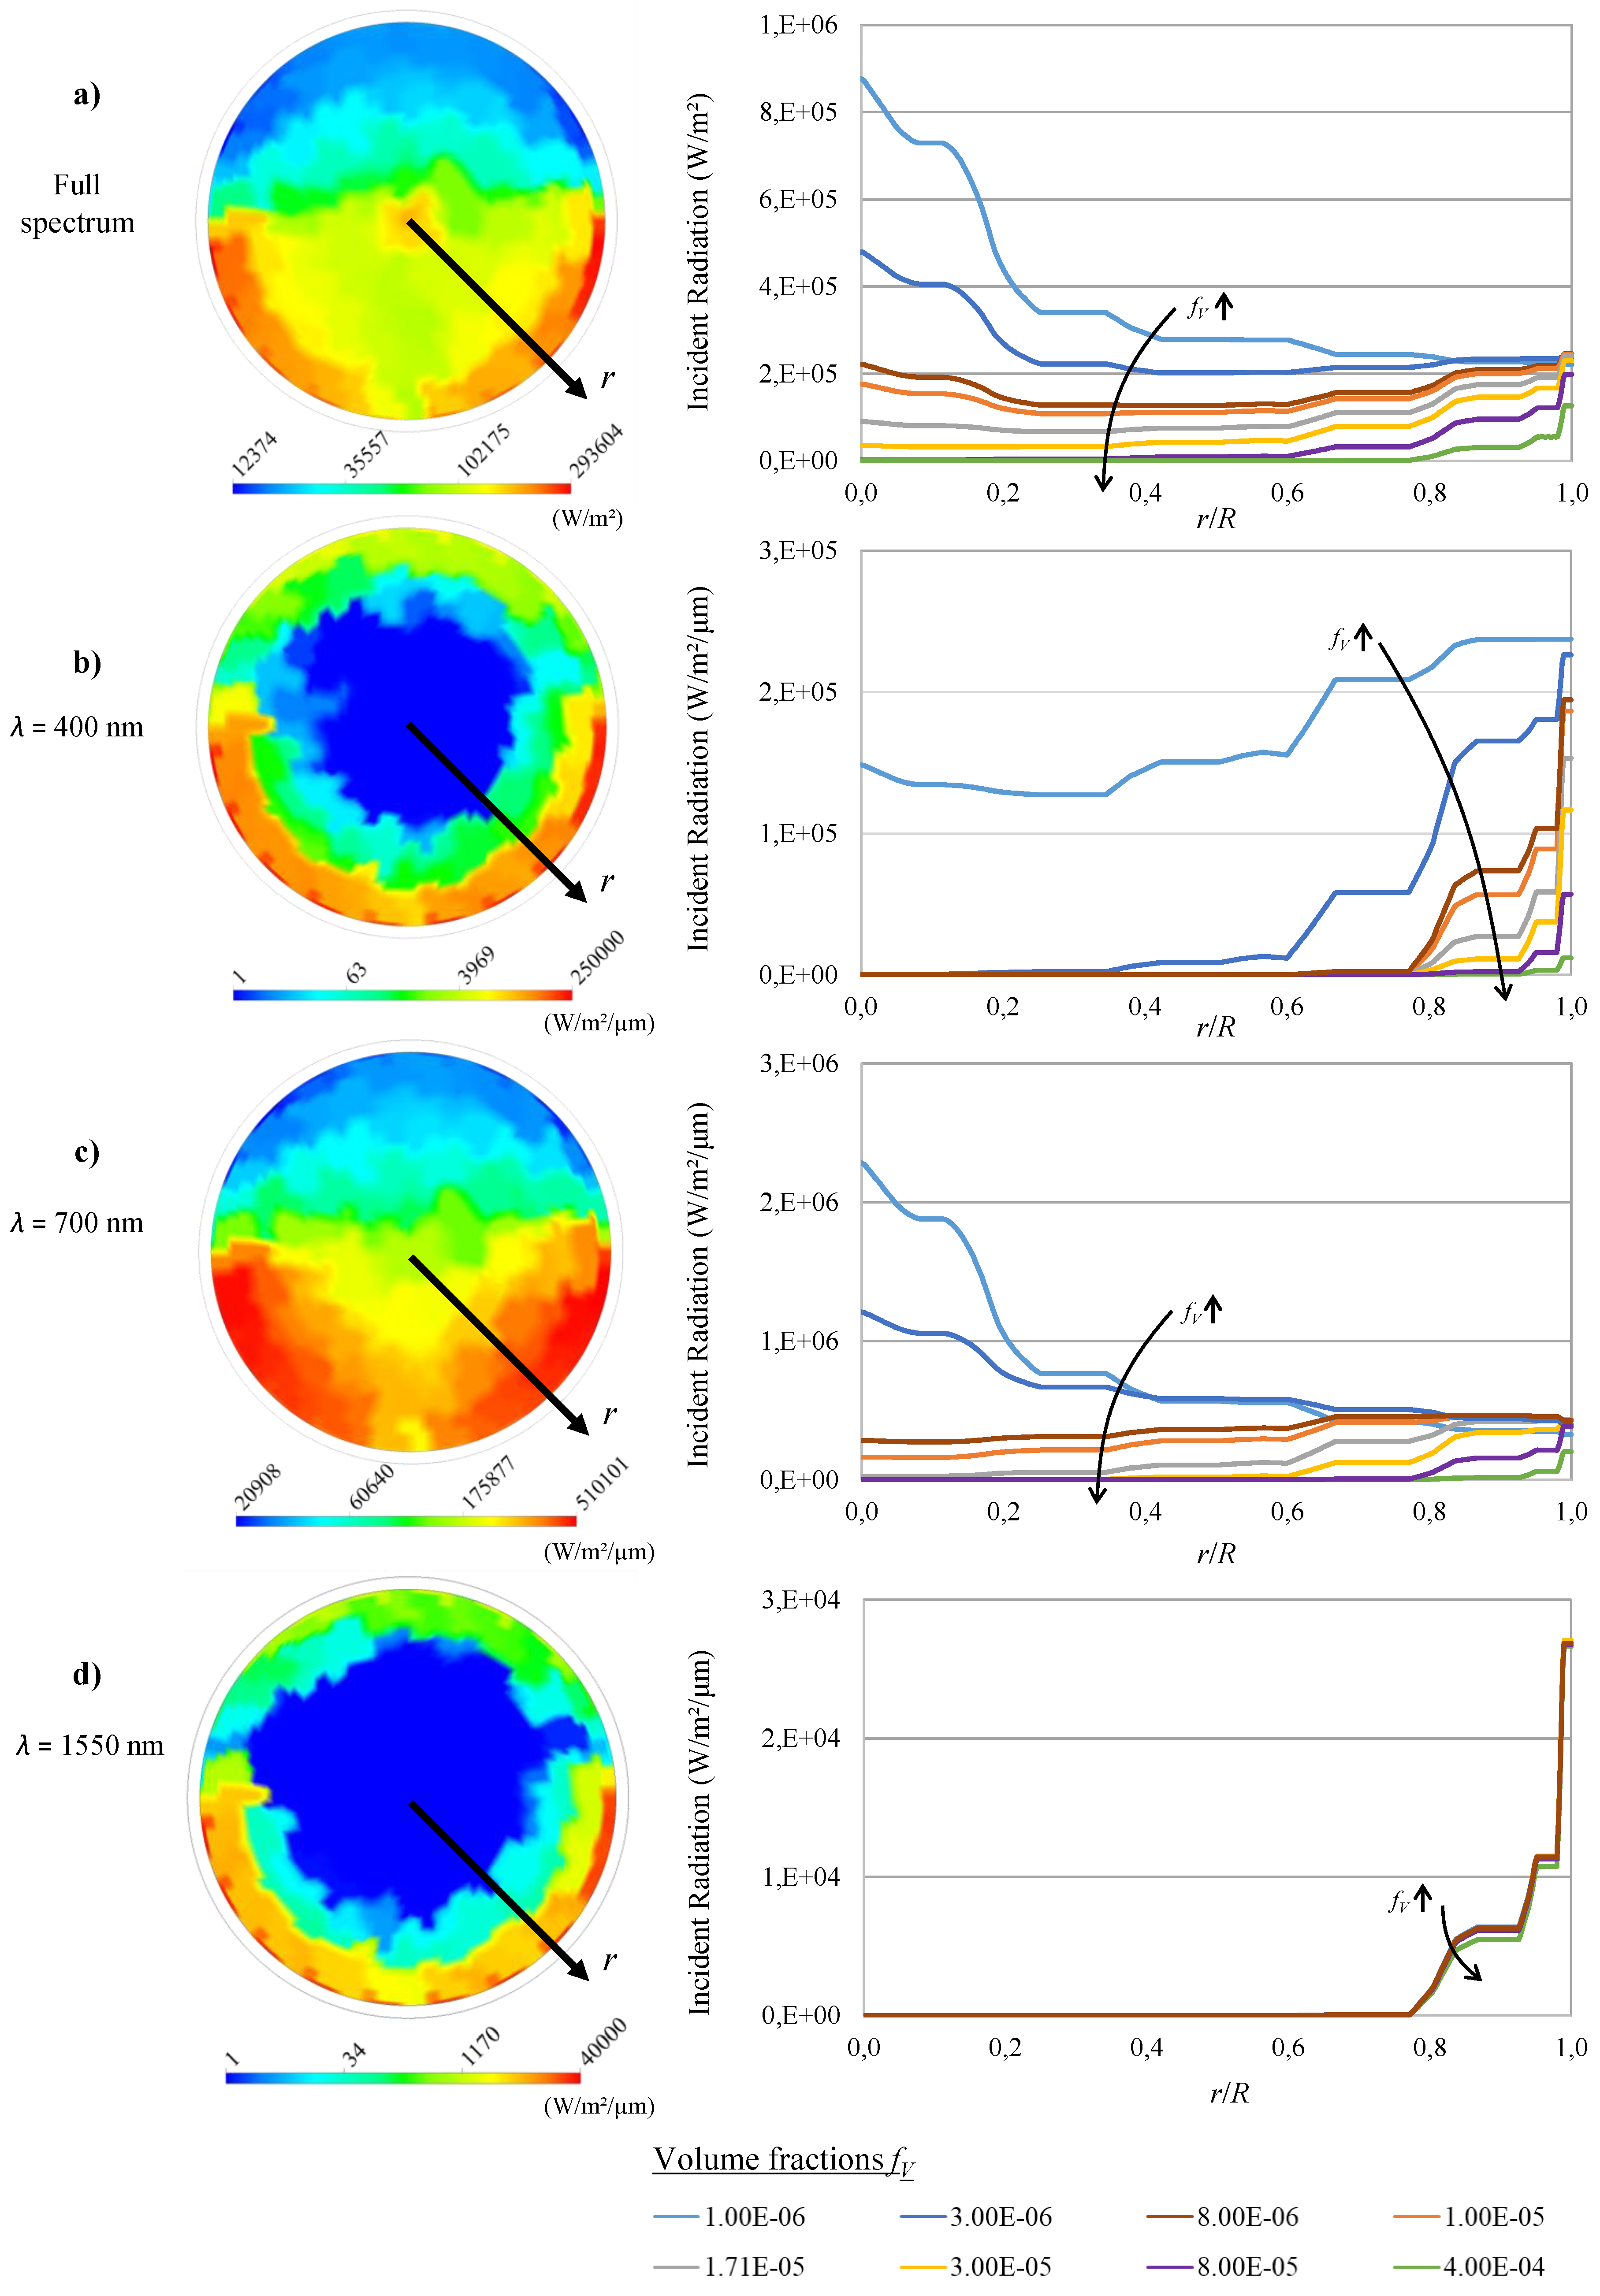
- Solely, a high particle fraction does not necessarily improve the optical efficiency of a volumetric solar thermal absorber. Whereas transmission lowers the optical performance for small , scattering deteriorates the performance at high (see Figure 3).
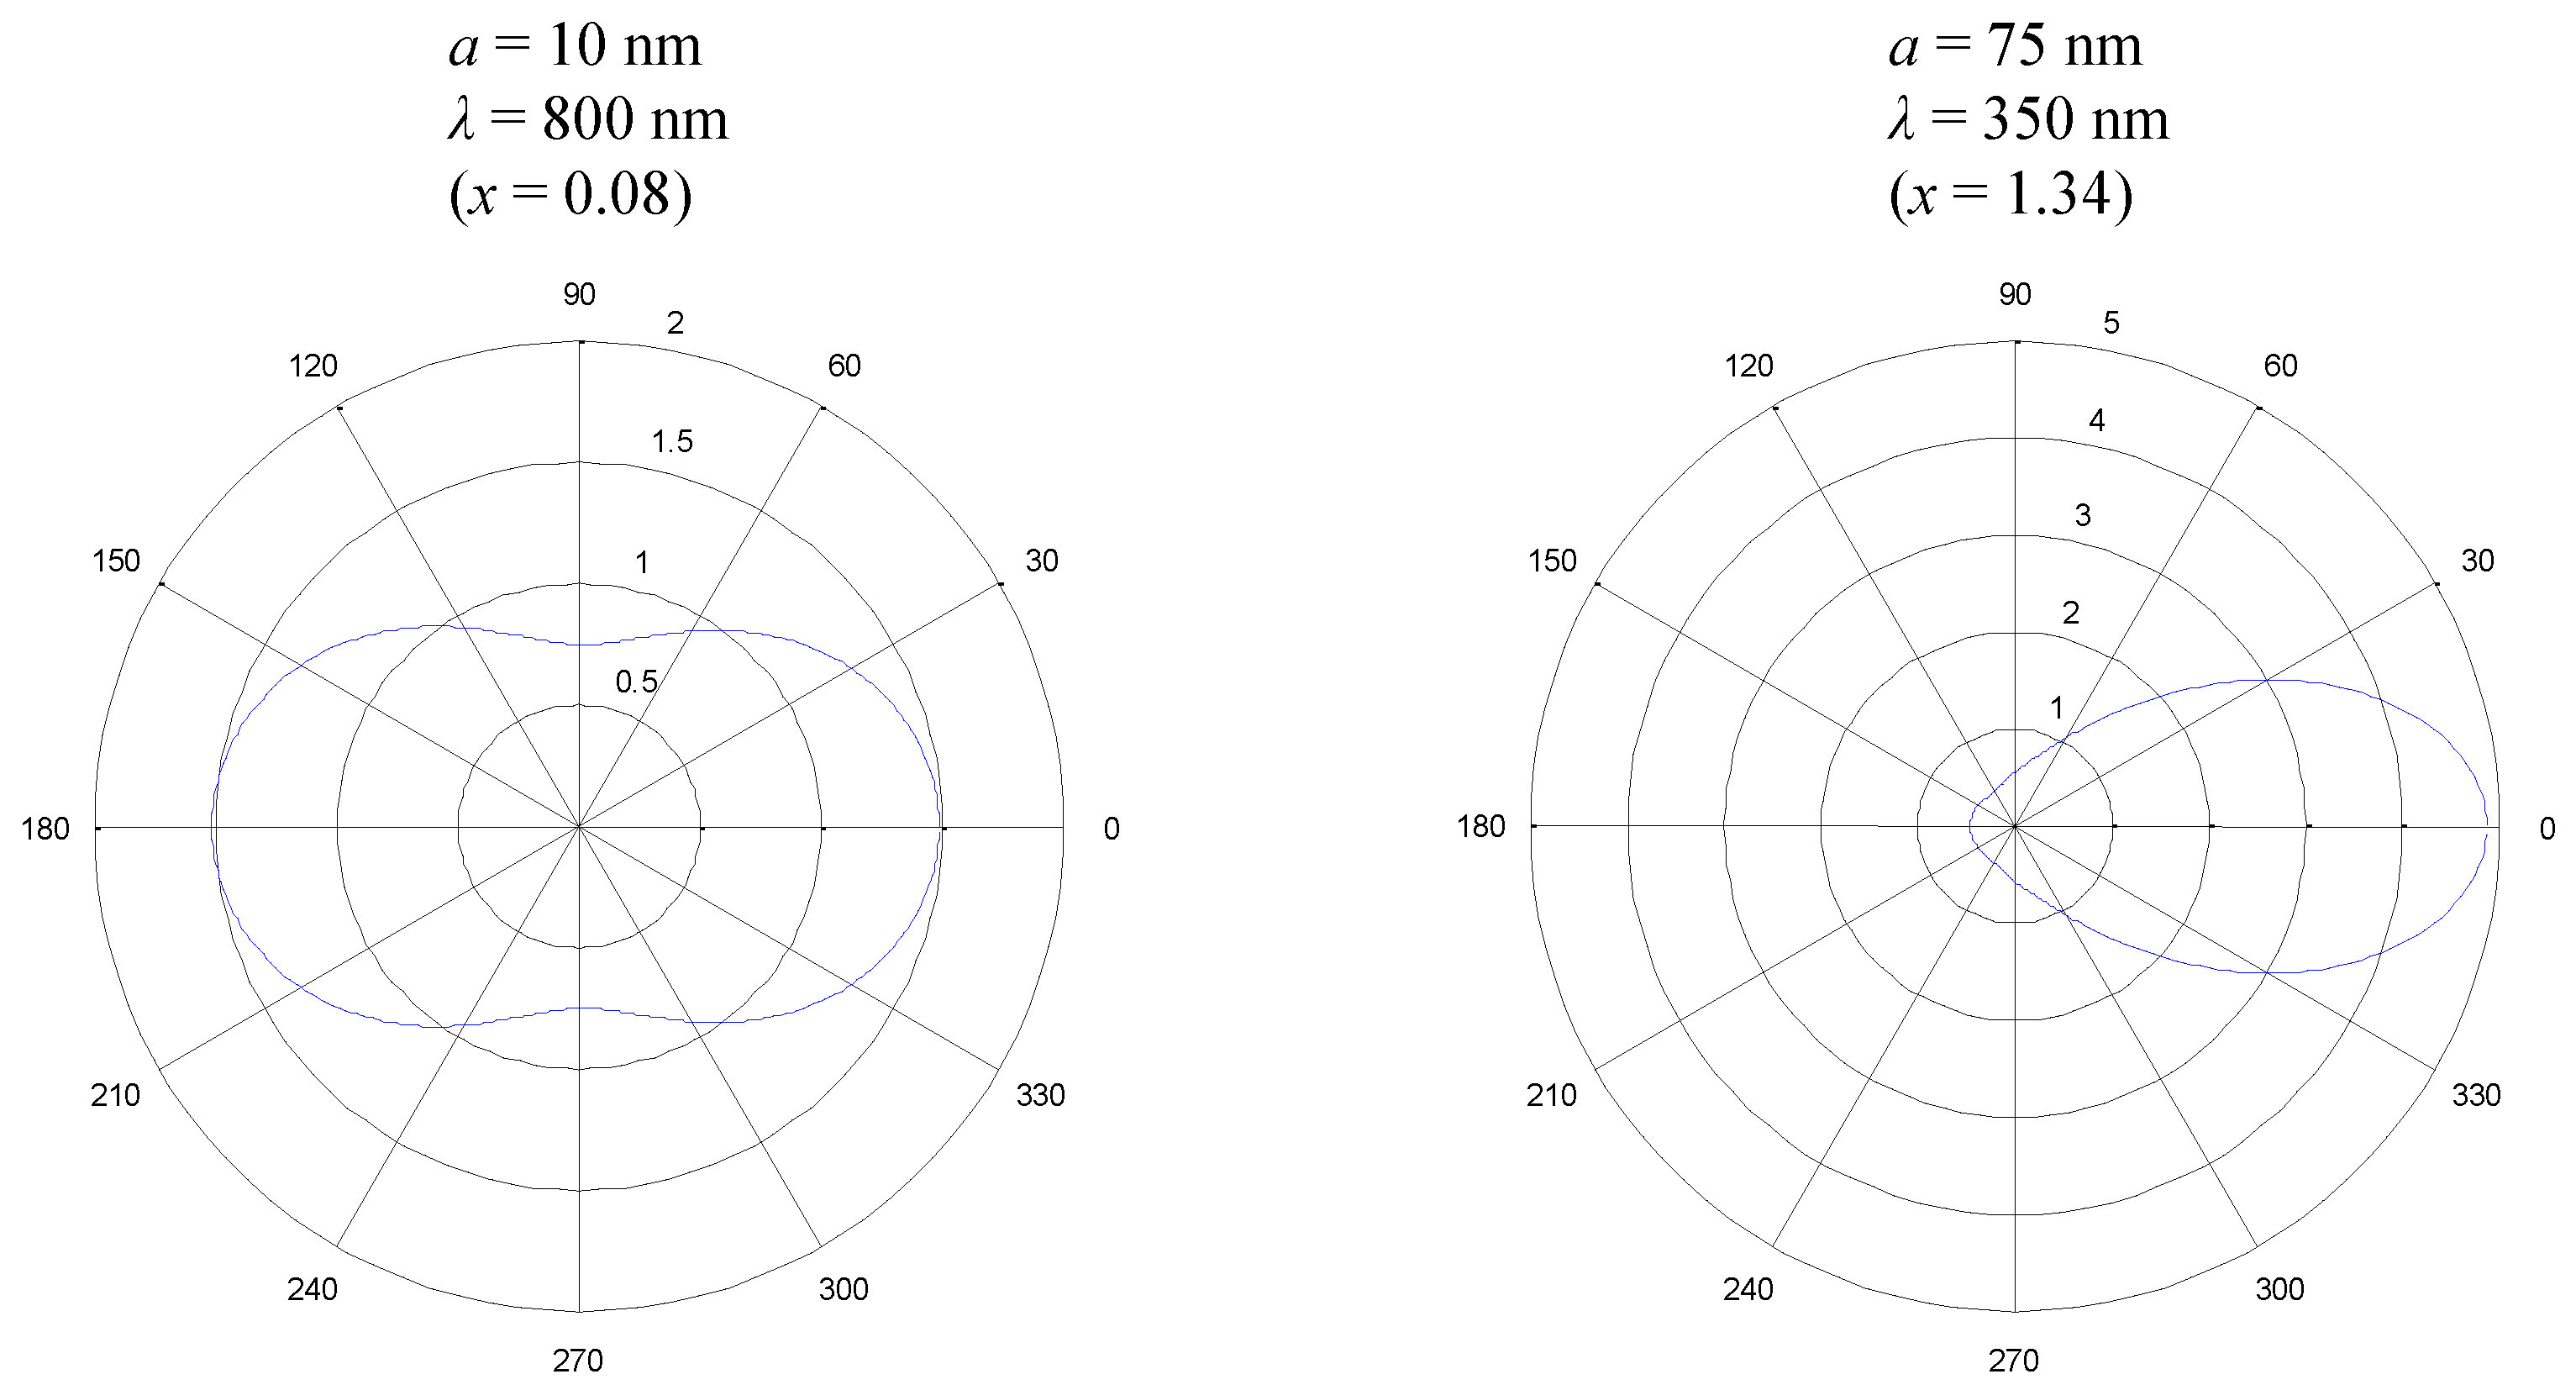
- Scattering must not be neglected for solar thermal absorbers with nanofluids, as it has a great impact on the optical efficiency. Especially, realistic particle size distributions cause strong scattering that cannot be accounted for by the assumption of isotropic scattering.
- A very small and narrow particle size distribution must be achieved to obtain an optical efficiency on the same level as surface absorbers.
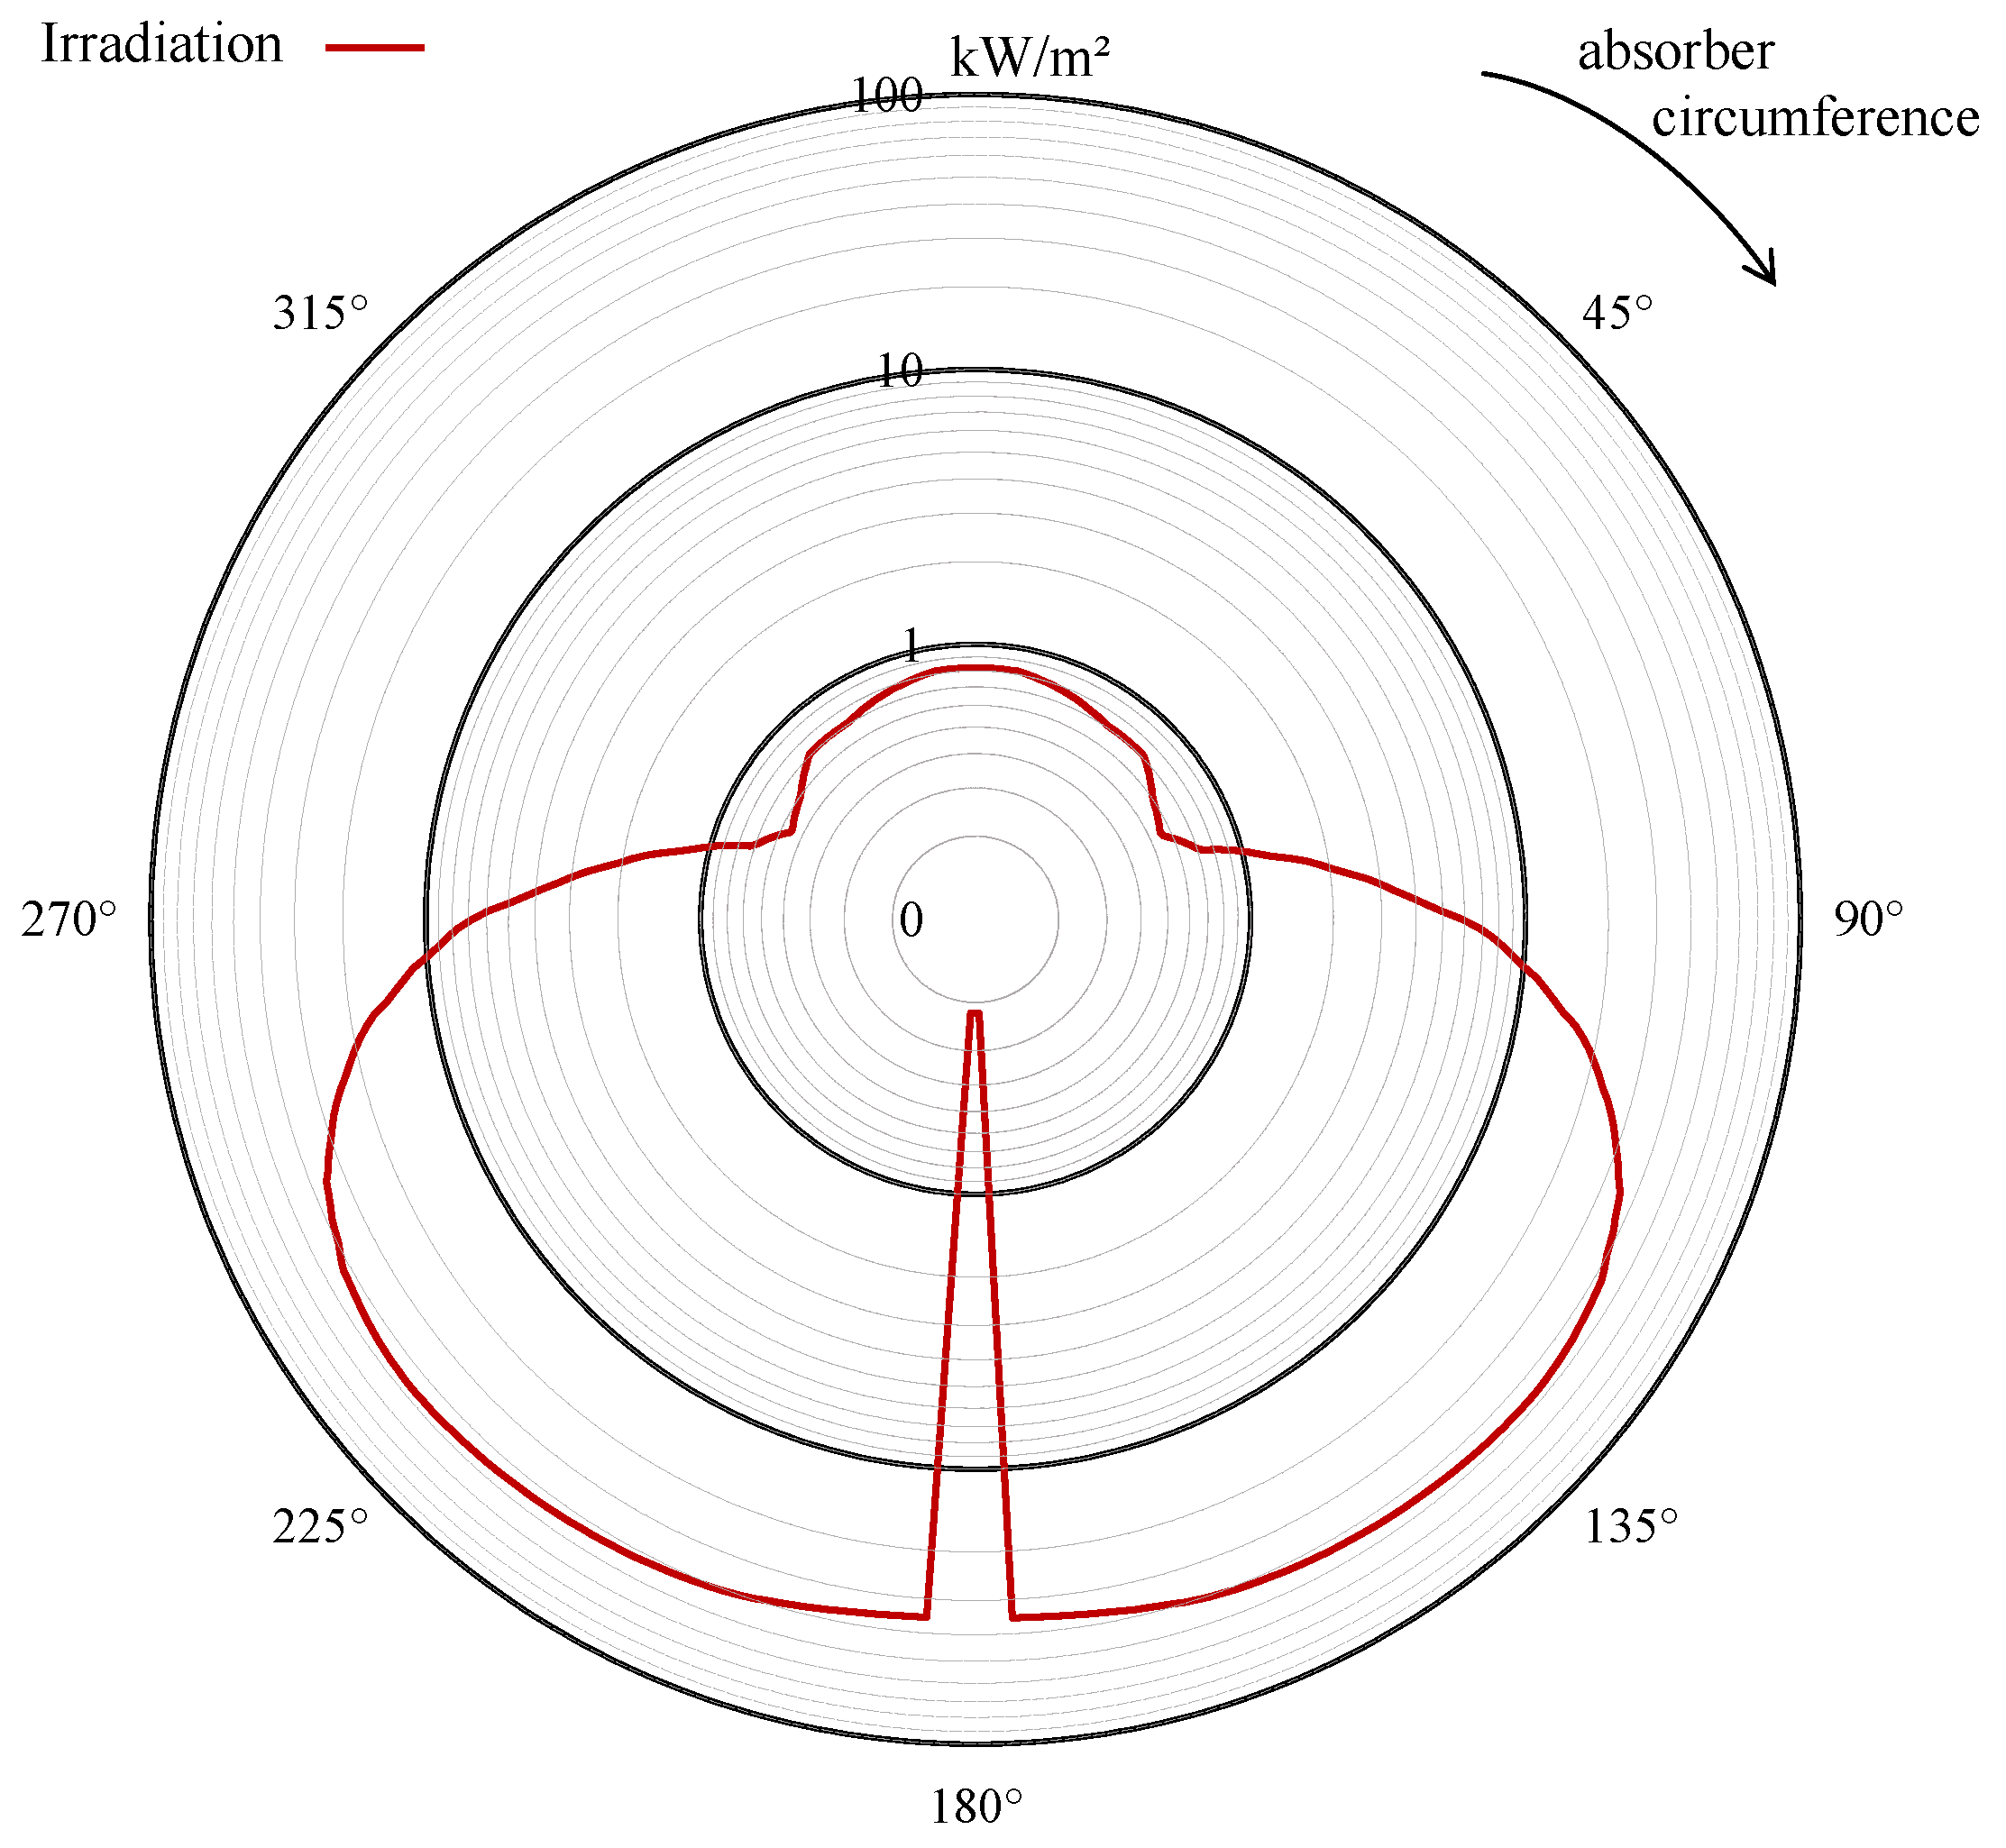
- The margin to further improve the optical efficiency is small as most of the optical losses occur at the reflective glass surface. It might be possible to improve the surface with selective coatings or one-way mirrors from the inside of the glass tube, which additionally decrease radiation loss due to scattering.
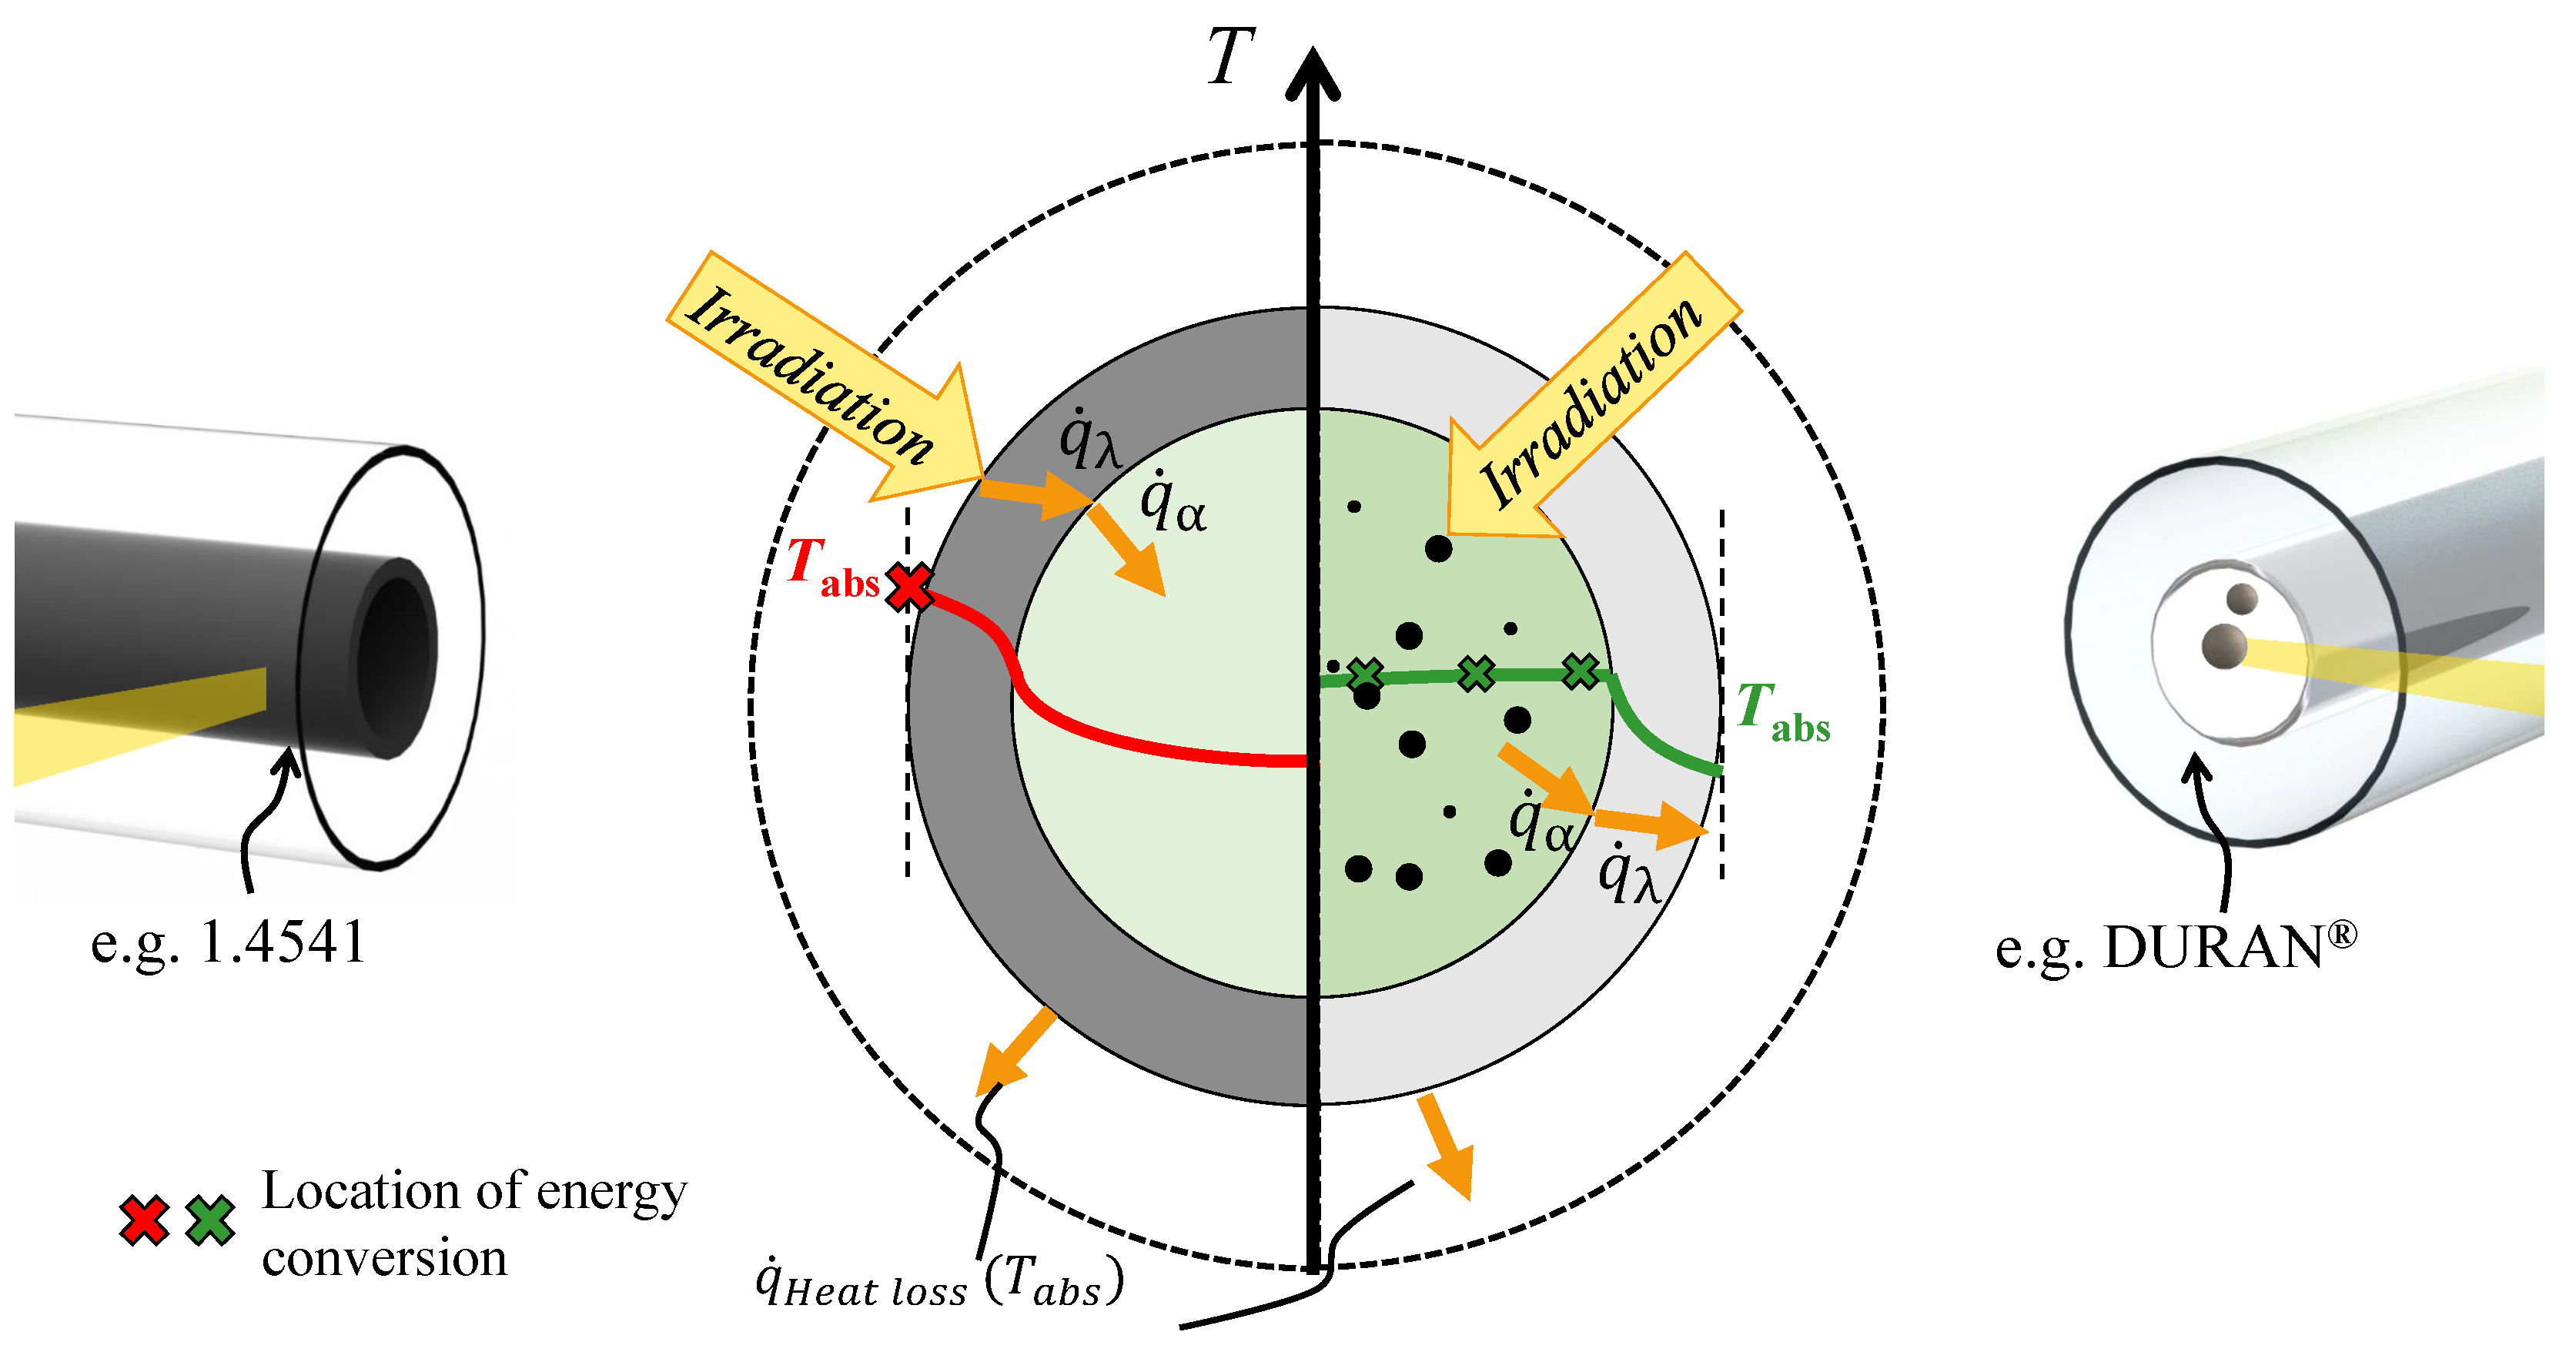
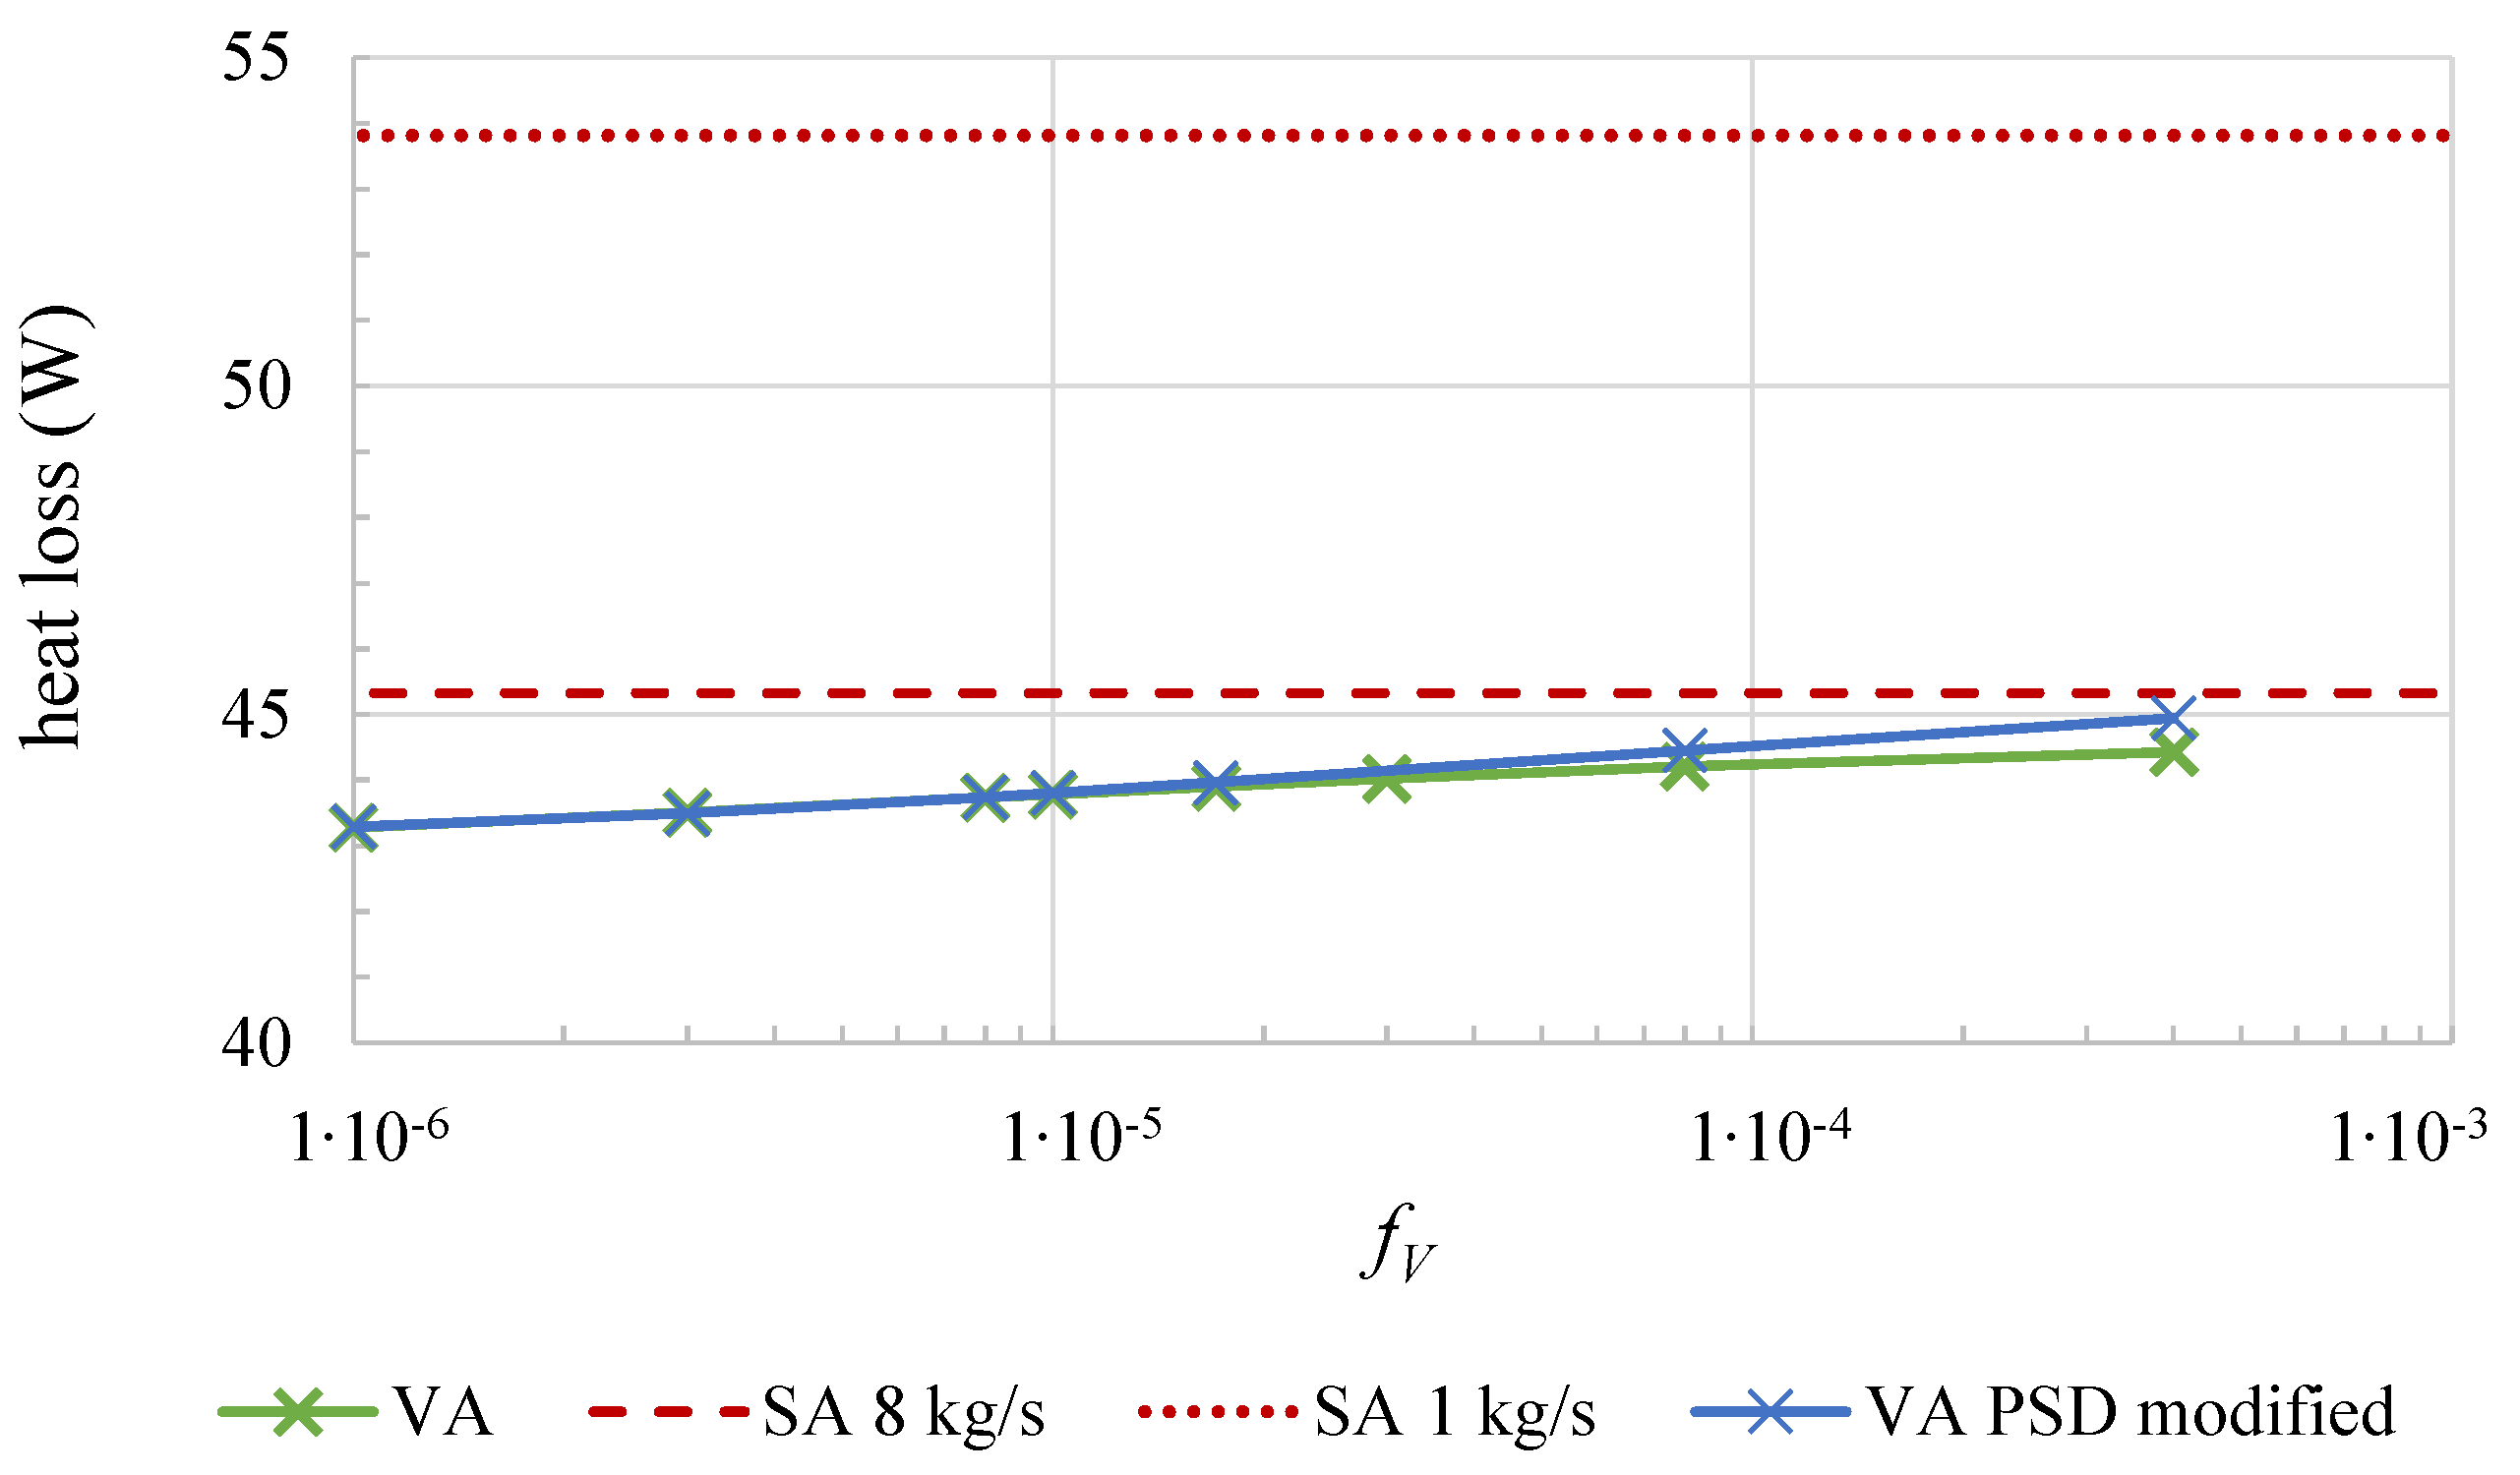
- The assumption that a volumetric absorption of radiation can lower the outside absorber temperature and thus the thermal losses is confirmed.
- The absorber temperatures must be increased for a decent, quantitative analysis of the absorber. At low temperatures, thermal losses are generally decreased so that significant differences between the absorber types are more difficult to identify. However, it could be shown that thermal losses can be reduced in volumetric absorbers. Furthermore, this effect is expected to gain more significance as higher absorber temperatures are achieved. However, basic research about nanofluids at elevated temperatures must be performed.
- The flow velocity must be high in surface absorber systems to cool the absorber wall from the inside and therefore reduce thermal losses to the surroundings. This effect is not necessary for volumetric absorbers. Hence, low thermal losses can be achieved with slower flow velocities, which reduces pressure loss and pumping power.
- For better comparison, the absorber systems was compared with a similar design. However, it must be said that the outer glass cover and the vacuum insulation is not crucial for the volumetric absorber system due to the lower surface temperatures. The glass absorber has a low thermal conductivity (0.8 W/m/K) and thus serves as an insulation material. The omission of the vacuum insulation would mean a severe reduction of production costs. In practical use, a combination seems reasonable: For the cooler parts of the absorber system, the single glass insulation will be sufficient but vacuum insulation can be added for the absorber surfaces with highest temperatures. Note that, due to reflective losses, the omission of the outer glass surface will further increase the optical efficiency of the volumetric absorber.
Author Contributions
Acknowledgments
Conflicts of Interest
Abbreviations
| VA | Volumetric Absorber |
| SA | Surface Absorber |
| PSD | Particle Size Distribution |
| Volume fraction |
References
- Choi, S.; Eastman, J.A. Enhancing Thermal Conductivity of Fluid with Nanoparticles. In Proceedings of the ASME Congress, San Francisco, CA, USA, 12–17 November 1995. [Google Scholar]
- Pak, B.C.; Cho, Y.I. Hydrodynamic and Heat Transfer Study of Dispersed Fluids with Submicron Metallic Oxide Particles. Exp. Heat Transf. 1998, 11, 151–170. [Google Scholar] [CrossRef]
- Vajjha, R.S.; Das, D.K.; Mahagaonkar, B.M. Density Measurement of Different Nanofluids and Their Comparison With Theory. Pet. Sci. Technol. 2009, 27, 612–624. [Google Scholar] [CrossRef]
- Xuan, Y.; Roetzel, W. Conceptions for heat transfer correlation of nanofluids. Int. J. Heat Mass Transf. 2000, 43, 3701–3707. [Google Scholar] [CrossRef]
- Khanafer, K.; Vafai, K. A critical synthesis of thermophysical characteristics of nanofluids. Int. J. Heat Mass Transf. 2011, 54, 4410–4428. [Google Scholar] [CrossRef]
- Nan, C.W.; Birringer, R.; Clarke, D.R.; Gleiter, H. Effective thermal conductivity of particulate composites with interfacial thermal resistance. J. Appl. Phys. 1997, 81, 6692. [Google Scholar] [CrossRef]
- Buongiorno, J.; Venerus, D.C.; Prabhat, N.; McKrell, T.; Townsend, J.; Christianson, R.; Tolmachev, Y.V.; Keblinski, P.; Hu, L.w.; Alvarado, J.L.; et al. A benchmark study on the thermal conductivity of nanofluids. J. Appl. Phys. 2009, 106, 94312. [Google Scholar] [CrossRef]
- Philip, J.; Shima, P.D. Thermal properties of nanofluids. Adv. Colloid Interface Sci. 2012, 183–184, 30–45. [Google Scholar] [CrossRef] [PubMed]
- Venerus, D.C.; Buongiorno, J.; Christianson, R.; Townsend, J.; Bang, I.; Chen, G.; Chung, S.; Chyu, M.; Chen, H.; Ding, Y.; et al. Viscosity measurements on colloidal dispersions (nanofluids) for heat transfer applications. Appl. Rheol. 2010, 20. [Google Scholar] [CrossRef]
- Gupta, M.; Singh, V.; Kumar, R.; Said, Z. A review on thermophysical properties of nanofluids and heat transfer applications. Renew. Sustain. Energy Rev. 2017, 74, 638–670. [Google Scholar] [CrossRef]
- Taylor, R.; Coulombe, S.; Otanicar, T.; Phelan, P.; Gunawan, A.; Lv, W.; Rosengarten, G.; Prasher, R.; Tyagi, H. Small particles, big impacts: A review of the diverse applications of nanofluids. J. Appl. Phys. 2013, 113, 11301. [Google Scholar] [CrossRef]
- Eggers, J.R.; Kabelac, S. Nanofluids revisited. Appl. Therm. Eng. 2016, 106, 1114–1126. [Google Scholar] [CrossRef]
- Chamsa-Ard, W.; Brundavanam, S.; Fung, C.C.; Fawcett, D.; Poinern, G. Nanofluid Types, Their Synthesis, Properties and Incorporation in Direct Solar Thermal Collectors: A Review. Nanomaterials 2017, 7, 131. [Google Scholar] [CrossRef] [PubMed]
- Zhao, S.; Xu, G.; Wang, N.; Zhang, X. Experimental Study on the Thermal Start-Up Performance of the Graphene/Water Nanofluid-Enhanced Solar Gravity Heat Pipe. Nanomaterials 2018, 8, 72. [Google Scholar] [CrossRef] [PubMed]
- Abdollahzadeh Jamalabadi, M.; Safaei, M.; Alrashed, A.; Nguyen, T.; Bandarra Filho, E. Entropy Generation in Thermal Radiative Loading of Structures with Distinct Heaters. Entropy 2017, 19, 506. [Google Scholar] [CrossRef]
- Burkholder, F.; Kutscher, C. Heat Loss Testing of Schott’s 2008 PTR70 Parabolic Through Receiver, Technical Report from National Renewable Energy Laboratory, Golden, Colorado, May 2009. Available online: https://www.nrel.gov/docs/fy09osti/45633.pdf (accessed on 10 October 2018).
- Minardi, J.E.; Chuang, H.N. Performance of a “black” liquid flat-plate solar collector. Sol. Energy 1975, 17, 179–183. [Google Scholar] [CrossRef]
- Khullar, V.; Tyagi, H. Application of Nanofluids as the Working Fluid in Concentrating Parabolic Solar Collectors. In Proceedings of the 37th National and 4th International Conference on Fluid Mechanics and Fluid Power, Chennai, India, 16–18 December 2010. [Google Scholar]
- Otanicar, T.P.; Phelan, P.E.; Prasher, R.S.; Rosengarten, G.; Taylor, R.A. Nanofluid-based direct absorption solar collector. J. Renew. Sustain. Energy 2010, 2, 033102. [Google Scholar] [CrossRef]
- Taylor, R.A.; Phelan, P.E.; Otanicar, T.P.; Walker, C.A.; Nguyen, M.; Trimble, S.; Prasher, R. Applicability of nanofluids in high flux solar collectors. J. Renew. Sustain. Energy 2011, 3, 023104. [Google Scholar] [CrossRef]
- Milanese, M.; Colangelo, G.; Cretì, A.; Lomascolo, M.; Iacobazzi, F.; de Risi, A. Optical absorption measurements of oxide nanoparticles for application as nanofluid in direct absorption solar power systems—Part I: Water-based nanofluids behavior. Sol. Energy Mater. Sol. Cells 2015, 147, 315–320. [Google Scholar] [CrossRef]
- Saidur, R.; Meng, T.; Said, Z.; Hasanuzzaman, M.; Kamyar, A. Evaluation of the effect of nanofluid-based absorbers on direct solar collector. Int. J. Heat Mass Transf. 2012, 55, 5899–5907. [Google Scholar] [CrossRef]
- Xuan, Y.; Duan, H.; Li, Q. Enhancement of solar energy absorption using a plasmonic nanofluid based on TiO2/Ag composite nanoparticles. RSC Adv. 2014, 4, 16206. [Google Scholar] [CrossRef]
- Chen, M.; He, Y.; Zhu, J.; Shuai, Y.; Jiang, B.; Huang, Y. An experimental investigation on sunlight absorption characteristics of silver nanofluids. Sol. Energy 2015, 115, 85–94. [Google Scholar] [CrossRef]
- Hunt, A.J. Small Particle Heat Exchangers; Department of Energy, Lawrence Berkeley Laboratory, Energy and Environment Division: Berkeley, CA, USA, 1978; Volume 7841. [Google Scholar]
- de Risi, A.; Milanese, M.; Laforgia, D. Modelling and optimization of transparent parabolic trough collector based on gas-phase nanofluids. Renew. Energy 2013, 58, 134–139. [Google Scholar] [CrossRef]
- Li, Q.; Zheng, C.; Mesgari, S.; Hewakuruppu, Y.L.; Hjerrild, N.; Crisostomo, F.; Morrison, K.; Woffenden, A.; Rosengarten, G.; Scott, J.A.; et al. Experimental investigation of a nanofluid absorber employed in a low-profile, concentrated solar thermal collector. In Proceedings of the SPIE Micro+Nano Materials, Devices, and Systems, Sydney, Australia, 7–9 December 2015; p. 96683P. [Google Scholar] [CrossRef]
- Xu, G.; Chen, W.; Deng, S.; Zhang, X.; Zhao, S. Performance Evaluation of a Nanofluid-Based Direct Absorption Solar Collector with Parabolic Trough Concentrator. Nanomaterials 2015, 5, 2131. [Google Scholar] [CrossRef] [PubMed]
- Eggers, J.R.; Kabelac, S. Absorption and Scattering Behavior of Nanofluids in the Visible Range. Int. J. Thermophys. 2015, 36, 2769–2783. [Google Scholar] [CrossRef]
- Howell, J.R.; Siegel, R.; Mengüç, M.P. Thermal Radiation Heat Transfer, 5th ed.; Howell, J.R., Siegel, R., Mengüç, M.P., Eds.; CRC Press: Boca Raton, FL, USA, 2011. [Google Scholar]
- SCHOTT Solar CSP GmbH. Schott PTR70 Receivers: Designed for Maximum Profitability of the Power Plant; SCHOTT Solar CSP GmbH: Mainz, Germany, 2013. [Google Scholar]
- Modest, M.F. Radiative Heat Transfer, 3rd ed.; Academic Press: Oxford, UK, 2013. [Google Scholar]
- VDI. VDI-Wärmeatlas; Springer: Berlin/Heidelberg, Germany, 2013. [Google Scholar]
- Hewakuruppu, Y.L.; Taylor, R.A.; Tyagi, H.; Khullar, V.; Otanicar, T.; Coulombe, S.; Hordy, N. Limits of selectivity of direct volumetric solar absorption. Sol. Energy 2015, 114, 206–216. [Google Scholar] [CrossRef]
- Taylor, R.A.; Hewakuruppu, Y.; DeJarnette, D.; Otanicar, T.P. Comparison of selective transmitters for solar thermal applications. Appl. Opt. 2016, 55, 3829–3839. [Google Scholar] [CrossRef] [PubMed]
- Maxwell, J.C. A Treatise on Electricity and Magnetism I-II; Clarendon: Oxford, UK, 1881. [Google Scholar]
- Einstein, A. Eine neue Bestimmung der Moleküldimensionen. Annalen der Physik (Berlin, Germany) 1906, 324, 289–306. [Google Scholar] [CrossRef]
- Einstein, A. Berichtigung zu meiner Arbeit: Eine neue Bestimmung der Moleküldimensionen. Annalen der Physik (Berlin, Germany) 1911, 339, 591–592. [Google Scholar] [CrossRef]
- Men Wirz. Optical and Thermal Modeling of Parabolic Through Concentrator Systems. Ph.D. Thesis, ETH Zurich, Zurich, Switzerland, 2014. [Google Scholar]
- Rockendorf, G. Sonnenstrahlungssimulation—Planung und Bewertung von Solarsimulatoren. Sonnenenergie 1992, 17, 14–21. [Google Scholar]
- Tan, J.; Xie, Y.; Wang, F.; Jing, L.; Ma, L. Investigation of optical properties and radiative transfer of TiO2 nanofluids with the consideration of scattering effects. Int. J. Heat Mass Transf. 2017, 115, 1103–1112. [Google Scholar] [CrossRef]
- Enguehard, F. Mie Theory and the Discrete Dipol Approximation. Calculating Radiative Properties of Particulate Media, with Application to Nanostructured Materials. In Thermal Nanosystems and Nanomaterials; Volz, S., Ed.; Microtechnology and MEMS; Springer: Berlin, Germany; London, UK, 2009; pp. 151–212. [Google Scholar]
- Bohren, C.F.; Huffman, D.R. Absorption and Scattering of Light by Small Particles; Wiley-VCH Verlag GmbH: Weinheim, Germany, 1998. [Google Scholar]
- Wiscombe, W. Mie Scattering Calculations: Advances in Technique and Fast, Vector-speed Computer Codes; Atmospheric Analysis and Prediction Division, National Center for Atmospheric Research: Boulder, CO, USA, 1979. [Google Scholar]
- Babar, S.; Weaver, J.H. Optical constants of Cu, Ag, and Au revisited. Appl. Opt. 2015, 54, 477. [Google Scholar] [CrossRef]
- Hale, G.M.; Querry, M.R. Optical Constants of Water in the 200-nanometer to 200-micrometer Wavelength Region. Appl. Opt. 1973, 12, 555–563. [Google Scholar] [CrossRef] [PubMed]
- Quinten, M. Optical Properties of Nanoparticle Systems: Mie and Beyond; Wiley-VCH: Weinheim, Germany, 2011. [Google Scholar]
- Modest, M.F.; Azad, F.H. The Influence and Treatment of Mie-Anisotropic Scattering in Radiative Heat Transfer. J. Heat Transf. 1980, 102, 92–98. [Google Scholar] [CrossRef]
- International Union of Pure and Applied Chemistry. Compendium of Chemical Terminology Gold Book. Release 2.3.3. 2014. Available online: https://goldbook.iupac.org/pdf/goldbook.pdf (accessed on 10 October 2018).
- Sidik, N.A.C.; Mohammed, H.A.; Alawi, O.A.; Samion, S. A review on preparation methods and challenges of nanofluids. Int. Commun. Heat Mass Transf. 2014, 54, 115–125. [Google Scholar] [CrossRef]
- Bhattacharjee, S. DLS and zeta potential—What they are and what they are not? J. Control. Release 2016, 235, 337–351. [Google Scholar] [CrossRef] [PubMed]
- Yu, W.; Xie, H. A Review on Nanofluids: Preparation, Stability Mechanisms, and Applications. J. Nanomater. 2012, 2012, 1–17. [Google Scholar] [CrossRef]


© 2018 by the authors. Licensee MDPI, Basel, Switzerland. This article is an open access article distributed under the terms and conditions of the Creative Commons Attribution (CC BY) license (http://creativecommons.org/licenses/by/4.0/).
Share and Cite
Eggers, J.R.; Lange, E.M.; Kabelac, S. Radiation and Energetic Analysis of Nanofluid Based Volumetric Absorbers for Concentrated Solar Power. Nanomaterials 2018, 8, 838. https://doi.org/10.3390/nano8100838
Eggers JR, Lange EM, Kabelac S. Radiation and Energetic Analysis of Nanofluid Based Volumetric Absorbers for Concentrated Solar Power. Nanomaterials. 2018; 8(10):838. https://doi.org/10.3390/nano8100838
Chicago/Turabian StyleEggers, Jan Rudolf, Eckart Matthias Lange, and Stephan Kabelac. 2018. "Radiation and Energetic Analysis of Nanofluid Based Volumetric Absorbers for Concentrated Solar Power" Nanomaterials 8, no. 10: 838. https://doi.org/10.3390/nano8100838
APA StyleEggers, J. R., Lange, E. M., & Kabelac, S. (2018). Radiation and Energetic Analysis of Nanofluid Based Volumetric Absorbers for Concentrated Solar Power. Nanomaterials, 8(10), 838. https://doi.org/10.3390/nano8100838