3.1. Theoretical Simulation and Morphological Analysis
To gain deeper insights into the zinc deposition kinetics across various electrolyte systems, an electrochemical deposition model was developed based on the phase-field method. In this model, a non-conserved order parameter ξ (ξ = 0 representing the electrolyte phase and ξ = 1 representing the zinc metal phase) was introduced to track the evolution of the electrode/electrolyte interface. The total free energy F of the system is collectively determined by the gradient, chemical, electrostatic, and elastic energies (Equation (1)). The transport behavior of zinc ions is governed by the Nernst–Planck equation (Equation (3)), which accounts for the interplay between diffusion (DZn2+∇C) and electromigration (DZn2+ C∇ϕ). Meanwhile, the interfacial electrochemical reaction rate is described by Butler–Volmer kinetics (Equation (2)).
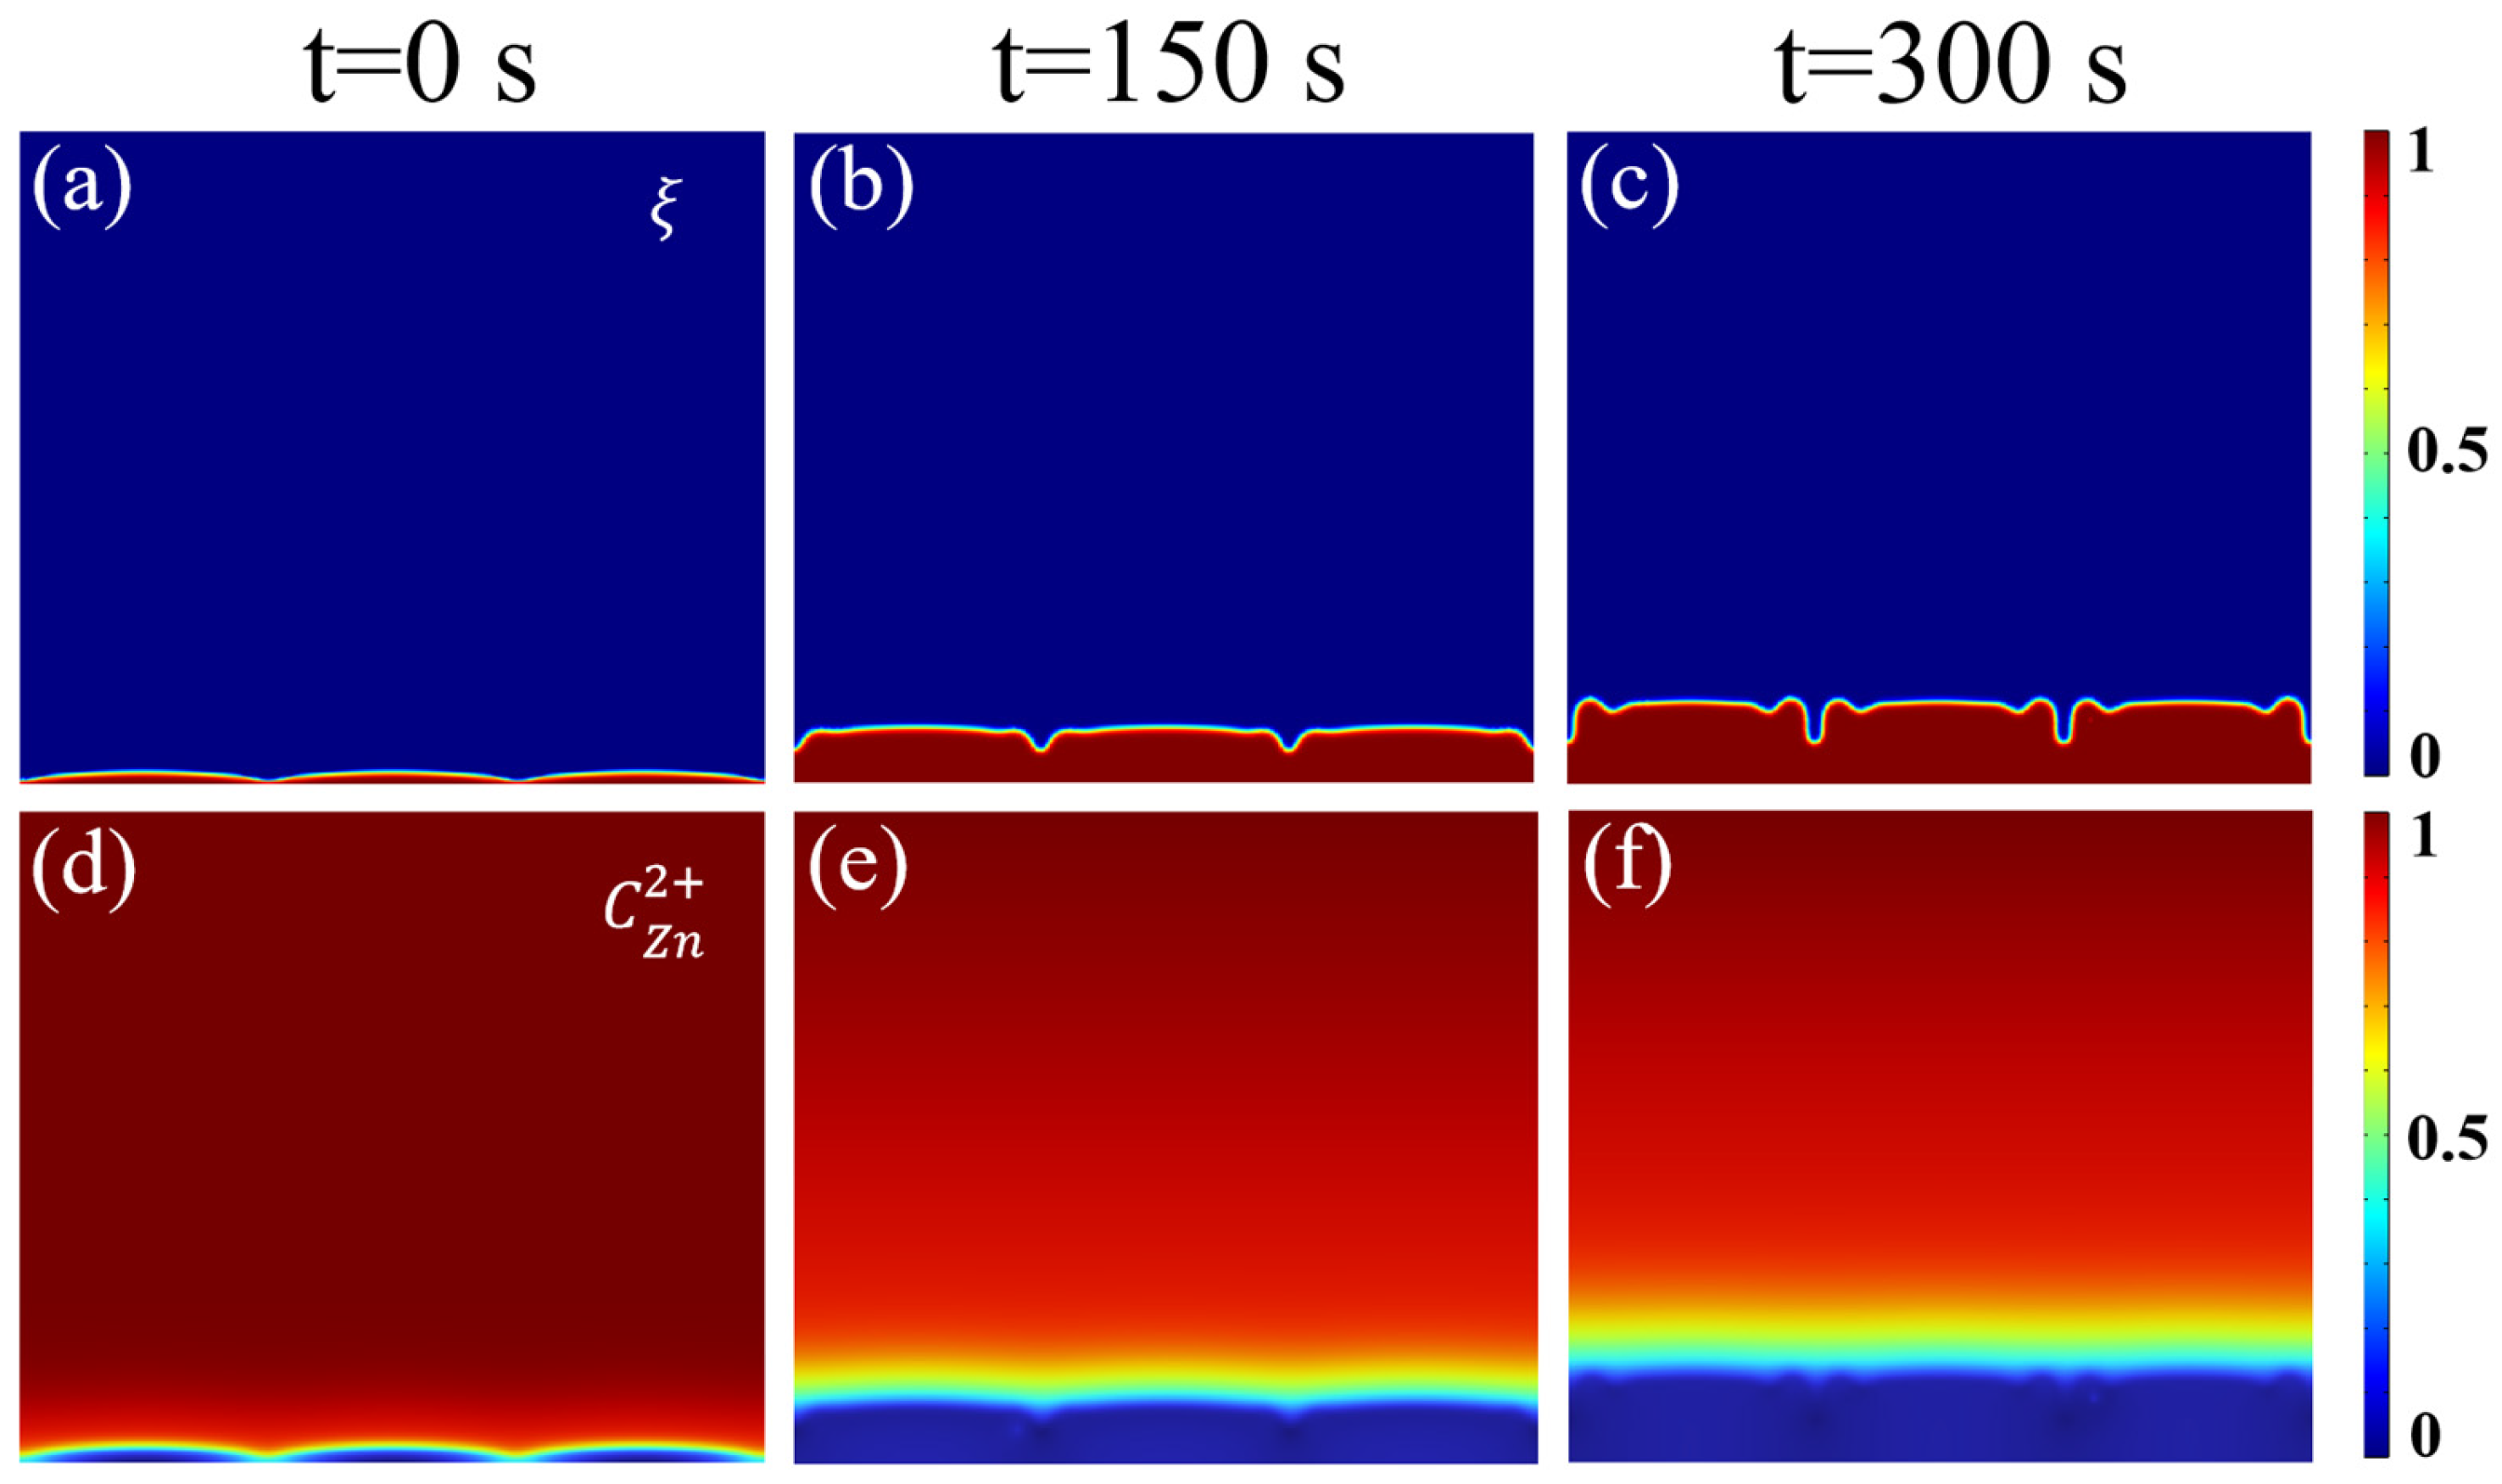
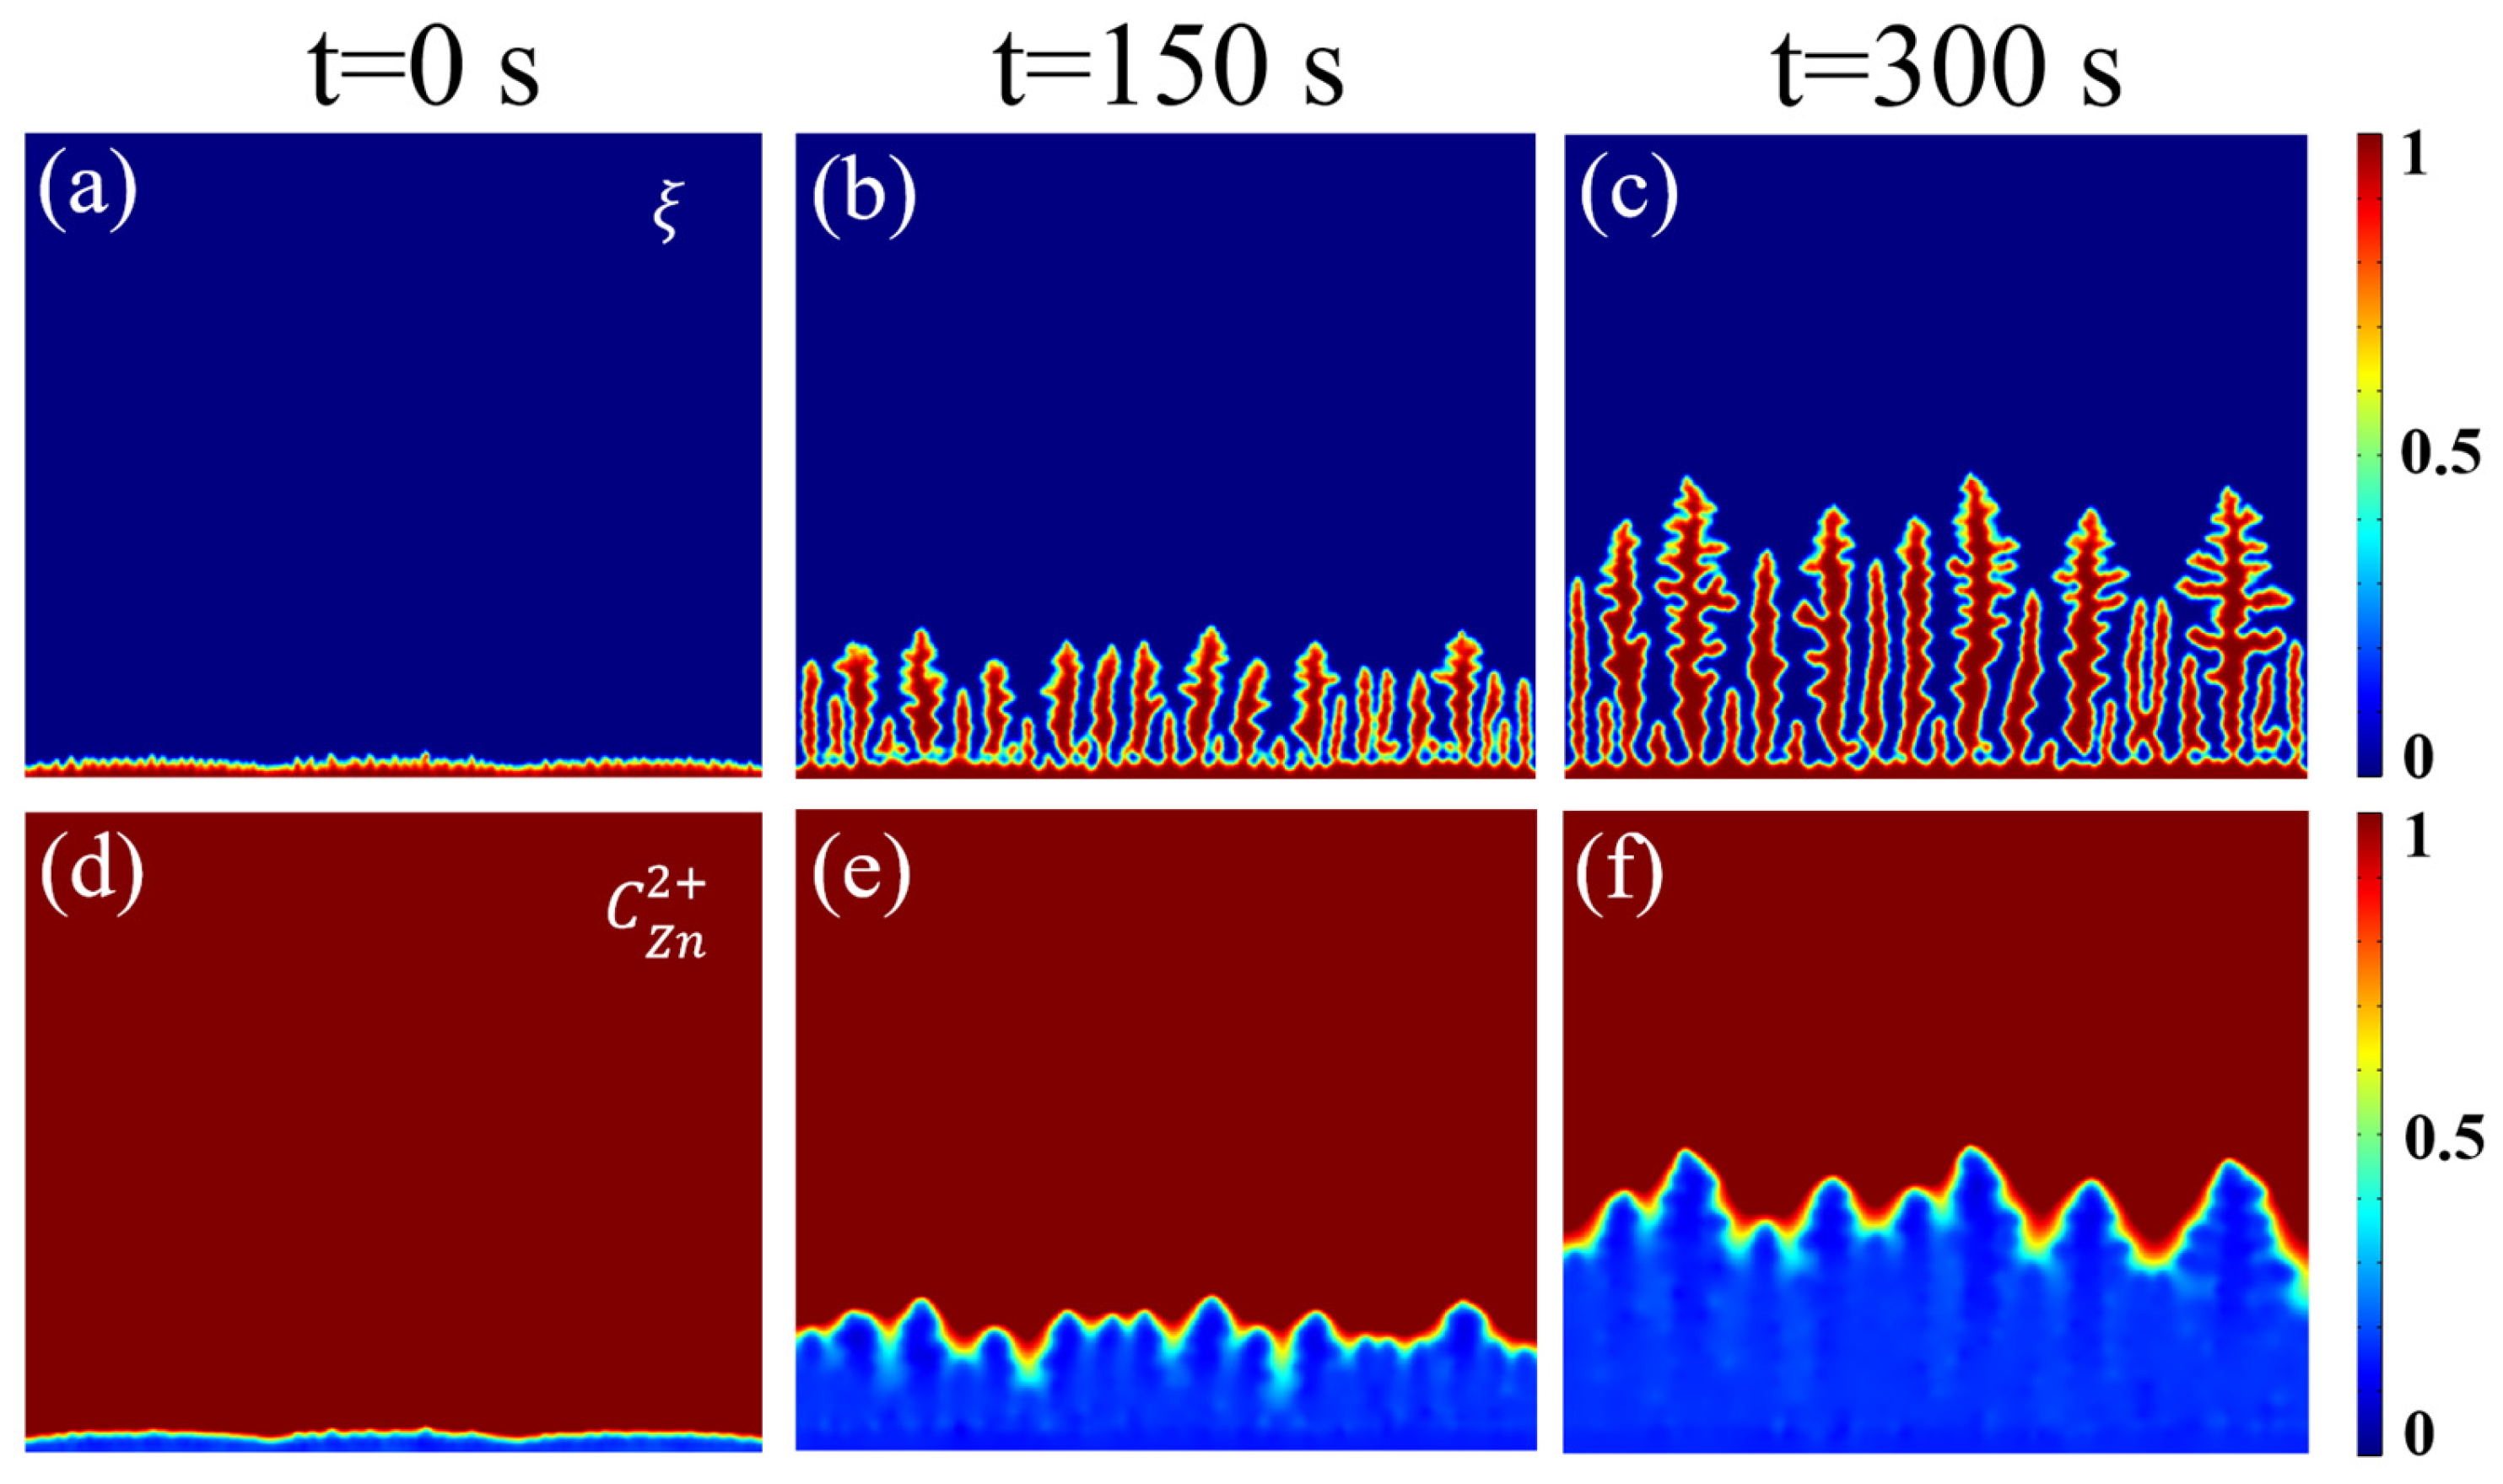
Figure 2 illustrates the simulation and experimental results within the HDES electrolyte system. According to the interfacial evolution captured by phase-field simulations (
Figure 2a–c), the zinc anode maintains a predominantly flat, layered growth mode throughout the deposition process from t = 0 to 300 s. Although slight curvature fluctuations occur on the surface, only rounded protrusions are formed even in the late stages of deposition, with no observable sharp dendritic growth.
The corresponding concentration field simulations (
Figure 2d–f) reveal the underlying mechanism: in the HDES system, the concentration gradient lines remain highly parallel to the electrode surface, exhibiting no significant ionic “hotspots” or severe distortions even at the convex sites. This indicates that the HDES system possesses exceptional ion transport characteristics, providing a uniform ion flux that effectively suppresses the local ionic accumulation induced by the electromigration term in the Nernst–Planck equation, thereby eliminating the “tip effect.”
Figure 3 illustrates the “runaway” deposition behavior observed in the conventional aqueous ZnSO
4 electrolyte. Phase-field simulations (
Figure 3a–c) reveal that sharp vertical protrusions emerge at the interface as early as t = 150 s, exhibiting a strong tendency for preferential growth. By t = 300 s, these regions have evolved into dense lamellar structures.
The corresponding concentration field simulations (
Figure 3d–f) uncover the root cause of this failure: restricted ion diffusion in the aqueous electrolyte leads to the formation of an ion enrichment zone with a high concentration gradient at the protrusion tips, while the roots become zinc-depleted zones. According to the coupled mechanism of diffusion and electromigration, this non-uniform ion flux causes a localized surge in electric field intensity and reaction kinetics (Equation (2)) at the tips. This triggers a vicious cycle where “sharper tips grow faster,” a phenomenon known as the typical “tip growth effect ” [
41].
Comparative analysis concludes that the HDES electrolyte, by modulating the coordination environment, achieves a homogeneous distribution of the Zn2+ concentration field. This effectively eliminates localized ion accumulation and the tip effect that typically trigger dendritic growth. Guided by a uniform ionic flux, the Zn anode surface undergoes smooth, layered growth. Even after prolonged deposition (300 s), only rounded protrusions are observed, successfully suppressing the formation of sharp dendrites.
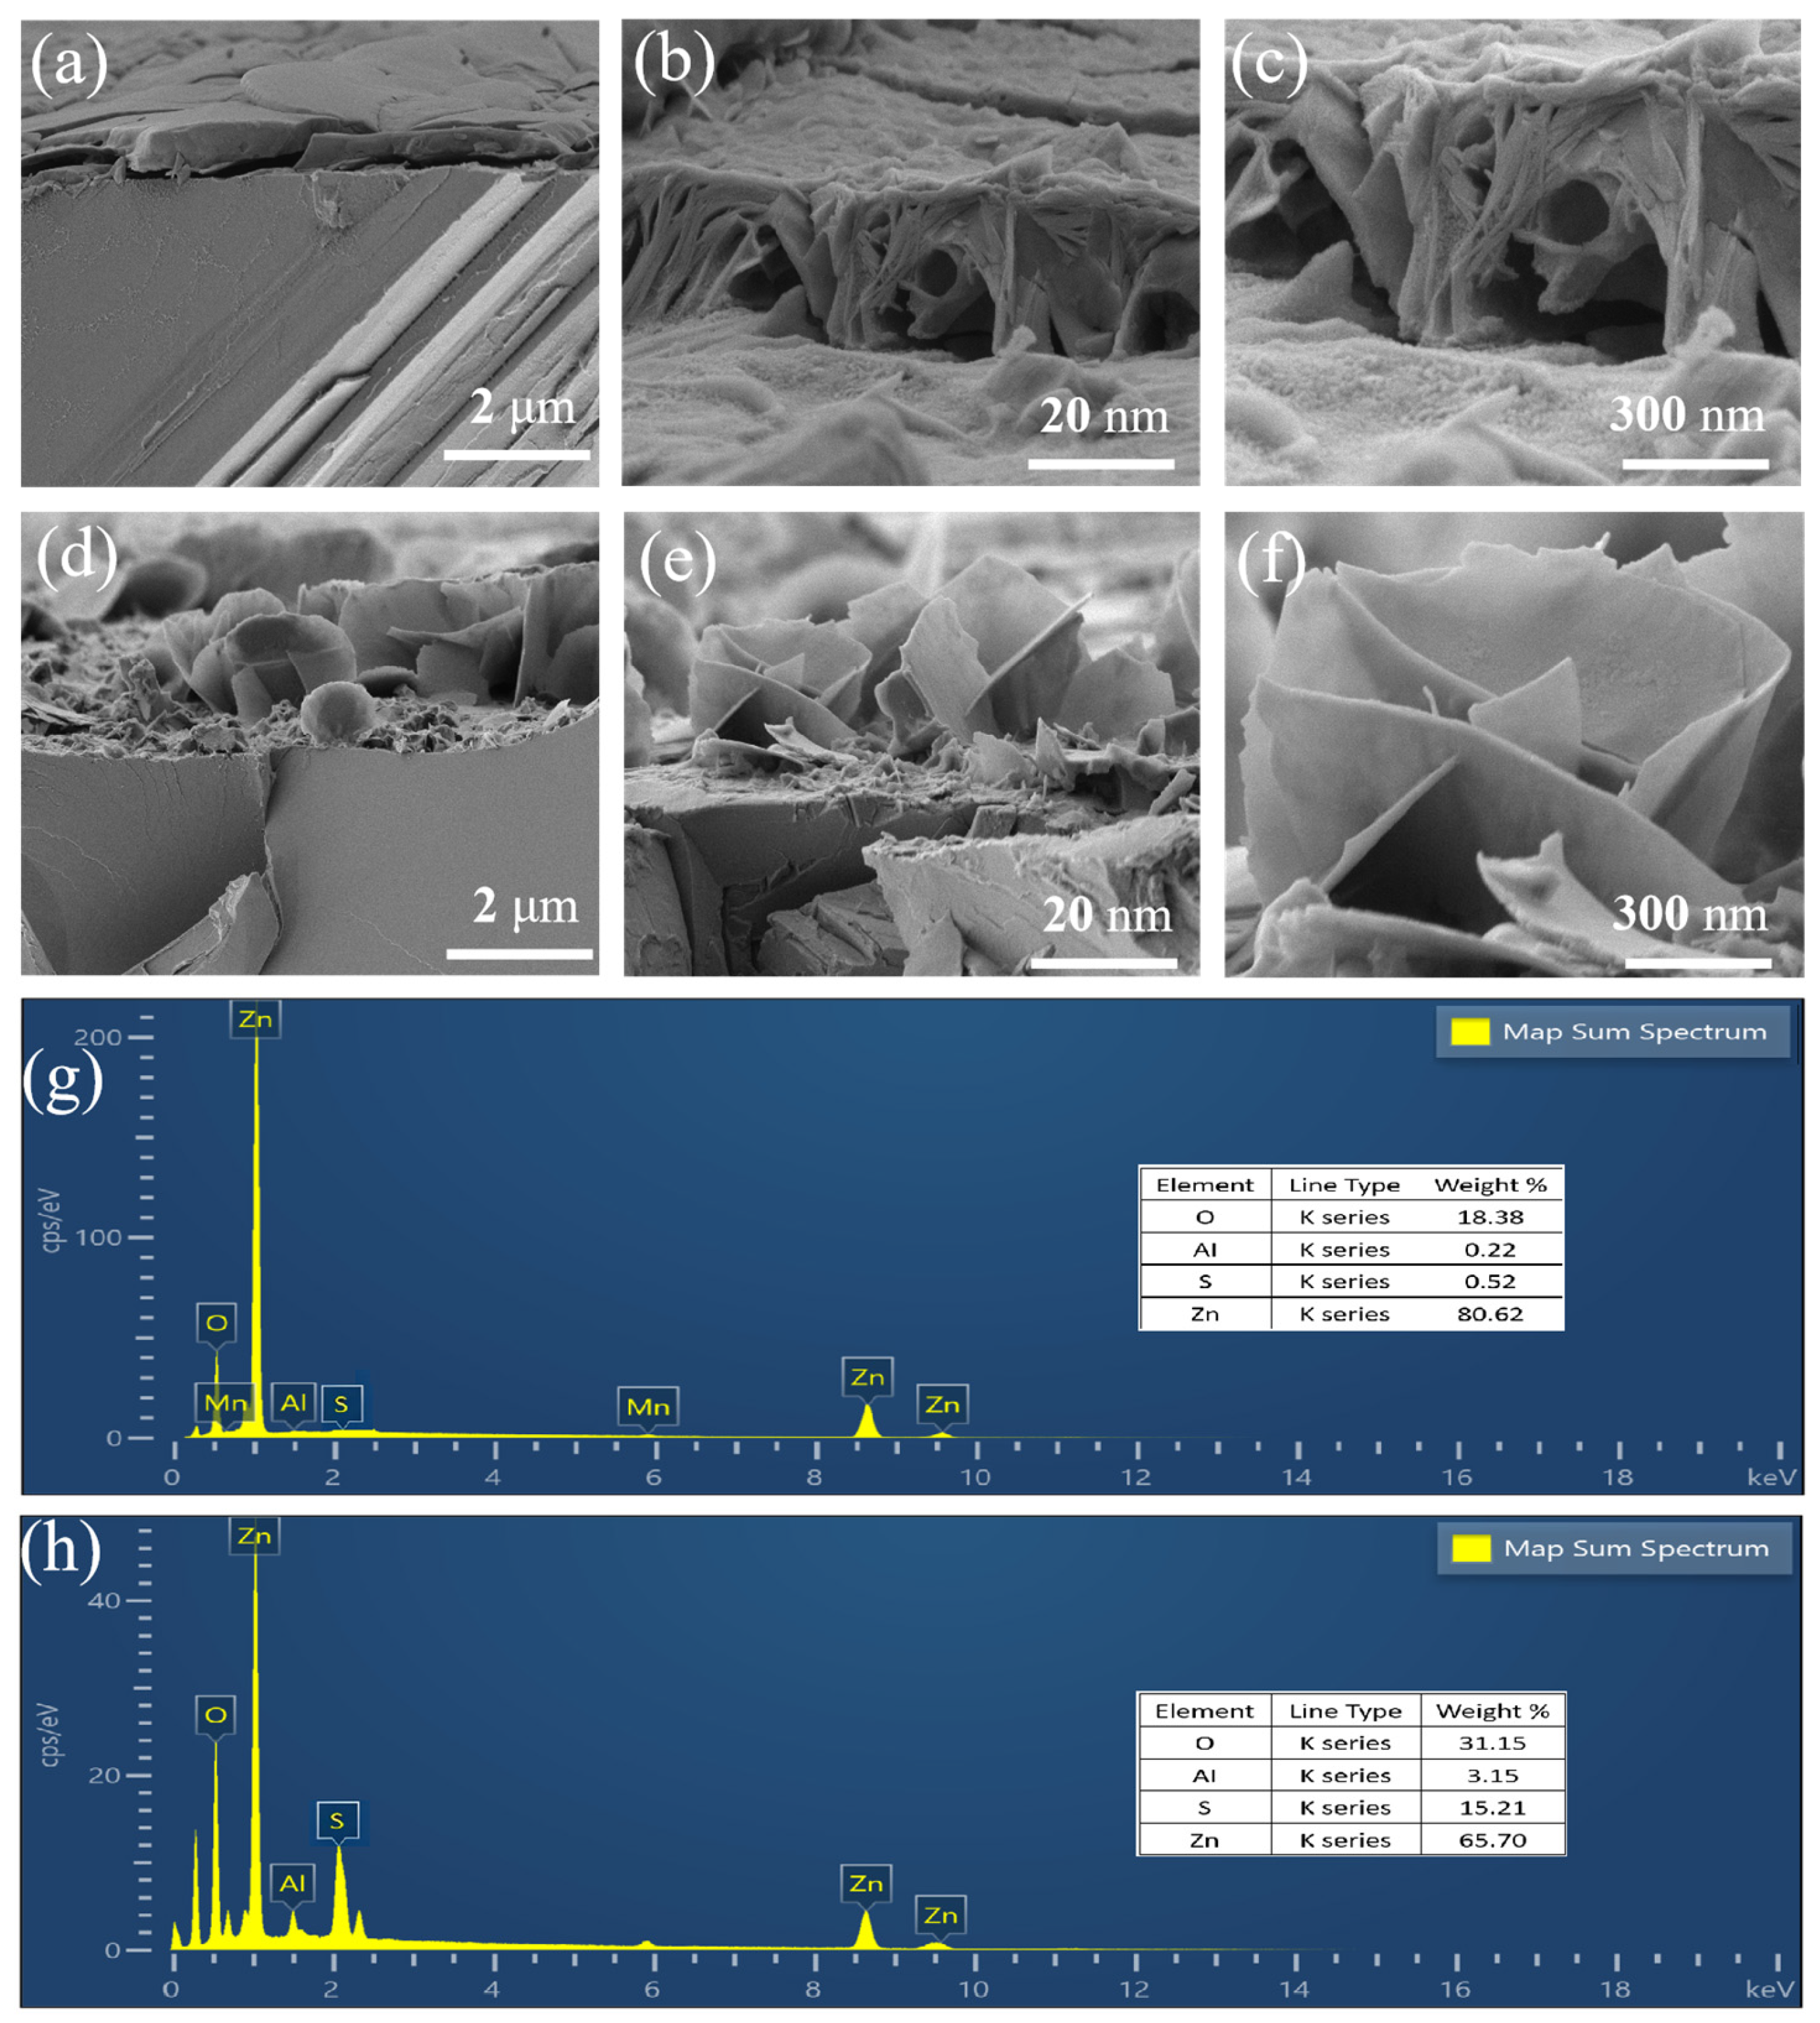
To validate the theoretical predictions derived from the phase-field simulations, ex situ SEM characterization was performed on the Zn anodes after cycling. As predicted by the simulation in
Figure 3c, which indicated severe tip growth effects due to uneven ion flux, the experimental SEM images of the aqueous ZnSO
4 system in
Figure 4d–f exhibit a rough surface covered with large, sharp, and disordered hexagonal platelets. These sharp features correspond perfectly to the localized high-current-density regions identified in the concentration field simulation in
Figure 3f.
Figure 4d–f display the morphology of the Zn anode cycled in the ZnSO
4 electrolyte system. The surface is covered by a thick, disordered layer of deposits, distinct from the smooth surface observed in the HDES system. Upon magnification, these deposits are identified as massive platelet-like crystals. These rigid platelets, characterized by extremely sharp edges, are stacked haphazardly with significant voids, and their dimensions are vastly larger than the nanosheets formed in the HDES. Under an electric field, these sharp edges induce a severe “tip effect,” attracting preferential Zn
2+ deposition. This mechanism is identified as the primary culprit behind the rapid capacity decay and battery failure caused by dendrite-induced separator piercing.
In sharp contrast, and consistent with the smooth deposition predicted in
Figure 2c, the Zn anode cycled in the HDES electrolyte displays a remarkably flat morphology, as shown in
Figure 4a. The high-magnification images in
Figure 4b,c reveal a unique interconnected 3D nanosheet network. This orderly and dense structure serves as direct experimental evidence that the HDES effectively homogenized the ion flux and eliminated the tip effect, thereby strictly validating the mechanism proposed by our phase-field models.
Figure 4a–c present the post-cycling SEM images of the Zn anode in the HDES electrolyte system. At lower magnification, the anode surface exhibits a remarkably smooth and planar morphology, devoid of bulky protrusions, with the Zn deposition layer forming dense and intimate contact with the substrate. High-magnification views reveal a 3D porous network structure composed of interwoven nanosheets. This ordered arrangement of nanoscale sheets not only mitigates the risk of separator puncture but also significantly reduces the local effective current density due to its immense specific surface area. Consequently, this architecture alleviates electrode polarization and ensures superior stability at high rates. These findings demonstrate the exceptional capability of the DES electrolyte to modulate Zn
2+ kinetics, facilitating abundant and uniformly distributed nucleation sites, thereby preventing localized ion accumulation.
To further probe the chemical composition of the deposition products, EDAX analysis was conducted, as shown in
Figure 4g,h. For the pristine Zn anode, only characteristic Zn signals were detected. After cycling in the aqueous electrolyte, as shown in
Figure 4h, the EDAX spectrum of the distinct hexagonal platelets showed intense signals corresponding to O and S elements. The atomic ratio suggests the formation of byproduct basic zinc sulfates, which aligns with the severe corrosion and passivation predicted by the theoretical analysis. Conversely, for the Zn anode cycled in the HDES system, shown in
Figure 4g, the mapping results display a uniform and predominant distribution of Zn, with negligible O and S signals. This elemental evidence confirms that the unique nanosheet structure observed in SEM consists of high-purity metallic zinc, demonstrating the efficacy of the HDES in suppressing parasitic reactions and byproduct accumulation.
Collectively, these morphological results perfectly corroborate the simulation predictions, confirming that the HDES achieves a uniform zinc-ion flux by reconstructing the solvation sheath, thereby inducing this superior, dendrite-free nanosheet deposition morphology.
3.2. Structural Characterization and Physicochemical Properties
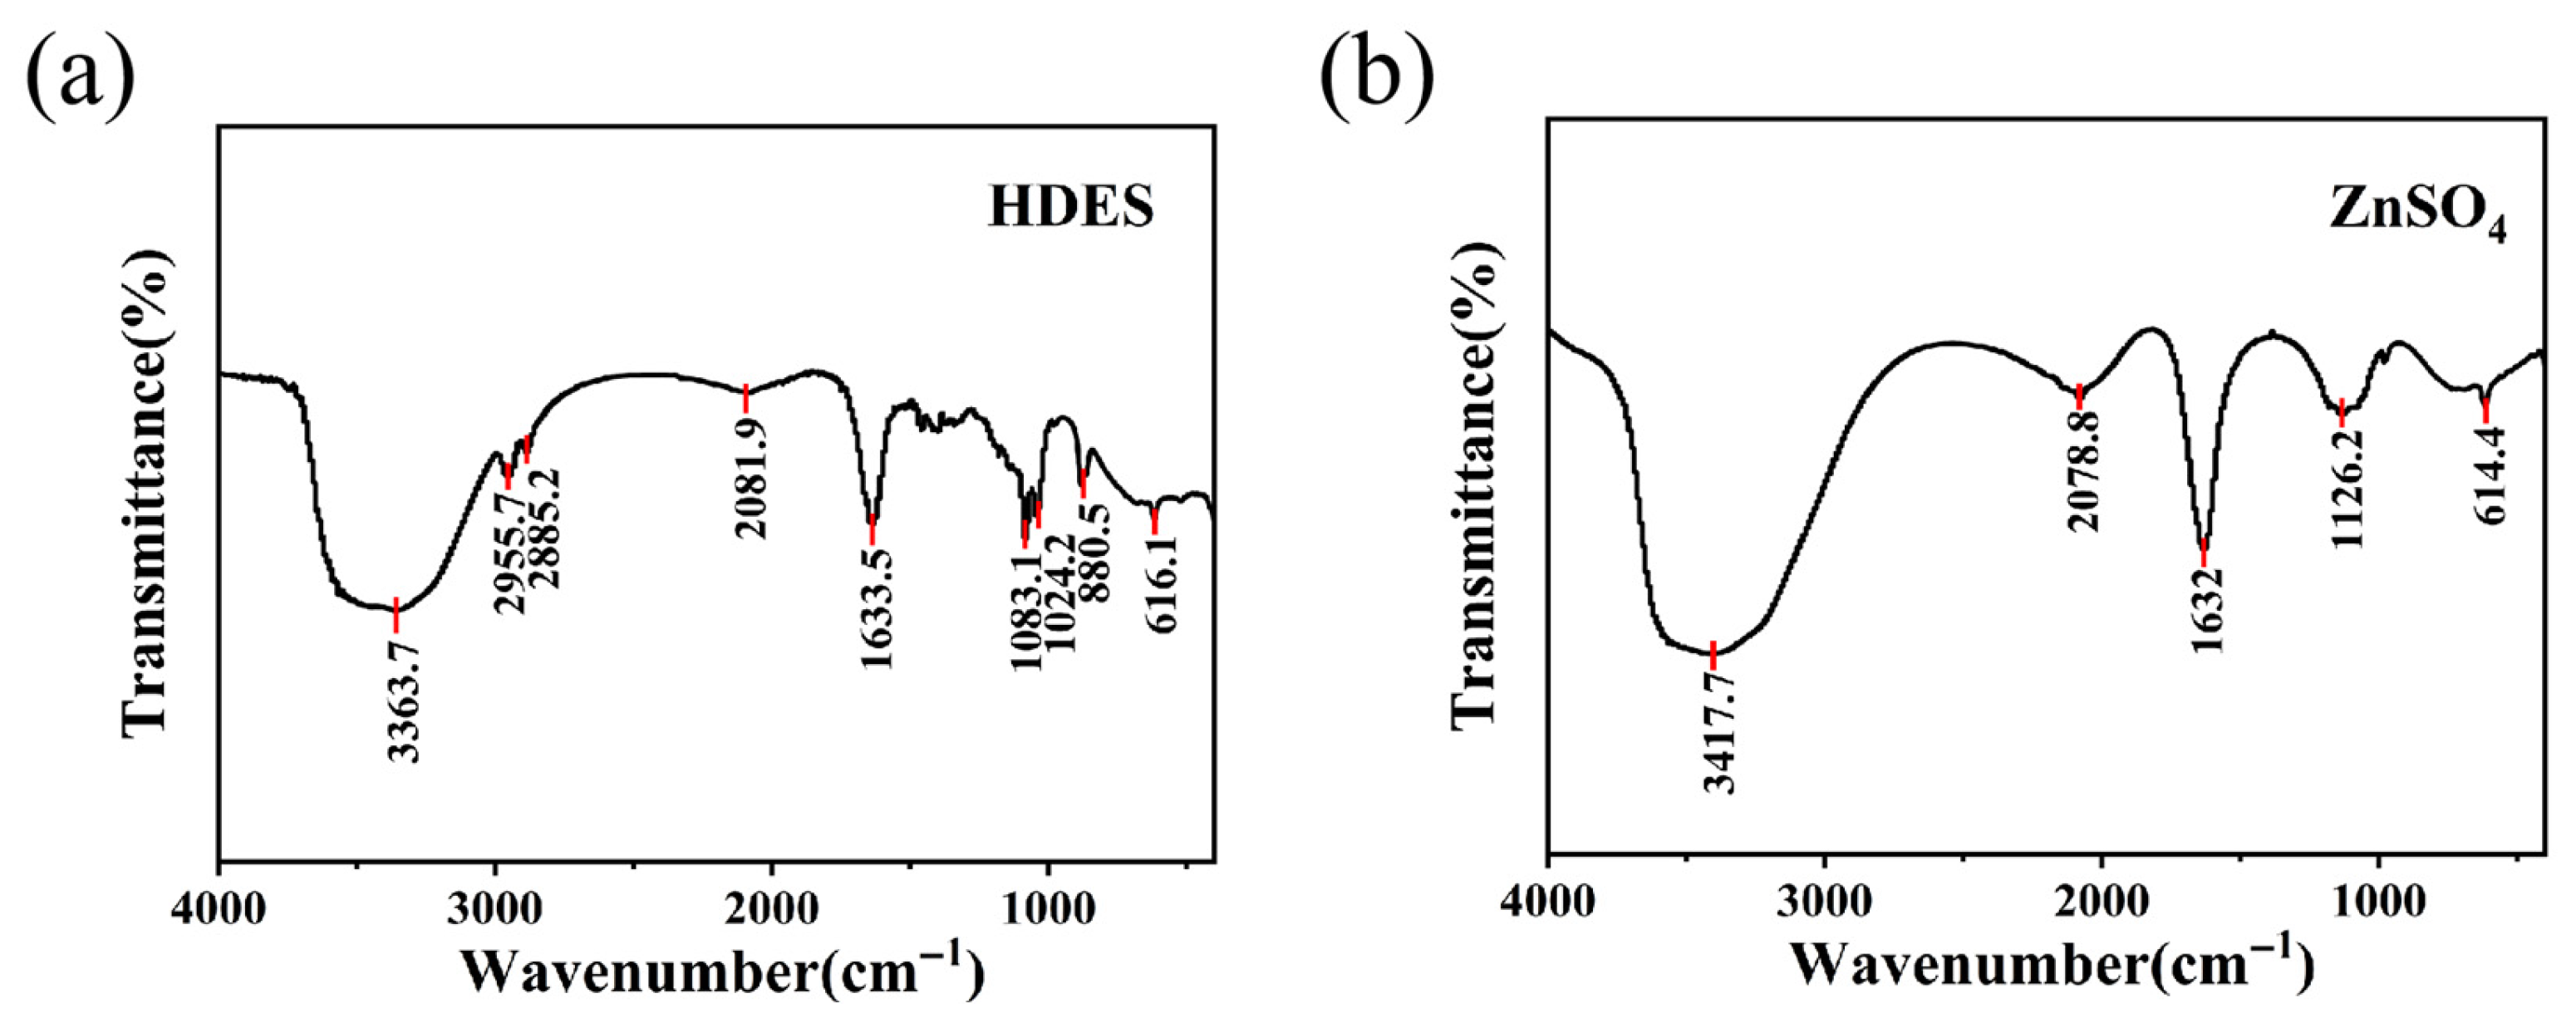
Figure 5 illustrates the FT-IR spectra of the HDES and the aqueous ZnSO
4 solution. As shown in
Figure 5a, the hydroxyl (-OH) stretching vibration peak of the HDES exhibits a significant red shift of 54 cm
−1, moving from 3417.7 cm
−1 to 3363.7 cm
−1. This shift indicates that the introduction of EG molecules facilitates the formation of a dense and robust hydrogen bonding network between EG, water molecules, and sulfate ions. Such strong intermolecular interactions weaken the force constant of the O-H bonds in water, leading to bond elongation and a subsequent decrease in vibrational frequency (lower wavenumber). Consequently, water molecules are effectively sequestered within the hydrogen bonding matrix by EG and the ions, which drastically reduces their thermodynamic activity, thereby suppressing the HER and electrode corrosion. New absorption bands emerging at 2955.7 cm
−1 and 2885.2 cm
−1 are attributed to the vibrational signals of the methylene (-CH
2-) groups in the EG backbone, confirming the successful integration of the organic solvent as a primary electrolyte component. Furthermore, the bands in the 1000 cm
−1–1200 cm
−1 region become broadened and split, primarily at 1083.1 cm
−1 and 1024.2 cm
−1. This is mainly due to the superposition of the C-O stretching vibrations from EG and the shifted/deformed sulfate (SO
42−) signals [
42,
43]. This transformation suggests that (SO
42−) ions are no longer merely hydrated but are deeply incorporated into the Zn
2+ solvation sheath, synergistically modulating the coordination environment of zinc ions alongside EG.
Figure 5b illustrates the typical FT-IR spectral features of hydrated zinc sulfate. The primary absorption bands at 1632 cm
−1 and 3417 cm
−1 originate from water of crystallization (lattice water). The presence of the O-H stretching vibration at such a high wavenumber indicates that water molecules in the aqueous solution exist predominantly in a free or unbound state. Meanwhile, the peaks within the 614–1126 cm
−1 range are assigned to the characteristic vibrations of sulfate ions (SO
42−). The sharp peak profiles and the absence of significant splitting suggest that (SO
42−) maintains high molecular symmetry in the dilute solution. This indicates that the sulfate ions are primarily solvated by water molecules (forming hydrated sulfate) and exhibit relatively simple or weak interactions with the coordinating cations.
The distinct contrast between the two spectra clearly elucidates the molecular origin of the HDES electrolyte’s superior performance. By establishing a robust hydrogen bonding network to “sequester” free water and reconfiguring the ionic coordination environment, the HDES effectively mitigates parasitic side reactions triggered by the excessive water activity inherent in conventional aqueous electrolytes. These findings provide compelling microscopic evidence for achieving long-term cycling stability in zinc-ion batteries.
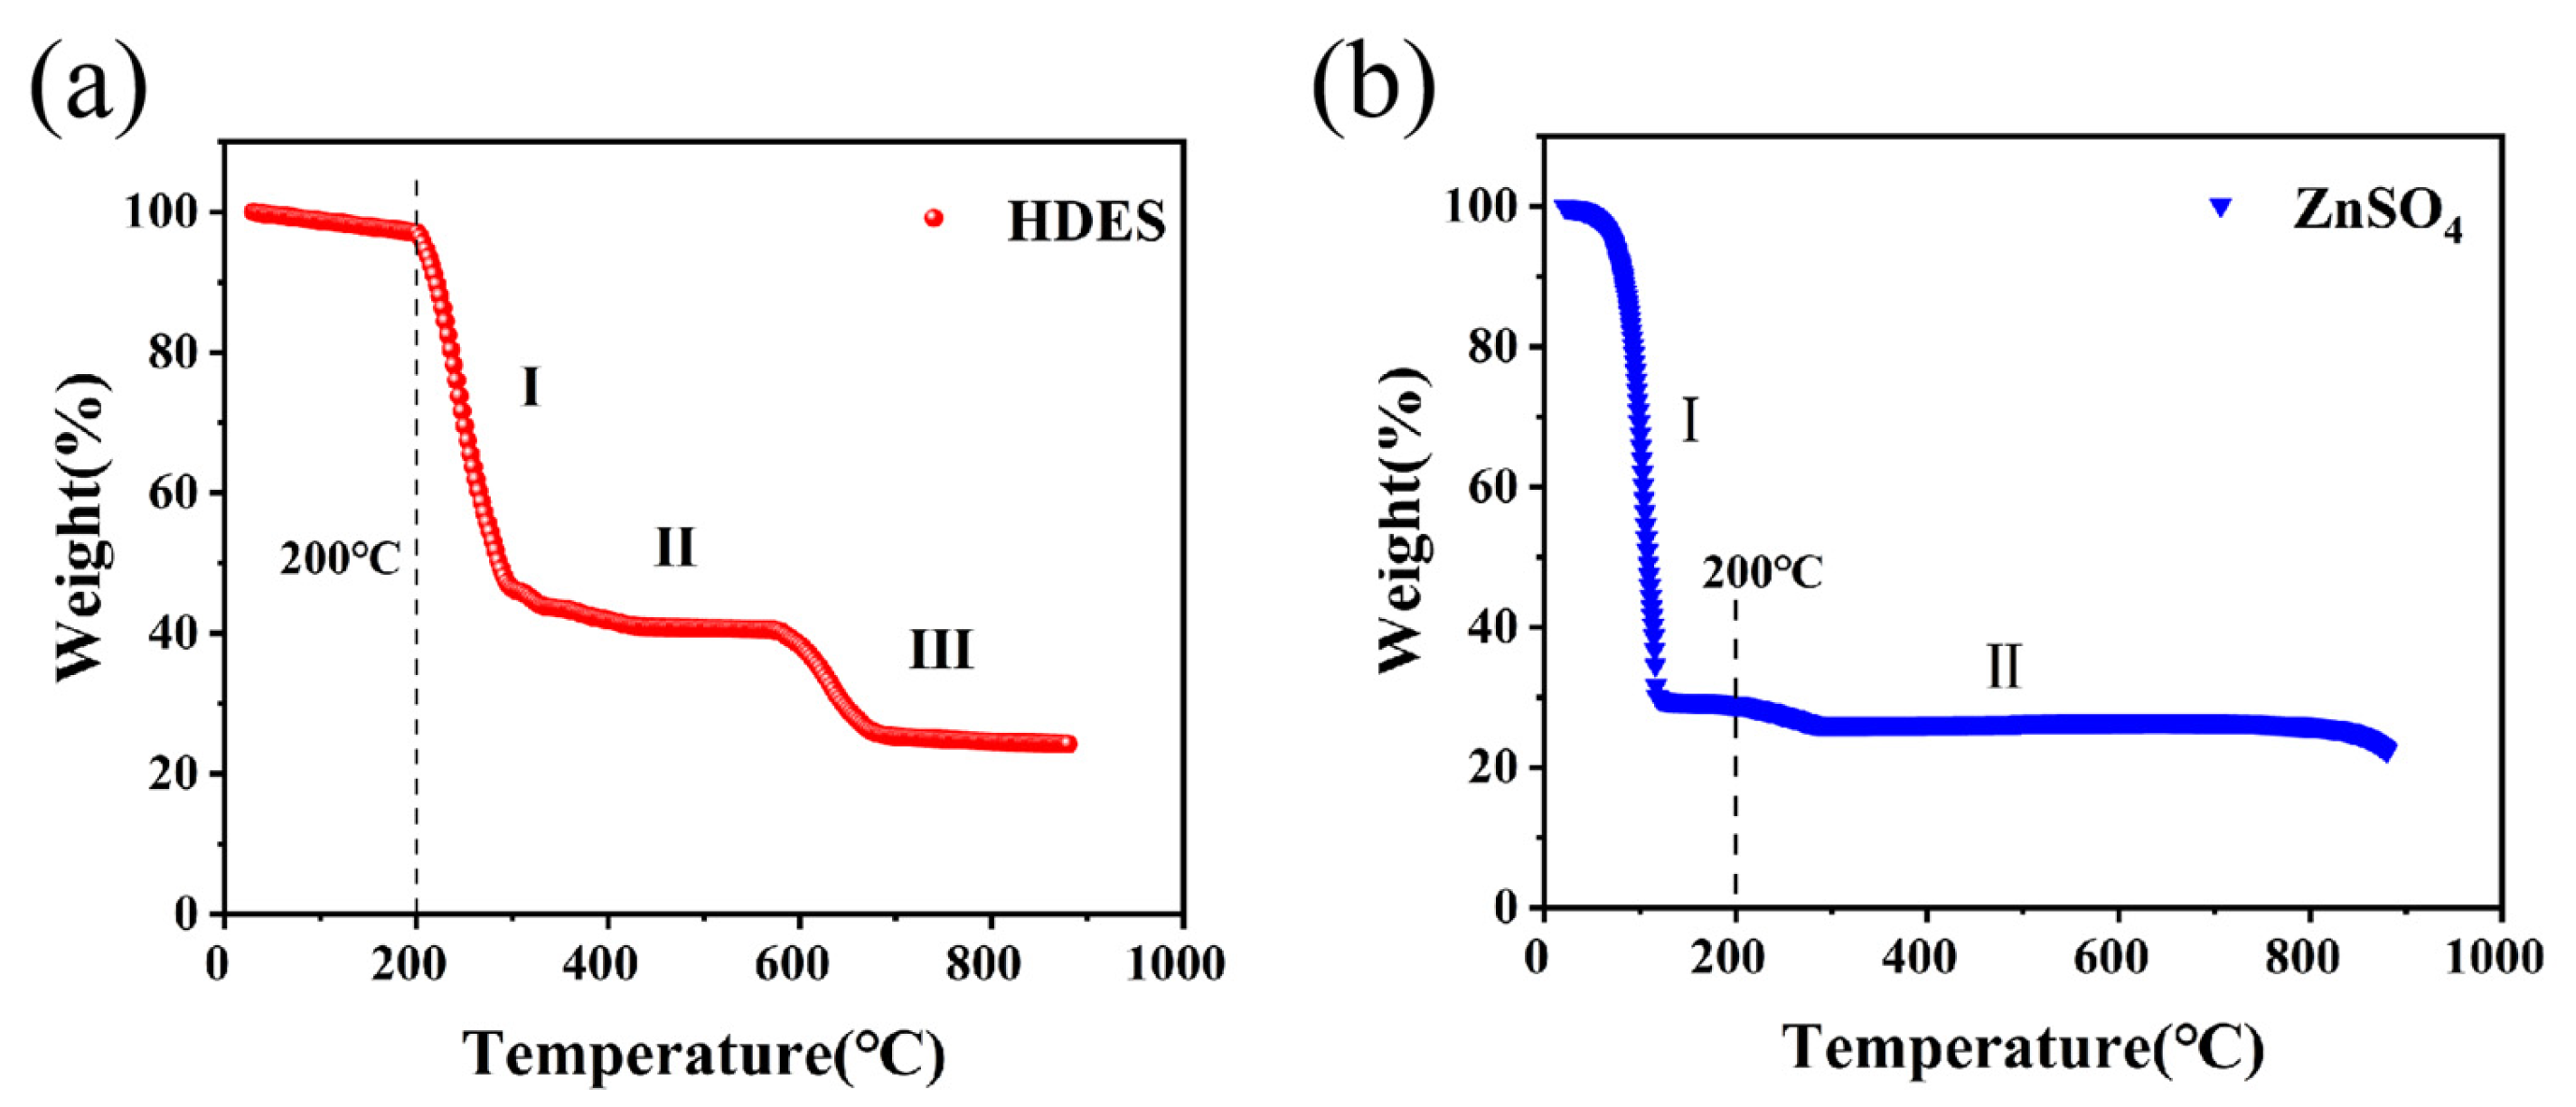
Figure 6a presents the TGA results, demonstrating that the as-prepared HDES exhibits negligible weight loss during Stage I (25–200 °C). This signifies the absence of free, volatile solvent water, confirming that the electrolyte effectively sequesters free water within a robust structural framework. Upon entering Stage II (200–600 °C), the weight undergoes a steady and gradual decline, eventually reaching approximately 20%. This broad weight loss region, spanning nearly 400 °C, corresponds to the progressive decomposition of various constituents (e.g., ethylene glycol, ZnSO
4, and MnSO
4) and their intermolecular interaction products. The significant broadening of the decomposition temperature window suggests that the components form a stable, integrated structure via synergistic interactions such as hydrogen bonding and coordination, requiring higher thermal energy for disruption. This indicates that the HDES electrolyte possesses exceptional thermal stability over a wide temperature range, outperforming most aqueous and aprotic electrolyte systems [
44]. In Stage III (600–900 °C), the weight loss levels off and eventually stabilizes.
In contrast, the TGA curve of ZnSO
4 in
Figure 6b exhibits only two distinct stages. During Stage I (25–200 °C), the weight undergoes a sharp decline from 100% to approximately 40%, which is primarily attributed to the dehydration of lattice water (in the case of hydrated ZnSO
4) and the initial thermal decomposition of ZnSO
4 into zinc oxide (ZnO) and sulfur trioxide (SO
3). In Stage II (200–900 °C), the weight decreases gradually before eventually reaching a stable plateau.
The aforementioned TGA results indicate that the prepared HDES exhibits no significant weight loss below 200 °C, corroborating the formation of a robust hydrogen-bonded network between the electrolyte components and water molecules, which effectively sequesters free water. Its broad and gradual decomposition temperature window reflects the strong intermolecular interactions and superior thermal stability of the system. This thermal robustness is highly consistent with the exceptional interfacial stability demonstrated by the electrolyte during electrochemical cycling.
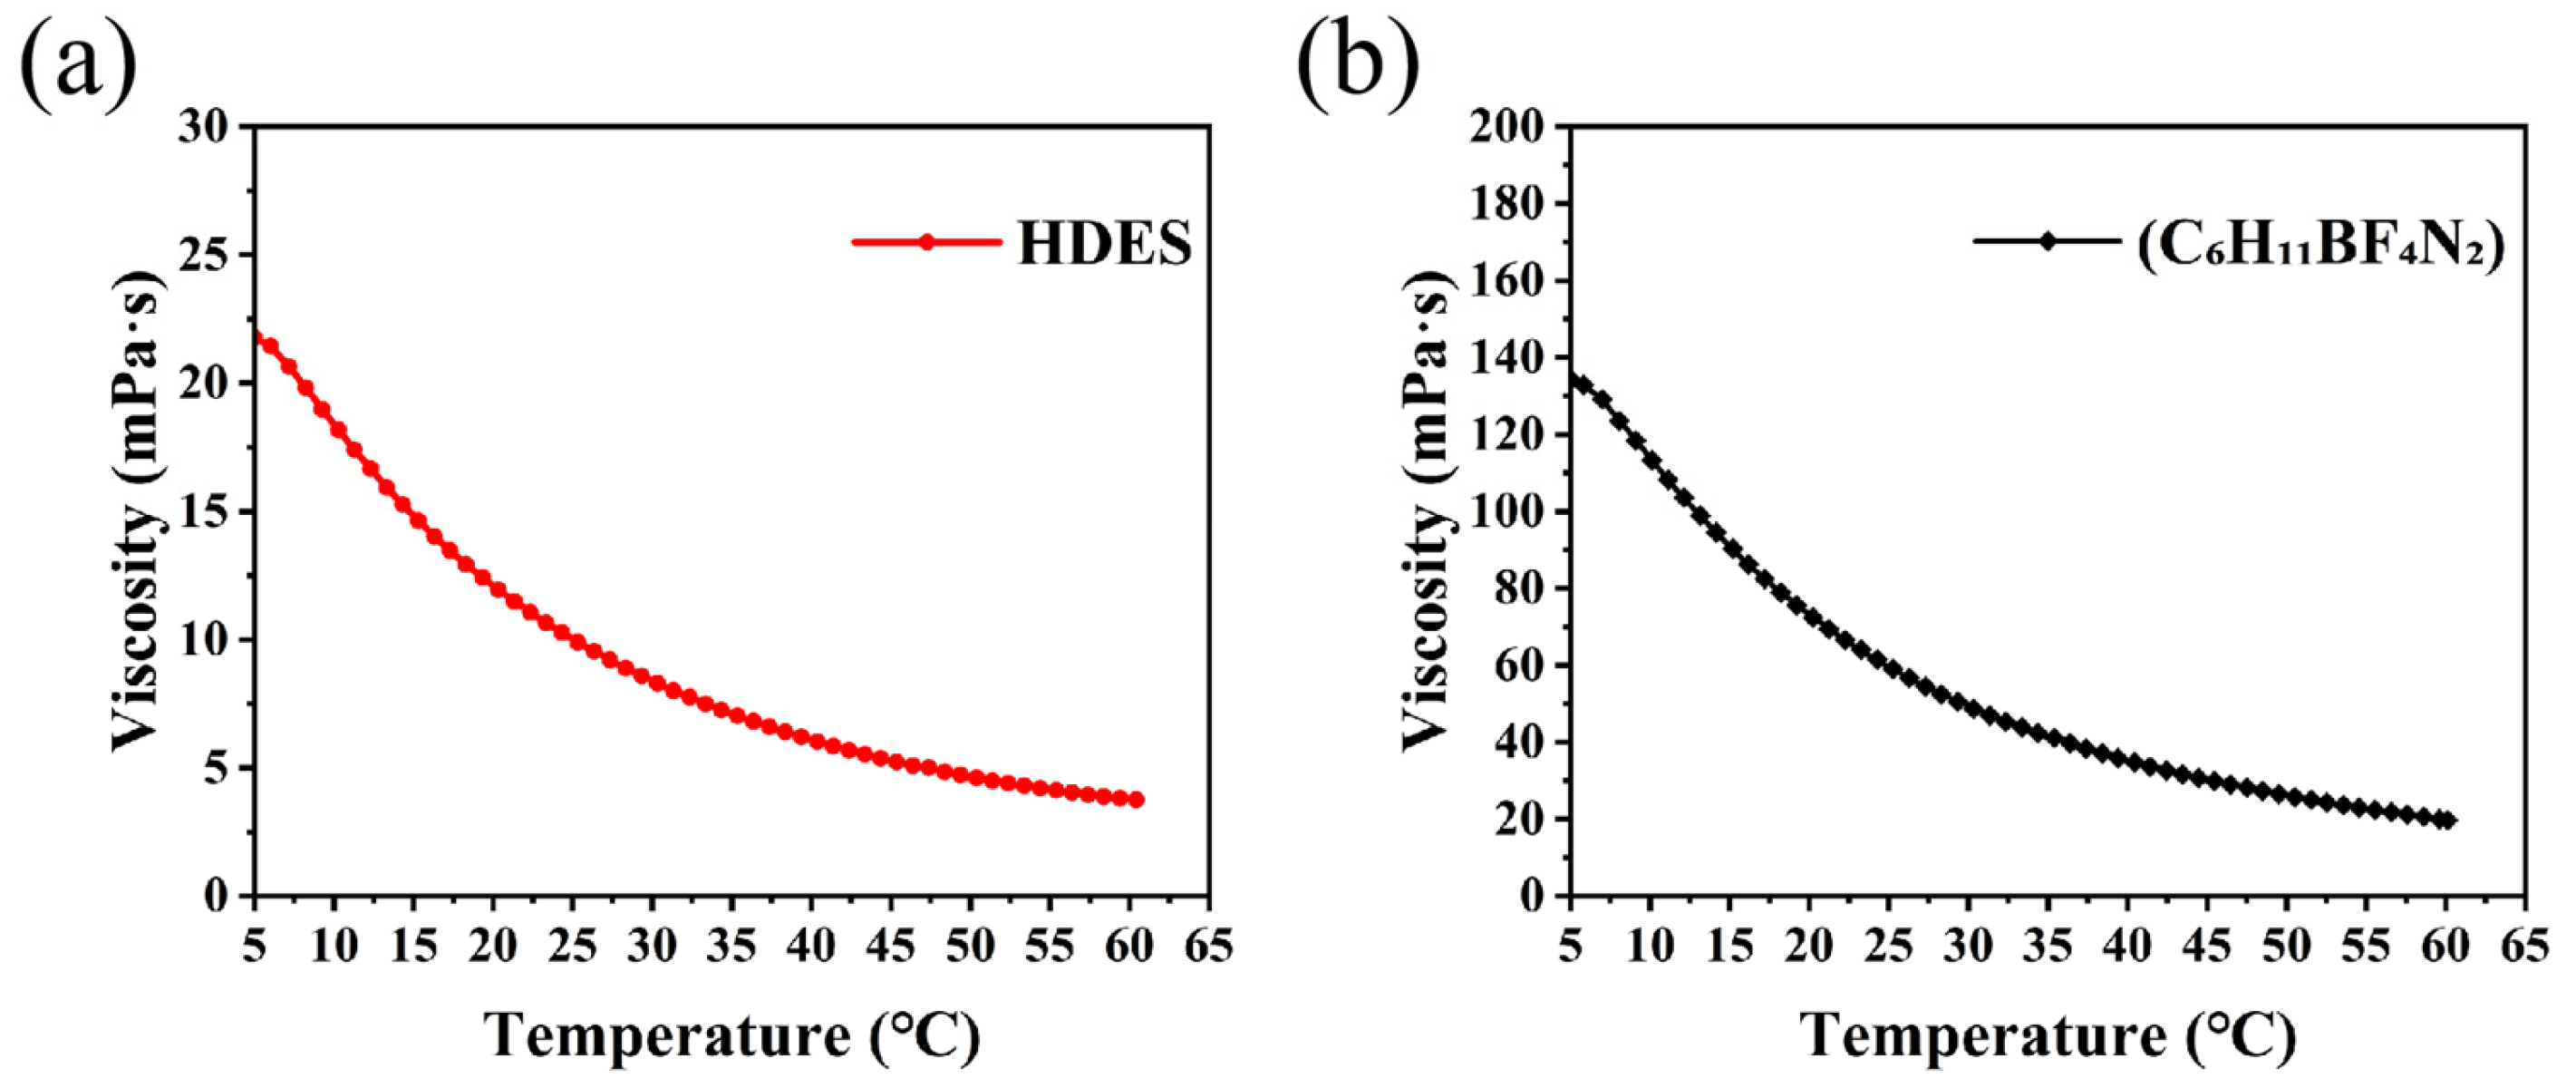
Figure 7 illustrates the temperature dependence of viscosity for the HDES compared with the ionic liquid [(C
6H
11BF
4)N
2]. The deep eutectic electrolyte developed in this work exhibits significantly superior fluidity and wide-temperature adaptability. Within the range of 5 °C to 65 °C, the viscosity of the HDES remains consistently and substantially lower than that of the reference ionic liquid. Specifically, at 5 °C, the HDES possesses a viscosity of approximately 22 mPa·s, whereas the ionic liquid reaches a much higher value of 138 mPa·s. As the temperature rises to 65 °C, their viscosities steadily decline to approximately 4 mPa·s and 16 mPa·s, respectively.
This disparity originates from the structural characteristics of the systems: The HDES is composed of small molecules (e.g., ethylene glycol) organized through a dynamic hydrogen bonding network, resulting in weaker intermolecular forces and minimal steric hindrance. In contrast, the bulky and rigid organic cations in the ionic liquid lead to significantly higher flow resistance [
45]. The low-viscosity characteristic endows the HDES electrolyte with accelerated ion migration and superior wettability toward both the electrodes and the separator, providing a crucial kinetic foundation for achieving low polarization and highly reversible electrochemical deposition behavior (as evidenced by the CV results).
Furthermore, the viscosity varies moderately with temperature, maintaining excellent fluidity even in the low-temperature region, which suggests great potential for applications across a broad temperature window, particularly in sub-zero environments. In summary, the viscosity analysis confirms the advantages of the HDES electrolyte in terms of ion transport and interfacial compatibility from a rheological perspective, providing a robust physical property basis for the enhancement of overall electrochemical performance. It is worth noting that the ionic conductivity of the viscous HDES electrolyte is generally lower than that of traditional dilute aqueous electrolytes. This is governed by the Stokes–Einstein relation, where the extensive hydrogen bond network within the HDES increases viscosity, thereby restricting the bulk mobility of Zn2+ ions and limiting the maximum achievable current density to some extent. However, this physicochemical property presents a necessary trade-off for stability. The reduced mobility and strong molecular interactions effectively suppress the thermodynamic activity of free water and inhibit the “tip effect” during deposition. Consequently, while the aqueous counterpart suffers from rapid failure due to dendrites and parasitic reactions despite its high conductivity, the HDES system sacrifices partial bulk transport speed to secure exceptional interfacial stability, enabling a dendrite-free morphology and a long lifespan exceeding 2000 cycles.
3.3. Electrochemical Performance
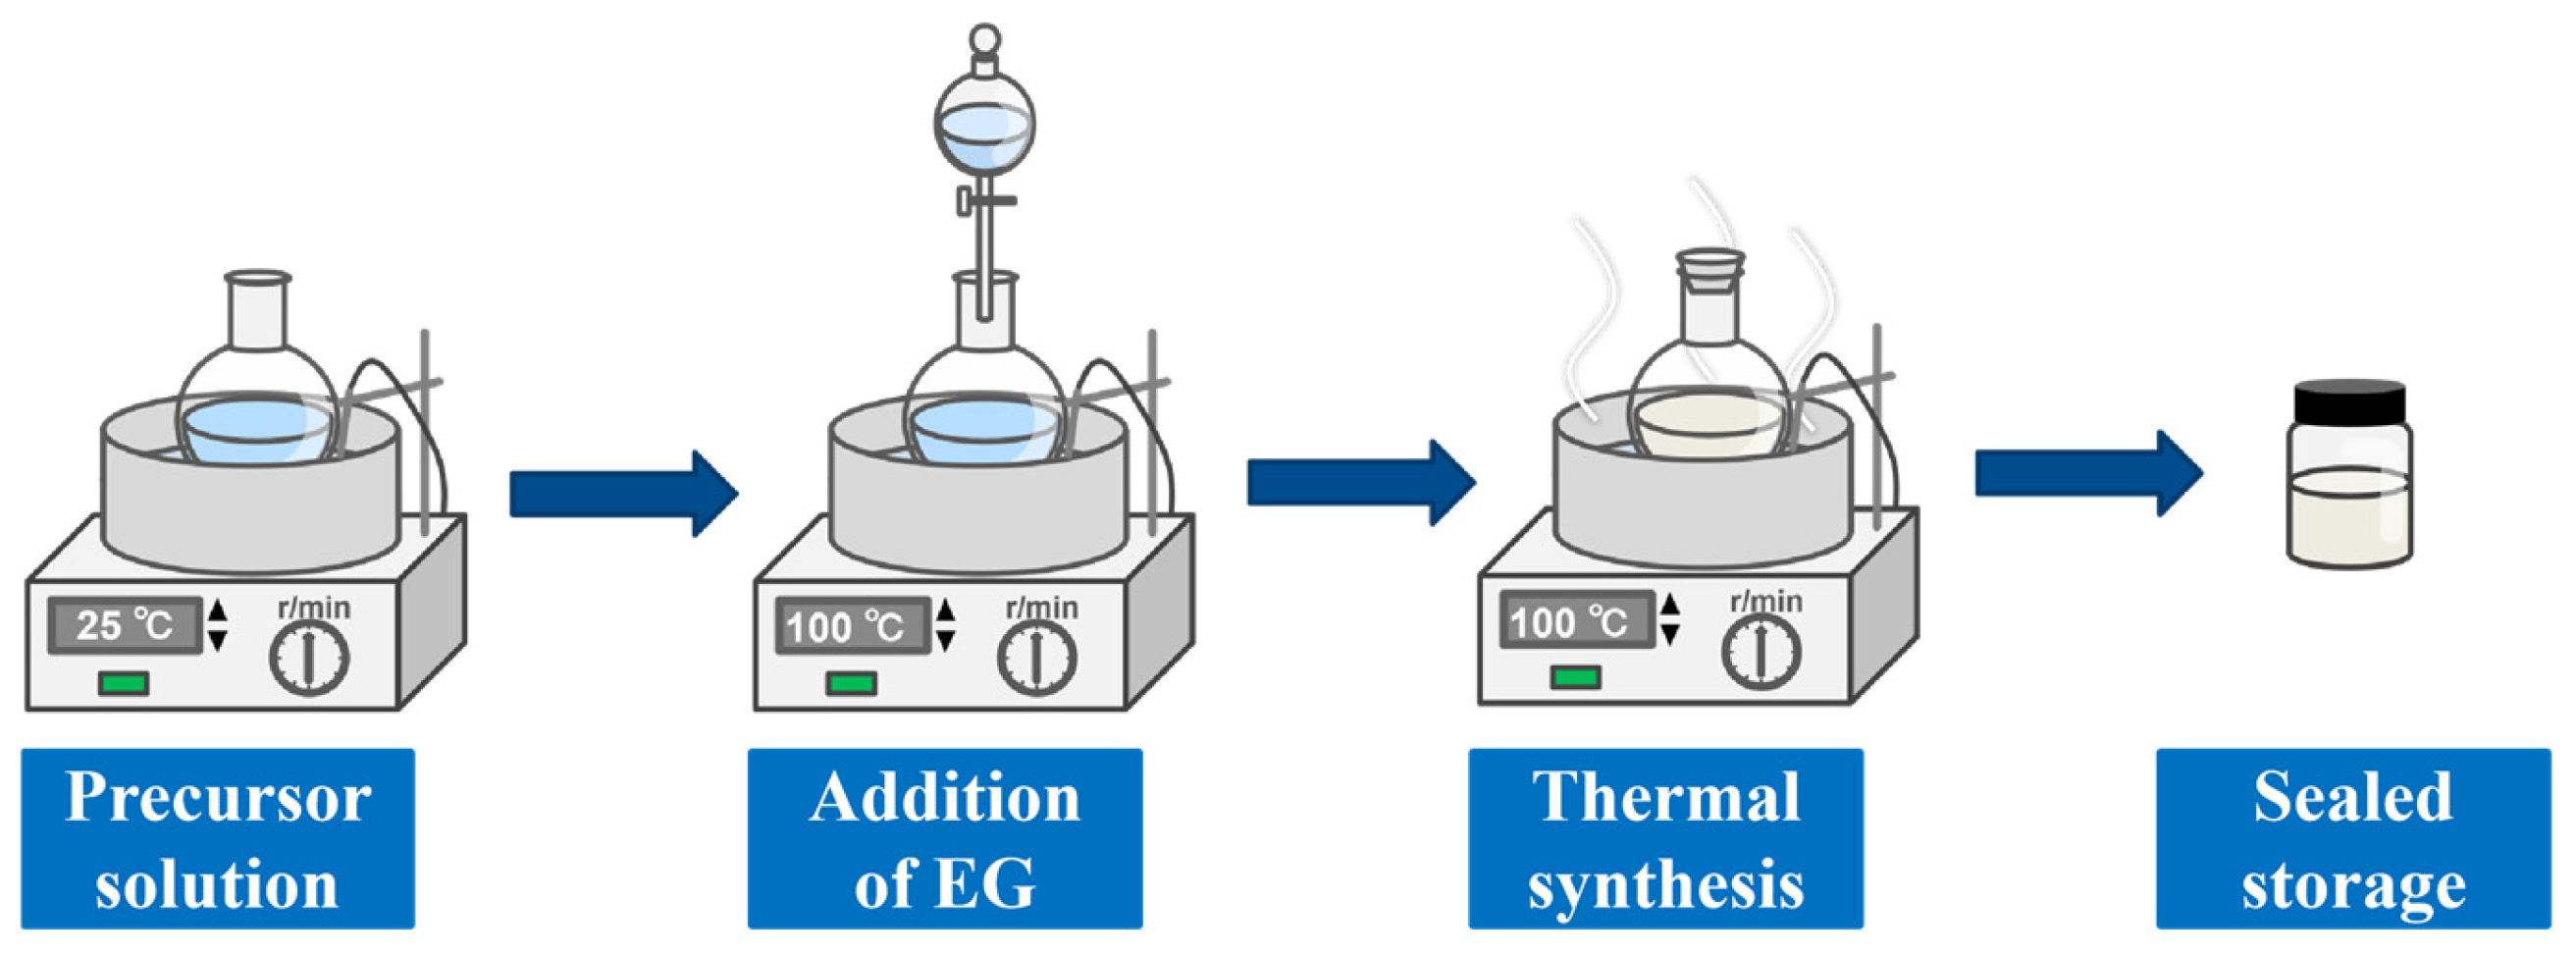
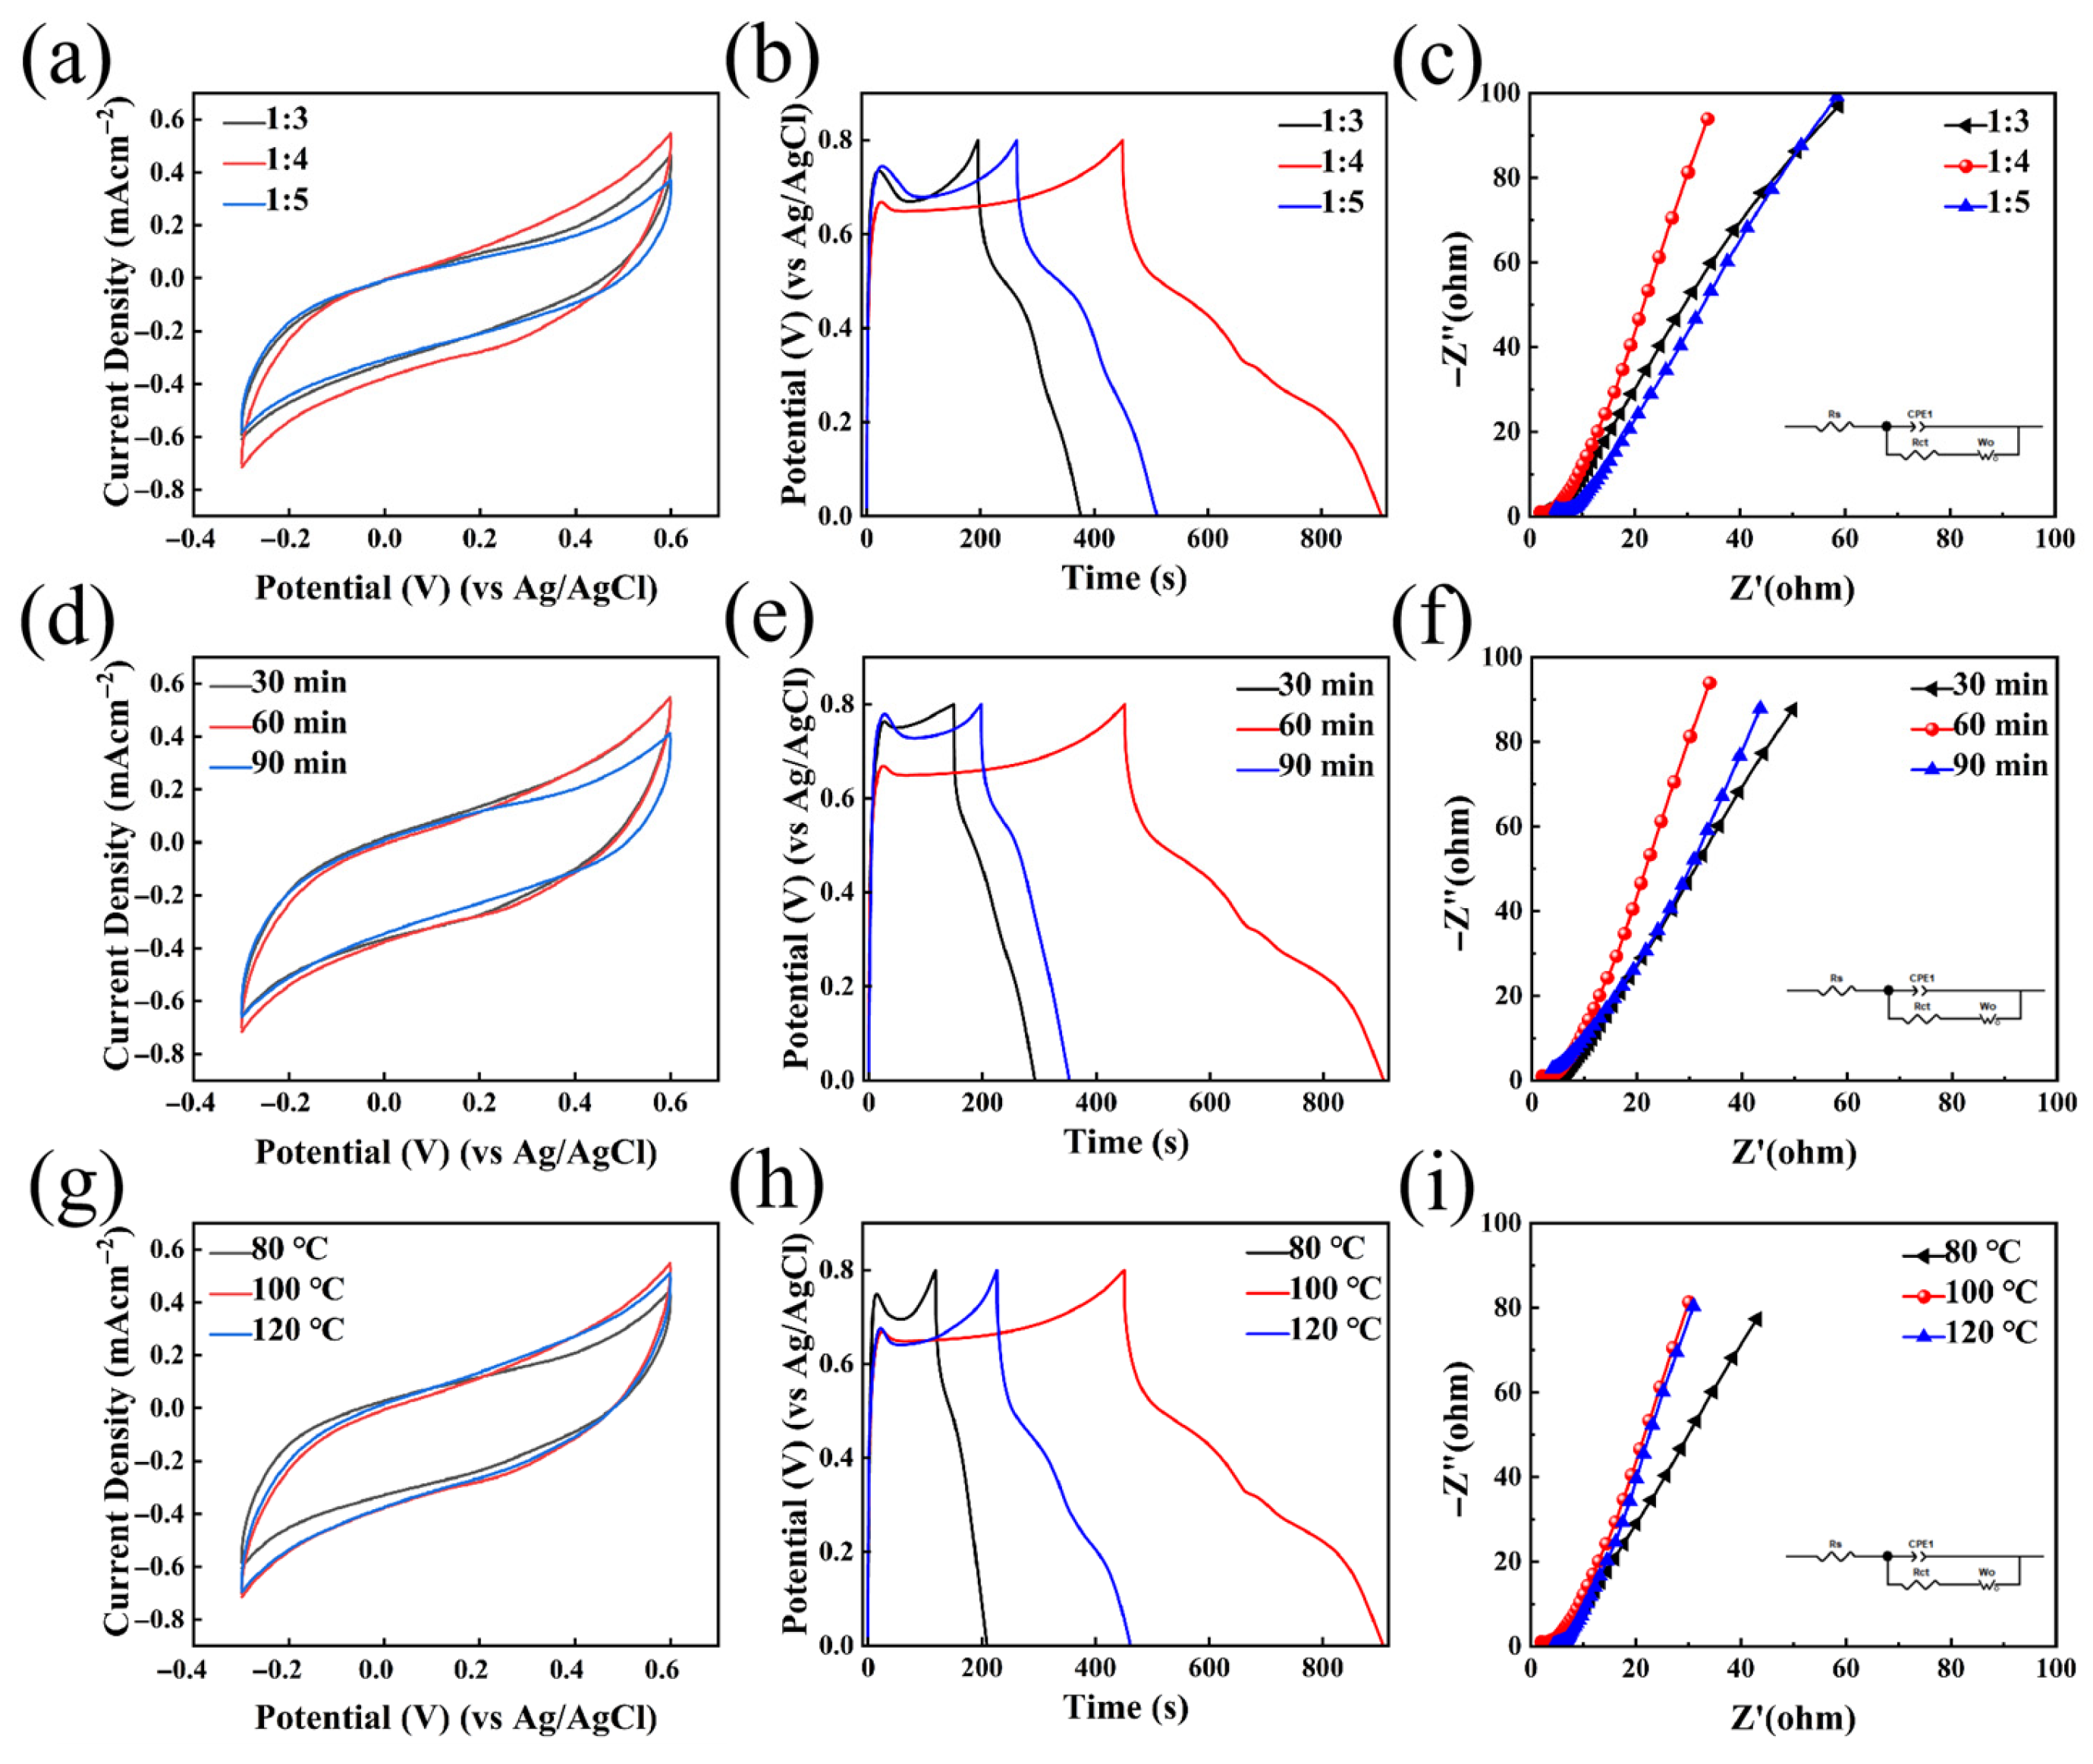
Figure 8 illustrates the electrochemical performance of the HDES synthesized under various conditions using a three-electrode system.
Figure 8a–c present the electrochemical results for samples with different molar ratios (1:3, 1:4, and 1:5).
Figure 8a compares the CV curves at a scan rate of 10 mV s
−1. It is observed that the 1:4 ratio yields the largest integrated area, indicating the highest specific capacitance.
Figure 8b compares the GCD curves at a current density of 1 mA cm
−2, where the 1:4 ratio exhibits the longest discharge duration. The EIS plots are shown in
Figure 8c, with the equivalent circuit model provided in the inset. In this model, R
s and R
ct represent the series resistance and charge transfer resistance, respectively, associated with the double-layer capacitance and Faradaic resistance. The fitting parameters are listed in
Table 1. The 1:4 ratio demonstrates the lowest impedance. The electrochemical performance of the HDES electrolyte is intrinsically governed by the molar ratio of the salt to the hydrogen bond donor (EG), which determines the delicate trade-off between physicochemical properties and the solvation environment. At the 1:3 ratio, the limited amount of EG is insufficient to fully dissociate the metal salts and disrupt the lattice energy, resulting in excessively high viscosity. This significantly hinders ion migration and mass transfer, leading to low ionic conductivity and large voltage hysteresis. Conversely, at the 1:5 ratio, the excess EG acts as a diluent. Although viscosity is reduced, the volumetric density of effective charge carriers (Zn
2+) decreases, and the redundancy of solvent molecules may disrupt the optimal compactness of the hydrogen bond network, thereby compromising charge transport efficiency. The 1:4 ratio represents the optimal equilibrium point. At this specific stoichiometry, the system achieves the highest ionic conductivity by balancing carrier concentration and mobility. Furthermore, spectroscopic evidence suggests that the hydrogen bond network and Zn
2+ solvation sheath are the most stable at this ratio, which minimizes the desolvation energy barrier and facilitates rapid interfacial kinetics, resulting in the maximum specific capacity and cycling stability observed.
Figure 8d–f display the electrochemical results for different synthesis durations (30, 60, and 90 min). As shown in the CV comparison (
Figure 8d) at 10 mV s
−1, the sample synthesized for 60 min possesses the maximum integrated area, reflecting the highest specific capacitance. Correspondingly, the GCD curves (
Figure 8e) at 1 mA cm
−2 show that the 60 min duration results in the longest discharge time. The EIS analysis (
Figure 8f) confirms that the 60 min sample achieves the minimum impedance. The fitting parameters are listed in
Table 1.
Figure 8g–i evaluate the influence of synthesis temperatures (80, 100, and 120 °C). At a scan rate of 10 mV s
−1 (
Figure 8g), the CV curve for the 100 °C sample shows the largest integrated area, signifying optimal capacitive performance. The GCD curves (
Figure 8h) at 1 mA cm
−2 further indicate that the 100 °C condition leads to the longest charging/discharging time. Consistent with these findings, the EIS results (
Figure 8i) show that the sample synthesized at 100 °C exhibits the lowest R
s and R
ct values. The fitting parameters are listed in
Table 1.
In summary, the comparative analysis demonstrates that the HDES synthesized with a 1:4 molar ratio at 100 °C for 60 min possesses the optimal electrochemical performance.
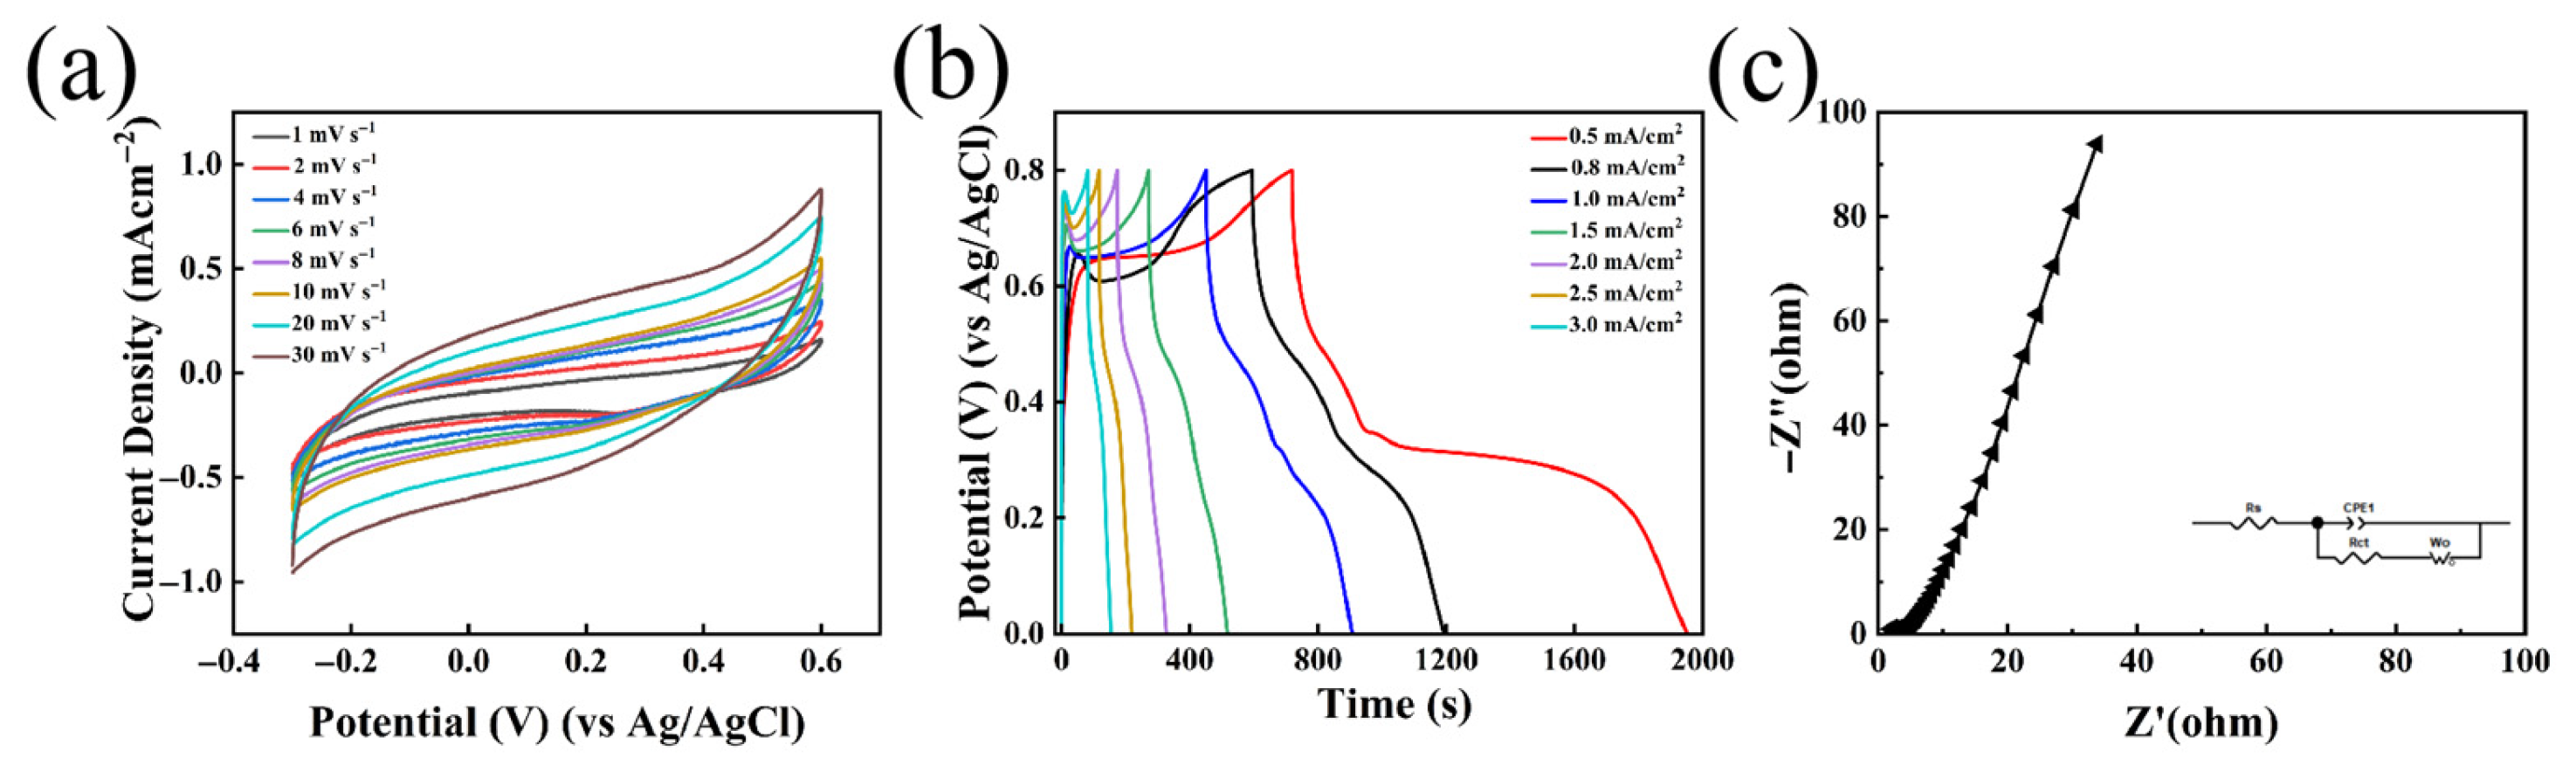
To further evaluate the electrochemical performance of the as-prepared HDES, electrochemical measurements were initially conducted using a standard three-electrode configuration.
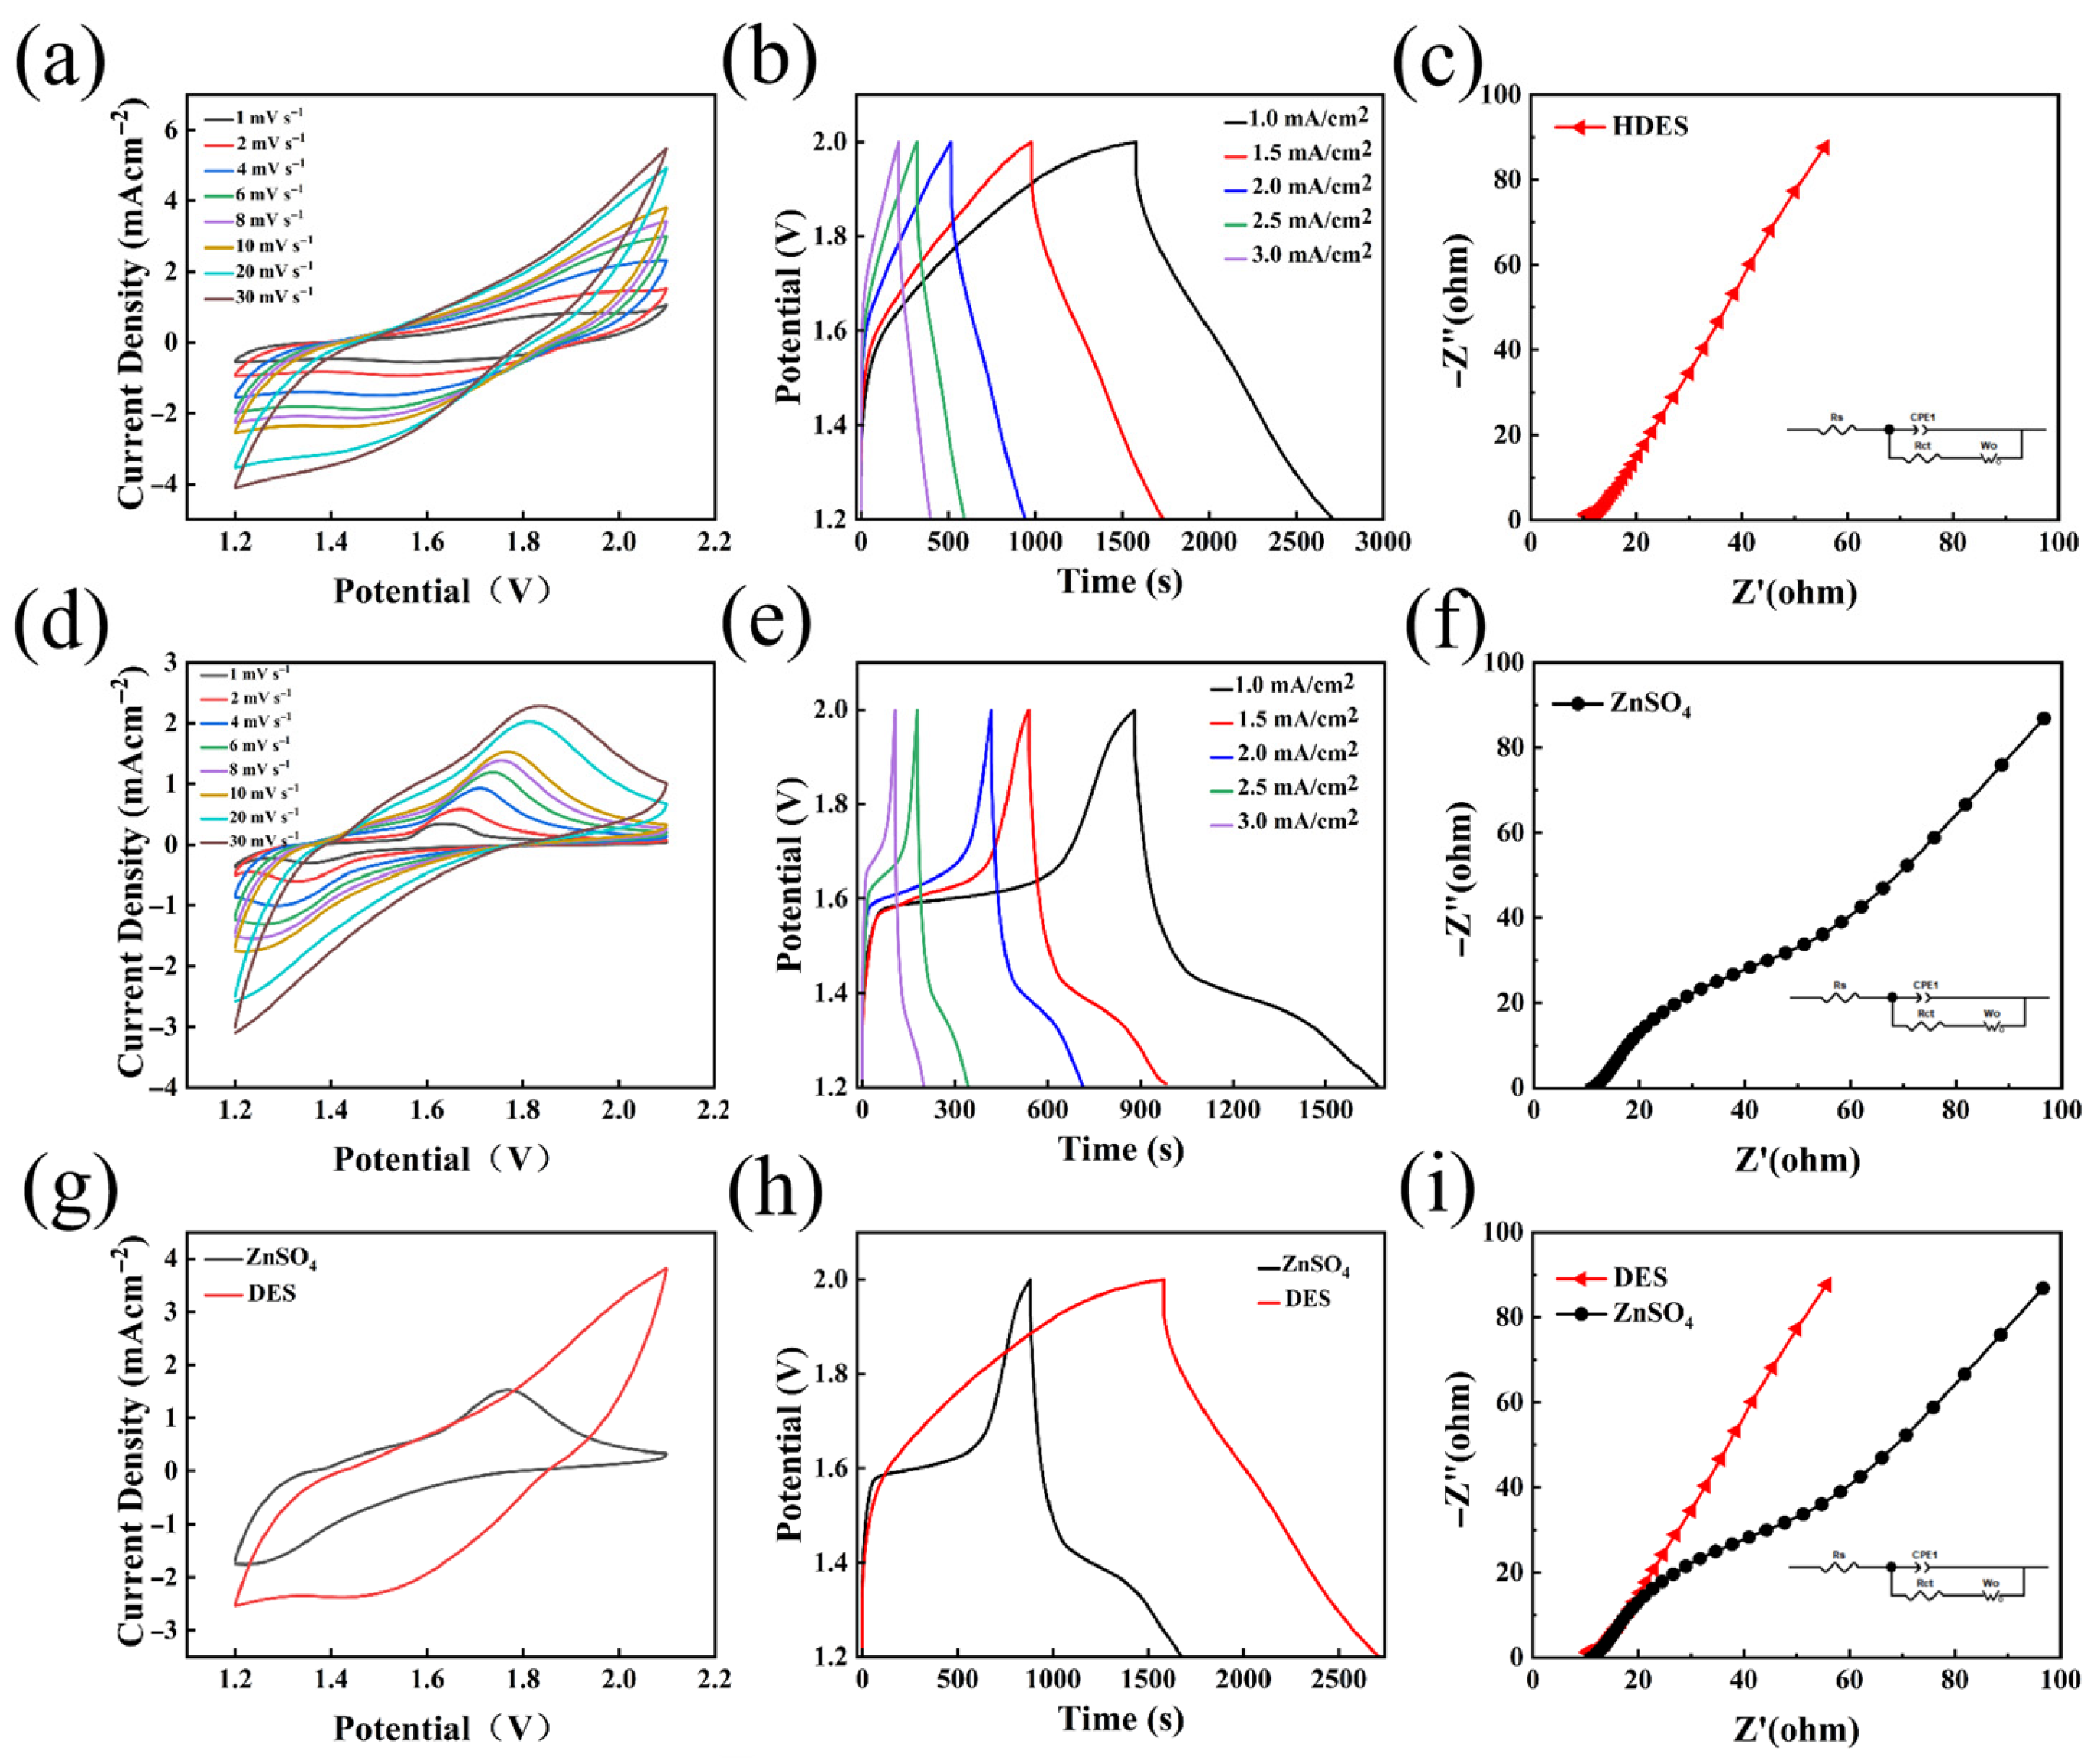
Figure 9a illustrates the CV curves of the HDES electrolyte at various scan rates ranging from 1 to 30 mV s
−1. It is evident that all CV curves maintain a consistent shape without significant distortion as the scan rate increases, demonstrating excellent charge storage capability and highly efficient high-rate electrochemical response [
46].
Figure 9b displays the GCD curves at current densities from 0.5 to 3 mA cm
−2. All GCD profiles exhibit a highly symmetric charge/discharge process with discharge times decreasing in near-linear proportionality to the current density, indicating favorable electrochemical performance. The EIS results are presented in
Figure 9c, with the equivalent circuit model provided in the inset. In this model, R
s and R
ct represent the series resistance and charge transfer resistance, respectively, which are associated with the double-layer capacitance and Faradaic resistance.
The viability of the HDES was further assessed by assembling asymmetric cells consisting of a Zn-Al LDH negative electrode and a MnO2 positive electrode. Parallel experiments were conducted by comparing the HDES-based system with a benchmark system employing a standard ZnSO4 electrolyte.
Figure 10a illustrates the CV curves of the HDES-based device at various scan rates from 1 to 30 mV s
−1. The CV profiles exhibit a well-defined quasi-rectangular or shuttle-like shape and maintain high morphological stability across all scan rates, indicating prominent pseudocapacitive characteristics. This suggests that the charge storage is primarily surface-controlled or near-surface-driven with minimal diffusion limitations. Even at a high scan rate of 30 mV s
−1, the absence of significant distortion reflects rapid Zn
2+ transport and reaction kinetics at the electrode interface, as well as low polarization, leading to superior rate capability. Furthermore, the smooth and highly symmetric redox profiles, devoid of sharp parasitic peaks, confirm the effective suppression of parasitic reactions such as the HER or byproduct formation [
46].
Figure 10b displays the GCD curves within a current density range of 1 to 3 mA cm
−2. All profiles exhibit regular triangular shapes with nearly identical charge and discharge slopes. This high degree of symmetry signifies excellent CE and electrochemical reversibility. The linear voltage–time relationship, characterized by the absence of distinct charge–discharge plateaus, is in excellent agreement with the CV results in
Figure 10a, further confirming that charge storage is governed by rapid surface kinetics rather than being diffusion-limited. Moreover, the negligible voltage drop at the transition from charging to discharging indicates a low internal resistance. The EIS results for the HDES device are shown in
Figure 10c. In the high-frequency region, the extremely small diameter of the semicircle reflects a minimal charge transfer resistance (R
ct). The fitting parameters are listed in
Table 2. The steep slope of the curve in the low-frequency region further indicates rapid Zn
2+ migration at the electrode/electrolyte interface with minimal resistance. This is attributed to the optimized coordination environment mentioned earlier, which facilitates the desolvation of Zn
2+ solvation shells for fast deposition. The inset provides the equivalent circuit model, where R
s and R
ct denote the series resistance and charge transfer resistance, respectively, while the constant phase element (CPE) and Faradaic resistance are also incorporated.
Figure 10d presents the CV curves for the device employing the aqueous ZnSO
4 electrolyte across scan rates from 1 to 30 mV s
−1. The profiles exhibit distinct redox peaks, signifying ion intercalation/deintercalation or phase transition reactions. Severe polarization is evident; as the scan rate increases from 1 to 30 mV s
−1, the oxidation peak shifts toward higher potentials (right), while the reduction peak shifts toward lower potentials (left), leading to a significant expansion of the peak potential separation. This behavior is likely attributed to the accumulation of byproducts (e.g., basic zinc sulfate) on the electrode surface or the formation of a corrosion layer induced by free water, both of which obstruct ion transport. Consequently, the polarization becomes more pronounced at elevated current densities.
Figure 10e displays the GCD curves within a current density range of 1 to 3 mA cm
−2. The GCD profiles are non-linear and exhibit well-defined voltage plateaus for both charging and discharging processes. As the current density increases, the charging plateau shifts upward, and the discharging plateau shifts downward, resulting in substantial voltage hysteresis (overpotential). Notably, at 3 mA cm
−2, the effective discharge time is drastically shortened, indicating that ion transport in the traditional aqueous electrolyte is significantly hindered, leading to severe polarization and rapid capacity fading at high rates. The EIS results for the ZnSO
4-based device are shown in
Figure 10f. A prominent semicircle with a large diameter is observed, signifying an extremely high charge transfer resistance. The fitting parameters are listed in
Table 2. This suggests that the charge transfer kinetics at the electrode interface are highly sluggish with substantial impedance, indicating that the overall reaction rate is governed by diffusion-limited processes. The inset provides the equivalent circuit model, where R
s and R
ct represent the series resistance and charge transfer resistance, respectively, associated with the double-layer capacitance and Faradaic resistance, typically incorporating a CPE.
Figure 10g compares the CV curves of the HDES-based and aqueous ZnSO
4-based devices at a scan rate of 10 mV s
−1, providing definitive evidence of the HDES electrolyte’s superiority. Compared to the conventional ZnSO
4 electrolyte, the HDES system exhibits a significantly larger integrated area, indicating a higher specific capacity. Furthermore, its characteristic quasi-rectangular profile reveals a transition in the charge storage mechanism toward surface-controlled pseudocapacitive behavior. This shift markedly enhances the reaction kinetics, effectively overcoming the issues of sluggish ion diffusion and severe polarization inherent in traditional aqueous electrolytes.
Figure 10h shows the GCD comparison at a current density of 1 mA cm
−2. The HDES system demonstrates a surface-controlled reaction characterized by a linear voltage–capacity relationship, which is highly conducive to high power output and prolonged cycle life. In contrast, the ZnSO
4 system follows a diffusion-controlled process with distinct discharge plateaus, leading to substantial performance degradation at high rates. Under identical testing conditions (1 mA cm
−2), the HDES-based device achieves a discharge duration of approximately 2700 s, significantly outperforming the aqueous system (1700 s). This enhanced capacity release is attributed to the optimized coordination environment of the HDES, which promotes the more efficient utilization of active sites.
Figure 10i presents the EIS comparison, which directly proves that the HDES electrolyte significantly lowers the interfacial reaction energy barrier by restructuring the Zn-ion coordination environment. The minimal charge transfer resistance observed in the HDES system, as opposed to the massive R
ct in ZnSO
4, indicates a substantial reduction in internal resistance. This ensures a minimal voltage drop and reduced thermal dissipation during high-current cycling, thereby elucidating the excellent triangular GCD symmetry and superior rate capability previously shown in
Figure 10b.
It is noteworthy that the electrochemical profiles of the Zn–MnO2 cells differ significantly between the two electrolytes, indicating a fundamental shift in the charge storage mechanism. In the aqueous ZnSO4 electrolyte, the CV curves display sharp redox peaks, and the GCD profiles show distinct voltage plateaus. These features correspond to a diffusion-controlled battery-type mechanism, dominated by the bulk intercalation/extraction of Zn2+/H+ ions and accompanied by phase transformations (e.g., the reversible formation of basic zinc sulfates). The significant peak separation observed reflects high polarization and sluggish kinetics due to the accumulation of resistive byproducts on the electrode surface. Conversely, in the HDES electrolyte, the CV curves exhibit a quasi-rectangular shape without sharp peaks, and the GCD profiles present a linear, triangular slope. These characteristics are indicative of surface-controlled pseudocapacitive behavior. The HDES electrolyte, with its unique solvation structure and reduced water activity, effectively suppresses the formation of insulating passivation layers, thereby maximizing the exposure of surface active sites. Consequently, the dominant storage mechanism transitions from slow bulk diffusion to fast surface Faradaic reactions. This pseudocapacitive mechanism minimizes structural strain during cycling and facilitates rapid ion transport, aligning with the observed superior rate capability and ultralong cycling stability.
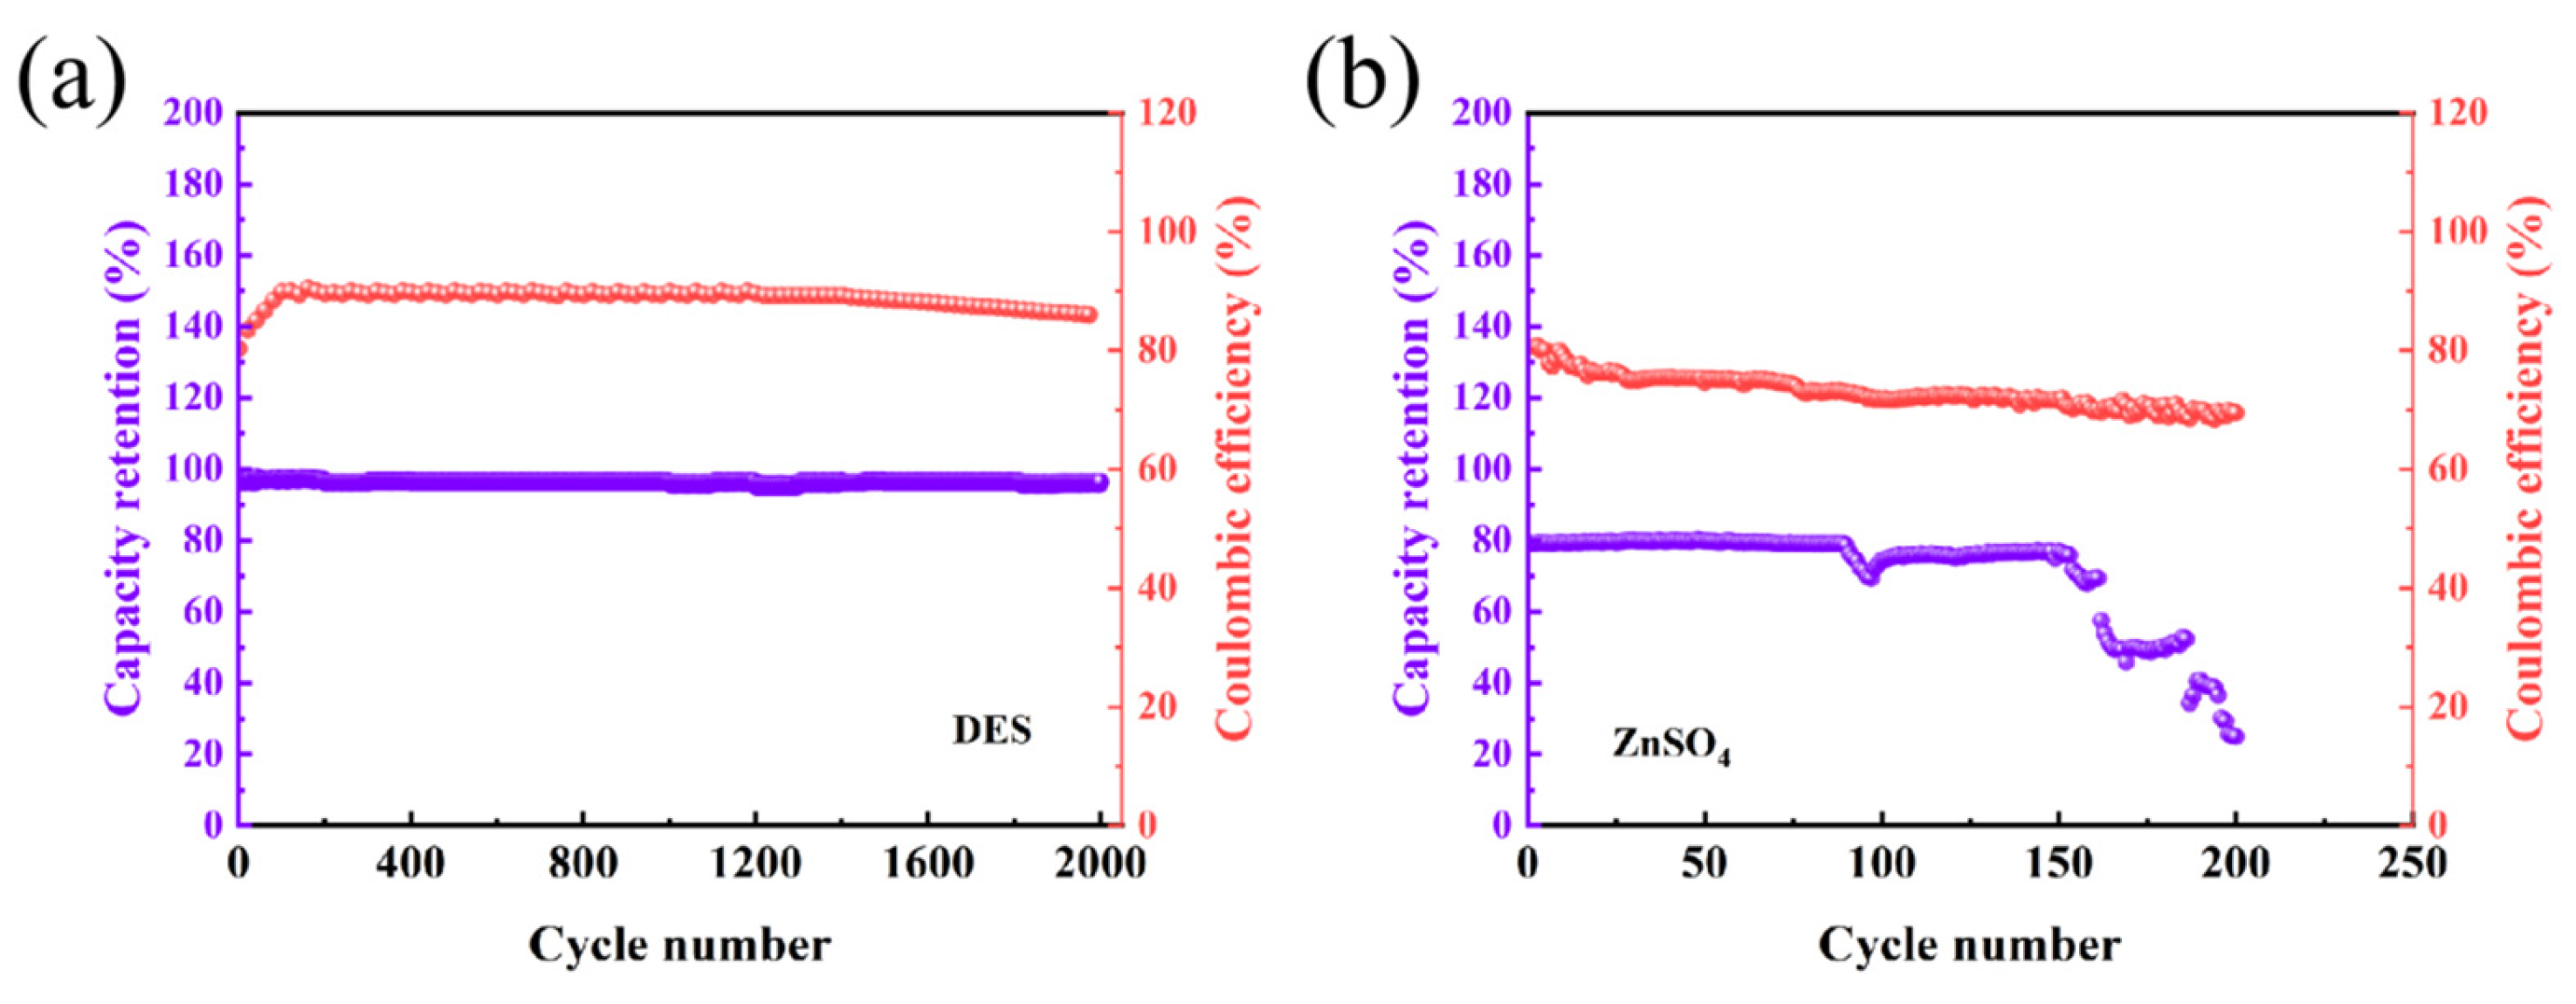
Figure 11a presents the capacity retention and CE curves of the HDES-based device at a current density of 3 mA cm
−2. Throughout the 2000-cycle test, the capacity retention consistently remains above 95%, indicating negligible capacity fading. This demonstrates the structural integrity of the electrode material and the homogeneous deposition of zinc. Following an initial activation phase, the CE rapidly stabilizes at a high level with minimal fluctuations, reflecting superior electrochemical reversibility. This confirms that the HDES electrolyte effectively suppresses parasitic side reactions, particularly the HER.
In contrast,
Figure 11b displays the corresponding results for the aqueous ZnSO
4 device. A gradual decline in capacity retention is observed within the first 90 cycles, followed by a sharp capacity plunge between the 90th and 100th cycles, typically attributed to dendrite-induced micro-short circuits or the accumulation of insulating byproducts. By the 150th cycle, the capacity collapses to below 40% with severe oscillations, signaling total cell failure. Furthermore, the CE shows a continuous downward trend and intense fluctuations after 150 cycles, indicating the sustained consumption of the electrolyte and active zinc through irreversible side reactions.
It is noted that the CE of the full cells presents a distinct difference between the two systems. In the aqueous ZnSO
4 electrolyte, the CE fluctuates at a low level (<80%), which is primarily attributed to the severe dissolution of the MnO
2 cathode (loss of active mass) and the HER on the Zn anode. The continuous consumption of electrolyte and active species leads to the observed rapid capacity decay. In contrast, the HDES electrolyte enables a significantly higher and more stable CE (90%). While the CE is not yet 100% due to the intrinsic irreversibility of Mn-based intercalation chemistry and minor side reactions, the substantial improvement over the aqueous system serves as robust evidence for the electrolyte’s efficacy. The HDES constructs a water-deficient environment that effectively suppresses Mn dissolution and the HER, thereby securing the integrity of the interface and supporting the ultralong lifespan of over 2000 cycles. The cycling performance and capacity retention of other zinc-ion batteries are compared and presented in
Table 3.
The comparison of
Figure 11a,b validates that the EG in the HDES forms a complex deep eutectic coordination structure with ZnSO
4 and MnSO
4, where water molecules are strongly sequestered within a robust hydrogen bonding network. The restricted water activity effectively eliminates the possibility of the HER. Without the coverage of passivating byproducts, the electrode surface remains electrochemically active, thereby preserving a zincophilic interface. Moreover, the reconfigured solvation shell in the HDES promotes a transition from disordered to ordered Zn
2+ deposition, fundamentally mitigating the risk of dendrite growth and subsequent short circuits.