Article

Comparison Between Ultrasonic and Thermal Exfoliation for Molybdenum Disulfide Nanoparticles—A Multifunctional Study


1
Department of Biomedical Engineering, National Yang-Ming Chiao Tung University, Taipei 112304, Taiwan
2
Department of Radiation Oncology, Taoyuan General Hospital, Ministry of Health and Welfare, Taoyuan City 330, Taiwan
3
Institute of Physics, Academia Sinica, Taipei 115201, Taiwan
*
Authors to whom correspondence should be addressed.
Nanomaterials 2026, 16(17), 1058; https://doi.org/10.3390/nano16171058
Submission received: 3 July 2026 / Revised: 16 August 2026 / Accepted: 22 August 2026 / Published: 25 August 2026

Abstract

The transition metal dichalcogenides (MX2, TMD) are a family of two-dimensional compounds, and MoS2 is perhaps the most representative material among them. MoS2, in its bulk form, is semiconductive, with an indirect band gap of around 1.2–1.3 eV. Monolayer MoS2, nevertheless, exhibits a direct band gap of 1.8–1.9 eV. For zero-dimensional MoS2 (quantum dots), the band gap would be even wider. These changes are mainly due to quantized energy levels arising from geometric confinement. Quantum effects directly yield distinct optoelectronic properties, such as photoluminescence, which are absent in the material’s bulk form. In this study, we developed an economical, scalable one-pot synthesis of MoS2 nanoparticles at atmospheric pressure, eliminating the need for high-pressure autoclaves commonly employed in hydrothermal synthesis at around 150–270 °C. This one-pot synthesis was tested by two exfoliation methods—ultrasonication and thermal heating at 80 °C in three solvents: ethanol, deionized water, and N-methyl-2-pyrrolidone. Our focus is on the empirical study of nanoparticles’ photoluminescence and photothermal effects. The material characterization includes transmission electron microscopy for morphology and crystal structure, X-ray photoelectron spectroscopy for chemical bonding energies, and a UV–visible–NIR spectrometer for optical absorption. Photoluminescent spectroscopy of the nanoparticles was assessed using laser excitation between 300 and 400 nm, and photothermal effects were measured as temperature variations in DI water under continuous irradiation by an 808 nm laser. Results show that MoS2 nanoparticles synthesized in ethanol exhibit an additional broad optical absorption in the red–infrared range, in addition to the usual high absorption in the UV–blue range. This photothermal absorption would raise the temperature of DI water to 50 °C in 300 s. A simplified numerical analysis by finite elements was also carried out as a numerical confirmation of the photothermal test. On the cell biological side, both in vitro cultures with NIH/3T3 fibroblasts and antibacterial against E. coli show that critical tolerance of MoS2 is no more than 0.25 mg/mL in the media.

1. Introduction

Molybdenum disulfide (MoS2) belongs to the class of transition metal dichalcogenides with a silvery black appearance [1,2]. Bulk MoS2 is a semiconducting material with an indirect band gap of approximately 1.2 eV. It has been considered for photovoltaic and photocatalytic applications due to its strong absorption in the solar spectrum [3,4,5,6]. When the bulk size is reduced to a two-dimensional layer with a thickness of around 0.65–0.75 nanometers [7,8], geometric confinement would make quantum effects (discrete energy levels) more pronounced, thereby significantly affecting the optoelectronic properties of MoS2. More specifically, the widened band gap in two-dimensional layers leads to higher photon–electron exchange energies and greater potential for electron-hole separation [9,10,11]. One corresponding phenomenon of these changes is photoluminescence, which has been observed in MoS2 films, nanoplates, and nanotubes [12,13,14].
The zero-dimensional MoS2 nanoparticles remain semiconductive, but quantum effects are expected to be even more pronounced [15,16,17]. However, changes in band structures could further induce additional optical absorption in the near-infrared range. This absorption can also excite electrons and initiate photothermal processes, in which excited electrons transfer their energy to the lattice, creating additional lattice vibrations (phonons). Phonons usually release energy non-radiatively, for example, as heat. Heat can enhance materials’ chemical (e.g., catalytic) activities or other physical effects (diffusion, thermal deformation, phase transitions, etc.) [18,19,20].
The photoelectronic interactions and photothermal effects in nanoparticles have numerous applications. For example, energy is harvested in solar cells [21,22], optical sensing and imaging [23,24], spectroscopy [25], industrial heating [26,27], photocatalytic reactions [28], antibacterial applications [29,30,31], and photothermal diagnosis/therapy for cancer [31,32,33]. In this study, we focus on evaluating the photocatalytic and photothermal effects of synthesized MoS2 nanoparticles.
There are two categories of MoS2 nanoparticle production. Both top-down and bottom-up approaches are presently available. For example, mechanical and chemical exfoliation, electrochemical lysis, emulsion, solvent–thermal, thermal ablation, and combined methods have been studied [13,34,35]. A common problem across all these approaches is low production yields and the need for relatively high temperatures (150–270 °C) in autoclaves [13,35,36]. Low yield can be affected by many factors, such as solvent concentration, temperature, processing time, and the power of external sources (electrical or mechanical) [14,37,38].
Besides production, collecting nanoparticles with sufficiently fine filters can hinder upscaling production [37,38,39]. Storing nanoparticles in colloids or suspension form is a common practice [40]. But this storage could limit their applications in solid-state devices. Note that MoS2 nanoparticles are much heavier than their counterparts, carbon QDs, so upscaling industrial production is more challenging [40,41].
The synthesis of MoS2 nanoparticles in solvents is relatively simple and environmentally friendly [42,43,44]. MoS2 powder is first dispersed in solvents such as N-Methyl-2-pyrrolidone (NMP), ethanol (EtOH), and deionized water (DIW) [45]. Then, using either ultrasonic or thermal exfoliation, the MoS2 nanoparticles can be produced.
The selection of these three solvents is based on their relatively high solubility of MoS2 (ethanol: 1–5 mg/mL; NMP: 20–40 mg/mL) [46,47,48,49,50], and DI water (0.14–0.8 g/mL) [51,52,53] is mainly used as a base for comparison. Note that solubility is not a simple physical property and involves a variety of other molecular/surface properties, such as polarity or surface tension. From the fabrication viewpoint, however, solubility is a key factor at the outset of the whole process.
In this study, we developed a cost-effective, one-pot synthesis for MoS2 nanoparticles under atmospheric pressure. Two methods were used: ultrasonication and thermal exfoliation at 80 °C to synthesize MoS2 nanoparticles in the three solvents mentioned above. For material characterization, the particle size and morphology of these particles were examined by transmission electron microscopy (TEM); the chemical bonding energy of Mo and S was analyzed by X-ray photoelectron spectroscopy (XPS), and optical absorption and photoluminescence (PL) were detected by UV–visible–IR and PL spectrometer. These two tests also provide measures for the band gaps and optoelectronic energy conversion under irradiation. The photothermal effects of these particles was measured by a customized photothermal system. Lastly, the biotoxicity of nanoparticles in culture media was assessed by an in vitro cell culture of NIH/3T3 fibroblast cells for potential clinical thermal therapies. In addition, the chemical potency of nanoparticles can be antibacterial; therefore, an in vitro test against E. coli was investigated. These results could inform further research into the more efficient manufacture of MoS2 nanoparticles with multipurpose functions.

2. Materials and Methods

2.1. Synthesis

Commercially purchased MoS2 powders (approximately 100–150 μm, purity > 98%, ACROS Organics, Pittsburgh, PA, USA) were dispersed in solvents by either ice-bath ultrasonic exfoliation (UE) or solvent–thermal exfoliation (TE) for further processing.
Three solvents were chosen in this study based on their solubility and dispersibility: ethanol (EtOH, 99.99%, ECHO Chemical Co., LTD., Toufen City, Taiwan), deionized water (DIW), and N-methyl-2-pyrrolidone (NMP, ≤99.7%, Fisher Scientific, Loughborough, UK) [45]. Note that dispersibility is mainly due to the weaker intermolecular forces of liquids, such as hydrogen bonds or van der Waals forces, which allow solid particles to be accommodated or move freely to form a suspension if particles are sufficiently small.
The fabrication process is stated as follows. (1) A volume of 20 mL of each solvent was used to disperse MoS2 powders (200 mg) via either ultrasonic exfoliation (UE) or thermal exfoliation (TE, 16 h). (2) For ultrasonic exfoliation, the MoS2 mixed solution was treated by a sonicator (UC-08A, 40 kHz, 60 W, BIOBASE, Jinan, Shandong, China) for 16 h. (3) For thermal exfoliation, the MoS2 mixed solution was heated in a nitrogen environment (500 mL/min, around 80 °C) for 16 h with a system of a heat source (550 W) and a condenser.
After exfoliation, we carried out a two-step purification process. First, the solutions were thoroughly mixed with ethanol (95% purity) or deionized (DI) water sequentially in a volumetric ratio of 2:3, then centrifuged at 10,000 rpm for 15 min separately to remove the solvent and large-sized MoS2 particles. This liquid-extraction process was repeated twice.
After liquid extraction, the supernatant was abstracted and heated at 50 °C for at least 24 h. This low-temperature drying allows evaporation of the volatile solvent but avoids oxidation of the samples.
After the two-step purification, the final product was resuspended in water. Table 1 shows the experimental design of solvents and the dispersion method.

2.2. Transmission Electron Microscopy (TEM)

The images and morphology of MoS2 nanoparticles were examined by transmission electron microscopy (TEM, JEM-2000EX II, JEOL, Tokyo, Japan). The operation was conducted at an accelerating voltage of 60 kV. Samples for TEM studies were prepared by drop-casting onto standard lacy carbon TEM (Cu) grids (01800-F, PELCO®, Ted Pella Inc., Redding, CA, USA). The particle size was analyzed by ImageJ® 1.54i in TEM images (n ≥ 30).

2.3. X-Ray Diffraction (XRD)

The crystal structure of MoS2 nanoparticles was analyzed by an X-ray diffraction meter (XRD; PANalytical X’Pert Pro, Malvern Panalytical, Malvern, Worcestershire, UK) with a Cu-Kα radiation source (λ = 1.54425 Å) at an incident angle of 0.5°. The scanning range (2θ) was from 10° to 90°, with a step size of 0.06° and 2 s per step.
The crystal size (d) of MoS2 nanoparticles can be calculated using Scherrer’s formula, i.e.,
d = k λ β cos θ ,
where k is the shape factor (0.9), λ is the wavelength of X-rays (1.5425 Å), θ is the scattering angle of the crystal plane, and β is the full width at half maximum (FWHM) of the peak. The numerical analysis was carried out using Highscore Plus (Version 3.0.5, Malvern Panalytical, Malvern, Worcestershire, UK) using the Gaussian function. Relevant PDF cards for MoS2 from the database are PDF#03-065-0160 (PDF-2 2004, The International Center for Diffraction Data, Newtown Square, PA, USA).

2.4. Zeta Potential

The dispersion stability of MoS2 nanoparticles in different solvents is measured by zeta potential (Zetasizer Nano, ZS90, Malvern, Worcestershire, UK) to assess the magnitude of electrostatic interactions (repulsion or attraction) between charged particles. This measure indicates the difference in electrical potential between the surface of a solid particle and the surrounding liquid (the slipping plane). Usually, a higher absolute zeta potential (around 30 mV) indicates stronger electrostatic repulsion between particles, resulting in a stable dispersion by inhibiting particle aggregation.

2.5. X-Ray Photoelectron Spectroscopy (XPS)

The chemical binding energy of synthesized MoS2 nanoparticles was examined by an X-ray photoelectron spectrometer (XPS, PHI 5000 VersaProbe III, ULVAC-PHI Inc., Chigasaki, Kanagawa, Japan). The energy of the X-ray beam can cause electrons from 1 to 10 nm underneath the surface to escape, which gives a direct measurement of the binding energy of the emitted electrons in the following expression:
E b i n d i n g = h ν ( E K . E . + φ )
where Ebinding is the binding energy of electrons, is the energy of the X-ray, EK.E. is the kinetic energy of the electron, and φ is the work function of the nanoparticle’s surface. The binding energy can be used to determine the types of chemical bonds and, thus, the material’s composition. The system operating conditions were set by the manufacturer as follows: chamber vacuumed to 6.7 × 10⁻⁸ Pa, 24.5 W power, 15 kV voltage, step size of 0.1 eV, and pass energy of 55 eV. The spectrum was numerically deconvoluted using a Gaussian function in Fityk 1.3.1.

2.6. UV–Visible–NIR Spectroscopy

The optical absorption of the MoS2 suspension was measured using UV–visible–NIR spectroscopy (Biochrom Ultrospec 9000pc, Fisher Scientific, Arendalsvägen, Göteborg, Sweden). The optical absorption range was set to 300–800 nm. The absorption was evaluated based on the Beer–Lambert law:
I T = I 0 e ε l c
where IT and I0 are the intensities of the transmitted and incident laser light, ε is the molar attenuation coefficient (absorptivity) of the attenuating species, l is the optical path length, and c is the concentration of the attenuating species. The optical absorption (A) is defined as
A = ε l c = ln I T I 0 = ( l n 10 ) l o g 10 ( I T I 0 )
where log10 is used experimentally for A instead of the natural log; note that the attenuation of incident light is assumed to be absorption only in the homogeneous solution (MoS2 nanoparticle suspension).

2.7. Photoluminescence (PL)

The photoluminescence (PL) spectrum of MoS2 nanoparticles was measured with a multimode microplate reader (SPARK®, TECAN, Männedorf, Switzerland). The excitation laser light source ranged from 300 nm to 400 nm, with a resolution of 10 nm. To avoid overlap between the excitation and emission signals, a 45 nm blue shift in the emission was preset and recorded by the system.

2.8. Photothermal Test

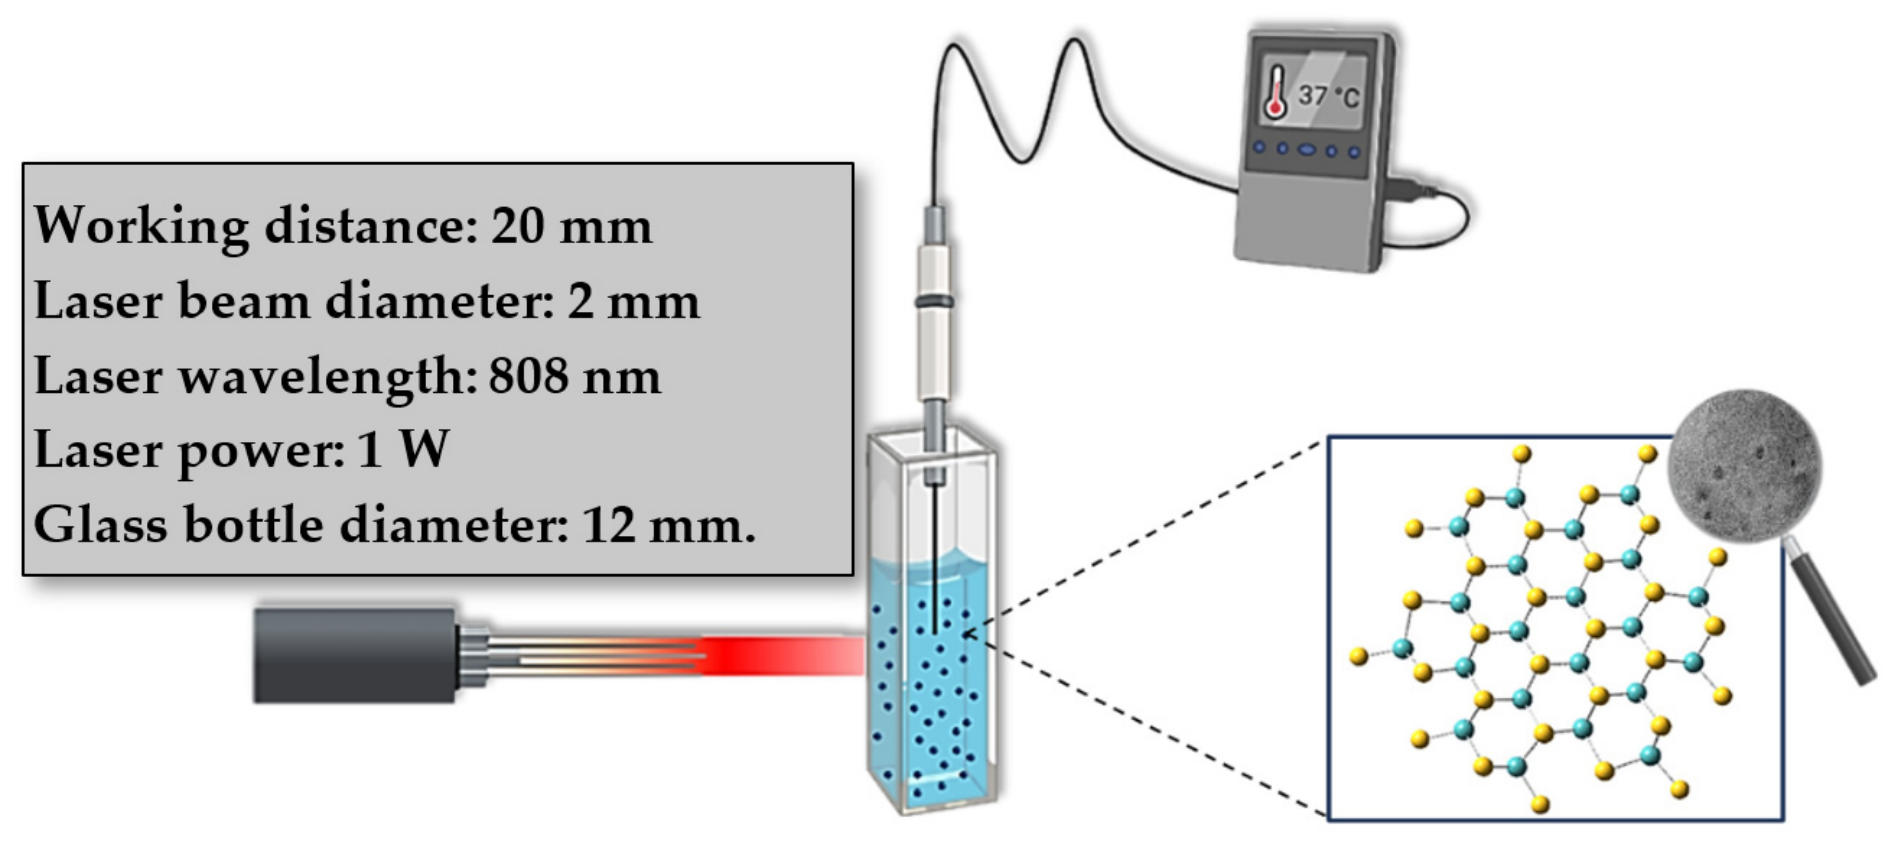
The setup for the photothermal measurement is schematically shown in Figure 1, where an 808 nm near-infrared (NIR) light-emitting diode (LED) laser (KO-LD 808 nm 1 W, Koodyz Technology Co., Ltd., New Taipei City, Taiwan) directly irradiates MoS2 nanoparticles in DI water at a distance of 20 mm. The sample was stored in a glass bottle, and the test was conducted in a 3D-printed black enclosure to minimize external optical interference. The temperature was recorded by a digital thermometer (600 V CAT III, Fluke Corporation, Everett, WA, USA) every 15 s. The specific near-infrared laser (808 nm) was selected for its high transmission through human skin and its broad range of therapeutic benefits, including reduced inflammation, pain relief, increased local metabolite release, and increased blood flow [54,55,56,57,58,59].

2.9. In Vitro Biocompatibility

NIH/3T3 fibroblast cells (CRL-1658 ™, American Type Culture Collection, ATCC, Manassas, VA, USA) were chosen to test the toxicity of MoS2 nanoparticles in culture media. Cells were seeded in a 96-well tissue-culture plate at a density of 1 × 10⁴ cells per well in a culture medium (Dulbecco’s Modified Eagle Medium (DMEM), Tibco, Palo Alto, CA, USA). The incubator (Thermo Forma 310, Thermo Fisher Scientific, Waltham, MA, USA) was set to 37 °C, 95% humidity, and a 5% CO2 flow. Before cell culture, MoS2 nanoparticles were sterilized by UV light for 30 min to avoid contamination.
Five different concentrations of MoS2 nanoparticles (5 mg/mL in phosphate-buffered saline (PBS); final concentrations: 0, 0.5, 0.25, 0.125, and 0.0625 mg/mL) were added to the culture medium to test the in vitro toxicity. Note that PBS in the control group (0 mg/mL) is used to account for the solvent effects in the culture medium. Cell viability was assessed at 24 and 72 h after seeding using a 3-(4,5-dimethylthiazol-2-yl)-2,5-diphenyltetrazolium bromide (MTT) assay. The MTT assay was measured using a multimode microplate reader (SPARK®, TECAN, Switzerland) at 560 nm. The viability of NIH/3T3 fibroblast cells was calculated (n = 6) based upon the untreated (zero MoS2 nanoparticles, the control group) cells as follows:
R e l a t i v e   C e l l   v i a b i l i t y % = A v e r a g e   o f   I n t e n s i t y   o f   T e s t i n g   G r o u p A v e r a g e   o f   I n t e n s i t y   o f   C o n t r o l   G r o u p

2.10. Antibacterial Test

The antibacterial assay followed ASTM E2149-20. Escherichia coli (E. coli, ATCC 11303™, American Type Culture Collection, ATCC, VA, USA) was used to test the antibacterial activity of MoS2 nanoparticles in nutrient broth (DIFCO™ Nutrient broth, Becton, Dickinson and Company, Franklin Lakes, NJ, USA). The concentrations of MoS2 nanoparticles were set at 0, 0.25, 0.125, and 0.0625 mg/mL for the test. Two extra groups were added for comparison. The control (negative) group is the culture with E. coli only, and the positive control is the one with penicillin–streptomycin solution (100 IU/mL, Biorion Inc., New Taipei City, Taiwan).
All MoS2 nanoparticle suspensions were irradiated by UV light for 30 min to avoid contamination before culture.
Active bacteria were first diluted in sterile nutrient broth (3 g beef extract and 5 g peptone) to an optical absorbance of 0.30 at 475 nm (~1.5–3.0 × 10⁸ CFU/mL), which served as the seed. Then, this seed was further diluted 100-fold in sterile nutrient broth before culture. During culture, a multimode microplate reader (SPARK®, TECAN, Switzerland) was used to assess the density of E. coli by measuring the medium’s optical absorbance at 600 nm (OD600).
After a 24 h incubation period, the colony-forming unit (CFU) method was used to quantify E. coli activity. The CFU method involves (i) a series of dilutions to ensure isolated, countable colonies on plates and (ii) standard agar plates to carry spread dilutions, as well as incubation for 16 h at 37 °C.
The colony count uses the following formula:
C F U / m L = n u m b e r   o f   c o l o n i e s V o l u m e   o f   P l a t e   ( m L )   ×   d i l u t i o n   f a c t o r
The dilution factor is the ratio of the final volume to the initial volume of the aliquot during a dilution.

2.11. Numerical Simulation

The numerical simulation for the photothermal test was carried out by the finite element method using Elmer version 9.0 [60]. Details of the geometric model, boundary conditions, and numerical algorithms are discussed later in the Supplementary Materials.

3. Results

3.1. Yield of Synthesis

The synthesis yields of MoS2 nanoparticles achieved by different methods are presented in Table 2. Note that the MoS2 weight is based on its dry mass. Ethanol (EtOH) yielded the highest yield of 15% among the three solvents, particularly in the solvent–thermal exfoliation (TE). This can be attributed to the high solubility of MoS2 in ethanol (approximately 0.1–5 mg/mL) compared to the other two solvents, which enables a higher exfoliation rate [50].

3.2. Characterization

3.2.1. Morphology and Particle Size

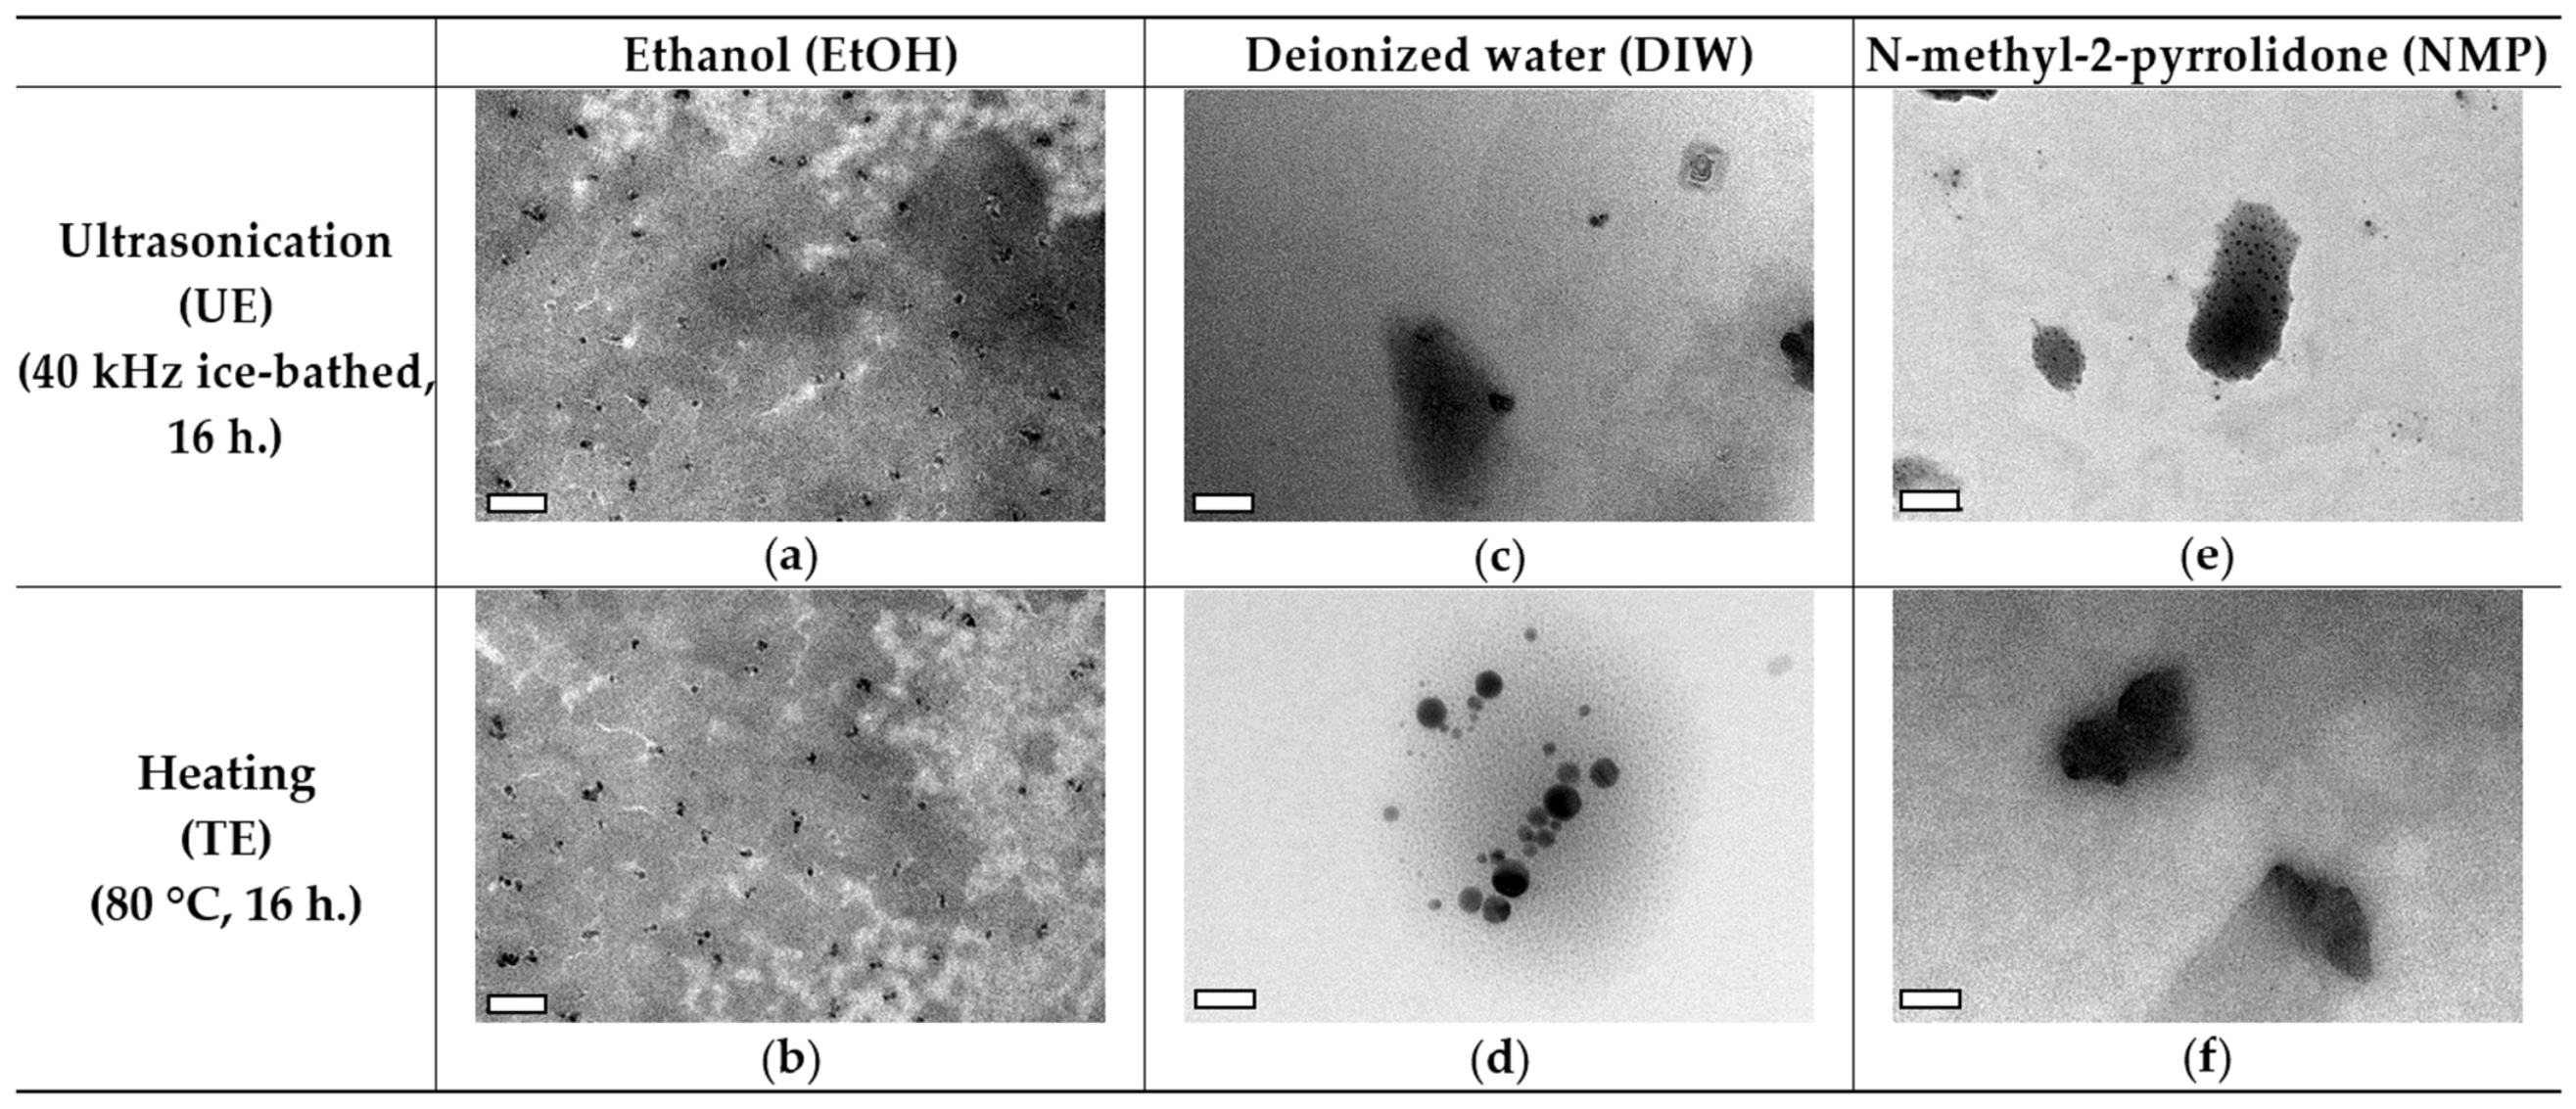
The morphology and diffraction pattern of MoS2 nanoparticles from TEM are shown in Figure 2, where MoS2 nanoparticles are visible as black dots. Only the ethanol (EtOH) (a) and (b) synthesized nanoparticles show some blurred rings, which may indicate the presence of small crystallites. The crystal structure is further examined by XRD in the next section.
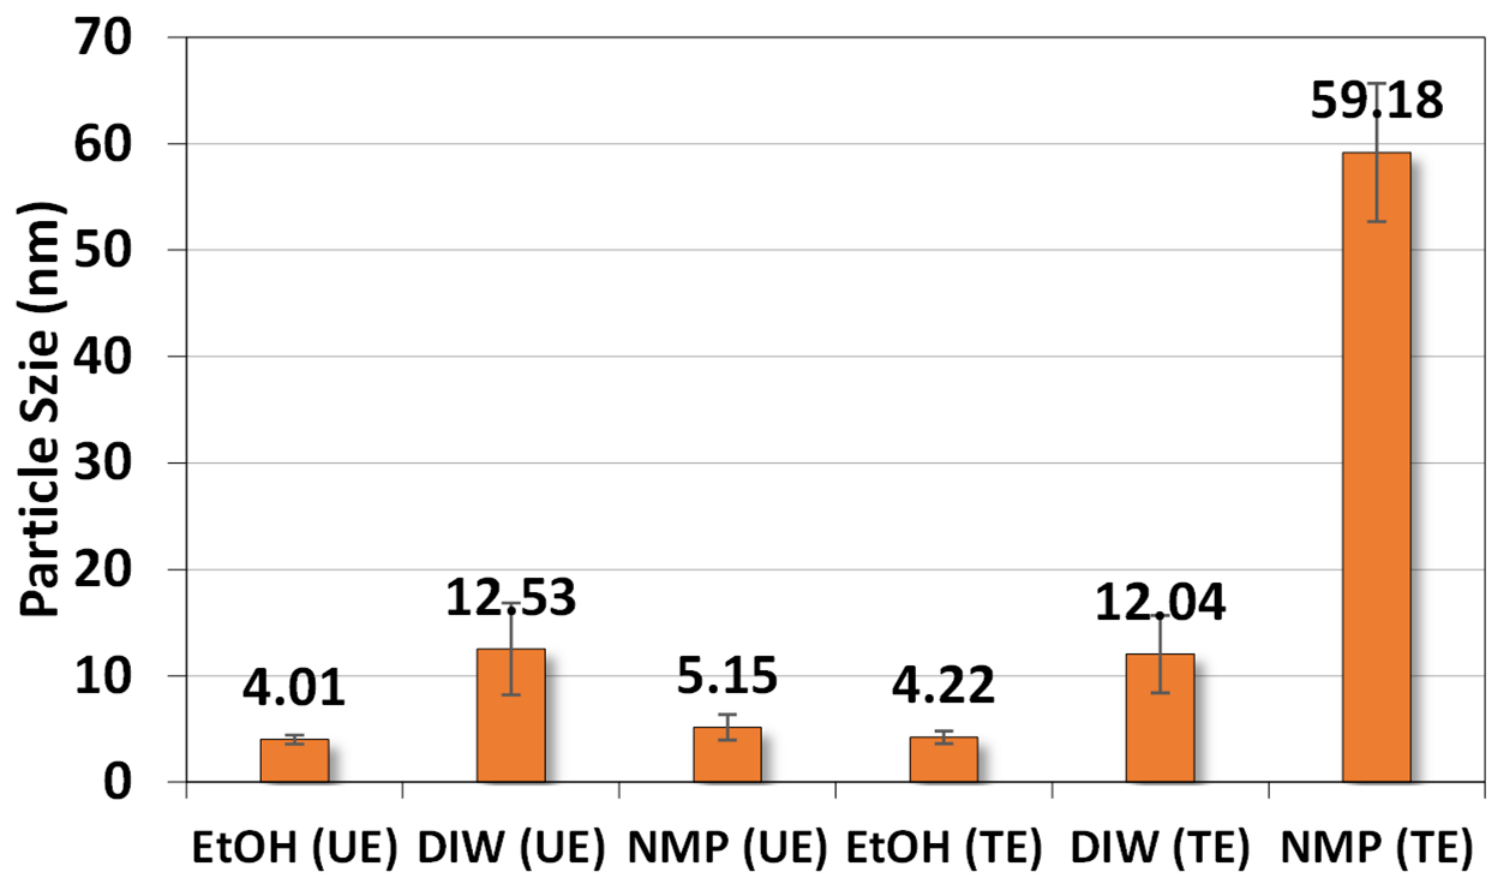
The particle size of MoS2 nanoparticles was further analyzed in TEM images using ImageJ® (n ≥ 30). As shown in Figure 3, ethanol is particularly effective in exfoliating the bulk MoS2 to around 4 nanometers, whether by sonication or thermal treatment. DI water yielded an average size of 12 nanometers, which may be attributed to the lower solubility of nanoparticles.
The significantly larger particle size of MoS2 achieved by thermal exfoliation in NMP is a surprise, as MoS2 in the same solvent under ultrasound treatment is relatively small (~5.15 nm). This could indicate that the MoS2 in NMP is less effectively exfoliated by heating. However, we retain this set of samples for further study because a larger size would exhibit different optical behaviors, as seen in later sections.

3.2.2. XRD

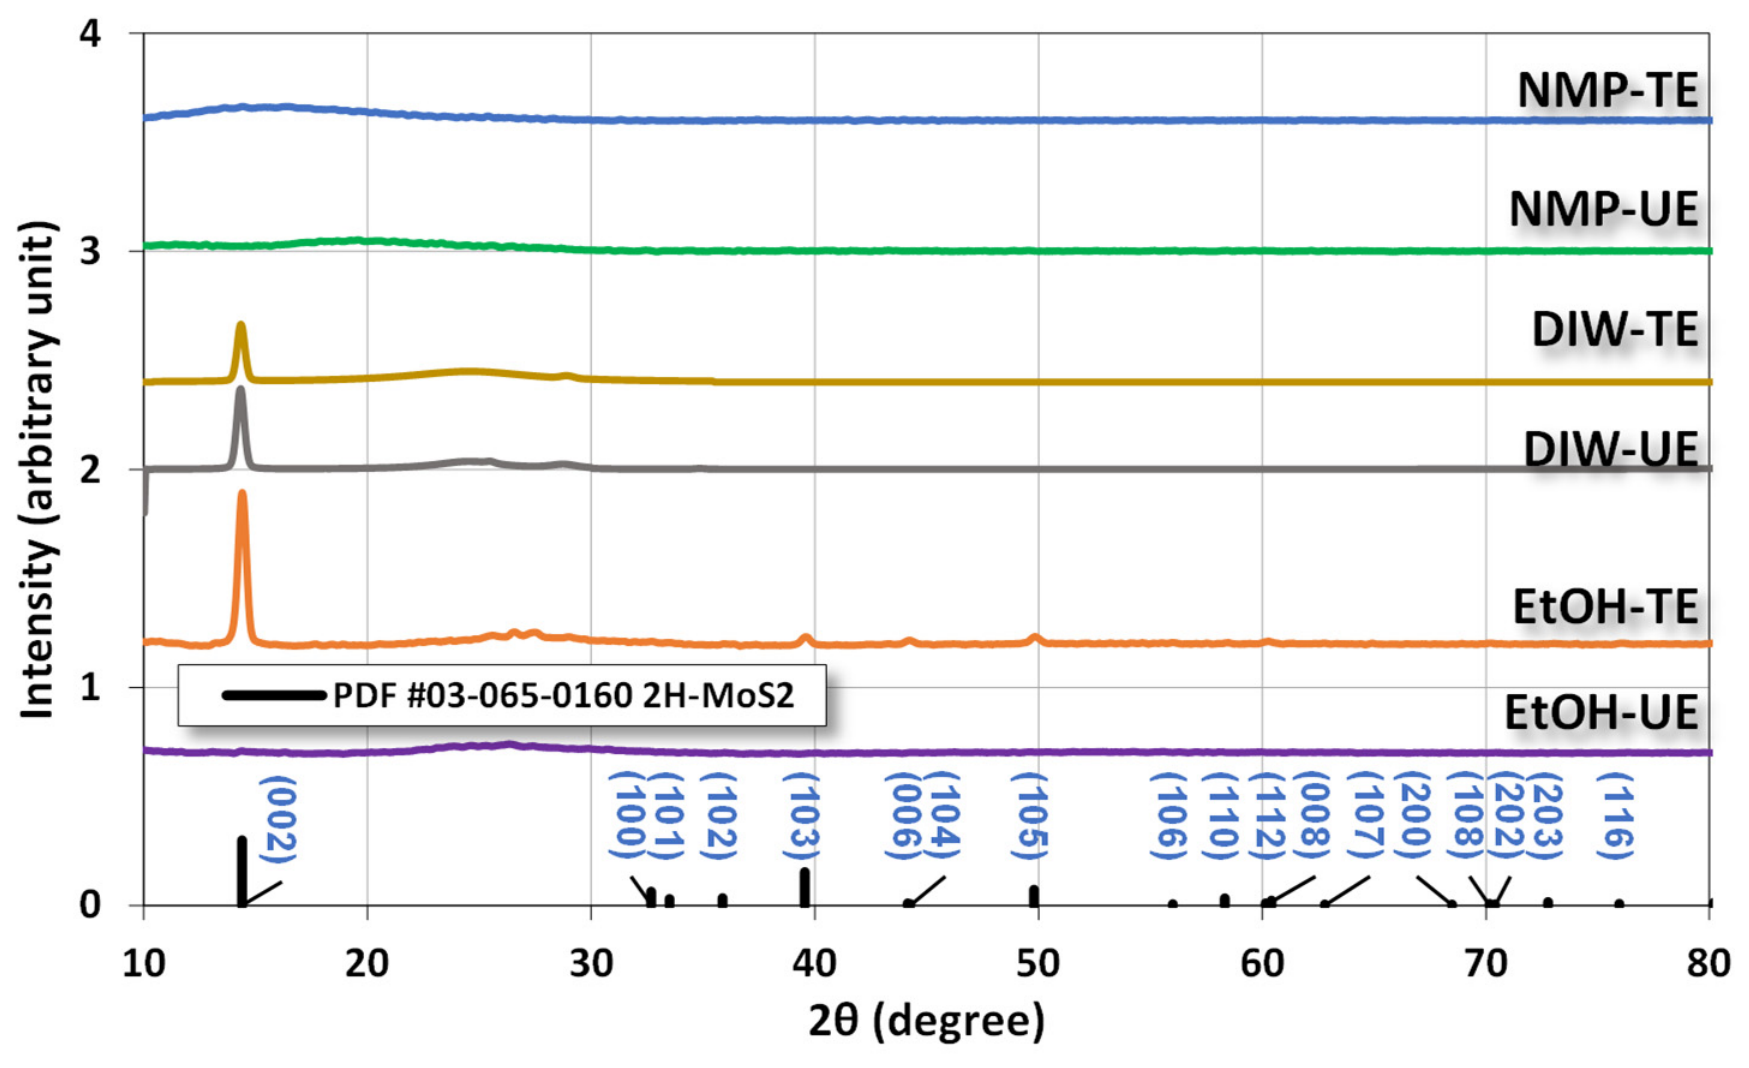
Figure 4 shows the crystal structures of MoS2 nanoparticles exfoliated using different methods and solvents. One dominant crystal plane (002), identified as 2H-MoS2 (PDF#03-065-0160), is clearly presented in the samples of ultrasonic exfoliation in DI water (DIW-UE) and thermal exfoliation in ethanol and DI water (EtOH-TE and DIW-TE). Thermal exfoliation in ethanol yields more crystal ODs than other methods. Other crystal planes of 2H-MoS2, such as (100), (103), (105), and (110), are relatively insignificant [61]. Samples synthesized in NMP are either amorphous-like or contain only crystallites.
The dominant (002) peak at 14.9° indicates a clean hexagonal structure (2H-MoS2) in the sample [62]. If more bulky structures such as nanosheets or large particles are present, other crystal planes would be more visible, possibly along with naturally occurring 1T-MoS2.

3.2.3. Zeta Potential

The zeta potentials of MoS2 nanoparticles exfoliated by different methods and solvents are shown in Table 3. Samples exfoliated in DI water have lower absolute electrical potentials (less than 10 mV), implying unstable nanoparticle dispersion in the solvent. Over time, particle aggregation would lead to sedimentation in the solvent. On the contrary, with zeta potentials close to 30 mV or beyond, MoS2 nanoparticles can maintain suspension in ethanol or NMP for an extended time, even though the average particle size in NMP achieved by thermal exfoliation is much larger [63].
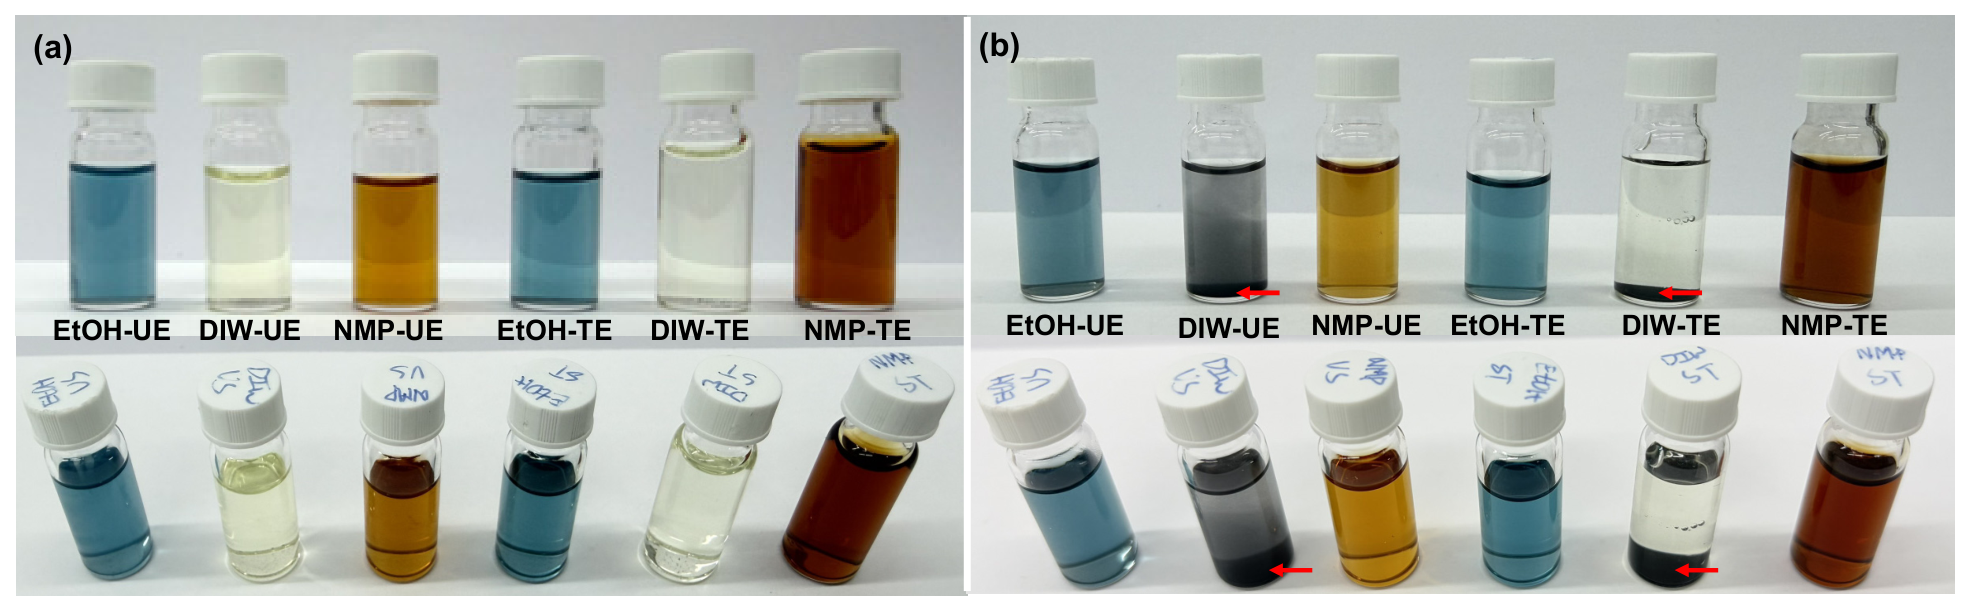
Figure 5 shows a visualization of the colloidal state of exfoliated nanoparticles in different solvents, where stratification and sediments in DI water for samples stored longer than 30 days are visible and marked with red arrows. This observation is consistent with the zeta-potential measurement.
Another interesting but self-explanatory observation in Figure 5a is that the color of these suspensions is consistent with their respective UV–visible–NIR spectra.

3.2.4. XPS

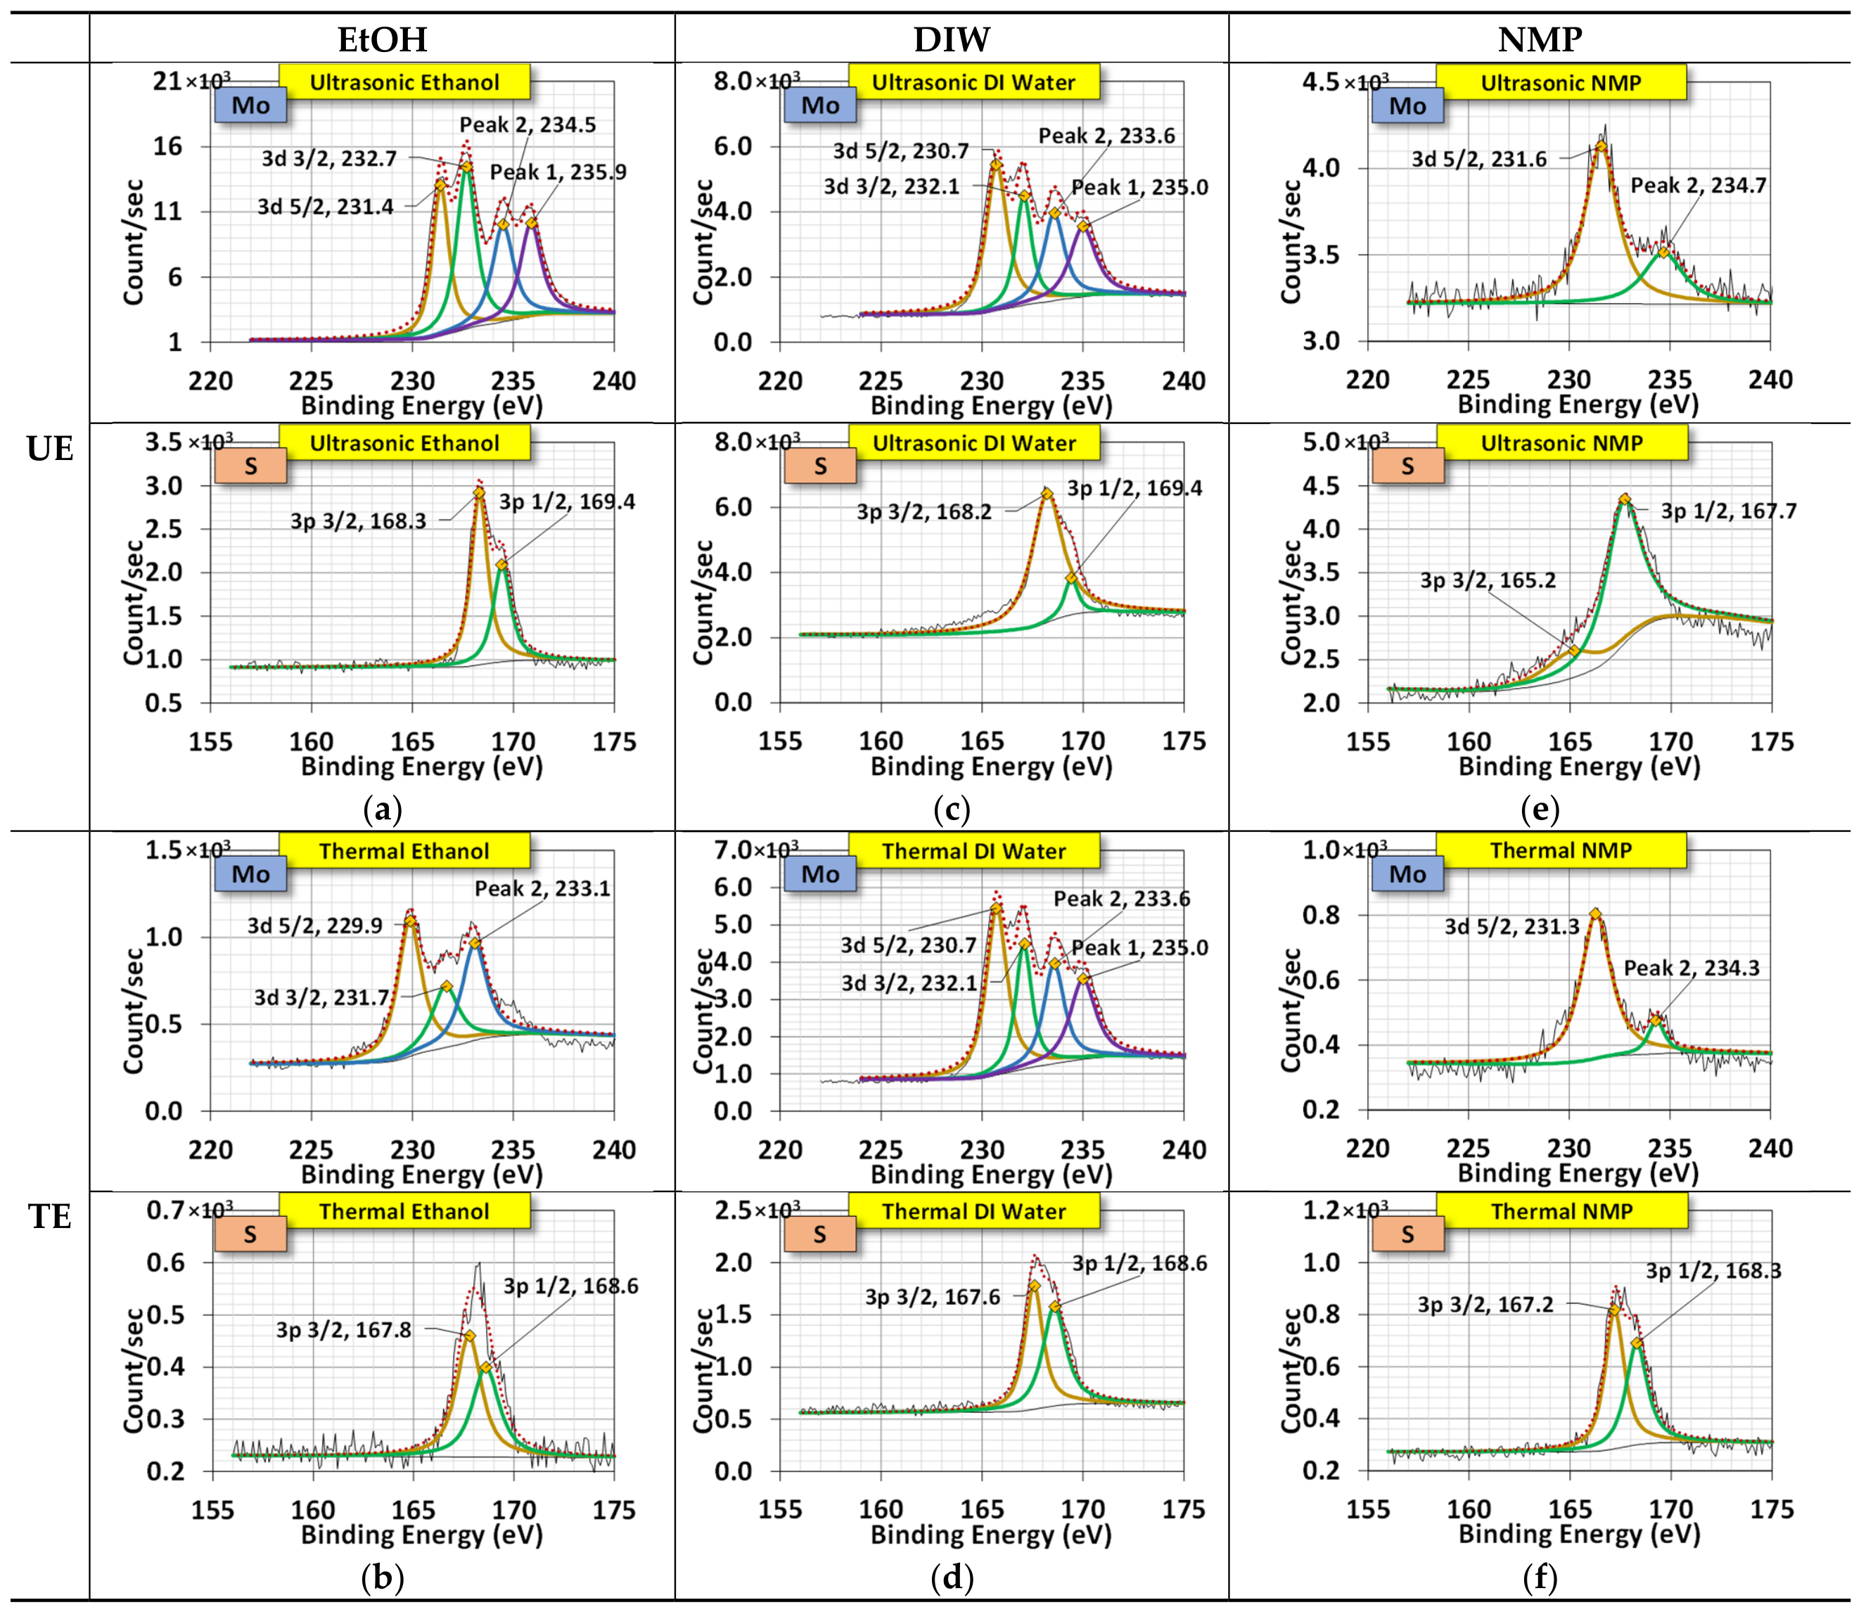
Figure 6 presents the XPS for the binding energy spectra of MoS2 nanoparticles synthesized under different exfoliations in different solvents. The Gaussian function provided a good fit to the spectra for both Mo and S.
Starting from sulfur, both 3p3/2 and 3p1/2 peaks are numerically found at around 167.6–168.1 eV, regardless of the exfoliation method or solvent type. These two bonding energy levels of S indicates that S can form a stable bond with Mo.
The bonding of Mo, on the contrary, is more complicated. Core-level peaks at 3d5/2 (approximately 229–231 eV) and 3d3/2 (approximately 232 eV) correspond to the normal bonding states of Mo. The other two peaks at higher energy levels—namely, peak 2 (approximately 233–234 eV) and peak 1 (approximately 235 eV)—are satellite peaks, most commonly caused by interactions between excited core and valence electrons. The interactions can either promote valence electrons to higher energy levels (shake-up) or eject them from the atom (shake-off). Both result in lower kinetic energy of the emitted photons and a binding-energy shift higher than that of core-level peaks.
However, the low crystallinity indicated by the XRD (Figure 4) also indicates the bonding state of Mo and S. Because the crystal structures are not perfectly ordered due to exfoliation, defects (vacancies, dislocations, grain boundaries, etc.) are inevitable within these incomplete structures. More details about the imperfections of the MoS2 structure shall be discussed later.

3.2.5. UV–Visible–NIR Spectrum

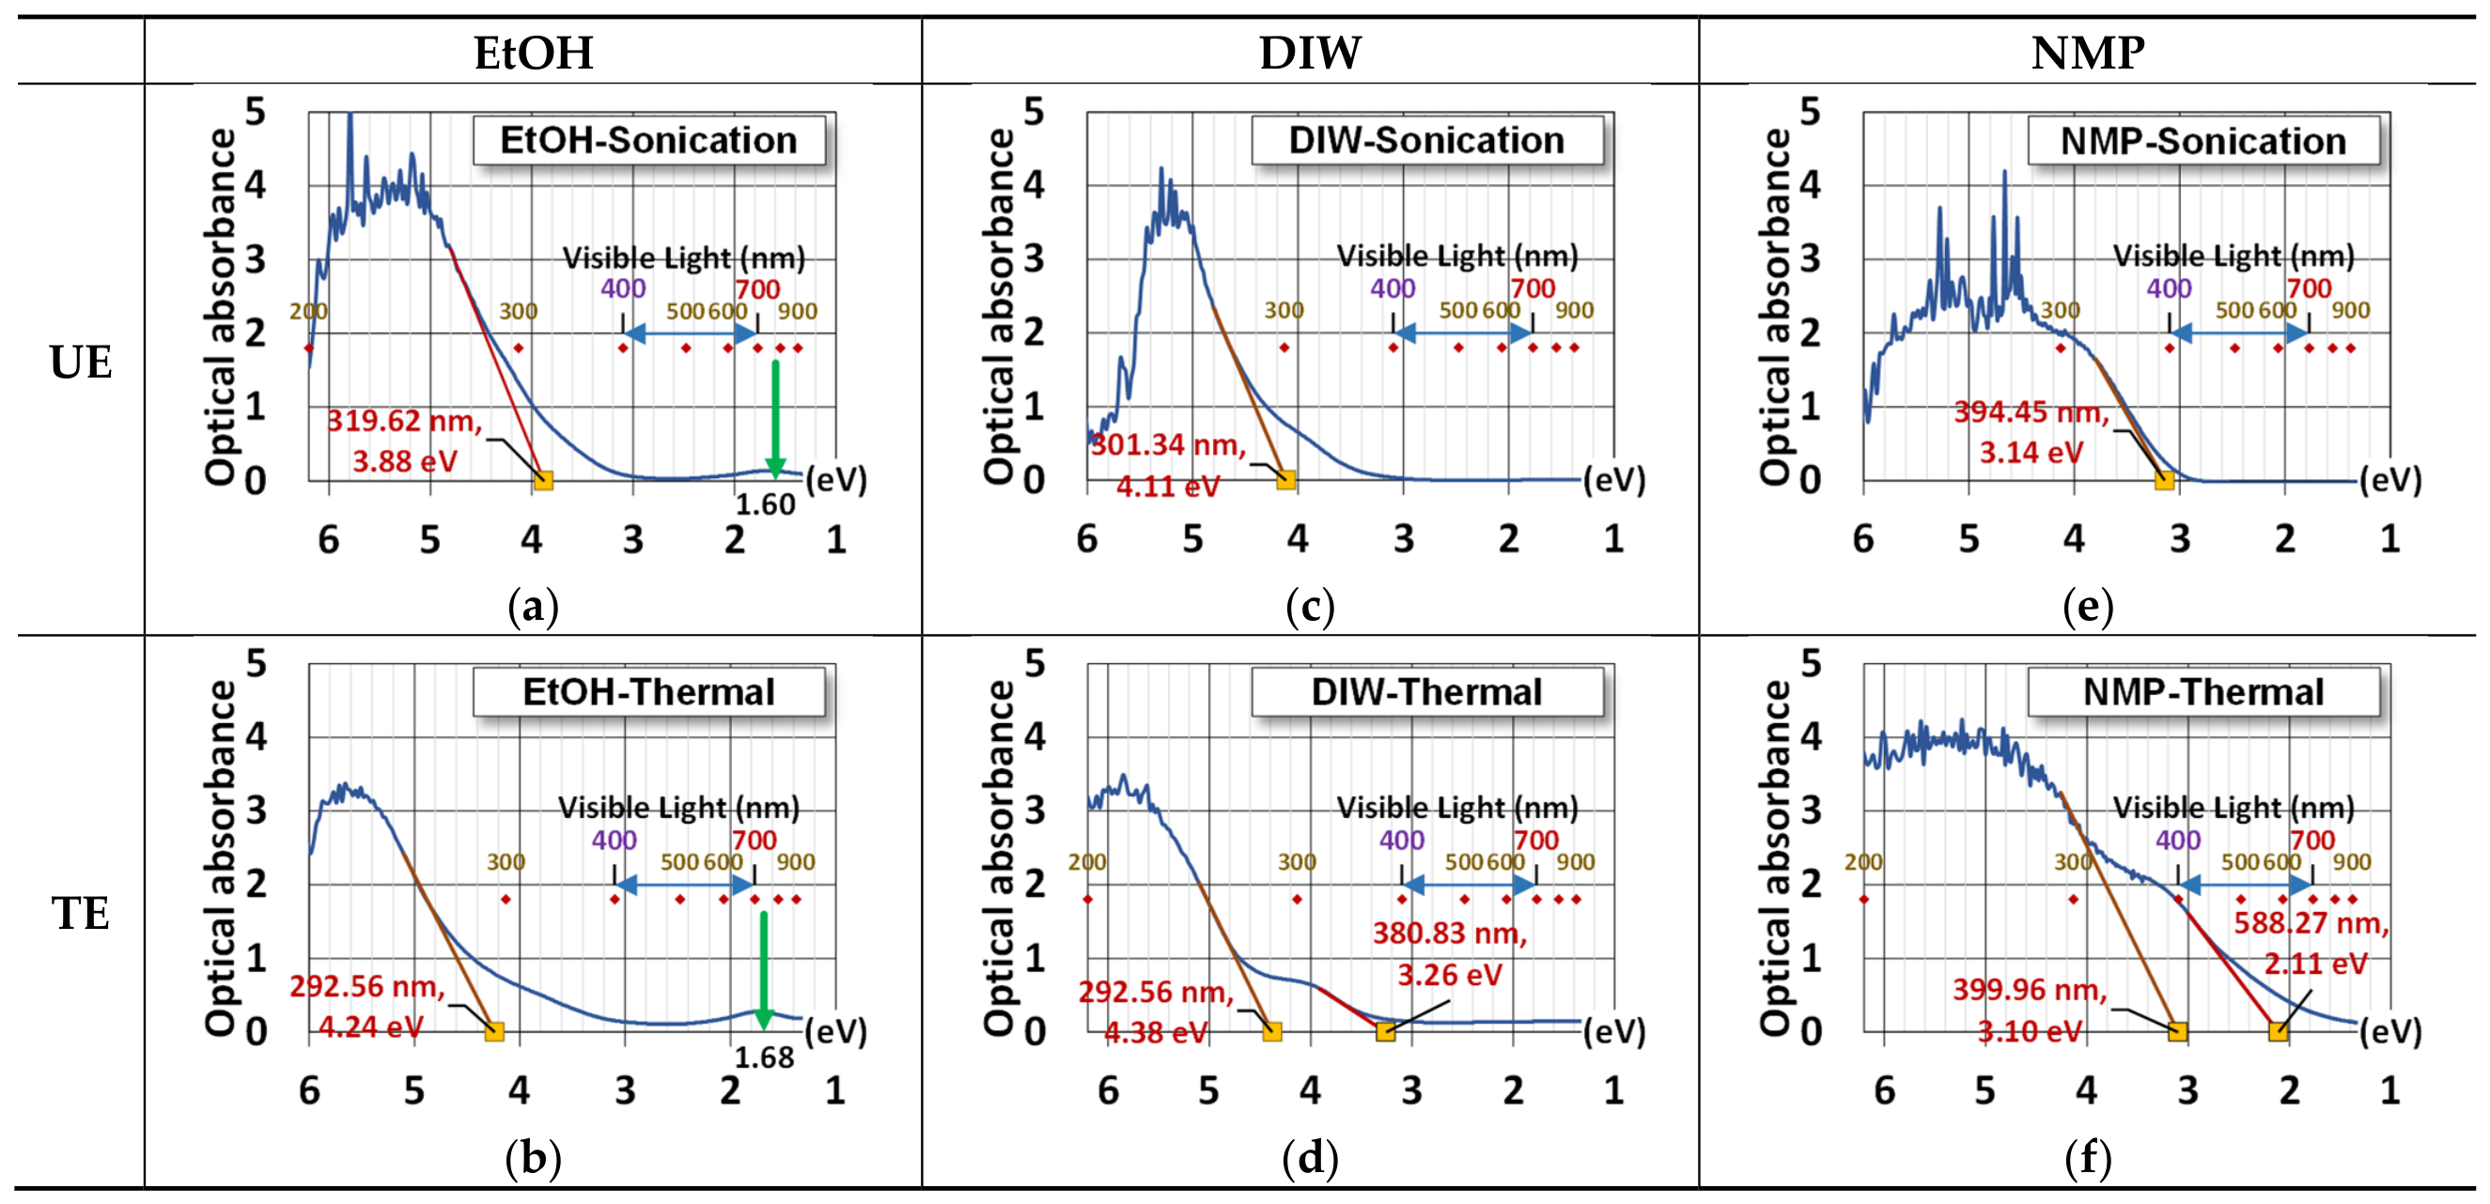
Figure 7 shows the optical absorption of UV–visible–NIR spectra. For all samples in DI water, broad UV absorption is observed, regardless of the synthesis method. However, this broadband peak can be roughly categorized into two sub-band peaks for samples synthesized by ultrasonication. One is around 4.5 eV (270 nm) due to photon-induced excitons in MoS2 nanoparticles, and the other is between 5.0 and 5.5 eV (247.96–225.42 nm) due to photons interacting with quasi-continuous electronic band structures arising from geometric confinement [64]. Thermally exfoliated samples show broadband absorbance at slightly higher energy levels around 5.5–6.0 eV (225.42–206.64 nm).
Notably, samples synthesized in ethanol show another broadband absorption centered around 1.68–1.60 eV (737–776 nm) (Figure 7a,b). This peak is related to the photothermal effect, in which energy from absorbed photons is released at longer (red-shifted) wavelengths. Thus, heat can be generated through the interactions between electrons and phonons (lattice vibrations) [65,66].
Given the UV–visible–NIR spectra, we can estimate the minimum absorption energy of the synthesized MoS2 nanoparticles by linear extrapolation from the absorption edge. As shown in Figure 7, the first intersections with the horizontal axis (minima of absorption energy) are all in the UV range (shorter than 400 nm, or 3.0996 eV). In other words, electrons in these particles are excitable if photons provide UV-level energy to help them jump over the band gap. Although this estimate is very rough, the widened band gaps in MoS2 nanoparticles are illustrative compared with their bulk forms (approximately 1.2 eV) [67,68,69,70,71,72].
Uniquely, samples synthesized by thermal exfoliation in NMP and DI water ((d) and (f)) present a second intersection with the horizontal axis. This intersection indicates another absorption in visible light. The spectrum of nanoparticles synthesized in NMP is a gradually decreasing absorption stretching from the UV region to the NIR region. This distinct pattern is more similar to that of a continuous phase, such as thin films [73,74], and can be attributed to the larger MoS2 particle size, as shown in the TEM image in Figure 3.

3.2.6. Photoluminescence

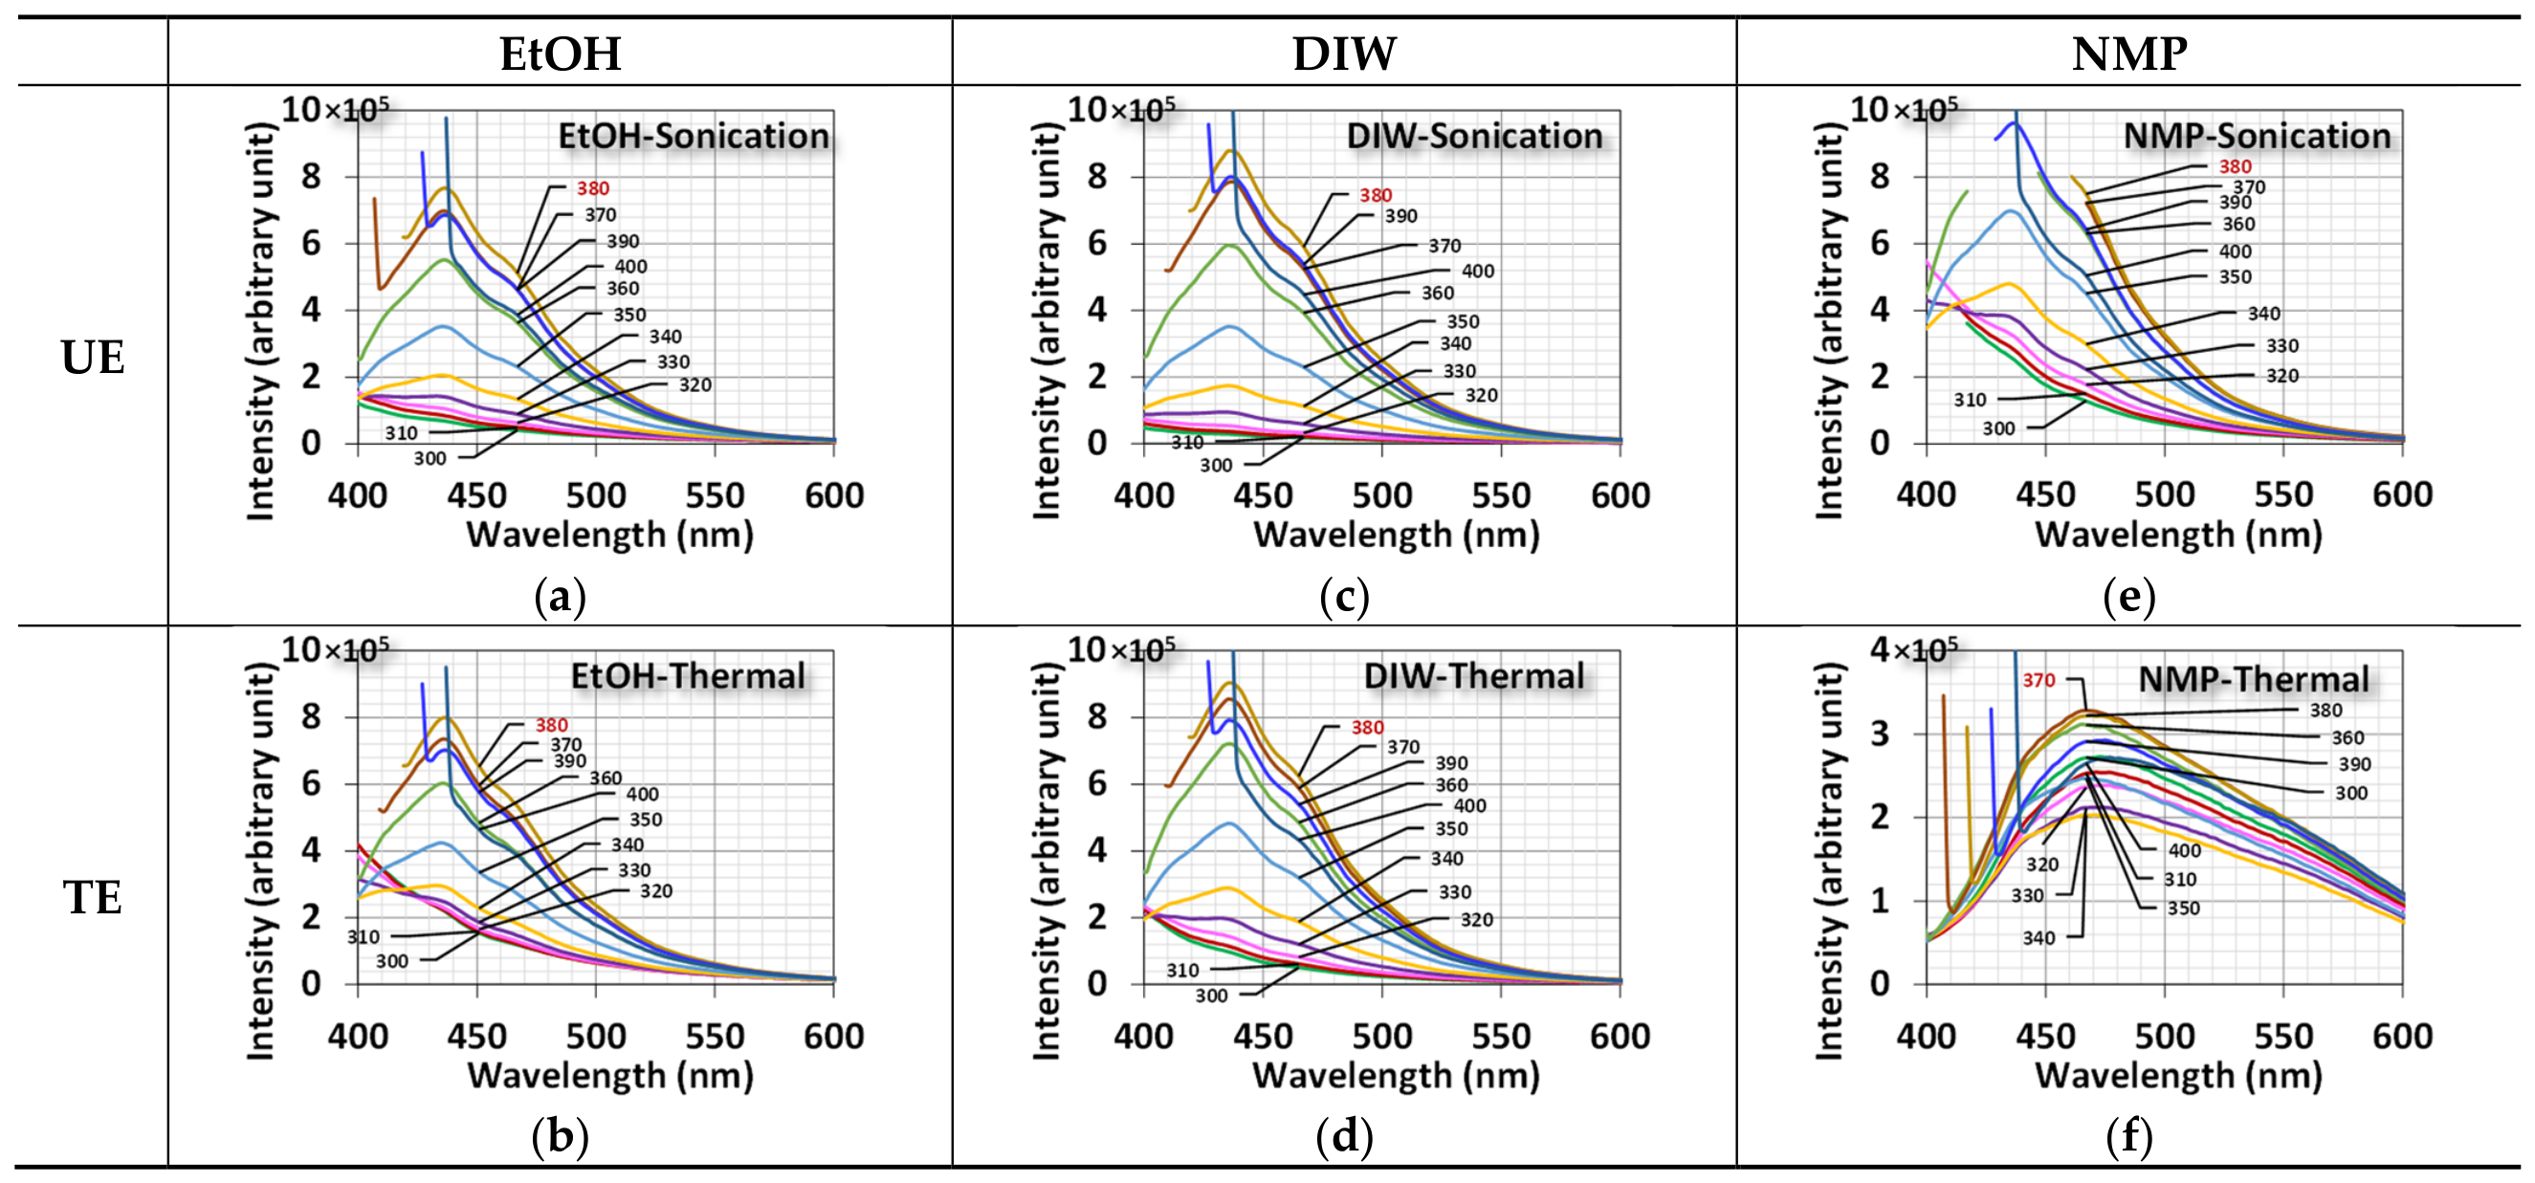
Figure 8 shows the photoluminescence of synthesized MoS2 nanoparticles in DI water under different laser excitation wavelengths. Except for the synthesis in NMP by heating, the peak of optical emission from samples was found to be centered around 440–450 nm (2.82–2.76 eV), regardless of the type of solvent and treatments, and laser excitation of 370–380 nm (3.35–3.26 eV) produced the highest emission among all cases.
More specifically, when the laser excitation wavelength is longer than 340 nm (3.65 eV), luminescent emission intensifies. Except for samples synthesized in NMP by heating, the emission reaches a maximum at varying wavelengths between 440 and 450 nm, then decreases, highlighting a resonance effect. All the decreasing emissions show a shoulder around 470 nm (2.64 eV), indicating possible intra-band transitions during electron relaxation [75,76,77,78].
In the case of NMP thermal exfoliation, broad photoluminescence covers almost the whole visible spectrum. This result is due to a larger particle size (Figure 3). In other words, the photoluminescence diminishes as the quantum confinement weakens when particles become larger [79].

3.3. Photothermal Test

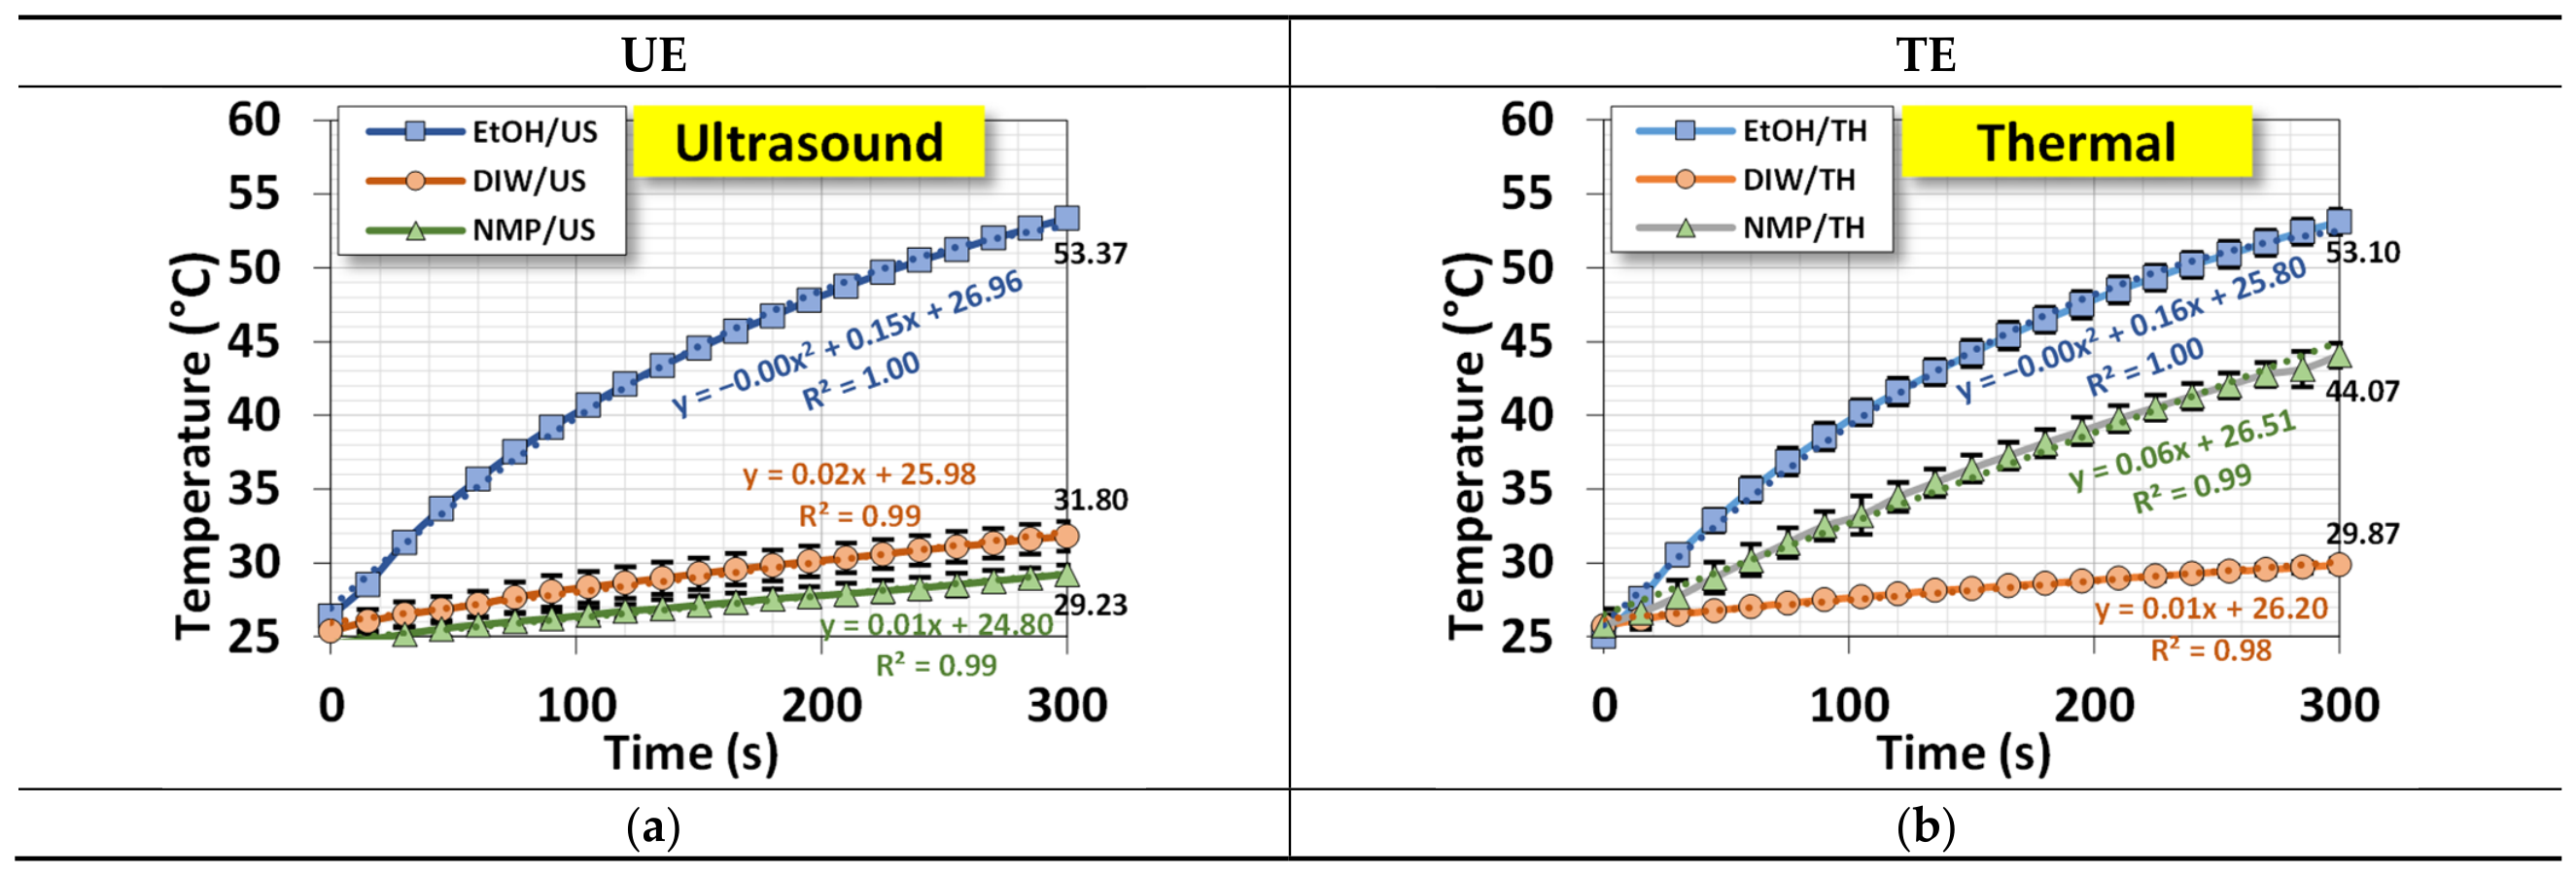
The UV–visible–NIR absorption spectra showed a broad band centered at 737–776 nm for samples treated with ethanol. This absorption is helpful for clinical treatment if its function is utilized correctly [80]. Figure 9 shows the temperature change in DI water containing dispersed MoS2 nanoparticles as it is continuously exposed to an 808 nm LED laser. The most prominent temperature rise is observed with MoS2 nanoparticles synthesized in ethanol, which reach 53.1 °C (ultrasonic) and 53.37 °C (thermal) in 300 s. For the same period, other samples have a smaller temperature rise of less than 30 °C.
The photothermal effect usually occurs when excited electrons relax and interact with the lattice in the red-to-infrared region. In this range of wavelengths, the UV–visible–NIR spectra (Figure 7) of samples synthesized in ethanol indicate that photon energy is readily absorbed. The smaller MoS2 nanoparticles also improve energy conversion efficiency (Figure 3).
The thermal exfoliation of MoS2 nanoparticles in NMP was evident, with a higher photothermal effect (Figure 9b, temperature rising to 45 °C in 300 s). This result corroborates the broad optical absorption across the visible–infrared region (Figure 7f), thereby enhancing photothermal conversion [81].

3.4. In Vitro Cell Viability

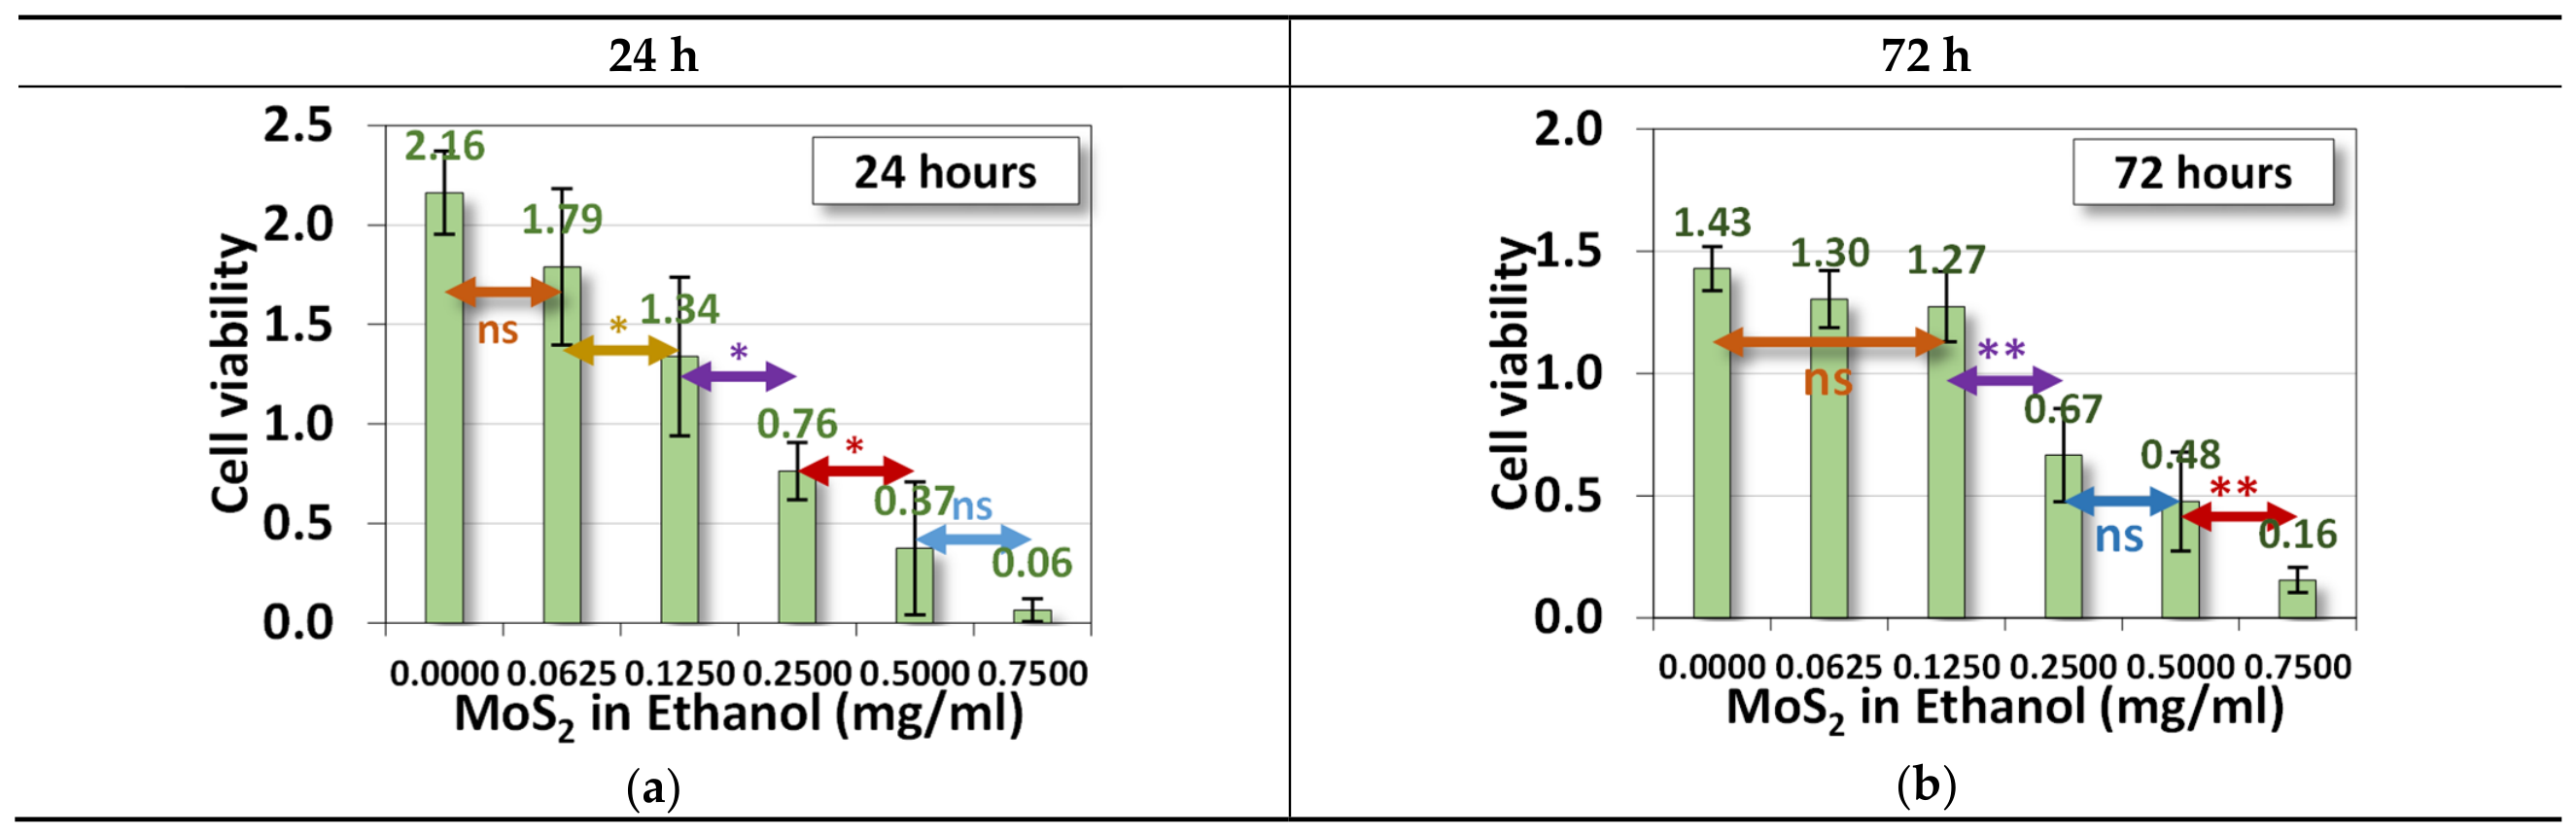
Figure 10 shows the relative cell viability of NIH/3T3 fibroblast cells in vitro at 24 and 72 h after seeding. Only MoS2 nanoparticles synthesized in ethanol by thermal exfoliation were chosen for the in vitro cell culture because of their highest photothermal effect among the samples. In the medium mixed with MoS2 nanoparticles, viability decreases as MoS2 concentration increases. However, the low concentrations of 0.0625 and 0.125 mg/mL showed minimal toxicity (viability > 100%) in NIH/3T3 fibroblast cultures, particularly after 72 h, when cells were stabilized and began to proliferate again. The relative cell viability of these two concentrations remained above 100% 72 h after seeding.

3.5. Antibacterial Test

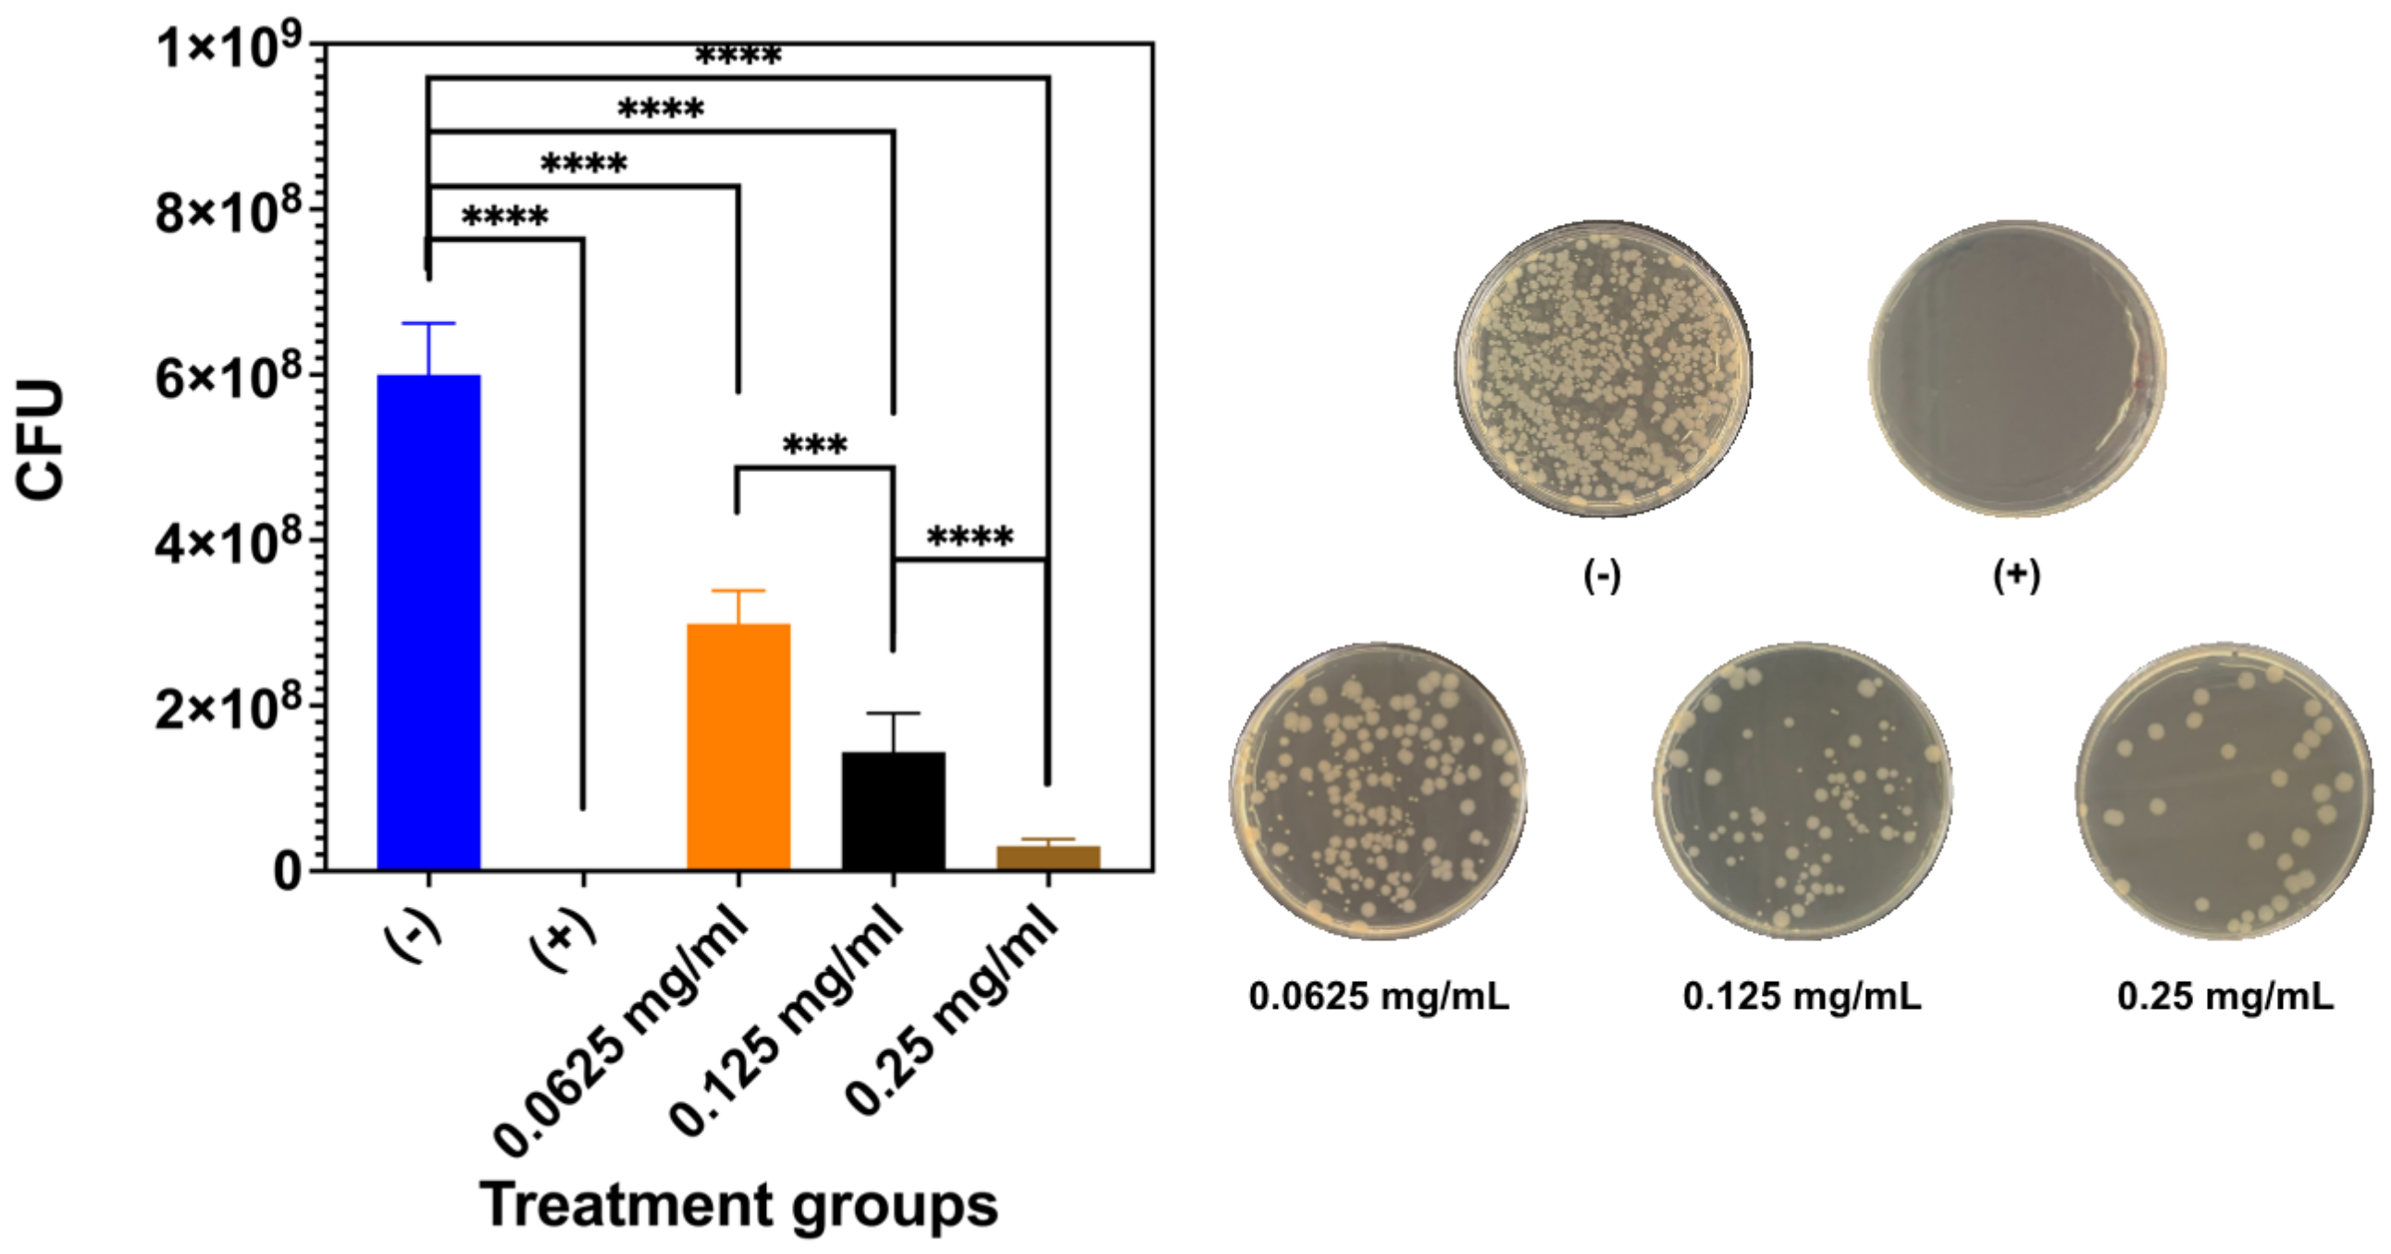
Figure 11 shows CFU counts of E. coli 24 h after co-culture with MoS2 nanoparticles in culture medium. Only the 0.25, 0.125, and 0.0625 mg/mL concentrations of nanoparticles were selected for this test, based on the in vitro biocompatibility of MoS2 nanoparticles. The antibacterial effect increases with MoS2 concentration. Due to the optical absorption of MoS2 nanoparticles, they exhibit higher absorbance than the control group at early time points (Figure 11. The 0.25 mg/mL concentration of MoS2 nanoparticles effectively suppressed E. coli proliferation, reducing CFU counts by nearly 1/10.
Note that both the in vitro biocompatibility and antibacterial tests are preliminary but quantitative. The underlying mechanisms of imposed toxicity appear to point to endocytosis, but this is beyond the scope of the current study.

4. Discussion

4.1. The Estimated Bandgap Energy

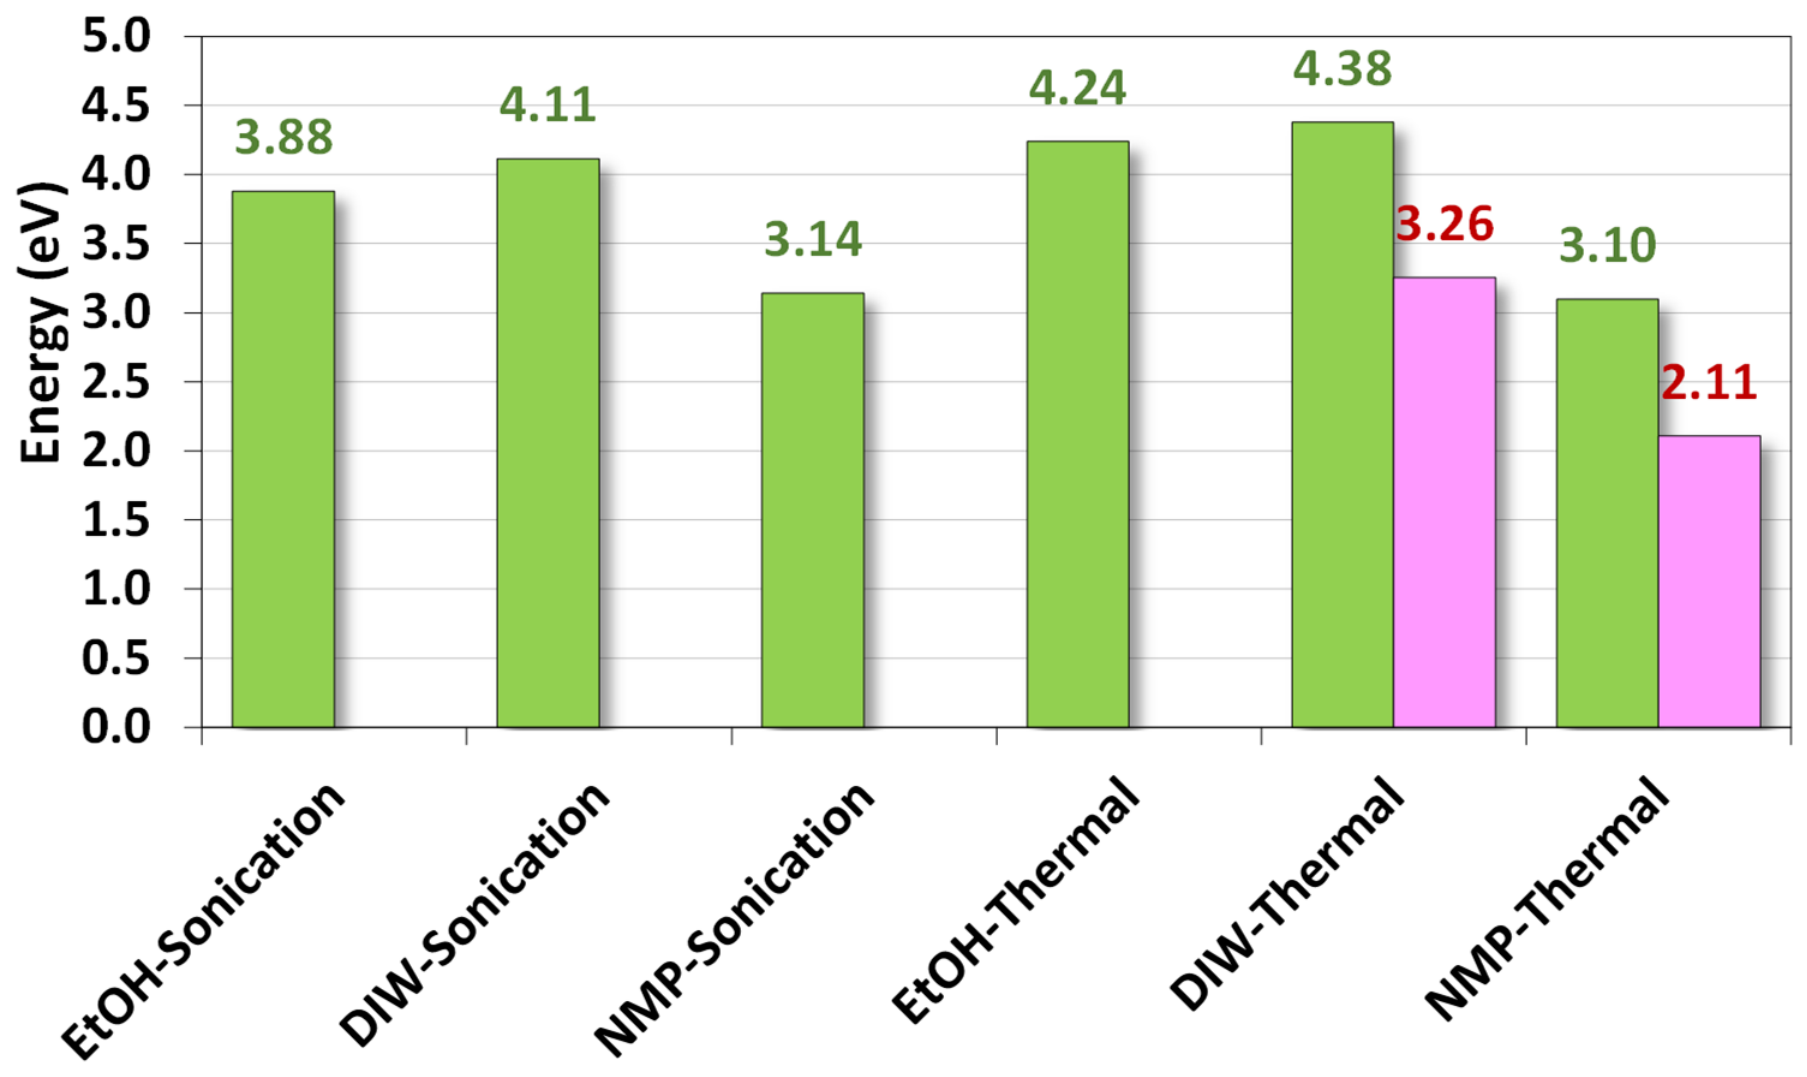
The differences in band gaps are due to the geometric confinement effect, which widens the band gap as size decreases. This inverse relationship is clearly shown in this study. Figure 12 compares estimated band gaps from UV–visible–NIR spectra of MoS2 nanoparticles synthesized with different solvents and via exfoliation. These higher-energy band gaps require photons with shorter wavelengths to excite electrons to the conduction band. Note that thermal exfoliation in DI water and NMP produces a second, smaller band gap in nanoparticles (3.26 eV at 380.32 nm and 2.11 eV at 587.60 nm, respectively), as shown by the linear intersection lines in Figure 7. These gaps may imply the existence of intra-bands in the microstructure.
A freestanding monolayer MoS2 is predicted to have direct band gaps around 1.8–2.8 eV, and the bulk MoS2 (hexagonal and rhombohedral symmetry) showed narrower indirect band gaps around 1.2 eV [67,68,69,70,71,72]. Given the multiple band gaps associated with polycrystallinity in nanoparticles, the estimated band gap from our UV–visible–NIR spectra falls within the upper bound of findings from other studies.

4.2. Correspondence Between XPS and XRD for the Microstructure

From XRD in Figure 4, we found the only dominant crystal plane in the samples is (002) of 2H MoS2. The 2H MoS2 has the following bonding features [82,83,84]:
  • Mo 3d peaks: Pristine semiconducting 2H-MoS2 exhibits a Mo 3d5/2 peak at ~229.3 eV and Mo 3d3/2 at ~232.5 eV, denoting a stable Mo4+ oxidation state. The binding energies of Mo in XPS (Figure 6a,b,d,e) for samples exfoliated in ethanol and DI water almost match these two energy levels, confirming the presence of Mo4+.
  • S 2p peaks: The corresponding S 2p3/2 and S 2p1/2 spin-orbit components for pristine 2H-MoS2 appear at ~161.6 to −162.2 eV and ~162.8 to 163.4 eV, respectively, representing covalent metal–sulfur hybridization within the trigonal prismatic coordinate layers. The S bonding energies in XPS (Figure 6) for samples exfoliated in three solvents all shift higher, indicating defects in S, besides its regular bonding to Mo.
  • Impurities or defects in S also affect the Mo bonding energy, and the satellite states reflect this fact.
Based on this information from XRD and XPS, we can characterize the main cause of disorder or amorphousness as missing or displaced S atoms during exfoliation, which is physically reasonable, as S is much smaller than the central metal, Mo and, thus, disulfide bonds can be disrupted or broken much more easily.
NMP effectively destroyed the orderliness of MoS2 microstructures compared to ethanol or DI water. This likely explains why only amorphousness was detected in its XRD.

4.3. Estimate of Quantum Yield from Photoluminescence

As shown by the photoluminescence spectroscopy in Figure 7, the majority of emission peaks are at 440–450 nm, corresponding to an energy of E = hc/λ = 2.8178–2.7552 eV. This is in the realm of violet-blue light. However, most samples exhibit the highest luminescence intensities under 380 nm laser irradiation (3.2627 eV). Thus, the energy loss or absorption between the excitation and emission peaks is around ΔE ≈ 0.4449–0.5075 eV. For imaging purposes, this is quite a decent energy conversion ratio [85,86,87].
In fact, the quantum yield (QY) or energy ratio between the irradiation and photoluminescence of a certain wavelength (λ or λi) can be calculated as follows [88,89,90]:
Q Y λ = e n e r g y   o f   e m i s s i o n e n e r g y   o f   a b s o r p t i o n = I n t e n s i t y λ E λ d λ I n t e n s i t y λ E λ d λ E λ E λ i r r a d i a t i o n     o p t i c a l   a b s o r a n v c e  
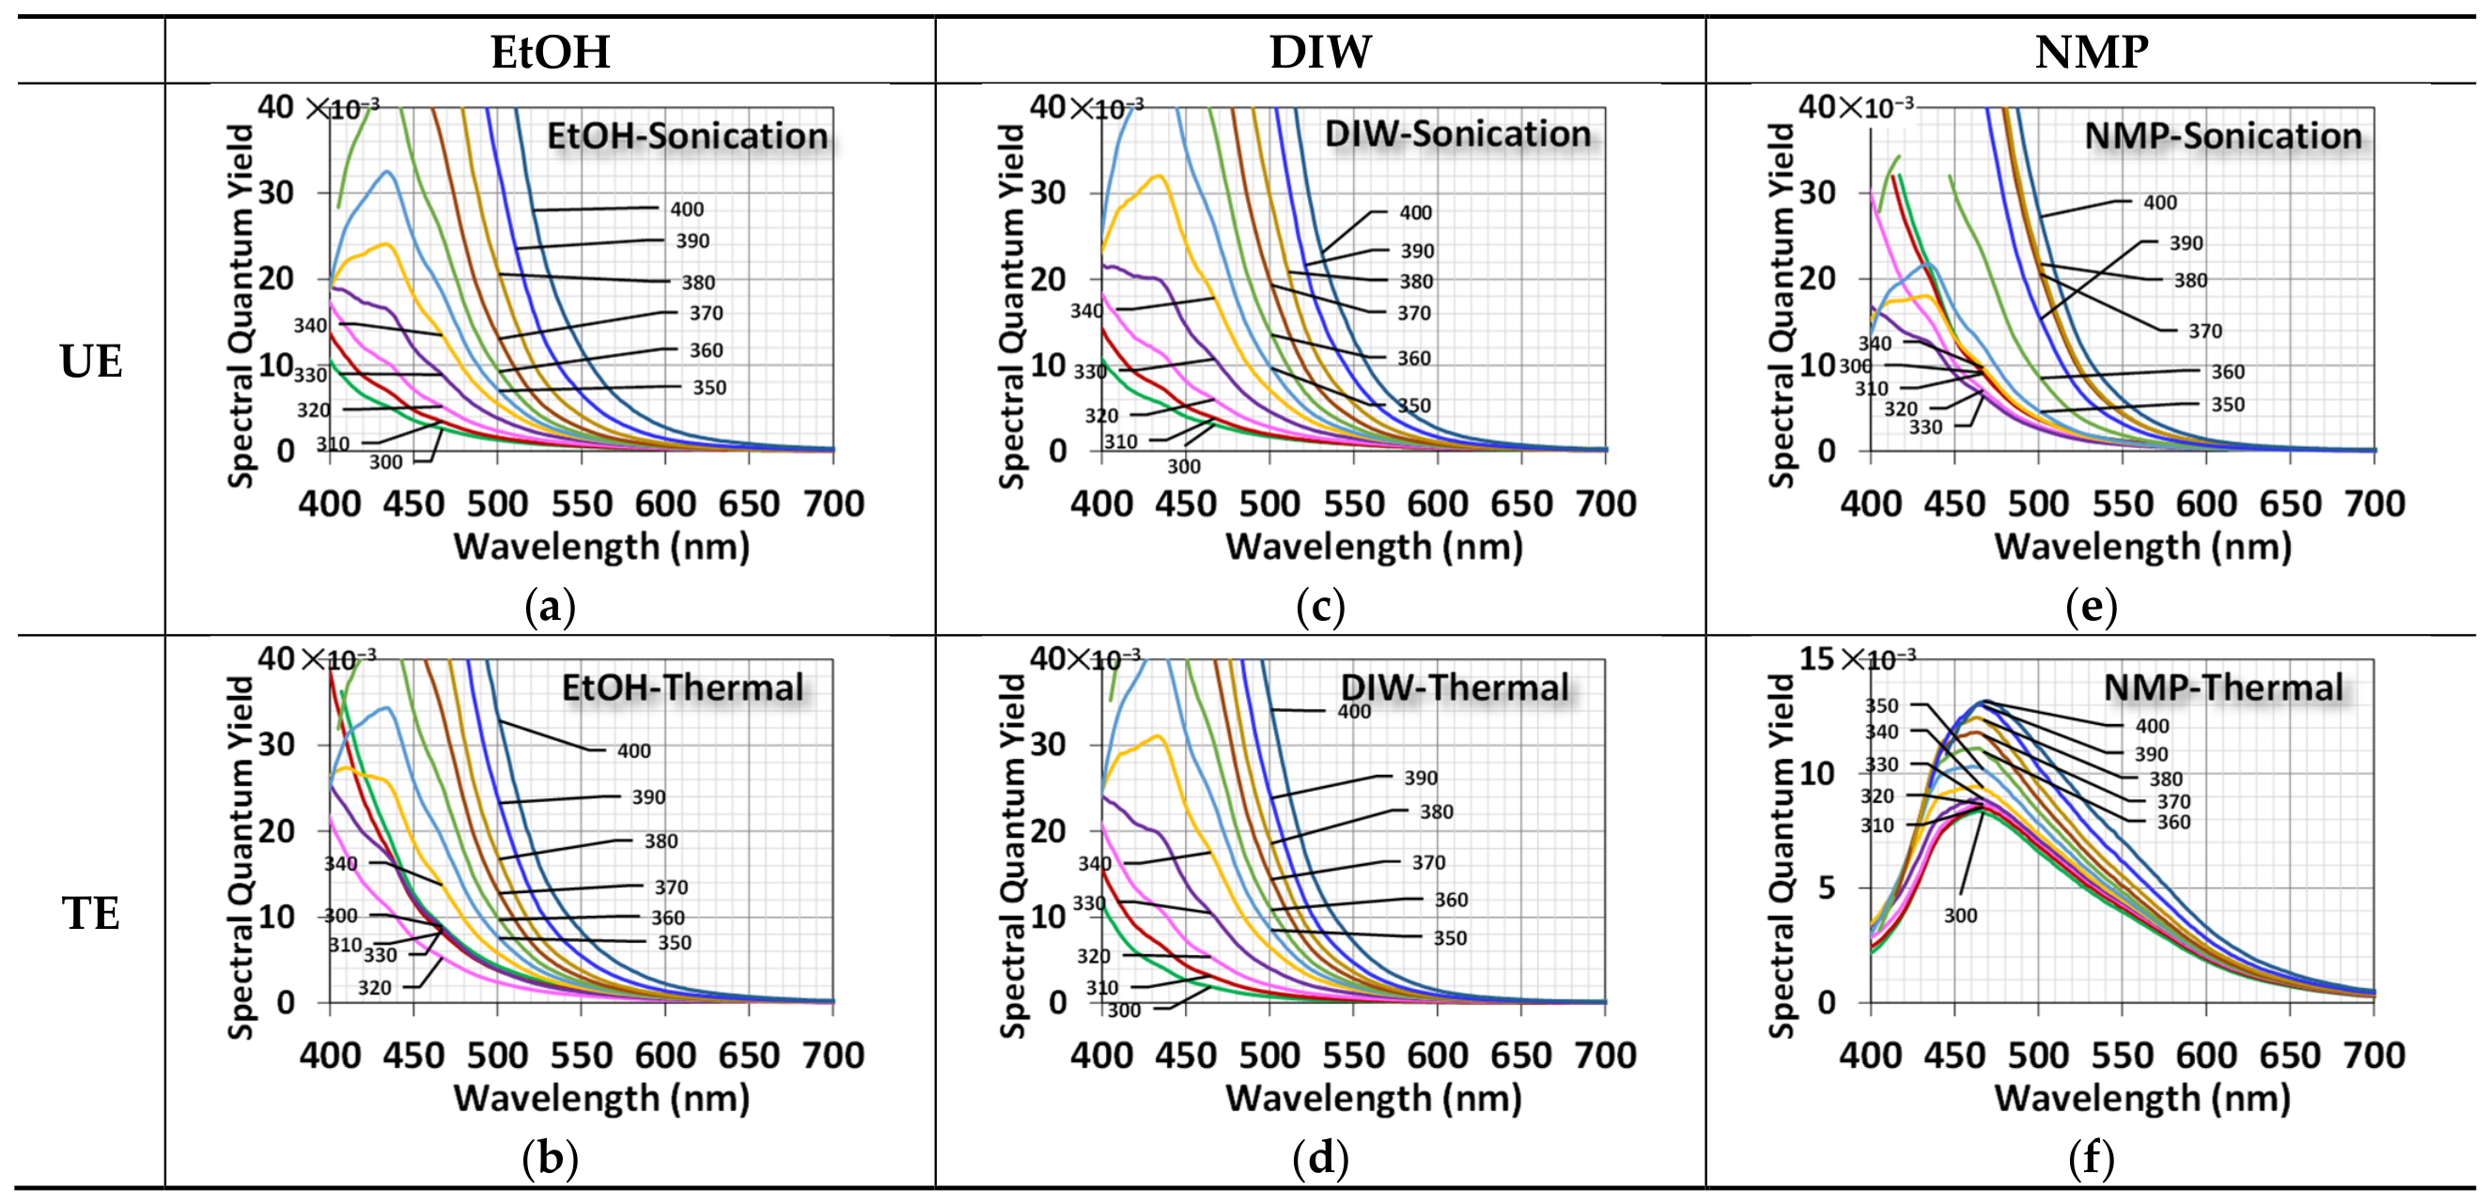
where Eλ (=hc/λ) is the photon energy of wavelength λ; h and c are the Planck constant and speed of light, respectively; and λirradiation is the wavelength of the incident laser. The term I n t e n s i t y λ E λ d λ I n t e n s i t y λ E λ d λ is the probability of Eλ. The integral can be calculated numerically using Riemann sums with the trapezoid rule, and the resulting spectral quantum yield is shown in Figure 13. In all samples except those exfoliated in NMP, the pattern of yield under laser wavelengths between 300 and 330 nm shows decay only in the visible spectrum. When irradiated with lasers at 340–400 nm, a peak in quantum yield is observed at 440–450 nm.
The thermally synthesized nanoparticles in NMP all have peaks between 450 and 500 nm and decay slowly across the visible spectrum. The quantum yields also increase with the laser irradiation wavelength, i.e., the longer the wavelength, the higher the yield.
We can further calculate the average quantum yield from a specific laser irradiation (QYλiradiation) using Equation (8) as follows.
E Q Y λ i r r a d i a t i o n = Q Y λ d λ d λ
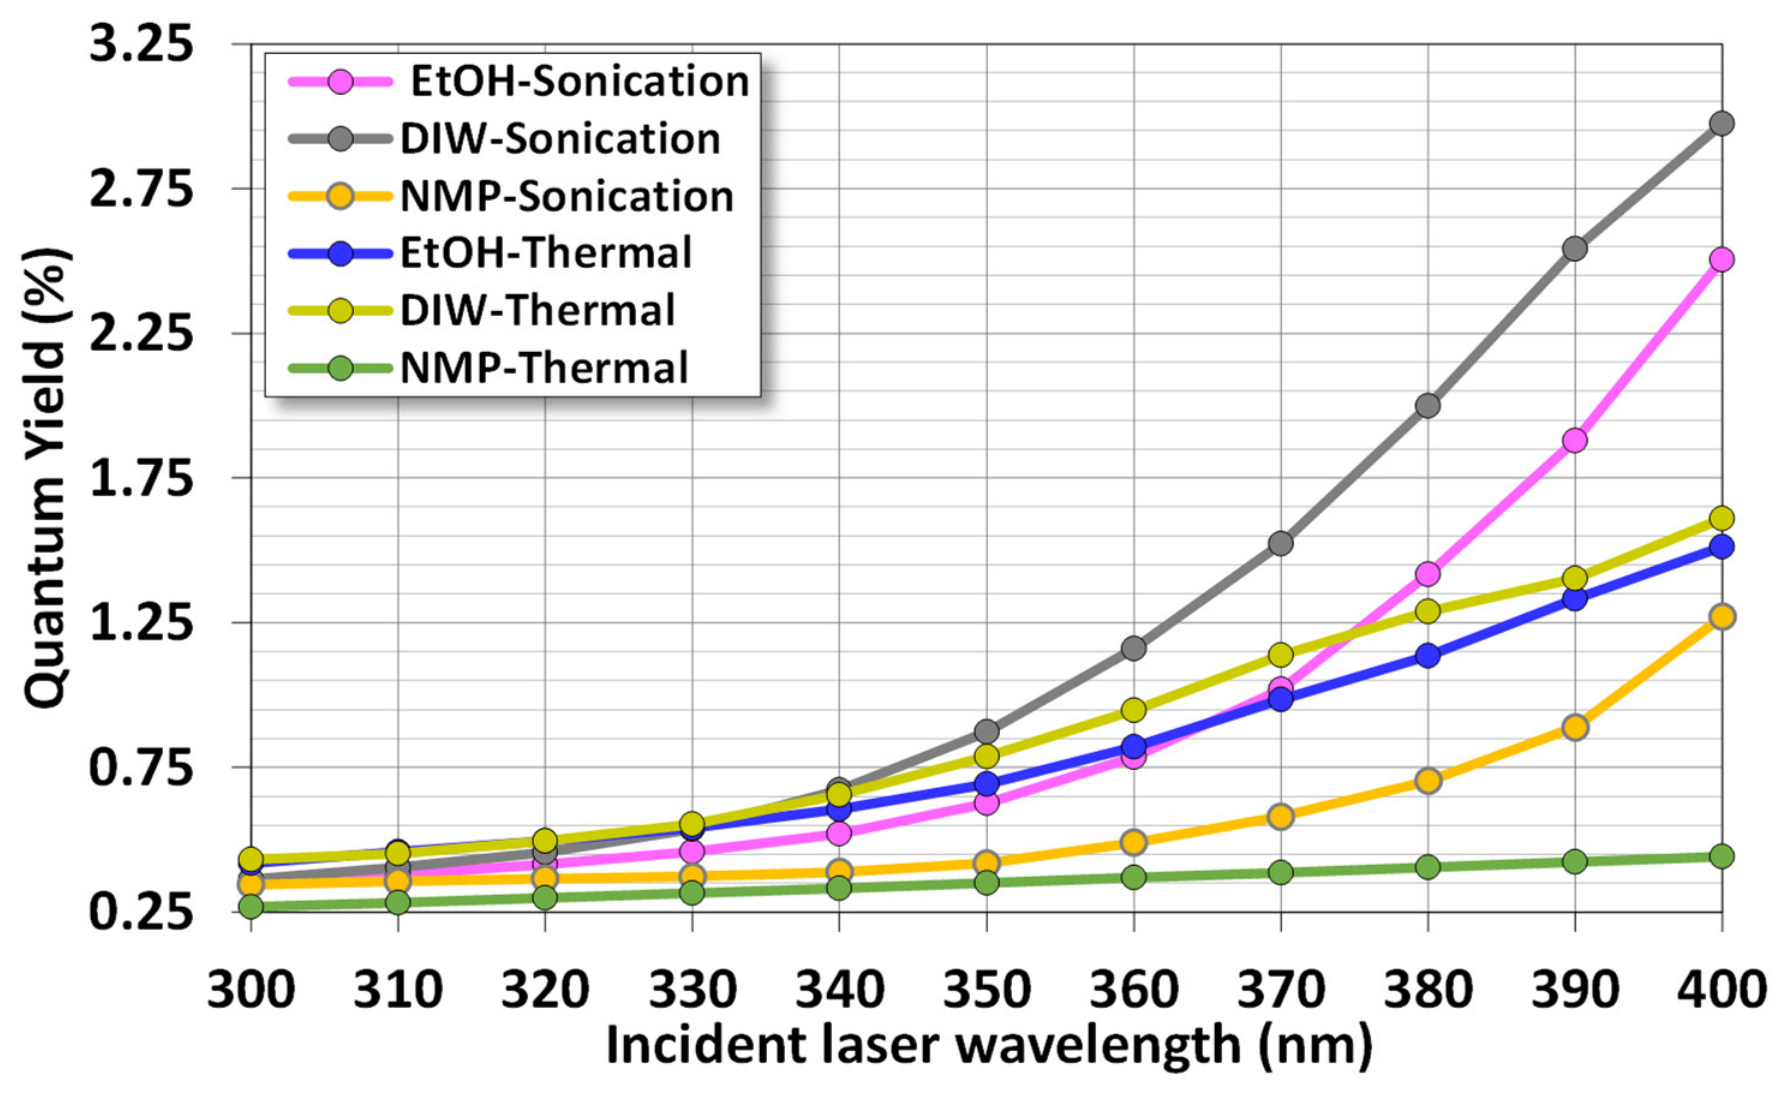
Figure 14 shows results of the calculation; the average yield increases with longer excitation laser wavelength and ranges from 0.25% to 2.25%. This range is typical of photoluminescence quantum yields of non-specially treated MoS2 [36]. Thermally exfoliated nanoparticles in NMP increase only slightly to 0.44% under 400 nm laser irradiation, reflecting their much larger particle size and limited dimensional confinement for quantum effects.

4.4. Evaluation of Heat Generation in Photothermal Test from Finite Element Analysis

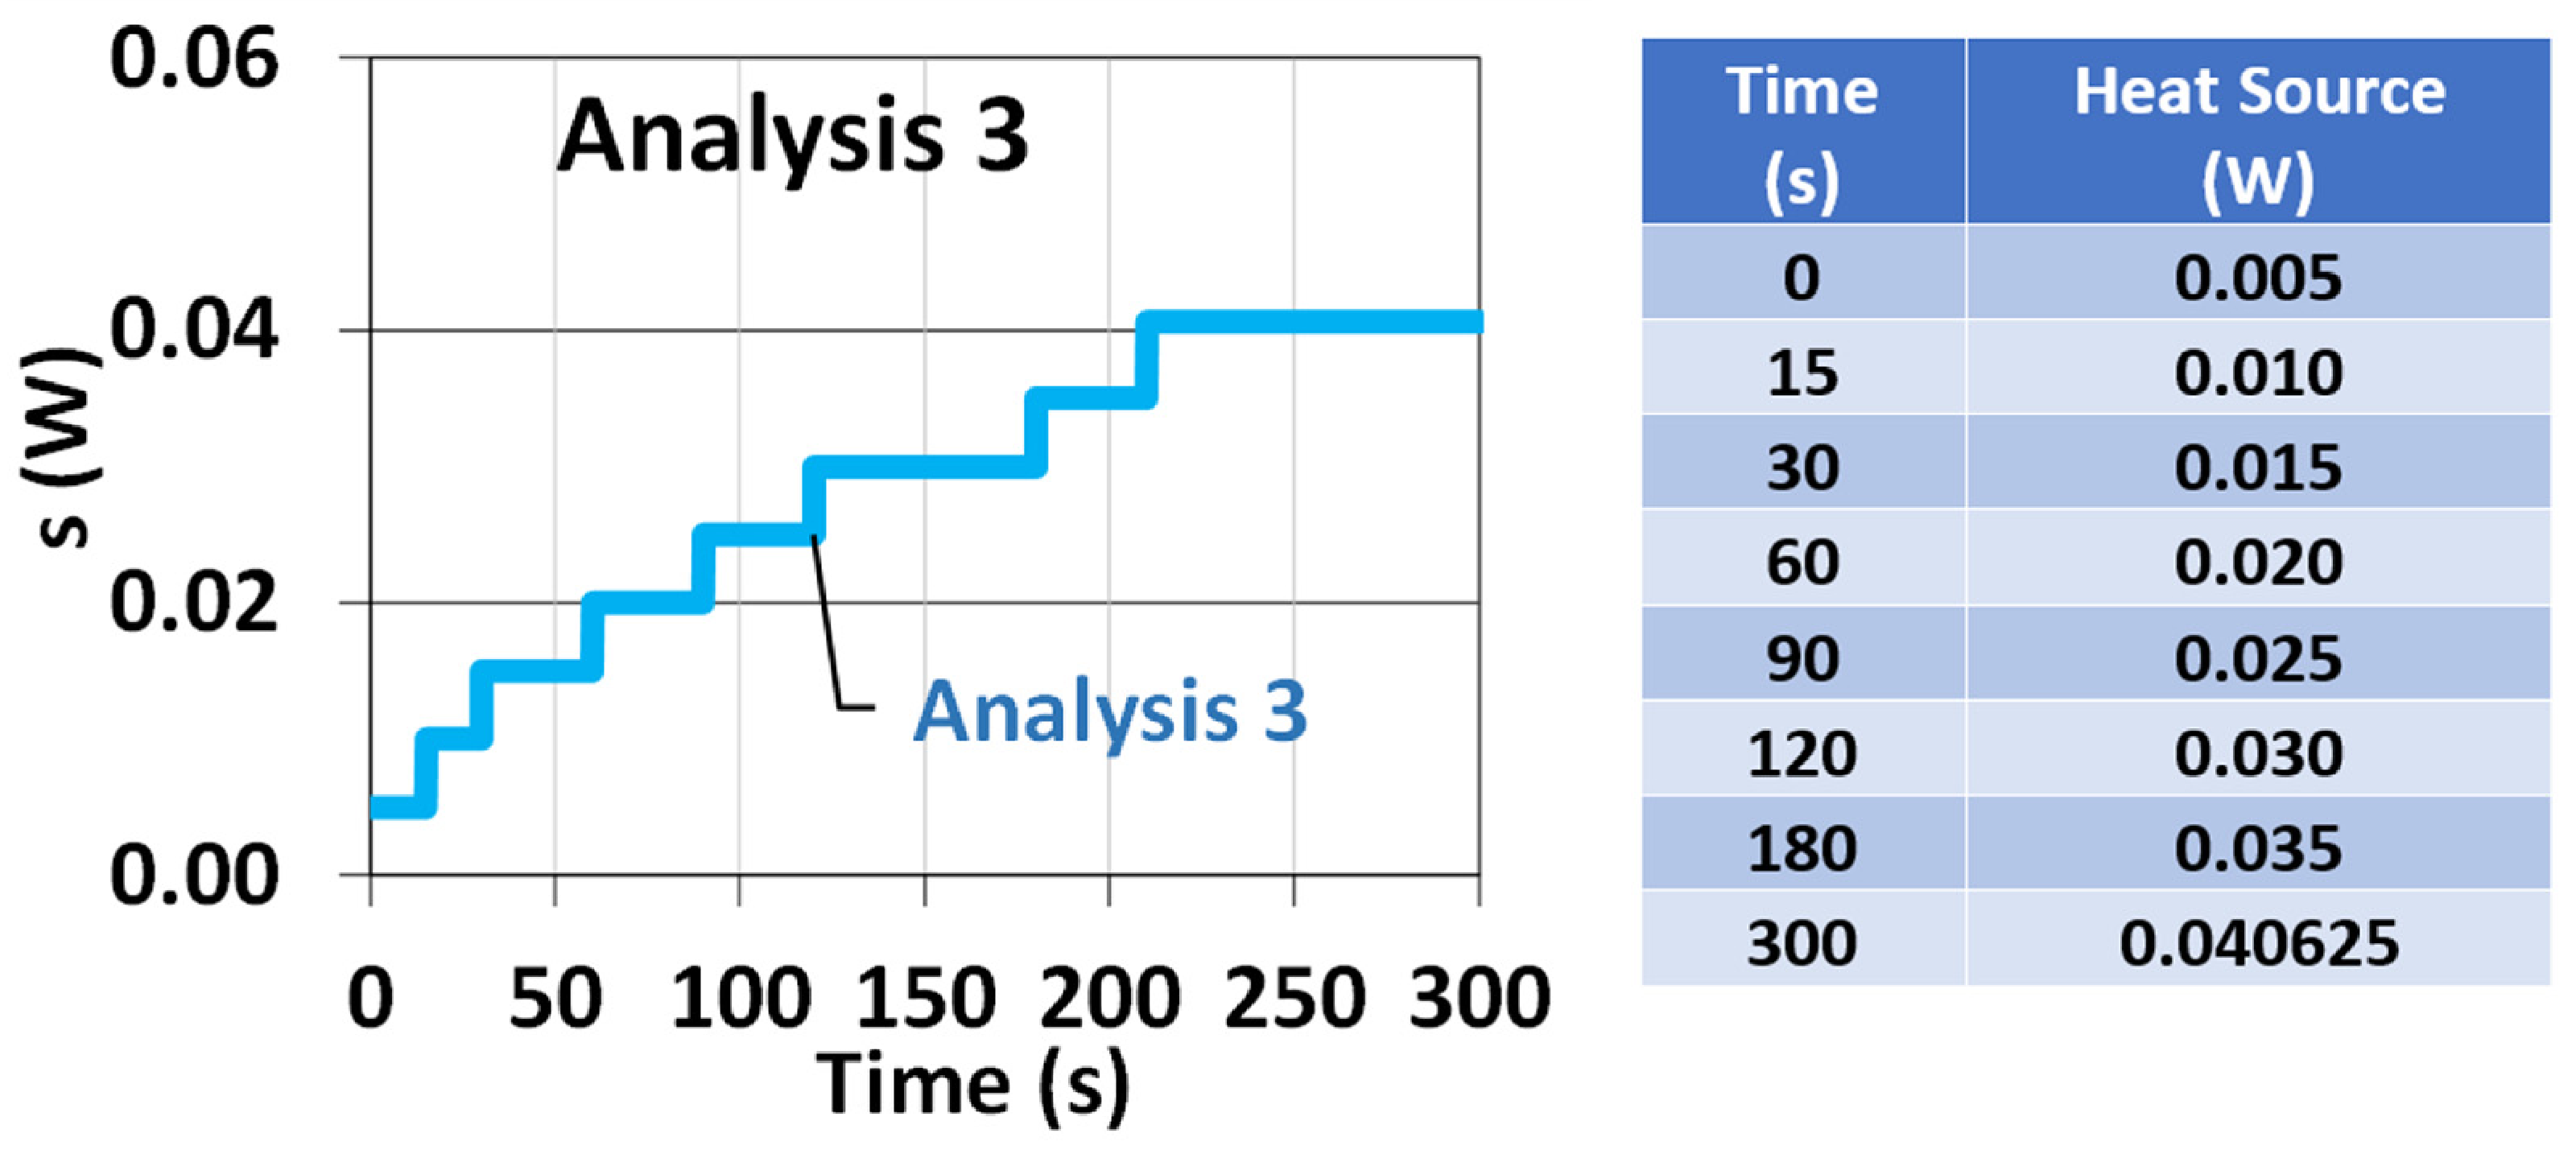
The time average of a piecewise continuous function of the heat source used in the finite element analysis (Figures S2 and S3) to obtain an optimal solution to the photothermal measurement can be calculated as
H e a t   s o r u c e a v e r a g e = 0 300 H e a t   s o r u c e t d t 300 .
Using the piecewise-continuous function shown in Figure 15, the average of the heat source is about 0.028432 W. Since we only use an octant volume of the domain for calculation (Figure S1), the total power absorbed by the whole volume under an 808 nm laser (1 W) irradiation would be eight times larger, that is, 0.22746 W. In other words, the utilization of the laser power absorbed by nanoparticles to heat the water would be around 22.75% (0.22746 W/1 W). In view of such a simplified approximation, this is quite a reasonable estimation when compared to the absorption measured by a UV–visible–NIR spectrometer, in which the ratio of absorption is 1 − (IT/I0) ≈ 1–10(−A) = 1–10(−0.13) = 25.86%.

4.5. Evaluation of Fabricated MoS2 Nanoparticles

We selected exfoliated MoS2 nanoparticles in ethanol as an example for comparison with results from other studies. This selection is based on their higher photothermal heating in DI water (Figure 9b). The comparison includes production yield, particle size, photoluminescence quantum yield, and photothermal effects, as listed in Table 4. Overall, the syntheses of MoS2 nanoparticles conducted in this study are comparable in terms of particle size, exhibit higher photothermal efficiency (as measured in DI water), and consume less energy during exfoliation.

5. Conclusions

An economic, one-pot synthesis of MoS2 nanoparticles at atmospheric pressure was investigated using ultrasonic or thermal exfoliation at 80 °C in three solvents: ethanol (EtOH), N-Methyl-2-pyrrolidone (NMP), and DI water (DIW). The highest production yield of MoS2 nanoparticles is achieved in EtOH by either ultrasound or thermal exfoliation due to the higher solubility of MoS2 (approximately 0.1–5 mg/mL), which leads to a higher exfoliation rate. The UV–visible–NIR spectra of synthesized MoS2 nanoparticles in DI water showed a broad absorption peak around 340 nm due to photon-induced excitons. A smaller, broader absorption peak around 737–776 nm was also observed for samples synthesized in EtOH. This absorption is associated with photothermal excitation. The photoluminescence of MoS2 nanoparticles in DI water exhibited the highest emission intensity, at 440–450 nm, with a shoulder peak around 470 nm upon excitation at 380 nm. This red shift in fluorescence emission indicates a two-stage relaxation of excited electrons after optical absorption. The temperature variation of DI water containing nanoparticles under 808 nm LED laser irradiation can rise to approximately 50 °C in 300 s if MoS2 nanoparticles were synthesized in EtOH. This result is consistent with the broad optical absorption in UV–visible–NIR spectroscopy. The viability of in vitro NIH/3T3 fibroblast cultures indicated that low concentrations (0.0625 and 0.125 mg/mL) of MoS2 nanoparticles synthesized in EtOH by thermal exfoliation are non-toxic or lethargic, allowing for NIH/3T3 fibroblast cell proliferation over 72 h.
In summary, this study reports a scalable, one-pot synthesis of MoS2 quantum dots under atmospheric conditions, without any intermediate interruptions during exfoliation. Solvent–thermal exfoliation was carried out at 80 °C, resulting in relatively low energy consumption. This temperature range contrasts with many other studies, which are usually conducted at 150 °C to 270 °C in high-pressure autoclaves, making them more scalable and safer for large-scale production. The MoS2 nanoparticles synthesized in ethanol exhibit a unique NIR absorption band, indicating their dual function of photothermal conversion and photoluminescence. Finally, we propose a simple yet effective numerical scheme to determine the heat-source term for finite element simulation of the photothermal test.

Supplementary Materials

The following supporting information can be downloaded at: https://www.mdpi.com/article/10.3390/nano16171058/s1, Finite element analysis for the photothermal test: Figure S1. The geometry of the finite element model; Figure S2. The numerical algorithm for determining the heat source s(t) by a piecewise continuous function. ε is a preset small positive number; Figure S3. The numerical fitting results by the finite element analysis using piecewise continuous functions to approximate the heat source s(t). The calculated temperature is assumed to be at T(r=0, t) and compared with the experimental measurement. The simulation case is for MoS2 nanoparticles exfoliated by ultrasound in ethanol; Figure S4. Temperature distribution from numerical analysis by the finite element analysis using the 3rd piecewise continuous functions in Figure S3. The case is for MoS2 nanoparticles exfoliated by ultrasound in ethanol. Table S1. Thermal Properties of Water for Finite Element Analysis; Fourier Transform Infrared (FTIR) spectroscopy [97,98,99,100,101,102,103,104,105]: Figure S5. FTIR of MoS2 nanoparticles synthesized using different methods and solvents; Table S2. Vibrational modes of major FTIR peaks.

Author Contributions

H.P.Y.: Conceptualization, Data curation, Formal analysis, and Writing—original draft; W.L.: Data curation, Software, Formal analysis, and Writing—original draft; J.-H.H.: Conceptualization, Methodology, Investigation, and Supervision; C.L.: Conceptualization, Methodology, Validation, Project administration, Resources, Supervision, and Writing—review and editing; C.Y.L.: Project administration, Resources, and Supervision; R.S.: Formal analysis and Resources. All authors have read and agreed to the published version of the manuscript.

Funding

This study was supported by the National Science and Technology Council, Taiwan (NSTC 113-2622-E-A49-012, NSTC 114-2221-E-A49-050-MY2), Taiwan Semiconductor Research Institute grants (JDP114-Y1-021 and JDP113-Y1-093), Taoyuan General Hospital, and the Ministry of Health and Welfare (PTH113060, PTH115066).

Data Availability Statement

The original contributions presented in this study are included in the article/Supplementary Material. Further inquiries can be directed to the corresponding authors.

Acknowledgments

The successful completion of this research was supported by academic resources and research infrastructure provided by the Taiwan Semiconductor Research Institute, National Institutes of Applied Research. We hereby express our sincere gratitude. Material characterization was conducted at the core facilities of National Yang Ming Chiao Tung University.

Conflicts of Interest

The authors declare no conflicts of interest.

References

  1. Mitchell, P.C.H.; Outteridge, T.; Kloska, K.; McMahon, S.; Epshteyn, Y.; Sebenik, R.F.; Burkin, A.R.; Dorfler, R.R.; Laferty, J.M.; Leichtfried, G.; et al. Molybdenum and Molybdenum Compounds. In Ullmann’s Encyclopedia of Industrial Chemistry; Wiley-VCH: Weinheim, Germany, 2020; pp. 1–63. [Google Scholar]
  2. Srivastava, M.; Banerjee, S.; Bairagi, S.; Singh, P.; Kumar, B.; Singh, P.; Kale, R.D.; Mulvihill, D.M.; Ali, S.W. Recent Progress in Molybdenum Disulfide (MoS2) Based Flexible Nanogenerators: An Inclusive Review. Chem. Eng. J. 2024, 480, 147963. [Google Scholar] [CrossRef] [Scilit]
  3. Splendiani, A.; Sun, L.; Zhang, Y.; Li, T.; Kim, J.; Chim, C.Y.; Galli, G.; Wang, F. Emerging Photoluminescence in Monolayer MoS2. Nano Lett. 2010, 10, 1271–1275. [Google Scholar] [CrossRef] [Scilit]
  4. Wu, F.Y.; Cheng, Y.S.; Wang, D.M.; Li, M.L.; Lu, W.S.; Xu, X.Y.; Zhou, X.H.; Wei, X.W. Nitrogen-Doped MoS2 Quantum Dots: Facile Synthesis and Application for the Assay of Hematin in Human Blood. Mater. Sci. Eng. C 2020, 112, 110898. [Google Scholar] [CrossRef] [Scilit]
  5. Thomas, N.; Mathew, S.; Nair, K.M.; O’Dowd, K.; Forouzandeh, P.; Goswami, A.; McGranaghan, G.; Pillai, S.C. 2D MoS2: Structure, Mechanisms, and Photocatalytic Applications. Mater. Today Sustain. 2021, 13, 100073. [Google Scholar] [CrossRef] [Scilit]
  6. Obodo, P.C.; Obodo, K.O.; Aigbe, U.O.; Aigbodion, V. Recent Advances in Molybdenum Disulfide (MoS2) and MXene-based Heterostructures for Photovoltaic and Water Splitting Applications: A Review. ChemistrySelect 2025, 10, e202404995. [Google Scholar] [CrossRef] [Scilit]
  7. Zhang, L.; Wang, N.; Li, Y. Design, Synthesis, and Application of Some Two-Dimensional Materials. Chem. Sci. 2023, 14, 5266–5290. [Google Scholar] [CrossRef] [Scilit]
  8. Fang, C.; Wu, X.; Yang, F.; Qiao, R. Flow of Quasi-Two Dimensional Water in Graphene Channels. J. Chem. Phys. 2018, 148, 064702. [Google Scholar] [CrossRef] [Scilit]
  9. Komsa, H.-P.; Krasheninnikov, A.V. Effects of Confinement and Environment on the Electronic Structure and Exciton Binding Energy of MoS2 from First Principles. Phys. Rev. B 2012, 86, 241201. [Google Scholar] [CrossRef] [Scilit]
  10. Gan, Z.X.; Liu, L.Z.; Wu, H.Y.; Hao, Y.L.; Shan, Y.; Wu, X.L.; Chu, P.K. Quantum Confinement Effects across Two-Dimensional Planes in MoS2 Quantum Dots. Appl. Phys. Lett. 2015, 106, 233113. [Google Scholar] [CrossRef] [Scilit]
  11. Kuc, A.; Zibouche, N.; Heine, T. Influence of Quantum Confinement on the Electronic Structure of the Transition Metal Sulfide TS2. Phys. Rev. B 2011, 83, 245213. [Google Scholar] [CrossRef] [Scilit]
  12. Jiang, J.; Chen, Z.; Hu, Y.; Xiang, Y.; Zhang, L.; Wang, Y.; Wang, G.C.; Shi, J. Flexo-Photovoltaic Effect in MoS2. Nat. Nanotechnol. 2021, 16, 894–901. [Google Scholar] [CrossRef] [Scilit]
  13. Guo, Y.; Li, J. MoS2 Quantum Dots: Synthesis, Properties and Biological Applications. Mater. Sci. Eng. C 2020, 109, 110511. [Google Scholar] [CrossRef] [Scilit]
  14. Sinha, S.S.; Yadgarov, L.; Aliev, S.B.; Feldman, Y.; Pinkas, I.; Chithaiah, P.; Ghosh, S.; Idelevich, A.; Zak, A.; Tenne, R. MoS2 and WS2 Nanotubes: Synthesis, Structural Elucidation, and Optical Characterization. J. Phys. Chem. C 2021, 125, 6324–6340. [Google Scholar] [CrossRef] [Scilit]
  15. García de Arquer, F.P.; Talapin, D.V.; Klimov, V.I.; Arakawa, Y.; Bayer, M.; Sargent, E.H. Semiconductor Quantum Dots: Technological Progress and Future Challenges. Science 2021, 373, eaaz8541. [Google Scholar] [CrossRef] [Scilit]
  16. Lims, S.C.; Tran, N.A.; Dao, V.-D.; Pham, P.V. The World of Quantum Dot-Shaped Nanoparticles: Nobel Prize in Chemistry 2023: Advancements and Prospectives. Coord. Chem. Rev. 2025, 528, 216423. [Google Scholar] [CrossRef] [Scilit]
  17. Chen, L.; Chuang, Y.; Chen, C.-W.; Dong, C.-D. Facile Synthesis of MoS2/ZnO Quantum Dots for Enhanced Visible-Light Photocatalytic Performance and Antibacterial Applications. Nano-Struct. Nano-Objects 2022, 30, 100873. [Google Scholar] [CrossRef] [Scilit]
  18. Chen, X.; Park, Y.J.; Kang, M.; Kang, S.K.; Koo, J.; Shinde, S.M.; Shin, J.; Jeon, S.; Park, G.; Yan, Y.; et al. CVD-Grown Monolayer MoS2 in Bioabsorbable Electronics and Biosensors. Nat. Commun. 2018, 9, 1690. [Google Scholar] [CrossRef] [Scilit]
  19. Neacșa, A.; Ramadan, I.N.; Diniță, A.; Iacob, Ș.V.; Ilincă, C.N.; Laudacescu, E.V. Can Non-Phase-Transformation Heat Treatments Improve the Strength Properties of Materials? Materials 2025, 18, 1599. [Google Scholar] [CrossRef] [Scilit]
  20. Said, Z.; Pandey, A.K.; Tiwari, A.K.; Kalidasan, B.; Jamil, F.; Thakur, A.K.; Tyagi, V.V.; Sarı, A.; Ali, H.M. Nano-Enhanced Phase Change Materials: Fundamentals and Applications. Prog. Energy Combust. Sci. 2024, 104, 101162. [Google Scholar] [CrossRef] [Scilit]
  21. Hu, L.; Zhao, Q.; Huang, S.; Zheng, J.; Guan, X.; Patterson, R.; Kim, J.; Shi, L.; Lin, C.-H.; Lei, Q.; et al. Flexible and Efficient Perovskite Quantum Dot Solar Cells via Hybrid Interfacial Architecture. Nat. Commun. 2021, 12, 466. [Google Scholar] [CrossRef] [Scilit]
  22. Shilpa, G.; Kumar, P.M.; Kumar, D.K.; Deepthi, P.R.; Sadhu, V.; Sukhdev, A.; Kakarla, R.R. Recent Advances in the Development of High Efficiency Quantum Dot Sensitized Solar Cells (QDSSCs): A Review. Mater. Sci. Energy Technol. 2023, 6, 533–546. [Google Scholar] [CrossRef] [Scilit]
  23. Murphy, C.J. Peer Reviewed: Optical Sensing with Quantum Dots. Anal. Chem. 2002, 74, 520A–526A. [Google Scholar] [CrossRef] [Scilit]
  24. Lesiak, A.; Drzozga, K.; Cabaj, J.; Bański, M.; Malecha, K.; Podhorodecki, A. Optical Sensors Based on II-VI Quantum Dots. Nanomaterials 2019, 9, 192. [Google Scholar] [CrossRef] [Scilit]
  25. Engström, O.; Kaniewska, M. Deep Level Transient Spectroscopy in Quantum Dot Characterization. Nanoscale Res. Lett. 2008, 3, 179. [Google Scholar] [CrossRef] [Scilit]
  26. Oksanen, J.; Prunnila, M. Thermal Management in Quantum-Dot LEDs through Optical Thermodynamics. Joule 2023, 7, 2206–2208. [Google Scholar] [CrossRef] [Scilit]
  27. Yan, Y.; Gong, J.; Chen, J.; Zeng, Z.; Huang, W.; Pu, K.; Liu, J.; Chen, P. Recent Advances on Graphene Quantum Dots: From Chemistry and Physics to Applications. Adv. Mater. 2019, 31, e1808283. [Google Scholar] [CrossRef] [Scilit]
  28. Zare, I.; Zahed Nasab, S.; Rahi, A.; Ghaee, A.; Koohkhezri, M.; Ramezani Farani, M.; Madadi Gholipour, H.; Atabaki, A.H.; Hamblin, M.R.; Mostafavi, E.; et al. Antibacterial Carbon Materials-Based Quantum Dots: From Synthesis Strategies to Antibacterial Properties for Diagnostic and Therapeutic Applications in Wound Healing. Coord. Chem. Rev. 2025, 522, 216211. [Google Scholar] [CrossRef] [Scilit]
  29. Dong, X.; Liang, W.; Meziani, M.J.; Sun, Y.-P.; Yang, L. Carbon Dots as Potent Antibacterial Agents. Theranostics 2020, 10, 671–686. [Google Scholar] [CrossRef] [Scilit]
  30. Seth, S.; Karthikeyan; Rathinasabapathi, P.; Selvarajan, E.; Samuel, M.S.; Chandrasekar, N.; Balaji, R. Quantum Dots as Antibacterial Agents. In Carbon and Graphene Quantum Dots for Biomedical Applications; Woodhead Publishing: Cambridge, UK, 2023; pp. 119–128. [Google Scholar] [CrossRef] [Scilit]
  31. Montazer, L.; Mahani, M.; Khakbaz, F.; Divsar, F.; Yoosefian, M. Carbon Quantum Dots and Gold Nanostructures on Photothermal Therapy for Cancer Treatment. J. Photochem. Photobiol. A Chem. 2024, 450, 115443. [Google Scholar] [CrossRef] [Scilit]
  32. Dar, M.S.; Tabish, T.A.; Thorat, N.D.; Swati, G.; Sahu, N.K. Photothermal Therapy Using Graphene Quantum Dots. APL Bioeng. 2023, 7, 031502. [Google Scholar] [CrossRef] [Scilit]
  33. Pareek, A.; Kumar, D.; Pareek, A.; Gupta, M.M. Advancing Cancer Therapy with Quantum Dots and Other Nanostructures: A Review of Drug Delivery Innovations, Applications, and Challenges. Cancers 2025, 17, 878. [Google Scholar] [CrossRef] [Scilit]
  34. Li, B.; Jiang, L.; Li, X.; Ran, P.; Zuo, P.; Wang, A.; Qu, L.; Zhao, Y.; Cheng, Z.; Lu, Y. Preparation of Monolayer MoS2 Quantum Dots Using Temporally Shaped Femtosecond Laser Ablation of Bulk MoS2 Targets in Water. Sci. Rep. 2017, 7, 11182. [Google Scholar] [CrossRef] [Scilit]
  35. Liu, Q.; Hu, C.; Wang, X. A Facile One-Step Method to Produce MoS2 Quantum Dots as Promising Bio-Imaging Materials. RSC Adv. 2016, 6, 25605–25610. [Google Scholar] [CrossRef] [Scilit]
  36. Wu, J.-Y.; Zhang, X.-Y.; Ma, X.-D.; Qiu, Y.-P.; Zhang, T. High Quantum-Yield Luminescent MoS2 Quantum Dots with Variable Light Emission Created via Direct Ultrasonic Exfoliation of MoS2 Nanosheets. RSC Adv. 2015, 5, 95178–95182. [Google Scholar] [CrossRef] [Scilit]
  37. Agarwal, K.; Rai, H.; Mondal, S. Quantum Dots: An Overview of Synthesis, Properties, and Applications. Mater. Res. Express 2023, 10, 062001. [Google Scholar] [CrossRef] [Scilit]
  38. Jalali, H.B.; Sadeghi, S.; Dogru Yuksel, I.B.; Onal, A.; Nizamoglu, S. Past, Present and Future of Indium Phosphide Quantum Dots. Nano Res. 2022, 15, 4468–4489. [Google Scholar] [CrossRef] [Scilit]
  39. Chen, Z.; Zhao, C.; Zhou, X.; Xiao, L.; Li, Z.; Zhang, Y. A Review of Top-Down Strategies for the Production of Quantum-Sized Materials. Small Sci. 2023, 3, 2300086. [Google Scholar] [CrossRef] [Scilit]
  40. Chatterjee, S.; Maitra, U. In Situ Formation of Luminescent CdSe QDs in a Metallohydrogel: A Strategy towards Synthesis, Isolation, Storage and Re-Dispersion of the QDs. Nanoscale 2017, 9, 13820–13827. [Google Scholar] [CrossRef] [Scilit]
  41. Guo, Y.; Zhang, L.; Zhang, S.; Yang, Y.; Chen, X.; Zhang, M. Fluorescent Carbon Nanoparticles for the Fluorescent Detection of Metal Ions. Biosens. Bioelectron. 2015, 63, 61–71. [Google Scholar] [CrossRef] [Scilit]
  42. Häckl, K.; Kunz, W. Some Aspects of Green Solvents. C. R. Chim. 2018, 21, 572–580. [Google Scholar] [CrossRef] [Scilit]
  43. Winterton, N. The Green Solvent: A Critical Perspective. Clean Technol. Environ. Policy 2021, 23, 2499–2522. [Google Scholar] [CrossRef] [Scilit]
  44. Cvjetko Bubalo, M.; Vidović, S.; Radojčić Redovniković, I.; Jokić, S. Green Solvents for Green Technologies. Clean Technol. Environ. Policy 2015, 90, 1631–1639. [Google Scholar] [CrossRef] [Scilit]
  45. Sim, D.M.; Han, H.J.; Yim, S.; Choi, M.-J.; Jeon, J.; Jung, Y.S. Long-Term Stable 2H-MoS2 Dispersion: Critical Role of Solvent for Simultaneous Phase Restoration and Surface Functionalization of Liquid-Exfoliated MoS2. ACS Omega 2017, 2, 4678–4687. [Google Scholar] [CrossRef] [Scilit]
  46. Kaushik, S.; Nemala, S.S.; Kumar, M.; Negi, D.; Dhal, B.; Saini, L.; Banavath, R.; Saha, S.; Sharma, S.; Kalon, G. High-Yield Exfoliation of MoS2 Nanosheets by a Novel Spray Technique and the Importance of Soaking and Surfactants. Nano-Struct. Nano-Objects 2022, 32, 100922. [Google Scholar] [CrossRef] [Scilit]
  47. O’Neill, A.; Khan, U.; Coleman, J.N. Preparation of High Concentration Dispersions of Exfoliated MoS2 with Increased Flake Size. Chem. Mater. 2012, 24, 2414–2421. [Google Scholar] [CrossRef] [Scilit]
  48. Wang, H.; Chen, B.; Zhang, X.; Liu, S.; Zhu, B.; Wang, J.; Wu, K.; Chen, J. Ethanol Catalytic Deposition of MoS2 on Tapered Fiber. Photonics Res. 2015, 3, A102. [Google Scholar] [CrossRef] [Scilit]
  49. Huang, H.; Liu, N.; Wang, X.; Zhong, M.; Huang, X. Application of Hydrothermal and Solvothermal Method in Synthesis of MoS2. Rev. Chim. 2022, 73, 26–35. [Google Scholar] [CrossRef] [Scilit]
  50. Li, Z.; Fan, R.; Hu, Z.; Li, W.; Zhou, H.; Kang, S.; Zhang, Y.; Zhang, H.; Wang, G. Ethanol Introduced Synthesis of Ultrastable 1T-MoS2 for Removal of Cr(VI). J. Hazard. Mater. 2020, 394, 122525. [Google Scholar] [CrossRef] [Scilit]
  51. Varrla, E.; Backes, C.; Paton, K.R.; Harvey, A.; Gholamvand, Z.; McCauley, J.; Coleman, J.N. Large-Scale Production of Size-Controlled MoS2 Nanosheets by Shear Exfoliation. Chem. Mater. 2015, 27, 1129–1139. [Google Scholar] [CrossRef] [Scilit]
  52. Smith, R.J.; King, P.J.; Lotya, M.; Wirtz, C.; Khan, U.; De, S.; O’Neill, A.; Duesberg, G.S.; Grunlan, J.C.; Moriarty, G.; et al. Large-Scale Exfoliation of Inorganic Layered Compounds in Aqueous Surfactant Solutions. Adv. Mater. 2011, 23, 3944–3948. [Google Scholar] [CrossRef] [Scilit]
  53. Yao, Y.; Lin, Z.; Li, Z.; Song, X.; Moon, K.-S.; Wong, C. Large-Scale Production of Two-Dimensional Nanosheets. J. Mater. Chem. 2012, 22, 13494. [Google Scholar] [CrossRef] [Scilit]
  54. Museux, N.; Perez, L.; Autrique, L.; Agay, D. Skin Burns after Laser Exposure: Histological Analysis and Predictive Simulation. Burns 2012, 38, 658–667. [Google Scholar] [CrossRef] [Scilit]
  55. Svobodova, B.; Kloudova, A.; Ruzicka, J.; Kajtmanova, L.; Navratil, L.; Sedlacek, R.; Suchy, T.; Jhanwar-Uniyal, M.; Jendelova, P.; Machova Urdzikova, L. The Effect of 808 Nm and 905 Nm Wavelength Light on Recovery after Spinal Cord Injury. Sci. Rep. 2019, 9, 7660. [Google Scholar] [CrossRef] [Scilit]
  56. Mitchell, U.H.; Myrer, J.W.; Johnson, A.W.; Hilton, S.C. Restless Legs Syndrome and Near-Infrared Light: An Alternative Treatment Option. Physiother. Theory Pract. 2011, 27, 345–351. [Google Scholar] [CrossRef] [Scilit]
  57. Rojas, J.C.; Gonzalez-Lima, F. Low-Level Light Therapy of the Eye and Brain. Eye Brain 2011, 3, 49. [Google Scholar] [CrossRef] [Scilit]
  58. Zhang, R.; Qu, J. The Mechanisms and Efficacy of Photobiomodulation Therapy for Arthritis: A Comprehensive Review. Int. J. Mol. Sci. 2023, 24, 14293. [Google Scholar] [CrossRef] [Scilit]
  59. Dompe, C.; Moncrieff, L.; Matys, J.; Grzech-Leśniak, K.; Kocherova, I.; Bryja, A.; Bruska, M.; Dominiak, M.; Mozdziak, P.; Skiba, T.; et al. Photobiomodulation—Underlying Mechanism and Clinical Applications. J. Clin. Med. 2020, 9, 1724. [Google Scholar] [CrossRef] [Scilit]
  60. Ruokolainen, J.; Malinen, M.; Råback, P.; Zwinger, T.; Takala, E.; Kataja, J.; Gillet-Chaulet, F.; Ilvonen, S.; Gladstone, R.; Byckling, M.; et al. ElmerCSC/Elmerfem: Elmer 9.0; Zenodo: Genève, Switzerland, 2023. [Google Scholar]
  61. Liu, Y.; Zhong, Q.; Chen, K.; Zhou, J.; Yang, X.; Chen, W. Morphologies Controllable Synthesis of MoS2 by Hot-Injection Method: From Quantum Dots to Nanosheets. J. Mater. Sci. Mater. Electron. 2017, 28, 13633–13637. [Google Scholar] [CrossRef] [Scilit]
  62. Kariachan, S.; Shibu, J.; Velayudhan, P.; Sidharthan, S.K.; Velayudhan, P.; Simon, S.M.; Kasai, H.; Okubo, K.; Thomas, S.; Oka, K.; et al. Exploring the Advances in 2D Materials as a Quest for Energy Storage Electrode Materials. RSC Adv. 2026, 16, 10847–10886. [Google Scholar] [CrossRef] [Scilit]
  63. Yi, S.; Babadagli, T.; Li, H. Stabilization of Nickel Nanoparticle Suspensions with the Aid of Polymer and Surfactant: Static Bottle Tests and Dynamic Micromodel Flow Tests. Pet. Sci. 2020, 17, 1014–1024. [Google Scholar] [CrossRef] [Scilit]
  64. Chikan, V.; Kelley, D.F. Size-Dependent Spectroscopy of MoS2 Nanoclusters. J. Phys. Chem. B 2002, 106, 3794–3804. [Google Scholar] [CrossRef] [Scilit]
  65. Song, C.; Wang, Z.; Yin, Z.; Xiao, D.; Ma, D. Principles and Applications of Photothermal Catalysis. Chem Catal. 2022, 2, 52–83. [Google Scholar] [CrossRef] [Scilit]
  66. Fu, Y.; Liang, F.; He, C.; Yu, H.; Zhang, H.; Chen, Y.-F. Photon-Phonon Collaboratively Pumped Laser. Nat. Commun. 2023, 14, 8110. [Google Scholar] [CrossRef] [Scilit]
  67. Cao, H.; Wang, H.; Huang, Y.; Sun, Y.; Shi, S.; Tang, M. Quantification of Gold(III) in Solution and with a Test Stripe via the Quenching of the Fluorescence of Molybdenum Disulfide Quantum Dots. Microchim. Acta 2017, 184, 91–100. [Google Scholar] [CrossRef] [Scilit]
  68. Ryou, J.; Kim, Y.-S.; KC, S.; Cho, K. Monolayer MoS2 Bandgap Modulation by Dielectric Environments and Tunable Bandgap Transistors. Sci. Rep. 2016, 6, 29184. [Google Scholar] [CrossRef] [Scilit]
  69. Kobayashi, K.; Yamauchi, J. Electronic Structure and Scanning-Tunneling-Microscopy Image of Molybdenum Dichalcogenide Surfaces. Phys. Rev. B 1995, 51, 17085–17095. [Google Scholar] [CrossRef] [Scilit]
  70. Yun, W.S.; Han, S.W.; Hong, S.C.; Kim, I.G.; Lee, J.D. Thickness and Strain Effects on Electronic Structures of Transition Metal Dichalcogenides: 2H-MX2 Semiconductors (M = Mo, W; X = S, Se, Te). Phys. Rev. B 2012, 85, 033305. [Google Scholar] [CrossRef] [Scilit]
  71. Cheiwchanchamnangij, T.; Lambrecht, W.R.L. Quasiparticle Band Structure Calculation of Monolayer, Bilayer, and Bulk MoS2. Phys. Rev. B 2012, 85, 205302. [Google Scholar] [CrossRef] [Scilit]
  72. Qiu, D.Y.; da Jornada, F.H.; Louie, S.G. Optical Spectrum of MoS2: Many-Body Effects and Diversity of Exciton States. Phys. Rev. Lett. 2013, 111, 216805. [Google Scholar] [CrossRef] [Scilit]
  73. Gupta, A.; Arunachalam, V.; Vasudevan, S. Liquid-Phase Exfoliation of MoS2 Nanosheets: The Critical Role of Trace Water. J. Phys. Chem. Lett. 2016, 7, 4884–4890. [Google Scholar] [CrossRef] [Scilit]
  74. Chen, P.-C.; Lin, C.-P.; Hong, C.-J.; Yang, C.-H.; Lin, Y.-Y.; Li, M.-Y.; Li, L.-J.; Yu, T.-Y.; Su, C.-J.; Li, K.-S.; et al. Effective N-Methyl-2-Pyrrolidone Wet Cleaning for Fabricating High-Performance Monolayer MoS2 Transistors. Nano Res. 2019, 12, 303–308. [Google Scholar] [CrossRef] [Scilit]
  75. Kira, M.; Jahnke, F.; Koch, S.W. Quantum Theory of Secondary Emission in Optically Excited Semiconductor Quantum Wells. Phys. Rev. Lett. 1999, 82, 3544–3547. [Google Scholar] [CrossRef] [Scilit]
  76. Faraji, M.; Yamini, Y.; Salehi, N. Characterization of Magnetic Nanomaterials. In Magnetic Nanomaterials in Analytical Chemistry; Elsevier: Amsterdam, The Netherlands, 2021; pp. 39–60. [Google Scholar]
  77. Wang, Y.; Dou, W. Interband and Intraband Transitions, as Well as Charge Mobility in Driven Two-Band Model with Electron Phonon Coupling. J. Chem. Phys. 2024, 116, 204104. [Google Scholar] [CrossRef] [Scilit]
  78. Vlasenko, N.A. Momentum Relaxation of Hot Electrons during Radiative Intraband Indirect Transitions in ZnS:Cr. Semicond. Phys. Quantum Electron. Optoelectron. 2005, 8, 25–29. [Google Scholar] [CrossRef] [Scilit]
  79. Hari Krishna, P.; Ramrakhiani, M. Nano Particle Size Effect on Photo-Luminescence. Int. J. Nanotechnol. Appl. 2010, 4, 13–19. [Google Scholar] [CrossRef] [Scilit]
  80. Wu, X.; Suo, Y.; Shi, H.; Liu, R.; Wu, F.; Wang, T.; Ma, L.; Liu, H.; Cheng, Z. Deep-Tissue Photothermal Therapy Using Laser Illumination at NIR-IIa Window. Nano-Micro Lett. 2020, 12, 38. [Google Scholar] [CrossRef] [Scilit]
  81. Jiang, Q.; Zeng, W.; Zhang, C.; Meng, Z.; Wu, J.; Zhu, Q.; Wu, D.; Zhu, H. Broadband Absorption and Enhanced Photothermal Conversion Property of Octopod-like Ag@Ag2S Core@shell Structures with Gradually Varying Shell Thickness. Sci. Rep. 2017, 7, 17782. [Google Scholar] [CrossRef] [Scilit]
  82. Marinov, A.D.; Clancy, A.J.; Howard, C.A.; Cullen, P.L. XPS Peak-Fitting of 2H MoS2, 1T MoS2, and MoS2-X Nanosheets in MoS2 Powders and Battery Electrodes After Ar+ Ion Depth-Profiling. ACS Appl. Nano Mater. 2026, 9, 1183–1194. [Google Scholar] [CrossRef] [Scilit]
  83. Munusami, V.; Arutselvan, K.; Vadivel, S.; Govindasamy, S. High Sensitivity LPG and H2 Gas Sensing Behavior of MoS2/Graphene Hybrid Sensors Prepared by Facile Hydrothermal Method. Ceram. Int. 2022, 48, 29322–29331. [Google Scholar] [CrossRef] [Scilit]
  84. Bao, Y.; Yang, M.; Tan, S.J.R.; Liu, Y.P.; Xu, H.; Liu, W.; Nai, C.T.; Feng, Y.P.; Lu, J.; Loh, K.P. Substoichiometric Molybdenum Sulfide Phases with Catalytically Active Basal Planes. J. Am. Chem. Soc. 2016, 138, 14121–14128. [Google Scholar] [CrossRef] [Scilit]
  85. Menzel, J.P.; Noble, B.B.; Blinco, J.P.; Barner-Kowollik, C. Predicting Wavelength-Dependent Photochemical Reactivity and Selectivity. Nat. Commun. 2021, 12, 1691. [Google Scholar] [CrossRef] [Scilit]
  86. Drozd, G.T.; Weltzin, T.; Skiffington, S.; Lee, D.; Valiev, R.; Kurtén, T.; Madison, L.R.; He, Y.; Gargano, L. Wavelength-Resolved Quantum Yields for Vanillin Photochemistry: Self-Reaction and Ionic-Strength Implications for Wildfire Brown Carbon Lifetime. Environ. Sci. Atmos. 2024, 4, 509–518. [Google Scholar] [CrossRef] [Scilit]
  87. Maafi, M. On Photokinetics under Polychromatic Light. Front. Chem. 2024, 12, 1367276. [Google Scholar] [CrossRef] [Scilit]
  88. Porrès, L.; Holland, A.; Pålsson, L.O.; Monkman, A.P.; Kemp, C.; Beeby, A. Absolute Measurements of Photoluminescence Quantum Yields of Solutions Using an Integrating Sphere. J. Fluoresc. 2006, 16, 267–273. [Google Scholar] [CrossRef] [Scilit]
  89. Greenham, N.C.; Samuel, I.D.W.; Hayes, G.R.; Phillips, R.T.; Kessener, Y.A.R.R.; Moratti, S.C.; Holmes, A.B.; Friend, R.H. Measurement of Absolute Photoluminescence Quantum Efficiencies in Conjugated Polymers. Chem. Phys. Lett. 1995, 241, 89–96. [Google Scholar] [CrossRef] [Scilit]
  90. De Mello, J.C.; Wittmann, H.F.; Friend, R.H. An Improved Experimental Determination of External Photoluminescence Quantum Efficiency. Adv. Mater. 1997, 9, 230–232. [Google Scholar] [CrossRef] [Scilit]
  91. Xie, L.; Yang, Y.; Gong, G.; Feng, S.; Liu, D. One-Step Hydrothermal Synthesis of Highly Fluorescent MoS2 Quantum Dots for Lead Ion Detection in Aqueous Solutions. Nanomaterials 2022, 12, 3329. [Google Scholar] [CrossRef] [Scilit]
  92. Zhou, K.; Zhang, Y.; Xia, Z.; Wei, W. As-Prepared MoS2 Quantum Dot as a Facile Fluorescent Probe for Long-Term Tracing of Live Cells. Nanotechnology 2016, 27, 275101. [Google Scholar] [CrossRef] [Scilit]
  93. Wang, Y.; Liu, Y.; Zhang, J.; Wu, J.; Xu, H.; Wen, X.; Zhang, X.; Tiwary, C.S.; Yang, W.; Vajtai, R.; et al. Cryo-Mediated Exfoliation and Fracturing of Layered Materials into 2D Quantum Dots. Sci. Adv. 2017, 3, e1701500. [Google Scholar] [CrossRef] [Scilit]
  94. Marqus, S.; Ahmed, H.; Ahmed, M.; Xu, C.; Rezk, A.R.; Yeo, L.Y. Increasing Exfoliation Yield in the Synthesis of MoS2 Quantum Dots for Optoelectronic and Other Applications through a Continuous Multicycle Acoustomicrofluidic Approach. ACS Appl. Nano Mater. 2018, 1, 2503–2508. [Google Scholar] [CrossRef] [Scilit]
  95. Liu, J.; Cui, E.; Zhang, Q.; Xie, D. MoS2-Based Nanocomposites with High Photothermal Conversion Efficiency for Combinational Photothermal/Photodynamic Tumor Therapy. J. Alloys Compd. 2024, 970, 172489. [Google Scholar] [CrossRef] [Scilit]
  96. Wang, J.; Tan, X.; Pang, X.; Liu, L.; Tan, F.; Li, N. MoS2 Quantum Dot@Polyaniline Inorganic–Organic Nanohybrids for In Vivo Dual-Modal Imaging Guided Synergistic Photothermal/Radiation Therapy. ACS Appl. Mater. Interfaces 2016, 8, 24331–24338. [Google Scholar] [CrossRef] [Scilit]
  97. Ghasemipour, P.; Fattahi, M.; Rasekh, B.; Yazdian, F. Developing the Ternary ZnO Doped MoS2 Nanostructures Grafted on CNT and Reduced Graphene Oxide (RGO) for Photocatalytic Degradation of Aniline. Sci. Rep. 2020, 10, 4414. [Google Scholar] [CrossRef] [Scilit]
  98. Yang, Y.; Yu, Y.; Cui, C.; Liu, X.; Li, Y.; Liu, P.; Hui, F. Interfacial Engineering of MoS2 Thin Films for Wettability-Dependent Resistive Switching and Neuromorphic Behaviors. Nanomaterials 2026, 16, 959. [Google Scholar] [CrossRef] [Scilit]
  99. Shaltout, A.A.; Mostafa, N.Y.; Mahani, R.M.; Ahmed, S.I.; Allam, M.A.; Alzahrani, E.; Wahba, H.H. Investigation of structural and optical properties of molybdenum disulfide flakes/polyvinylidene fluoride nanocomposites. J. Mater. Res. Technol. 2020, 9(6), 14350–14359. [Google Scholar] [CrossRef] [Scilit]
  100. Nadeem, M.T.; Aqeel, R.; Zafar, A.; Nisar, A.; Khan, M.I.; Ahmad, M. Synergic effect of a MoS2–V2O5 heterostructure as an advanced catalyst for photocatalytic degradation of methylene blue. New J. Chem. 2025, 49, 1171–1181. [Google Scholar] [CrossRef] [Scilit]
  101. Rodríguez-Ocanto, N.; González-Gómez, W.S.; Rodríguez-Gattorno, G.; Padron-Hernandez, W.; Ruiz-Gómez, M.A. Sustainable colloidal ink for inkjet printing of 1T/2H-MoS2 based photodetectors on flexible substrate. Mater. Sci. Semicond. Process. 2025, 200, 110019. [Google Scholar] [CrossRef] [Scilit]
  102. Zhao, J.; Zhang, Z.; Yang, S.; Zheng, H.; Li, Y. Facile synthesis of MoS2 nanosheet-silver nanoparticles composite for surface enhanced Raman scattering and electrochemical activity. J. Alloys Compd. 2013, 559, 87–91. [Google Scholar] [CrossRef] [Scilit]
  103. Liu, B.; Ma, Y.; Zhang, A.; Chen, L.; Abbas, A.N.; Liu, Y.; Shen, C.; Wan, H.; Zhou, C. High-Performance WSe2 Field-Effect Transistors via Controlled Formation of In-Plane Heterojunctions. ACS Nano 2016, 10, 5153–5160. [Google Scholar] [CrossRef] [Scilit]
  104. Lalithambika, K.C.; Shanmugapriya, K.; Sriram, S. Photocatalytic activity of MoS2 nanoparticles: An experimental and DFT analysis. Appl. Phys. A 2019, 125, 817. [Google Scholar] [CrossRef] [Scilit]
  105. Yi, M.; Zhang, C. The synthesis of two-dimensional MoS2 nanosheets with enhanced tribological properties as oil additives. RSC Adv. 2018, 8, 9564–9573. [Google Scholar] [CrossRef] [Scilit]
Figure 1. Schematic representation of the setup for the photothermal test of MoS2 nanoparticles in DI water.
Nanomaterials 16 01058 g001
Figure 2. TEM image of MoS2 nanoparticles synthesized using different treatments and solvents; scale bar = 50 nm. (a) ×300K. (b) ×300K. (c) ×300K. (d) ×300K. (e) ×300K. (f) ×300K.
Nanomaterials 16 01058 g002
Figure 3. Size of MoS2 nanoparticles synthesized using different methods (UE: ultrasonic exfoliation; TE: thermal exfoliation) and solvents (EtOH: ethanol; DIW: deionized water; NMP: N-methyl-2-pyrrolidone) from TEM images by ImageJ® (n ≥ 30).
Nanomaterials 16 01058 g003
Figure 4. XRD of MoS2 nanoparticles synthesized using different methods (UE: ultrasonic exfoliation; TE: thermal exfoliation) and solvents (EtOH: ethanol; DIW: deionized water; NMP: N-methyl-2-pyrrolidone).
Nanomaterials 16 01058 g004
Figure 5. Photos of the MoS2 nanoparticles synthesized using different methods and solvents. (a) Day 1 and (b) day > 30; the sediments in DI water are marked with red arrows. (UE: ultrasonic exfoliation; TE: thermal exfoliation; EtOH: ethanol; DIW: deionized water; NMP: N-methyl-2-pyrrolidone).
Nanomaterials 16 01058 g005
Figure 6. XPS of MoS2 nanoparticles synthesized using different methods and solvents. (a) Ultrasound in EtOH; (b) Thermal in EtOH; (c) Ultrasound in DI water; (d) Thermal in DI water; (e) Ultrasound in NMP; (f) Thermal in NMP.
Nanomaterials 16 01058 g006
Figure 7. UV–visible–NIR spectra of MoS2 nanoparticles synthesized using different methods and solvents. (a) Ultrasound in EtOH; (b) Thermal in EtOH; (c) Ultrasound in DI water; (d) Thermal in DI water; (e) Ultrasound in NMP; (f) Thermal in NMP. The estimated minimum energy of optical absorption is defined as the intersection of a linear extrapolation from the absorption edge with the abscissa. A broad absorption around 700 nm is also labeled by green arrows for MoS2 nanoparticles synthesized in ethanol in (a,b).
Nanomaterials 16 01058 g007
Figure 8. Photoluminescence spectra of MoS2 nanoparticles synthesized using different methods and solvents. The wavelength of laser excitation is marked by numbers, and the one that produces the highest overall intensity for each case is marked in red. (a) Ultrasound in EtOH; (b) Thermal in EtOH; (c) Ultrasound in DI water; (d) Thermal in DI water; (e) Ultrasound in NMP; (f) Thermal in NMP.
Nanomaterials 16 01058 g008
Figure 9. Temperature variation of MoS2 nanoparticles dispersed in DI water for different syntheses. The excitation laser wavelength is 808 nm. Exfoliation methods are denoted as either thermal or ultrasound. (a) Ultrasonic exfoliation; (b) Themal exfoliation.
Nanomaterials 16 01058 g009
Figure 10. Viability of NIH/3T3 fibroblasts for in vitro cell culture with MoS2 nanoparticles synthesized in ethanol by heating after (a) 24 h and (b) 72 h of co-culture incubation. (p-value: **: 0.01, *: 0.05, ns: not significant; error bars represent the sample standard deviation, n = 6).
Nanomaterials 16 01058 g010
Figure 11. CFU counting (24 h) against E. coli by MoS2 nanoparticles synthesized using different methods (UE: ultrasonic exfoliation; TE: thermal exfoliation) and solvents (EtOH: ethanol; DIW: deionized water; NMP: N-methyl-2-pyrrolidone). The control group (−) is the culture media with E. coli only, and the positive control (+) is the medium with penicillin–streptomycin. (****: p < 0.0001, ***: p < 0.001; error bars represent the sample standard deviation, n = 3).
Nanomaterials 16 01058 g011
Figure 12. Summary of estimated band gaps in MoS2 nanoparticles synthesized using different exfoliation methods and solvents.
Nanomaterials 16 01058 g012
Figure 13. The spectral quantum yield from photoluminescence for MoS2 nanoparticles synthesized in various solvents and by different exfoliation methods (a) Ultrasound in EtOH; (b) Thermal in EtOH; (c) Ultrasound in DI water; (d) Thermal in DI water; (e) Ultrasound in NMP; (f) Thermal in NMP.
Nanomaterials 16 01058 g013
Figure 14. The quantum yield for specific irradiation laser wavelengths from photoluminescence for MoS2 nanoparticles synthesized in various solvents and by different exfoliation methods.
Nanomaterials 16 01058 g014
Figure 15. A piecewise-continuous representation of the heat source is required for optimal results when comparing finite element analysis with photothermal experimental measurements.
Nanomaterials 16 01058 g015
Table 1. Solvent combinations and exfoliation methods for the experimental design *.
Ethanol
(EtOH)
Deionized Water
(DIW)
N-Methyl-2-Pyrrolidone
(NMP)
Ultrasonication (UE)
(40 kHz ice-bathed, 16 h.)
20 mL20 mL20 mL
Heating (TE)
(80 °C, 16 h.)
20 mL20 mL20 mL
* 200 mg MoS2 nanoparticles (dry mass) were added to all solvents, measured by an analytical balance.
Table 2. The yield of different synthesis methods and solvents for molybdenum disulfide nanoparticles.
SynthesisMoS2 + SolventProduct Weight
(MoS2 Nanoparticles, mg)
Yield Ratio
Ultrasonication (UE)
(40 kHz ice-bathed, 16 h.)
200 mg + EtOH, 20 mL14 mg7.0%
200 mg + DIW, 20 mL9 mg4.5%
200 mg + NMP, 20 mL6 mg3.0%
Heating (TE)
(80 °C, 16 h.)
200 mg + EtOH, 20 mL30 mg15.0%
200 mg + DIW, 20 mL4 mg2.0%
200 mg + NMP, 20 mL3 mg1.5%
Table 3. The zeta potential of MoS2 nanoparticles synthesized using different methods and solvents.
Ethanol
(EtOH)
Deionized Water
(DIW)
N-Methyl-2-Pyrrolidone
(NMP)
Ultrasonication (UE)
(40 kHz ice-bathed, 16 h.)
−28.43 ± 4.15 mV−8.58 ± 2.92 mV26.13 ± 3.21 mV
Heating (TE)
(80 °C, 16 h.)
−24.27 ± 5.26 mV−4.88 ± 0.06 mV41.57 ± 4.61 mV
Table 4. Performance evaluation of MoS2 nanoparticles.
Synthesis MethodSolvent/PrecursorsYield (%)Average Particle Size (nm)PL Quantum Yield (%)Photothermal Performance
(Power Conversion Efficiency (PCE) or ΔT)
Reference
Thermal Exfoliation (TE)Ethanol/MoS2 Powder15%~4.11.55%ΔT ≈ 28.4 °C at 300 s, 1.0 W/cm2; PCE = 25.86%This Work
Ultrasonic Exfoliation (UE)Ethanol/MoS2 Powder7%~4.02.55%ΔT ≈ 28.1 °C at 300 s, 1.0 W/cm2This Work
Chemical–Ultrasonic Exfoliation (40 kHz)NaCl, Na2CO3, LiOH/MoS2 Powder 1.5–74.84% [36]
Hydrothermal SynthesisWater + HCl/(NH4)2MoS4 + GSH 4.420.4% [91]
Chemical–Hydrothermal Exfoliation (Na intercalation)Water/MoS2 Powder + Na sand11%3.511% [92]
Cryo-mediated exfoliationLiquid Nitrogen/MoS2 Powder1%2.510% [93]
Nebulization–Condensation MethodLithium Niobate/MoS2 Powder9.65%8.2510.7% [94]
Solvent–Thermal Method1-Octadecene/(NH4)2MoS4, Oleic Acid, Oleylamine 4.5 nm ΔT ≈ 10.4 °C at 300 s, 1 W/cm2; PCE = 13.18%[95]
Ultrasonic–Thermal Exfoliation (UE)NMP/MoS2 Powder 5.3 nm ΔT ≈ 25 °C at 300 s, 1.5 W/cm2[96]
Disclaimer/Publisher’s Note: The statements, opinions and data contained in all publications are solely those of the individual author(s) and contributor(s) and not of MDPI and/or the editor(s). MDPI and/or the editor(s) disclaim responsibility for any injury to people or property resulting from any ideas, methods, instructions or products referred to in the content.