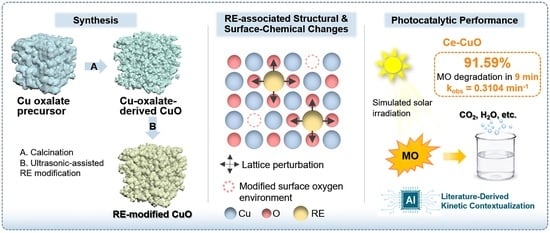
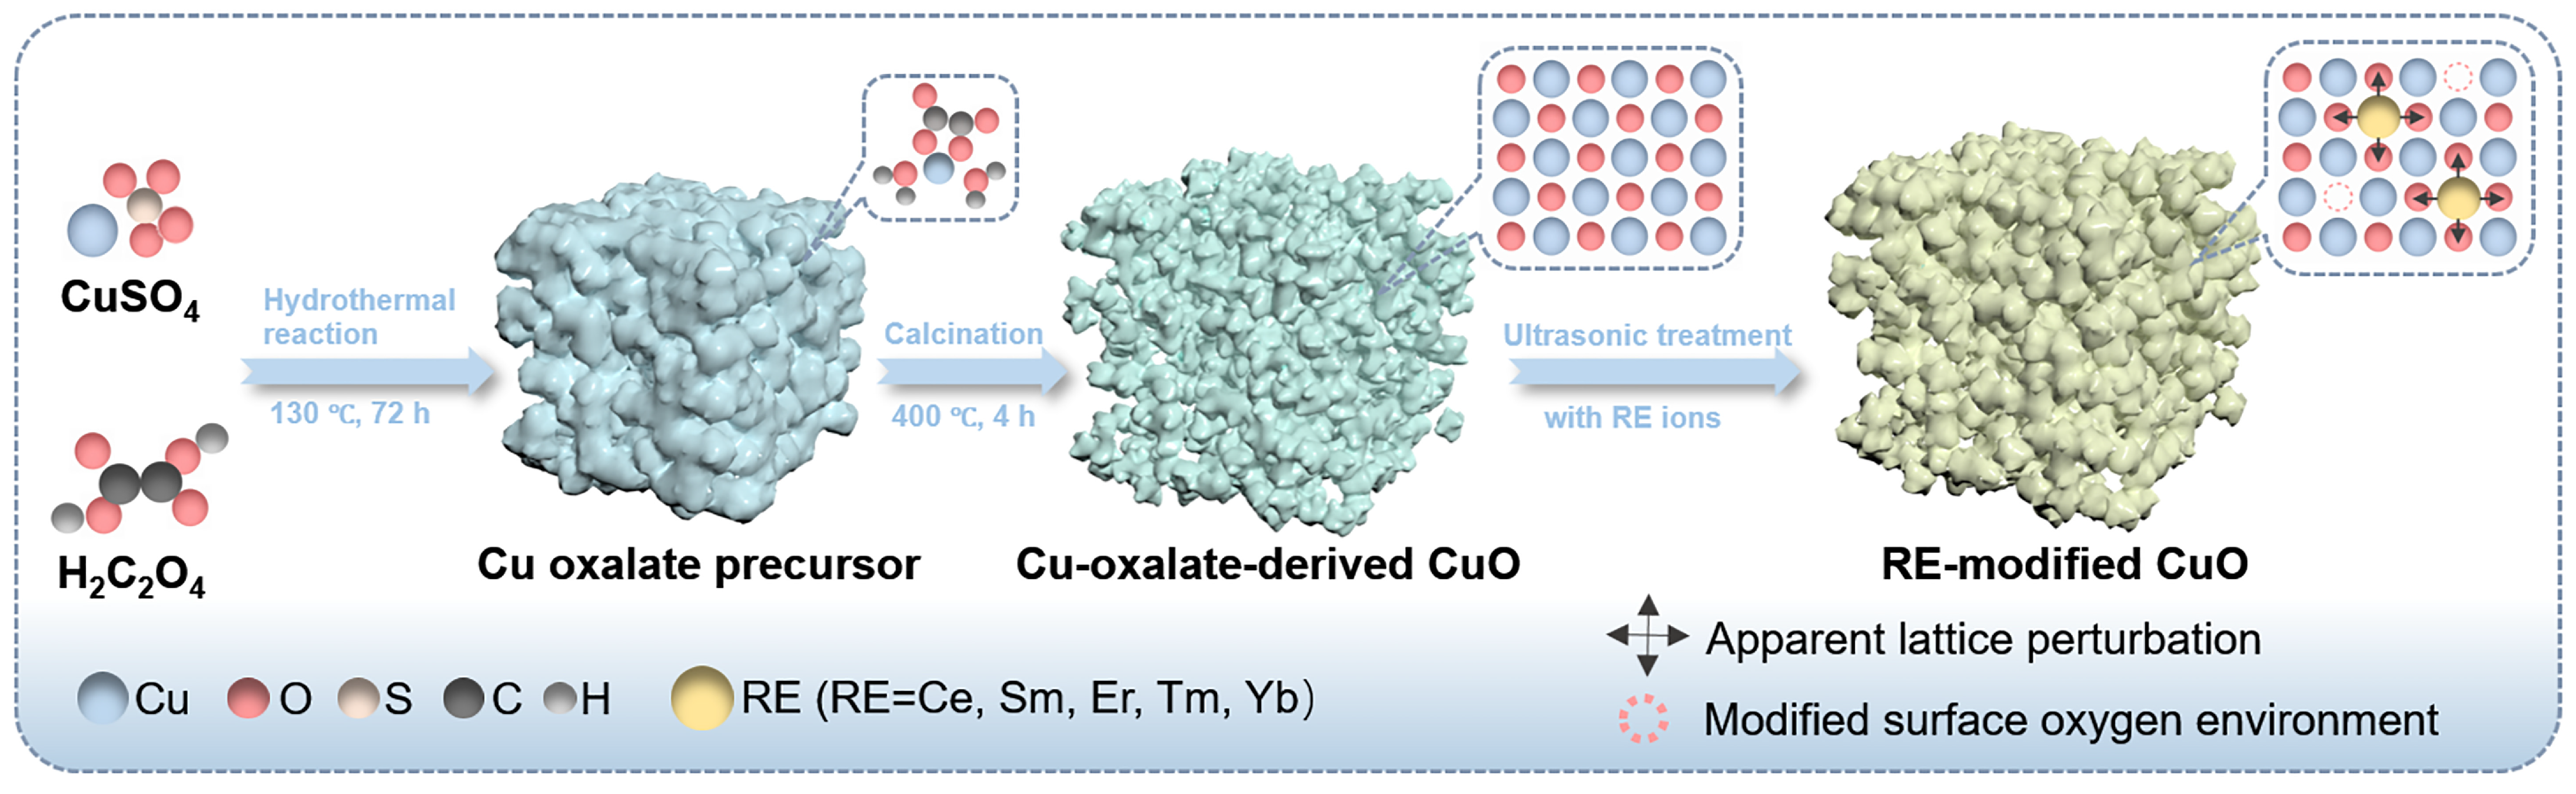
3.1. Structural, Morphological, and Surface Chemical Characterization
The XRD pattern and SEM image of the as-prepared copper oxalate precursor are provided in
Figure S1. The diffraction pattern confirms that a crystalline precursor was obtained before calcination, while the SEM image shows an aggregated particulate morphology. These precursor results support the copper-oxalate-derived synthesis route used to obtain the final CuO photocatalysts.
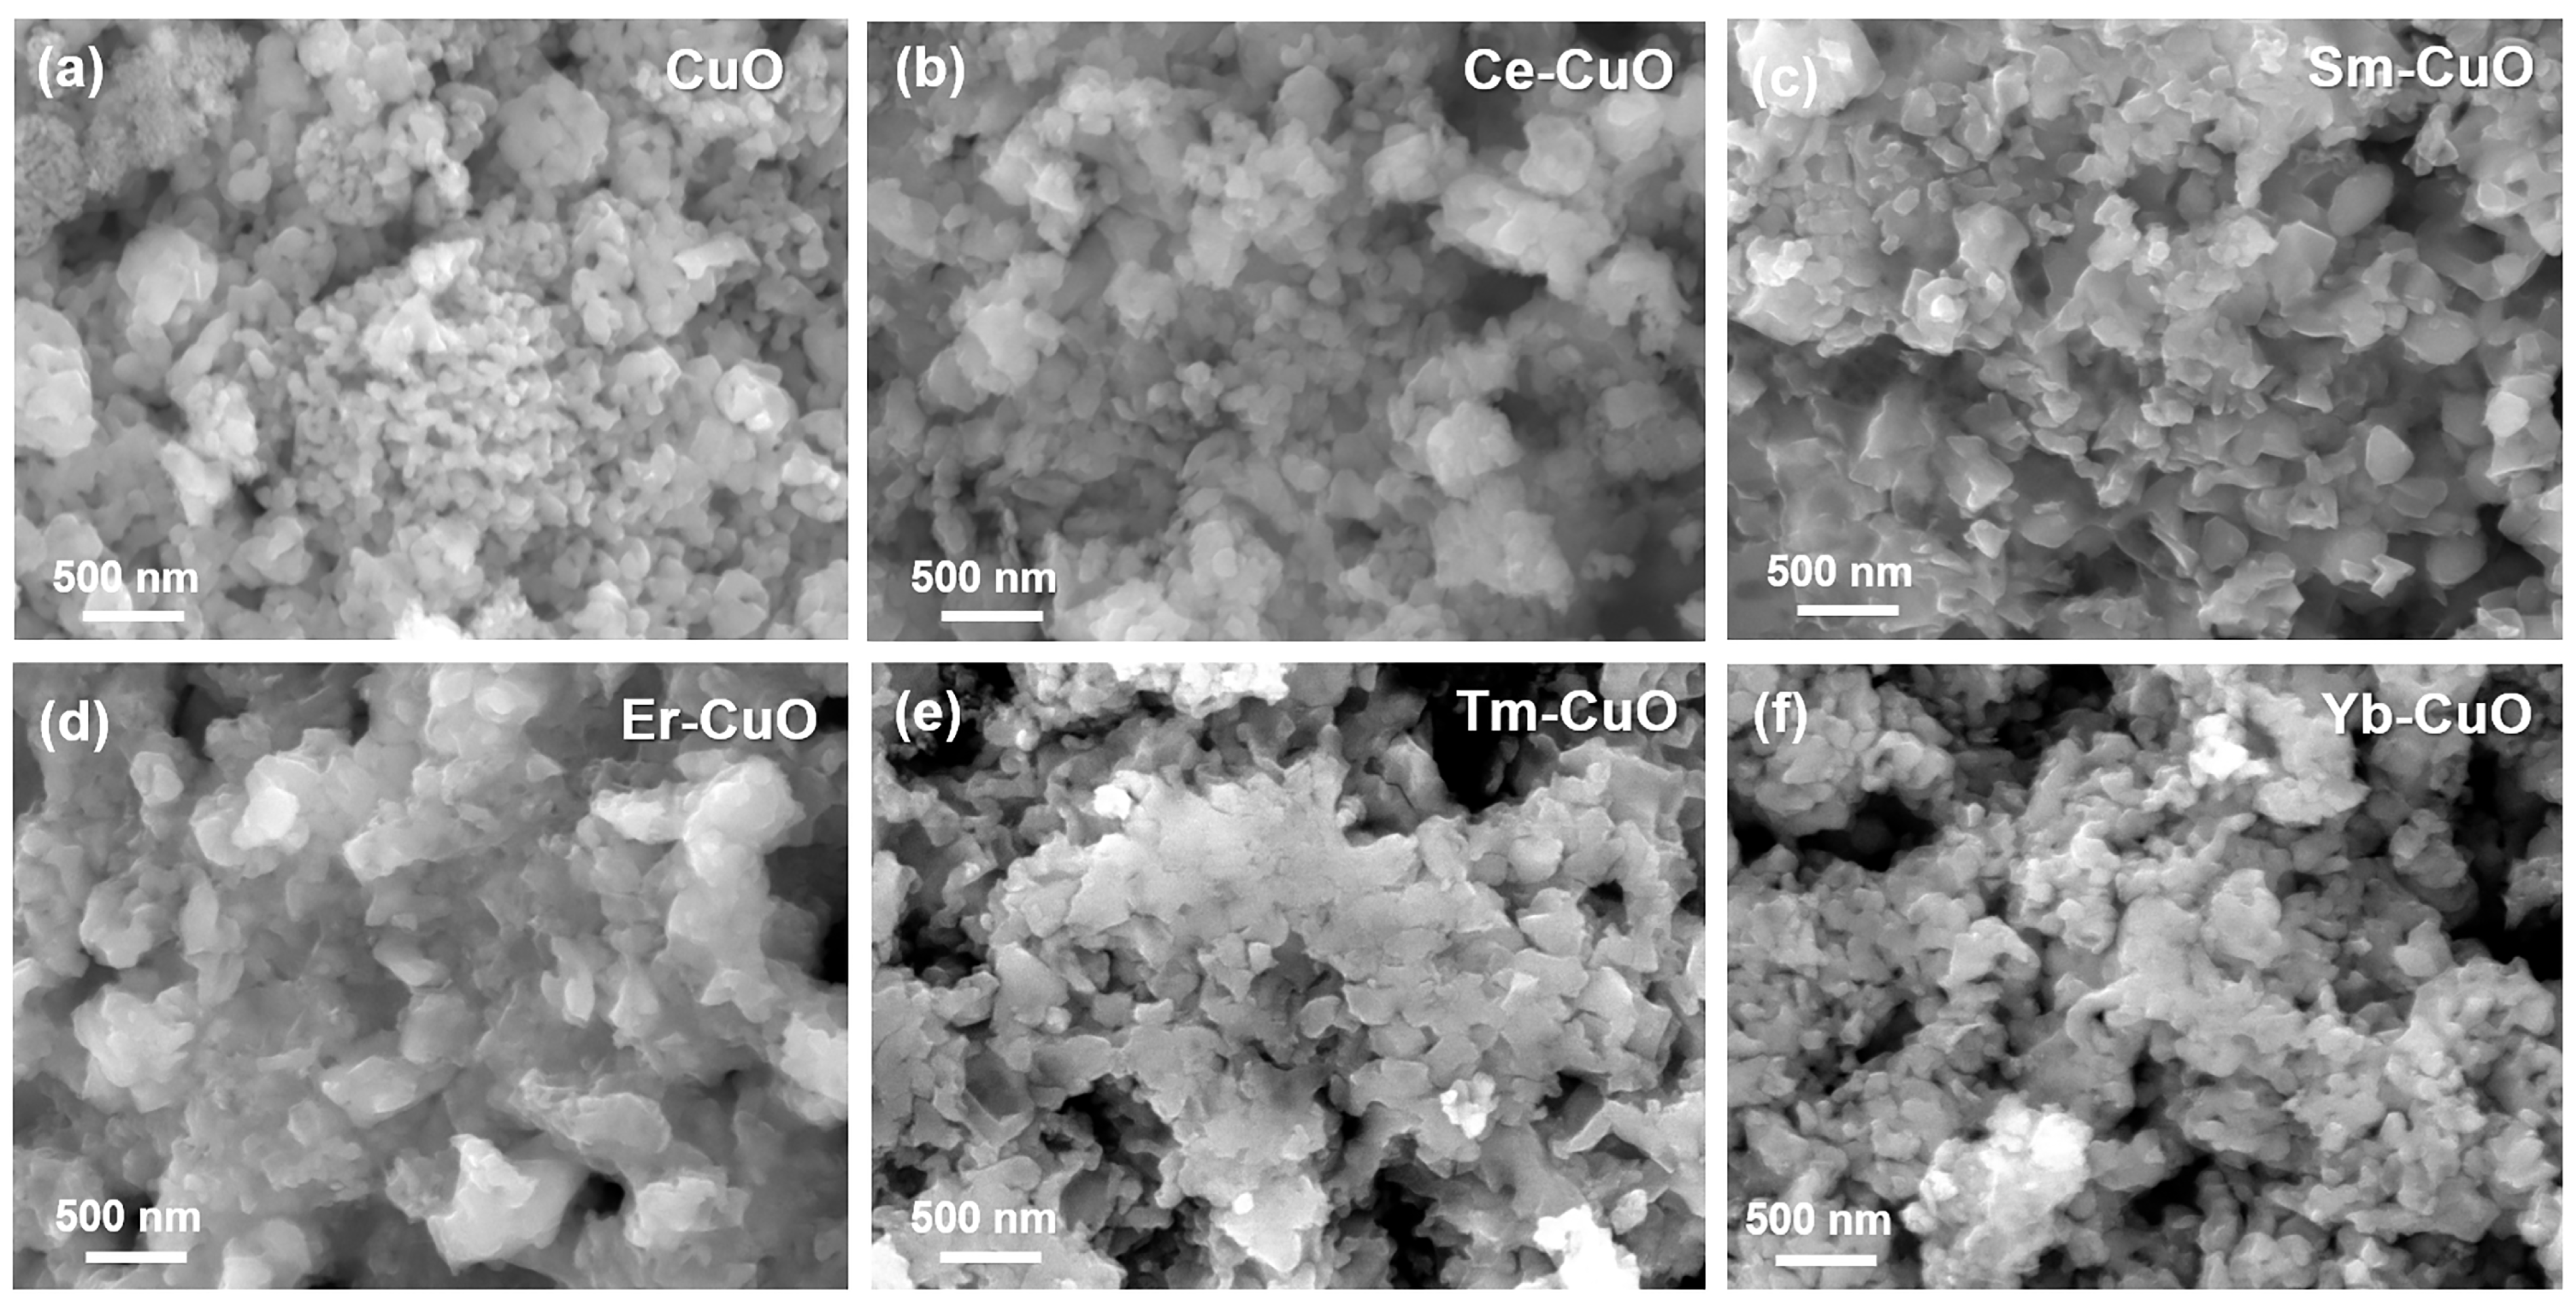
Figure 2 shows the morphologies of pristine CuO and the RE-modified CuO samples. The copper-oxalate-derived CuO consists of aggregated nanoscale particles with an irregular and relatively open surface morphology. Interparticle voids can be visually observed among the aggregated particles; however, these SEM observations are not used to assign a quantitative pore structure or pore-size distribution. Following modification with Ce, Sm, Er, Tm, and Yb species, the overall aggregated morphology is retained, although differences in particle aggregation, surface roughness, and local particle features are observed among the samples. For example, Sm-CuO and Tm-CuO exhibit discernible variations in local aggregation and surface texture compared with pristine CuO. These observations indicate that RE modification influences the particle morphology without causing obvious large-scale structural collapse.
The corresponding EDS spectra and local semi-quantitative elemental compositions are presented in
Figure S2 and
Table S1, respectively. Pristine CuO shows a Cu:O atomic ratio of 52.2:47.8, which is approximately consistent with CuO within the semi-quantitative limitation of EDS analysis. In the RE-modified samples, the apparent Cu content decreases while the O content increases, accompanied by detectable but low apparent RE concentrations. For example, Ce-CuO contains 37.8 at.% Cu, 61.0 at.% O, and 1.2 at.% Ce. Although these values should be interpreted cautiously because of the local semi-quantitative nature of EDS analysis, the compositional variations support the introduction of low-level RE-associated species into the CuO system. Despite these variations, the overall aggregated particle morphology remains recognizable after RE modification, indicating that the treatment did not cause obvious collapse or large-scale reconstruction of the CuO aggregates. To further examine the spatial distribution of the RE species, EDS elemental mapping was performed for the as-prepared Ce-CuO sample, which exhibited the highest photocatalytic activity among the investigated catalysts. As shown in
Figure S3, the Ce signal is detectable across the analyzed region, while the Cu and O signals are distributed throughout the same particle-aggregate area. No obvious micron-scale Ce-rich segregated domains are observed at the mapping resolution, supporting a broad spatial distribution of low-level Ce-associated species in the examined region. However, because EDS mapping does not provide atomic-scale structural information, these results cannot distinguish lattice-incorporated Ce from highly dispersed surface species or amorphous Ce-containing domains. The mapping results are therefore interpreted as evidence of Ce introduction and spatial distribution rather than direct proof of lattice substitution.
As shown in
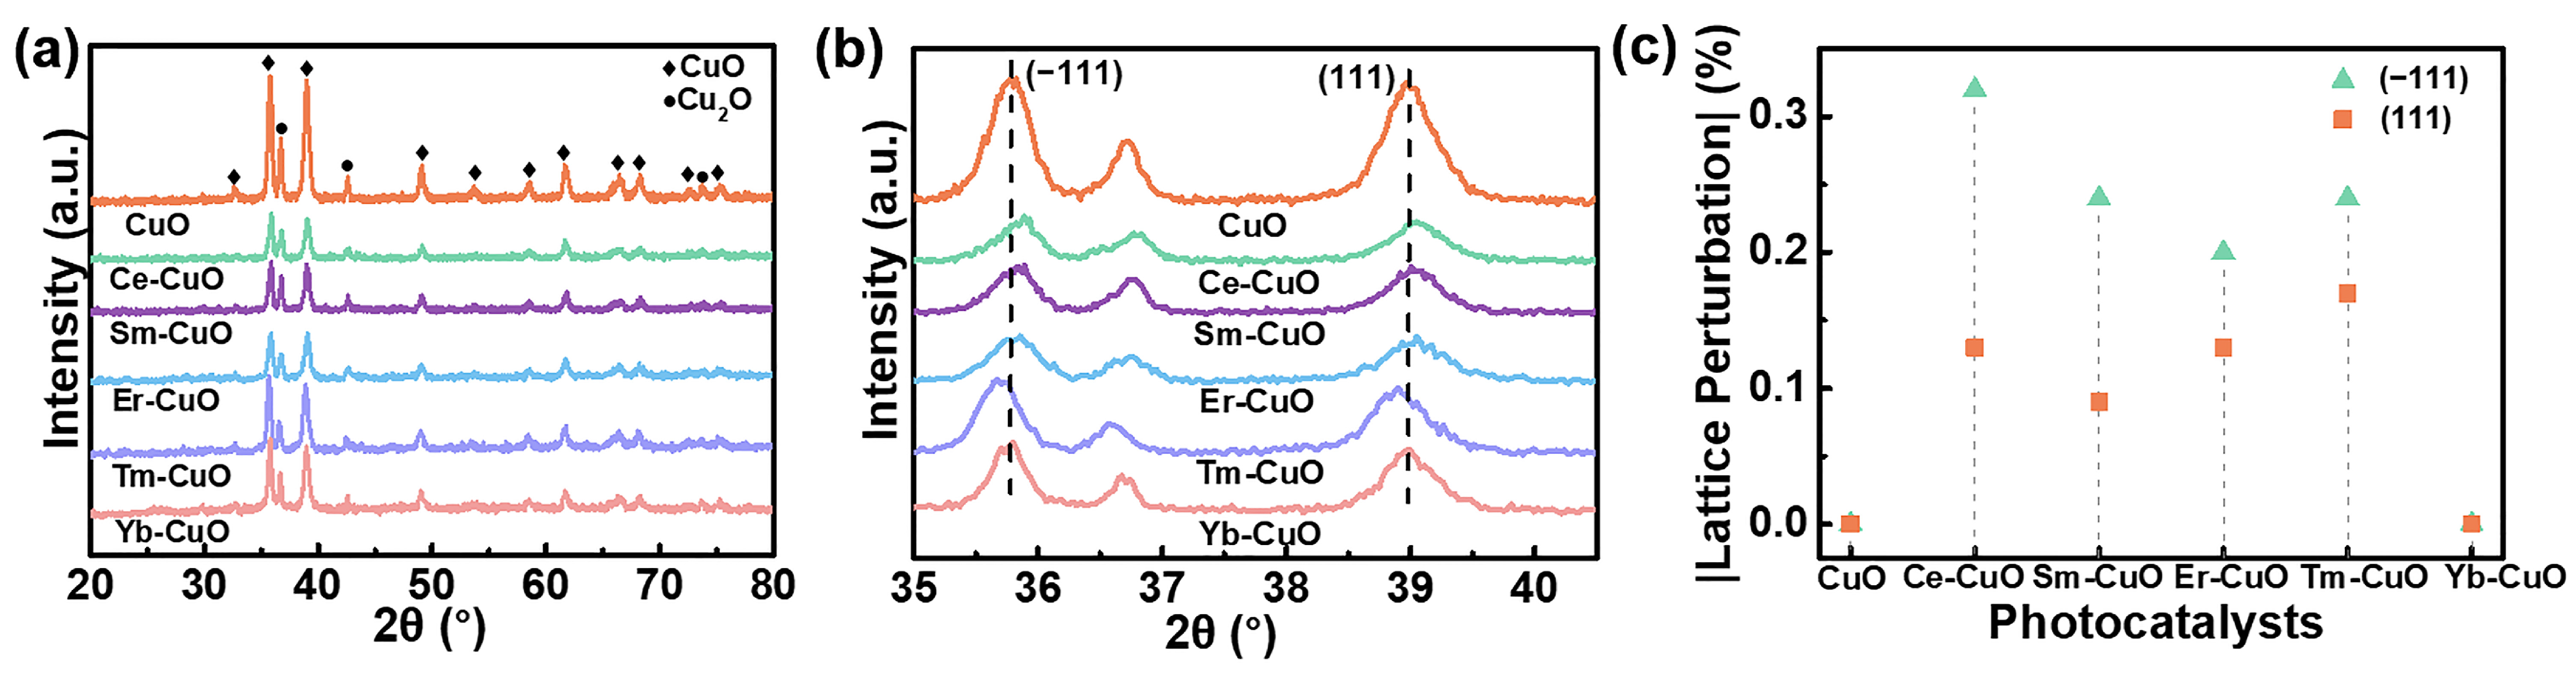
Figure 3a, all photocatalysts exhibit two principal diffraction peaks at 2θ ≈ 35.78° and 38.99°, corresponding to the (−111) and (111) planes of monoclinic CuO (JCPDS No. 01-089-5897), confirming the formation of crystalline CuO from the copper oxalate precursor. A weak diffraction peak at 36.72° is observed for pristine CuO and is assigned to a trace Cu
2O impurity phase (JCPDS No. 00-005-0667), which may originate from partial reduction or incomplete oxidation during thermal treatment [
41,
42]. No additional diffraction peaks attributable to separate crystalline rare-earth oxides or Cu–RE–O ternary compounds were detected in the modified samples. Therefore, no distinct crystalline ternary phase was identified within the XRD detection limit. Nevertheless, the absence of additional peaks does not exclude highly dispersed RE-associated surface species, amorphous RE-containing domains, or minor phases below the XRD detection limit. Accordingly, the prepared samples are described as RE-modified CuO materials containing low-level RE-associated species rather than as crystalline ternary Cu–RE–O compounds. Together with the low apparent RE contents detected by EDS, these results are consistent with the intended low-loading modification regime established using the nominal Cu:RE ratio of 20:1. Because no RE-loading series was investigated, this ratio is regarded as a fixed comparative synthesis condition rather than an optimized composition.
The slight peak shifts observed after RE modification indicate apparent lattice perturbation rather than unambiguous lattice substitution. To visualize these subtle displacements, enlarged views of the (−111) and (111) reflections are provided in
Figure 3b. The vertical dashed lines indicate the corresponding peak positions of pristine CuO, whereas the arrows show the directions of displacement after RE modification. Relative to pristine CuO, Ce-CuO, Sm-CuO, and Er-CuO exhibit slight positive shifts of the (−111) reflection, while Tm-CuO shows a small shift toward lower angles. The (−111) peak of Yb-CuO remains close to that of pristine CuO but occurs at a lower angle than the corresponding peaks of Ce-CuO, Sm-CuO, and Er-CuO. These RE-dependent and non-uniform peak shifts may reflect the combined effects of ionic-size mismatch, local lattice relaxation, and defect-related charge compensation [
43,
44,
45].
As summarized in
Table S2 and illustrated in
Figure 3c, RE-modified samples exhibit measurable deviations in interplanar spacing relative to pristine CuO (d
−111 = 0.2506 nm, d
111 = 0.2307 nm), indicating RE-associated apparent lattice perturbation. The perturbation magnitude varies with RE species and crystallographic plane. Ce-CuO exhibits the largest absolute perturbation on the (−111) plane (≈0.32%), whereas Tm-CuO shows the largest absolute perturbation on the (111) plane (≈0.17%). In contrast, Yb-CuO shows negligible perturbation on both planes. This non-monotonic behavior likely arises from the interplay of ionic radius mismatch, lattice relaxation, and defect compensation associated with different RE species. Comparable RE-dependent changes in crystal structure and photocatalytic behavior have been reported for Ce-modified CuO [
9], Gd-substituted Bi
2WO
6 [
20], and Ho-containing Ca
0.
6Ho
0.
4MnO
3 visible-light photocatalysts [
19]. These previous studies support the broader principle that RE incorporation can influence the local structural and electronic environment of oxide photocatalysts. However, unlike compositionally defined substitutional systems, the slight XRD shifts and EDS mapping obtained in the present work do not independently prove that the introduced RE species substitute for Cu within the CuO lattice.
The apparent crystallite size and peak-broadening-related microstrain were evaluated using five relatively isolated monoclinic CuO reflections assigned to the (−111), (111), (−202), (202), and (−113) planes. The weak Cu2O-related impurity reflection was excluded from the analysis. To maintain consistency with the diffraction-peak-position analysis, the previously determined 2θ positions of the (−111) and (111) reflections were retained. The selected diffraction peaks were fitted using pseudo-Voigt profiles with local linear backgrounds, and the fitted full widths at half maximum were converted from degrees to radians before calculation.
XRD peak-broadening analysis was further conducted to estimate the apparent coherent-domain size and microstrain of the samples. As shown in
Figure S4a and summarized in
Table S3, the mean Scherrer crystallite sizes were 18.66 ± 4.00 nm for pristine CuO, 18.82 ± 6.15 nm for Ce-CuO, 15.07 ± 3.19 nm for Sm-CuO, 14.39 ± 2.01 nm for Er-CuO, 16.73 ± 3.55 nm for Tm-CuO, and 21.85 ± 3.84 nm for Yb-CuO. The corresponding Williamson–Hall estimates were 26.38, 11.99, 10.25, 10.29, 14.62, and 17.58 nm, respectively. Thus, both approaches indicated coherent-domain dimensions within the nanometer range, although quantitative differences were observed because the Scherrer equation attributes peak broadening primarily to finite domain size, whereas the Williamson–Hall treatment additionally includes a strain-related contribution. The signed apparent Williamson–Hall microstrain values are compared in
Figure S4b, and the corresponding Williamson–Hall plots are provided in
Figure S5. Pristine CuO exhibited a positive fitted microstrain value of +1.500 × 10
−3, whereas the RE-modified samples exhibited negative fitted values ranging from −0.526 × 10
−3 to −2.405 × 10
−3. However, the Williamson–Hall R
2 values ranged only from 0.009 to 0.424, indicating limited linearity. These microstrain values are therefore treated as comparative indicators of peak-broadening behavior rather than precise intrinsic lattice-strain values, and the negative slopes are not considered definitive evidence of compressive strain. Neither the apparent crystallite-size trend nor the apparent microstrain trend followed the photocatalytic-activity order monotonically, indicating that these structural descriptors alone do not determine the observed photocatalytic performance.
The observed apparent lattice perturbation indicates that RE modification alters the local structural environment of CuO. However, its influence on photogenerated carrier separation cannot be directly established from XRD and is considered only as a possible contributing factor [
23].
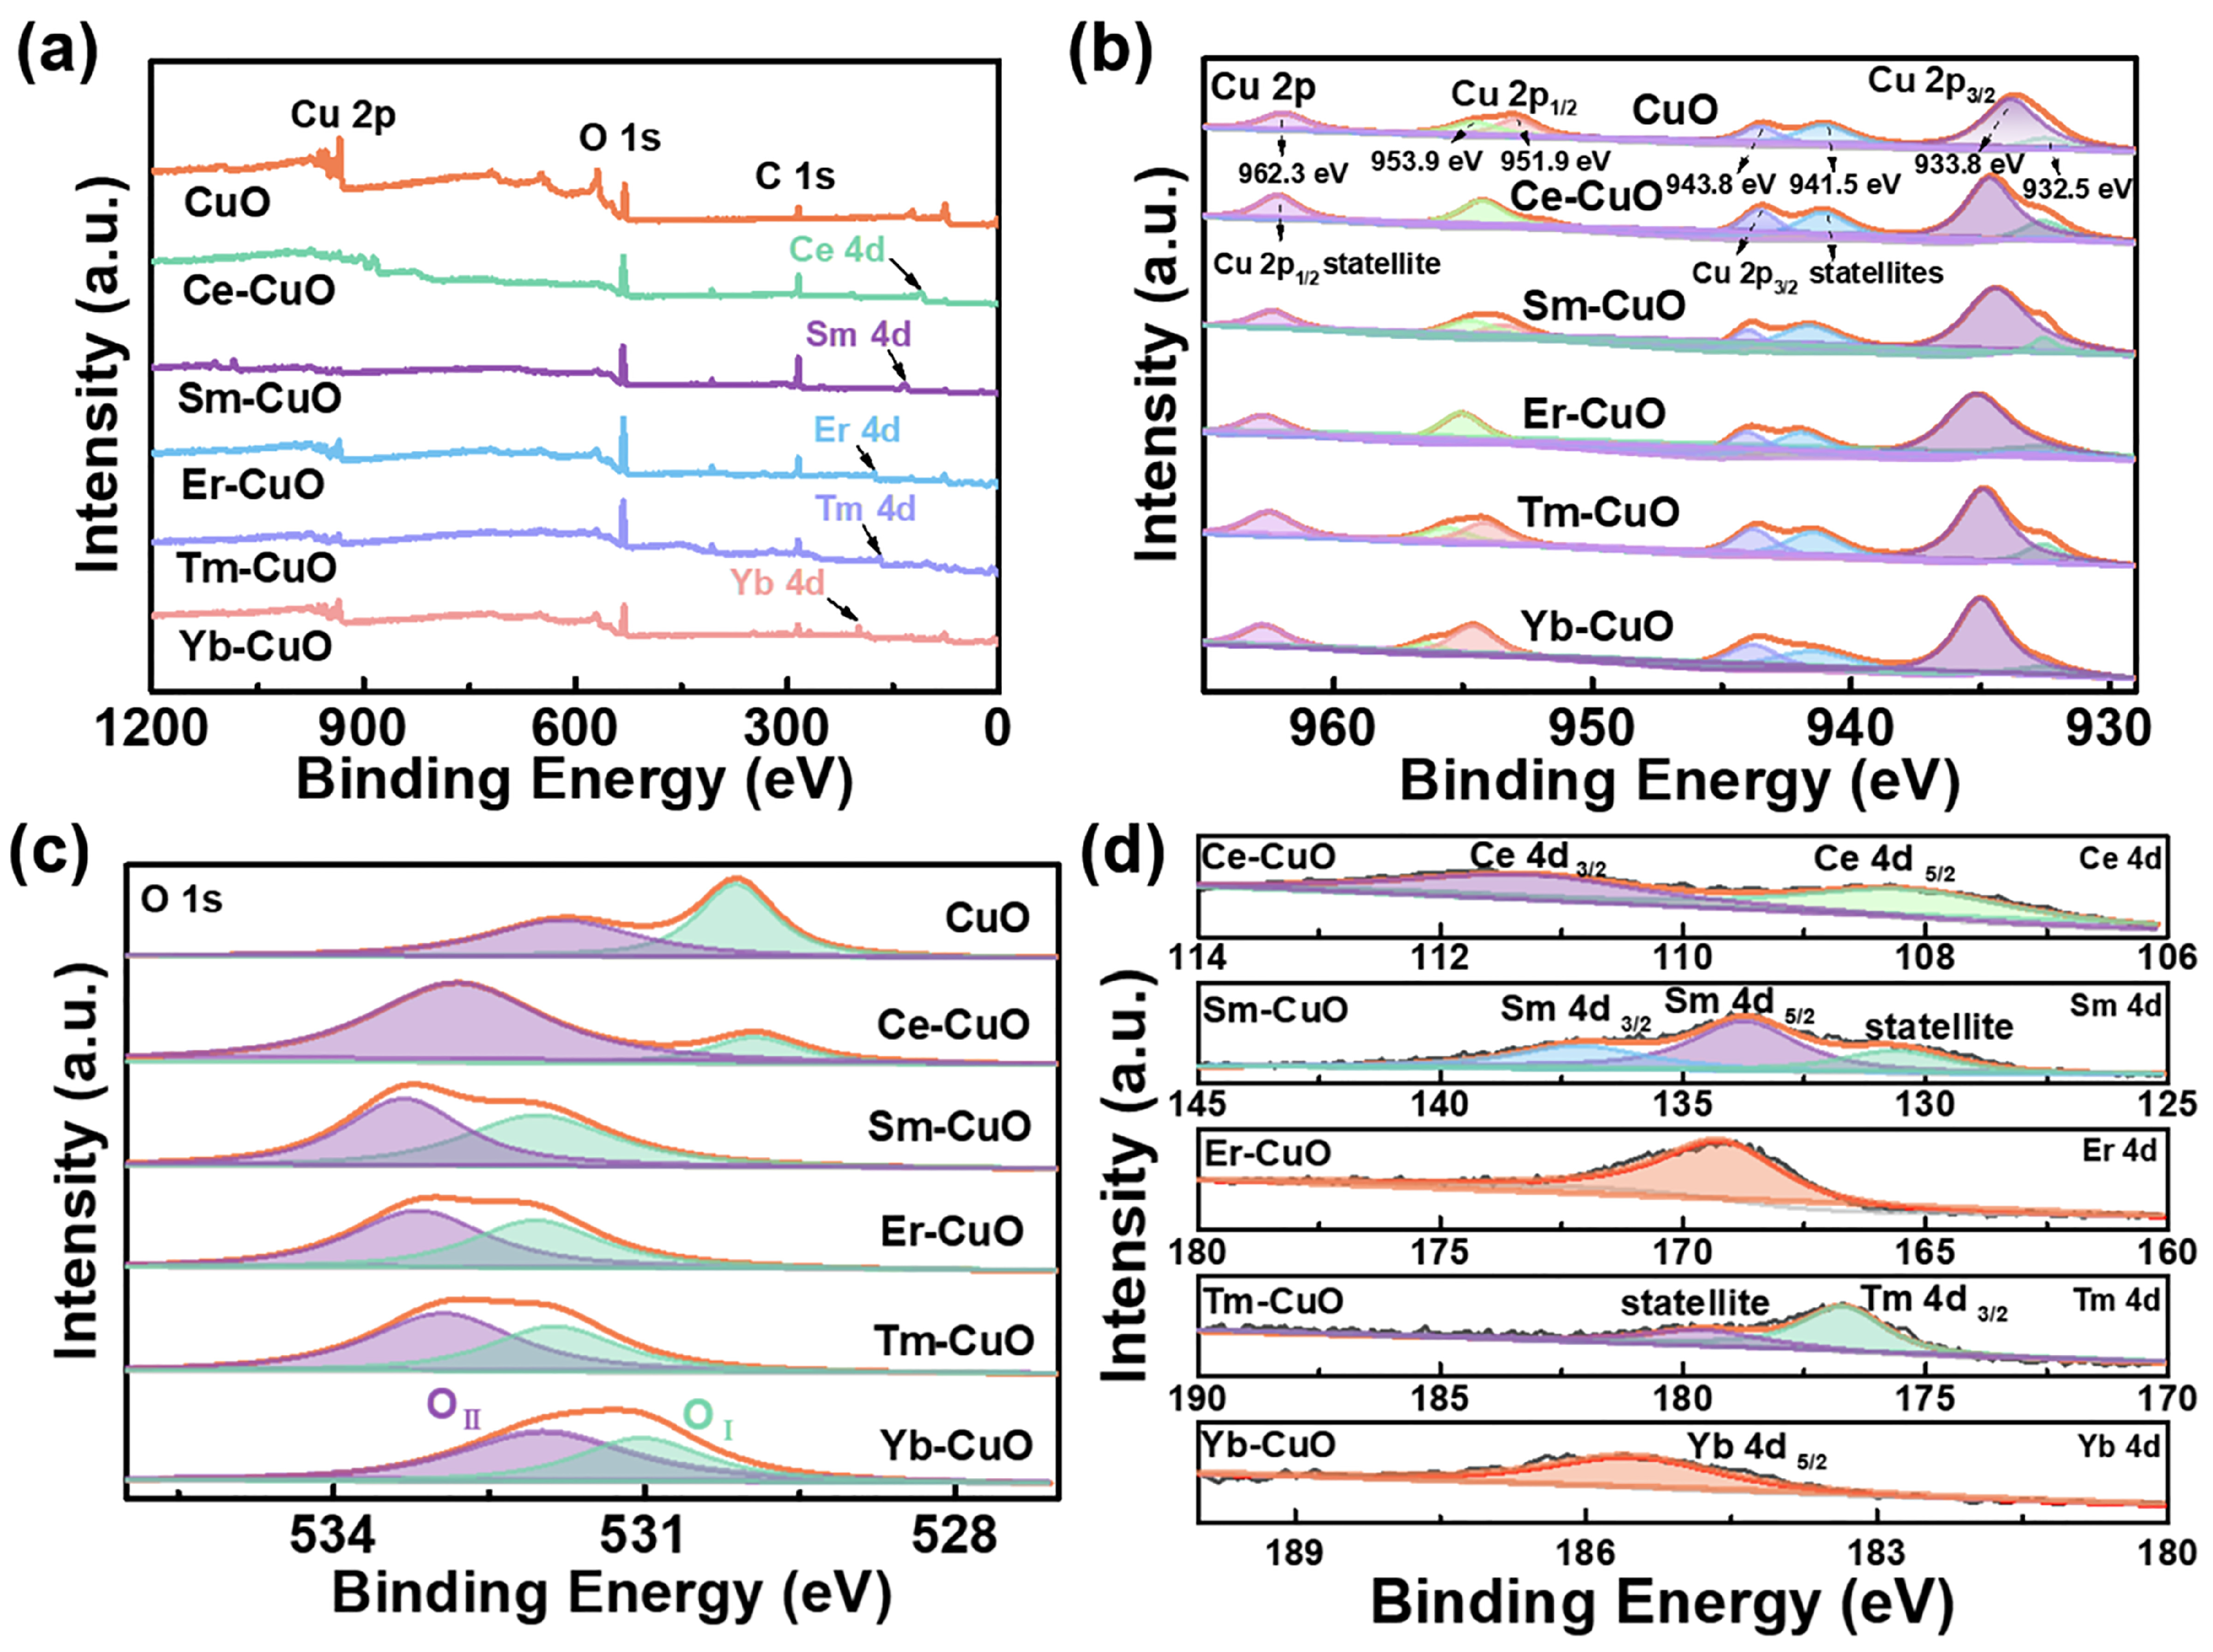
Figure 4 presents XPS analyses of pristine and RE-modified CuO, revealing insights into chemical composition and electronic-structure modulation. The survey spectra (
Figure 4a, 0–1200 eV) show characteristic RE 4d features: Ce 4d (108–112 eV), Sm 4d (134–138 eV), Er 4d (168–172 eV), Tm 4d (175–180 eV), and Yb 4d (185–190 eV) [
46,
47]. These features support the introduction of RE species, while their low intensity is consistent with low apparent RE contents. Pristine CuO shows only Cu 2p (~930 eV), O 1s (~530 eV), and adventitious carbon C 1s (~285 eV) signals.
High-resolution Cu 2p spectra (
Figure 4b) provide insight into Cu oxidation states and their modulation after RE modification. Pristine CuO shows a Cu
+ component at 932.5 eV, typically associated with Cu
2O species or partially reduced Cu species, together with a dominant Cu
2+ peak at 933.8 eV characteristic of monoclinic CuO. The Cu
2+ state is further supported by distinct satellite peaks at 941.5 and 943.8 eV in the Cu 2p
3/
2 region and at 962.3 eV in the Cu 2p
1/
2 region [
47]. After RE modification, subtle shifts and intensity variations in Cu 2p peaks and satellite structures are observed, suggesting changes in the Cu
+/Cu
2+ ratio and local coordination environment. These variations are attributed to RE-associated structural perturbation and defect-related local oxygen environments rather than direct proof of lattice substitution.
The O 1s spectra (
Figure 4c) show significant evolution in oxygen environments. Pristine CuO displays a dominant lattice oxygen peak at 529.7 eV, corresponding to O
2− species in the Cu–O framework [
47]. A weaker high-binding-energy component is observed in pristine CuO and becomes more pronounced after RE modification. The component centered at approximately 531.3 eV may contain overlapping contributions from low-coordination oxygen, surface hydroxyl groups, adsorbed oxygen species, and other defect-associated surface environments. Because these contributions cannot be unequivocally separated by O 1s XPS alone, this component is not assigned exclusively to oxygen vacancies. The observed evolution is therefore interpreted conservatively as evidence of modified surface oxygen chemical environments. Such environments may influence surface adsorption and interfacial redox reactivity; however, their specific role in charge trapping is not directly established by the present XPS data.
High-resolution RE 4d spectra (
Figure 4d) further support the introduction of the corresponding RE species and reveal element-dependent chemical-state characteristics. The Ce-related spectral features are consistent with the coexistence of Ce species in more than one oxidation state, whereas the Sm-, Er-, Tm-, and Yb-related spectra are predominantly consistent with trivalent RE species [
13,
46,
47]. The Ce-related result provides ex situ surface-chemical evidence for mixed-valence characteristics in Ce-CuO. However, because of the multiplet complexity and overlap of the Ce 4d region, the present spectrum is used for qualitative chemical-state identification rather than quantitative determination of the Ce
3+/Ce
4+ ratio.
The Ce-related mixed-valence surface chemistry may provide reversible electron-accepting and electron-donating sites. A plausible pathway involves temporary reduction of Ce
4+ to Ce
3+ through electron acceptance, followed by electron transfer from Ce
3+ to an interfacial acceptor and regeneration of Ce
4+. Such behavior has been proposed in other Ce-containing oxide photocatalysts and may contribute to the modified surface-oxygen environment and interfacial electronic response of Ce-CuO [
16,
17,
18]. Nevertheless, the present ex situ XPS analysis does not directly demonstrate Ce
3+/Ce
4+ interconversion under simulated solar irradiation. The mixed-valence characteristics are therefore interpreted as a possible contributor to the Ce-CuO performance rather than proof of an operating redox cycle.
Combined XRD, XPS, EDS spectra, and EDS mapping results support the introduction of low-level RE-associated species and their influence on the local structural and chemical environments of CuO. The distinct chemical behavior of the RE species, particularly the Ce-related mixed-valence characteristics, may influence the local electronic structure and interfacial reactivity. These structural and surface-chemical modifications provide a possible basis for the different optical, electrochemical, and photocatalytic responses discussed below, although they do not directly demonstrate improved photogenerated charge separation. Unlike previous studies focused on a single substitutional RE composition, the present work compares Ce-, Sm-, Er-, Tm-, and Yb-modified CuO samples prepared and evaluated under identical conditions. The results show that the effects of RE modification are strongly element-dependent: Ce-CuO exhibits the most favorable combined optical, surface-chemical, and interfacial electrochemical characteristics, whereas the other RE-modified samples display different balances among these properties.
3.2. Photocatalytic Degradation Performance
Before photocatalytic irradiation, the adsorption behavior of MO on pristine and RE-modified CuO was examined in the dark over 30 min. As shown in
Figure S6, all samples exhibited an initial decrease in C
t/C
initial during the first 5 min, followed by only minor changes during the subsequent dark-stirring period. At 5 min, the C
t/C
initial values were 0.95521 for CuO, 0.93420 for Ce-CuO, 0.94320 for Sm-CuO, 0.94147 for Er-CuO, 0.95240 for Tm-CuO, and 0.96000 for Yb-CuO. From 5 to 30 min, the additional changes were limited to 0.00330–0.00504, indicating that adsorption had already approached equilibrium within 5 min under the present experimental conditions. Therefore, the concentration measured after the 5 min dark-treatment period was used as C
0 for the subsequent photocatalytic analysis.
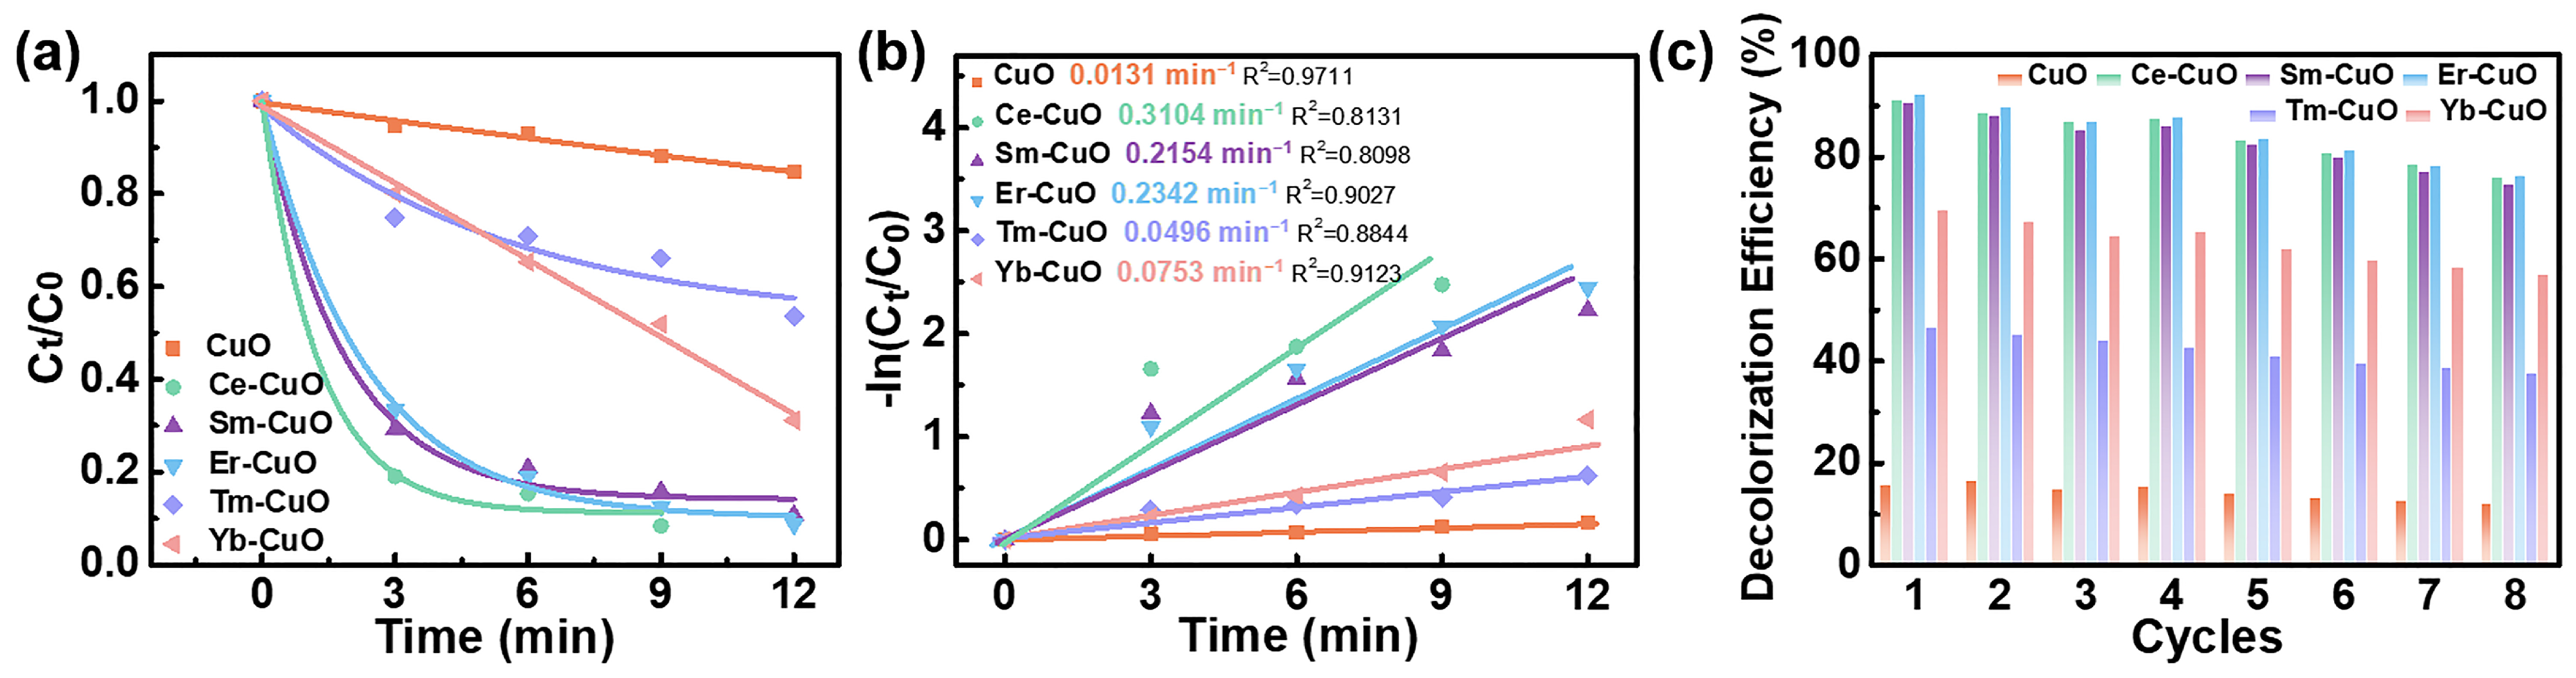
Representative temporal decolorization profiles and their corresponding apparent pseudo-first-order fits are shown in
Figure 5a,b. The reproducibility of the photocatalytic results was evaluated through three independent experiments for each catalyst. The complete replicate profiles and the corresponding statistical results are presented in
Figure S7 and Table S4, respectively. The replicate measurements reproduced the same overall activity trend, and Ce-CuO retained the highest triplicate-mean apparent rate constant under the investigated conditions.
The time-dependent UV–vis absorption spectra are shown in
Figure S8. The characteristic absorption band of MO at approximately 463 nm gradually decreased under simulated solar irradiation, demonstrating progressive decolorization and disruption of the MO chromophoric structure. This spectral decrease alone is not interpreted as evidence of complete mineralization. After 12 min of simulated solar irradiation, pristine CuO exhibited only 15.38% MO decolorization, whereas Sm-CuO, Er-CuO, Tm-CuO, and Yb-CuO achieved 89.23%, 91.33%, 46.39%, and 68.86% decolorization, respectively. Ce-CuO reached 91.59% decolorization within 9 min.
In addition to the progressive decrease in the principal MO absorption band at approximately 463 nm, the UV–vis spectra in
Figure S8 show a transient absorption feature at 410–430 nm during simulated solar irradiation. The transient feature at 410–430 nm suggests the formation of spectrally distinct transformation intermediates during the early disruption of the MO chromophore. Because UV–vis spectroscopy alone cannot identify these species, a specific N-demethylation pathway is not assigned [
48,
49]. The feature is more pronounced for Ce-CuO, Sm-CuO, and Er-CuO, indicating more rapid spectral evolution during the early reaction stage. However, the identities of the corresponding transformation products cannot be confirmed from UV–vis spectroscopy alone.
The representative decolorization data were analyzed using the apparent pseudo-first-order kinetic model shown in
Figure 5b. The representative k
obs values were 0.0131 min
−1 for pristine CuO, 0.3104 min
−1 for Ce-CuO, 0.2154 min
−1 for Sm-CuO, 0.2342 min
−1 for Er-CuO, 0.0496 min
−1 for Tm-CuO, and 0.0753 min
−1 for Yb-CuO. Thus, all RE-modified samples exhibited higher apparent decolorization rate constants than pristine CuO under the fixed experimental conditions. In the triplicate analysis summarized in
Table S4, Ce-CuO retained the highest mean k
obs. Er-CuO exhibited a slightly higher triplicate-mean value than Sm-CuO; however, the corresponding values of 0.2355 ± 0.0236 and 0.2139 ± 0.0189 min
−1, respectively, showed overlapping mean ± standard-deviation ranges. This modest difference is therefore interpreted cautiously and is not used to establish a uniquely superior intrinsic photocatalytic mechanism for Er-CuO relative to Sm-CuO. The comparatively lower R
2 ranges obtained for Ce-CuO (0.8131–0.8674) and Sm-CuO (0.7765–0.8098) further indicate that the apparent pseudo-first-order model provides only an approximate description of their rapidly evolving decolorization profiles. The fitted k
obs values are consequently used as condition-specific comparative descriptors rather than exact intrinsic kinetic constants. The activity differences are discussed in relation to the combined optical, surface-chemical, apparent carrier-density, and interfacial impedance characteristics, while improved photogenerated charge separation is not treated as directly demonstrated in the absence of recombination-sensitive measurements.
The present photocatalytic experiments were designed to compare the prepared catalysts under fixed physicochemical conditions rather than to optimize the reaction process. All samples were tested at a catalyst concentration of 1.0 g L−1 and an initial MO concentration of 10 mg L−1, while catalyst loading, solution pH, and initial pollutant concentration were not systematically varied. These variables can influence the apparent kinetics through coupled adsorption, surface-reaction, and optical effects. In particular, although increasing catalyst loading may provide more accessible surface sites, the relatively high solid concentration used here may also promote particle aggregation, suspension turbidity, light scattering, and optical shielding, thereby reducing the effective penetration of incident light. Solution pH can alter catalyst surface charge, MO adsorption behavior, and reactive-species chemistry, whereas increasing the initial MO concentration can enhance competition for accessible surface sites and produce inner-filter effects. Accordingly, the reported kobs values are interpreted as condition-specific comparative descriptors rather than intrinsic or catalyst-loading-optimized kinetic constants. The identical catalyst concentration, solution volume, stirring conditions, and irradiation geometry provide a consistent basis for internal comparison; however, sample-dependent differences in aggregation, morphology, and optical properties mean that variations in light scattering cannot be completely excluded. Systematic loading-, pH-, and concentration-dependent investigations are therefore required for process optimization and remain beyond the scope of the present work.
To determine whether the pronounced spectral decolorization was accompanied by aqueous organic-carbon removal, NPOC analysis was performed for the initial MO solution and the supernatant obtained after Ce-CuO treatment for 9 min under simulated solar irradiation. As shown in
Figure S9, the NPOC concentration decreased from 4.94 mg L
−1 in the initial MO solution to 1.405 mg L
−1 after treatment, corresponding to an apparent NPOC reduction of 71.6%. This result demonstrates that the disappearance of the characteristic MO absorption band was accompanied by substantial removal of non-purgeable organic carbon from the aqueous phase rather than chromophore decolorization alone. However, the residual NPOC concentration confirms that complete mineralization was not achieved. Moreover, because NPOC analysis does not identify individual transformation products and cannot fully distinguish photocatalytic mineralization from possible adsorption-related organic-carbon removal onto the recovered catalyst, the 71.6% value is interpreted as an apparent aqueous organic-carbon reduction rather than an absolute mineralization efficiency. Identification and toxicity assessment of the transformation products require further investigation.
Figure 5c shows the cycling behavior of the catalysts over eight consecutive photocatalytic runs. Each catalyst was evaluated using the same irradiation duration as its corresponding decolorization profile in
Figure 5a: 9 min for Ce-CuO and 12 min for pristine CuO, Sm-CuO, Er-CuO, Tm-CuO, and Yb-CuO. Pristine CuO exhibited consistently low decolorization efficiencies of 11.8–16.4%. In contrast, Ce-CuO and Er-CuO maintained the highest endpoint decolorization efficiencies among the investigated samples. Ce-CuO decreased from 91.2% in the first cycle to 75.8% after eight cycles, corresponding to retention of approximately 83.1% of its cycle-1 efficiency. Er-CuO decreased from 92.1% to 76.3%, corresponding to approximately 82.8% retention, while Sm-CuO decreased from 90.4% to 74.6%, corresponding to approximately 82.5% retention. Yb-CuO and Tm-CuO exhibited lower endpoint efficiencies of 56.8–69.5% and 37.4–46.5%, respectively. Because Ce-CuO and the remaining catalysts were evaluated over different reaction-time ranges, the absolute endpoint efficiencies are used to describe the within-sample cycling evolution and should not be interpreted as a strict common-time stability ranking. Overall, the RE-modified samples retained substantially greater MO decolorization activity than pristine CuO throughout the eight-cycle evaluation, although gradual deactivation was observed. The activity loss may reflect catalyst loss during recovery, surface accumulation of transformation products, changes in aggregation, and/or redistribution of surface-associated RE species.
To further evaluate the post-reaction stability of the best-performing catalyst, Ce-CuO recovered after the eighth photocatalytic cycle was characterized by XRD, SEM, and EDS. As shown in
Figure S10a, the principal diffraction features of monoclinic CuO were retained after cycling, and no obvious new crystalline secondary phase was detected. The post-cycling SEM image in
Figure S10b shows that the overall aggregated particle morphology remained recognizable, although local changes in particle aggregation and surface texture cannot be excluded. The corresponding EDS spectrum in
Figure S10c confirms the continued presence of Cu, O, and Ce. As summarized in
Table S5, the local semi-quantitative Cu, O, and Ce contents changed from 37.8, 61.0, and 1.2 at.% in the as-prepared Ce-CuO sample to 31.1, 68.5, and 0.4 at.% after eight cycles, respectively. The lower local Ce signal after cycling may be associated with partial loss or redistribution of Ce-associated species; however, differences between the selected analysis regions and the local semi-quantitative nature of EDS must also be considered. The EDS values are therefore not interpreted as quantitative bulk elemental-retention ratios. Overall, the post-cycling results indicate that the major CuO crystalline phase and the general aggregated morphology were largely retained. The gradual activity decline may be associated with catalyst loss during recovery, surface accumulation of transformation products, and/or partial redistribution of surface-associated Ce species, although the individual contributions of these factors were not independently quantified.
To provide a transparent comparison with previously reported CuO-based photocatalysts, the photocatalytic performance of the present pristine CuO and Ce-CuO samples was compared with representative CuO and CuO-based composite photocatalysts, as summarized in
Table 1. The table focuses primarily on MO decolorization or removal studies and includes the irradiation source, reaction time, reported removal efficiency, and apparent pseudo-first-order rate constant where available. The reported performance varies substantially with synthesis route, catalyst composition, morphology, irradiation source, pollutant concentration, catalyst dosage, solution pH, and reaction duration. The reported irradiation periods span 4–300 min, placing the 9 min treatment used for the present Ce-CuO sample toward the short-time end of the comparison without establishing it as the shortest reported treatment. Under the fixed conditions used in this work, Ce-CuO achieved 91.59% MO decolorization within 9 min and exhibited a representative apparent k
obs of 0.3104 min
−1, whereas pristine CuO showed 15.38% decolorization within 12 min and a representative k
obs of 0.0131 min
−1. Because the experimental conditions differ among the listed studies, this comparison provides descriptive short-time kinetic context and is not used to establish an absolute condition-normalized performance ranking.
3.3. Optical and Electrochemical Properties
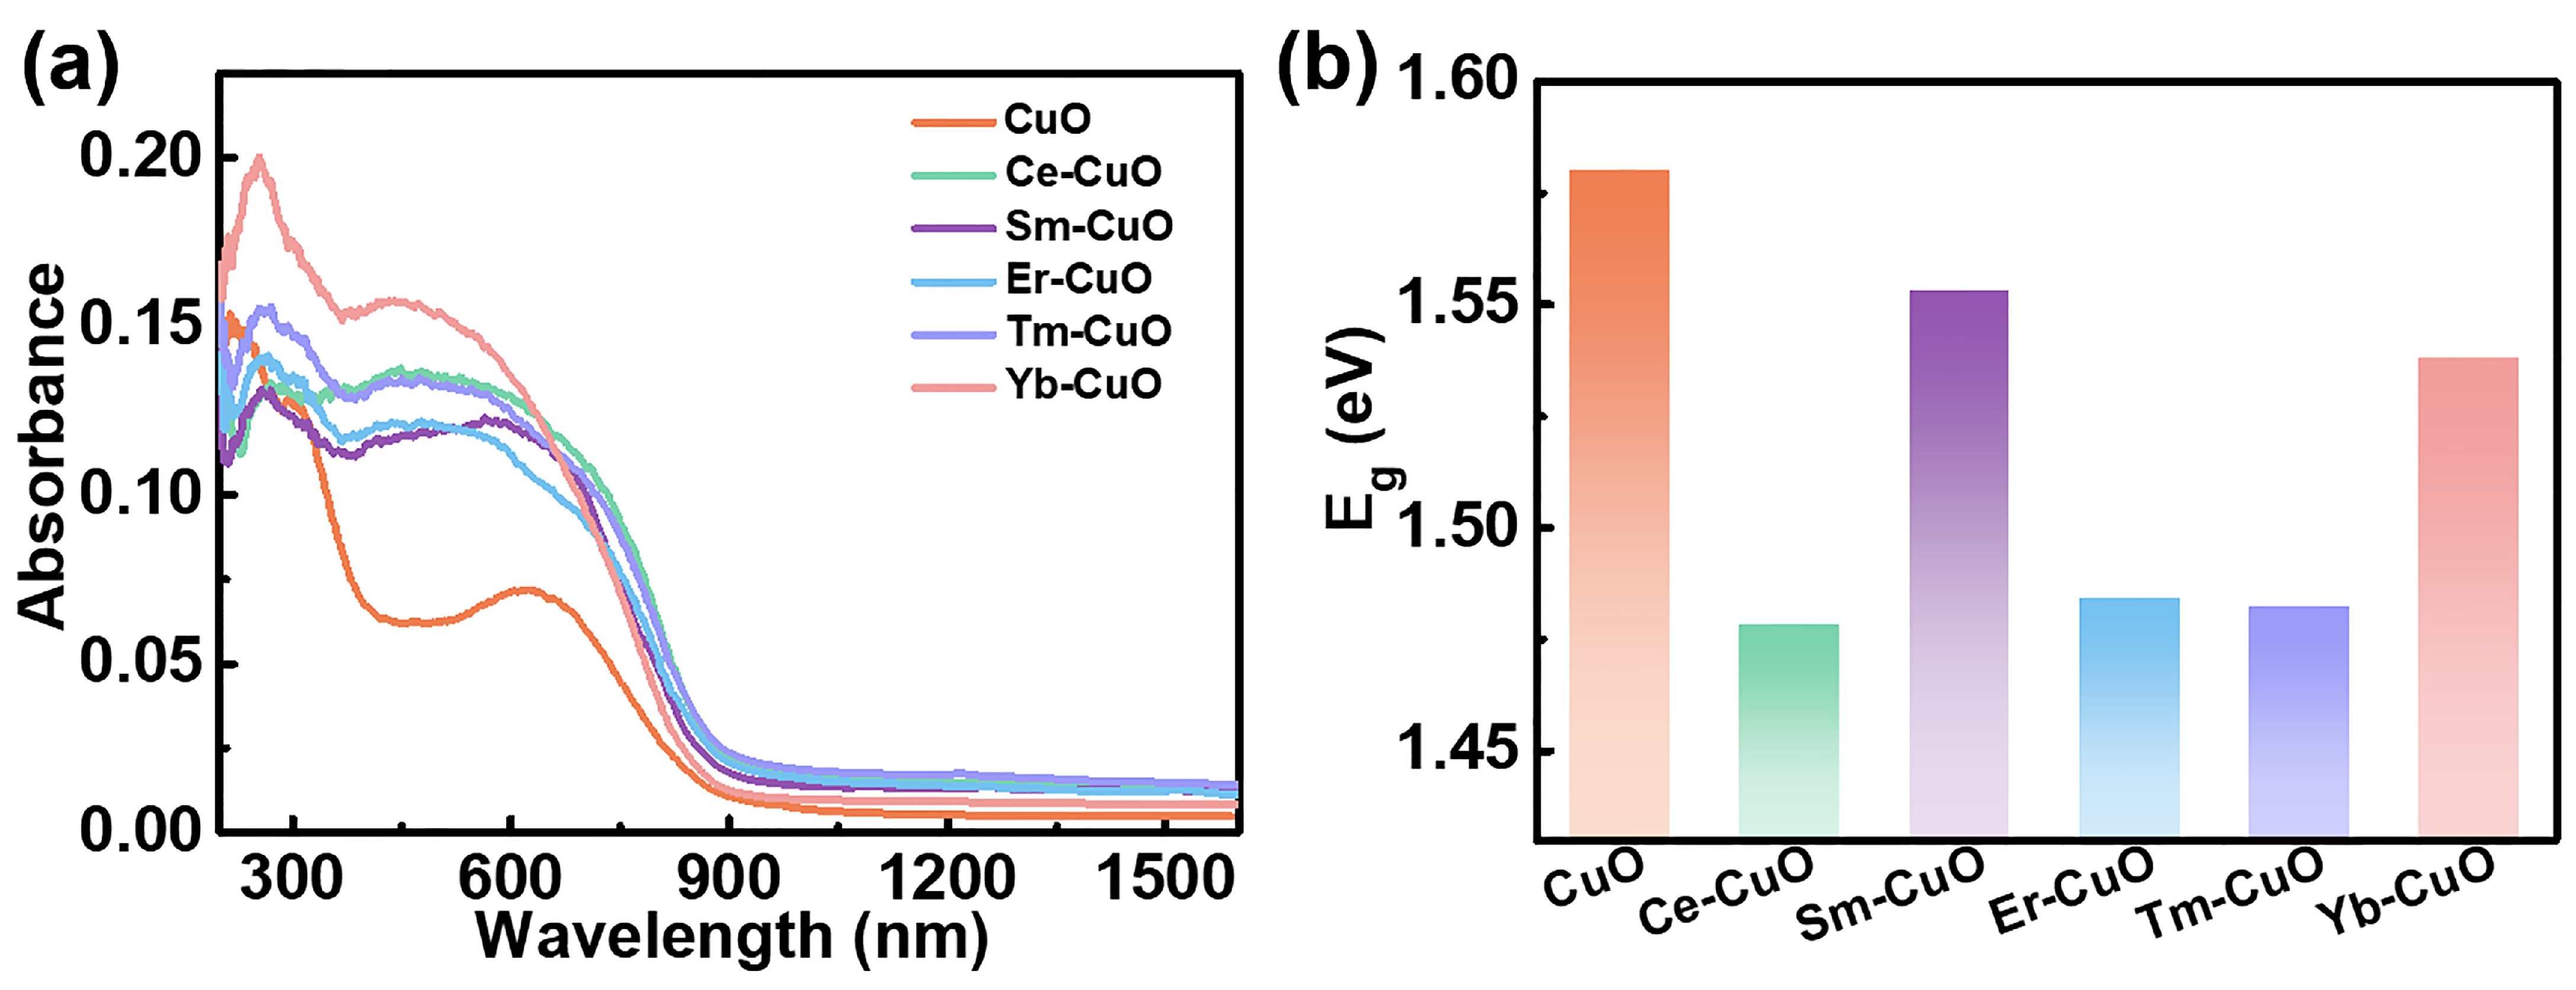
The UV–vis diffuse reflectance spectra in
Figure 6a reveal noticeable modifications in the optical absorption properties of CuO after RE modification. All RE-modified samples exhibit stronger absorption in the 400–800 nm range compared with pristine CuO. Two key features are observed: (1) a discernible red shift of the absorption edge and (2) enhanced absorption intensity across the visible region, indicating a stronger visible-region optical response. This broad-spectrum absorption enhancement may arise from RE-associated electronic interactions, modified surface chemical environments, and morphology-related optical effects.
The complete direct-allowed Tauc plots and the selected linear extrapolation regions are provided in
Figure S11, while
Figure 6b summarizes the resulting apparent optical band-gap values. Linear extrapolation to the photon-energy axis yielded E
g values of 1.580 eV for pristine CuO, 1.478 eV for Ce-CuO, 1.553 eV for Sm-CuO, 1.484 eV for Er-CuO, 1.482 eV for Tm-CuO, and 1.538 eV for Yb-CuO. Thus, all RE-modified samples exhibited slightly lower apparent band-gap values than pristine CuO, with Ce-CuO showing the largest decrease of 0.102 eV. These modest changes indicate RE-dependent shifts in the apparent optical absorption edge and are consistent with changes in the local chemical and electronic environments of CuO. However, Tauc-derived band-gap values depend on the assumed transition type and the selected linear extrapolation region. They are therefore interpreted as internally consistent comparative estimates rather than exact intrinsic band-gap values. Moreover, the apparent band-gap trend does not fully reproduce the photocatalytic-activity order, indicating that optical absorption alone does not determine the overall photocatalytic performance.
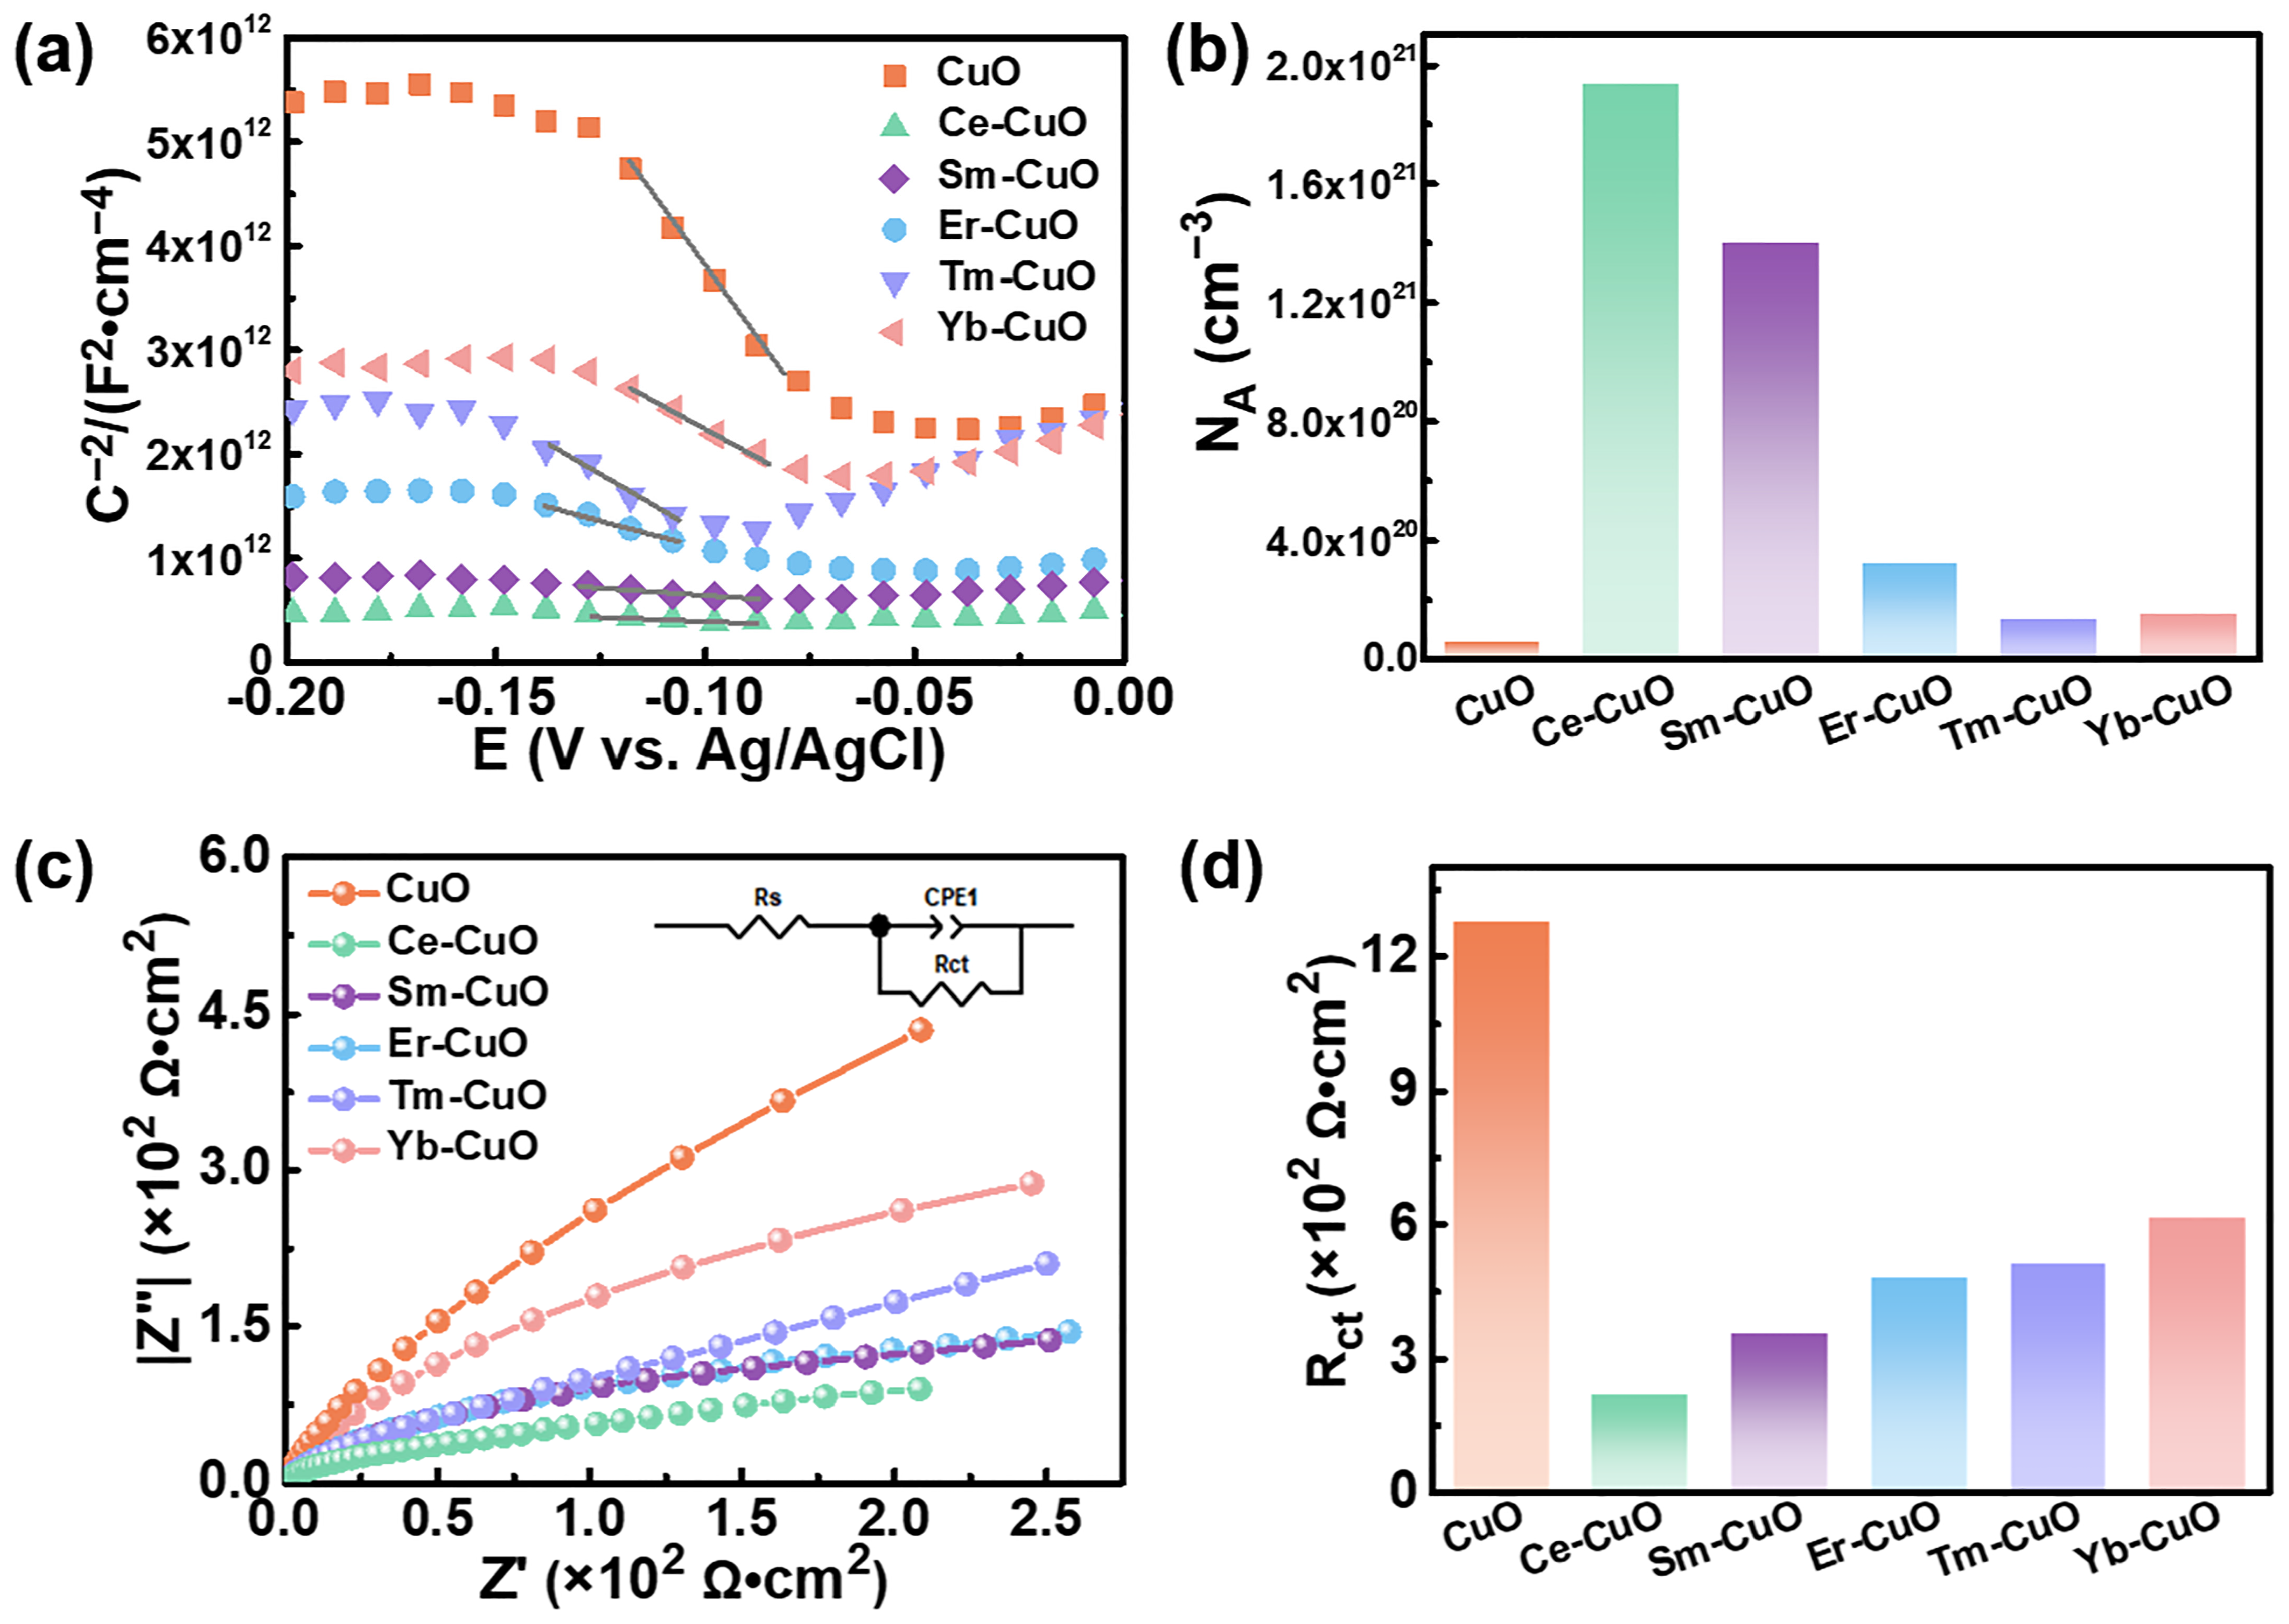
Mott–Schottky plots (
Figure 7a) are consistent with the p-type semiconductor behavior of all samples, as indicated by the negative slopes observed between −0.20 and 0.00 V versus Ag/AgCl. The apparent majority-carrier-density descriptors, expressed as the mean ± fitting-range standard deviation obtained from three adjacent negative-slope fitting windows of each original Mott–Schottky curve, were (5.87 ± 0.23) × 10
19 cm
−3 for pristine CuO, (1.94 ± 0.04) × 10
21 cm
−3 for Ce-CuO, (1.40 ± 0.14) × 10
21 cm
−3 for Sm-CuO, (3.22 ± 0.09) × 10
20 cm
−3 for Er-CuO, (1.36 ± 0.02) × 10
20 cm
−3 for Tm-CuO, and (1.53 ± 0.04) × 10
20 cm
−3 for Yb-CuO. As summarized in
Table S6, the corresponding fitting-range relative standard deviations were 3.97%, 1.99%, 9.79%, 2.92%, 1.64%, and 2.83%, respectively. Sm-CuO exhibited the greatest sensitivity to fitting-window selection, whereas the remaining samples showed comparatively smaller variations. These uncertainty values quantify fitting-range sensitivity within a single Mott–Schottky dataset and should not be interpreted as experimental repeatability.
Ce-CuO and Sm-CuO exhibited substantially higher apparent majority-carrier-density descriptors than pristine CuO, whereas Er-CuO, Tm-CuO, and Yb-CuO showed more moderate increases. Nevertheless, these values remain sensitive to the adopted dielectric-constant approximation, electrode geometry, fitting-window selection, measurement frequency, surface roughness, and non-ideal interfacial capacitance. They are therefore interpreted as comparative apparent descriptors rather than exact intrinsic bulk carrier concentrations. Moreover, the apparent NA descriptor does not directly quantify the population, lifetime, separation efficiency, or surface utilization of photogenerated carriers during photocatalysis. Notably, Sm-CuO exhibited a substantially higher apparent NA and a somewhat lower fitted Rct than Er-CuO, while its triplicate-mean kobs was slightly lower. This non-monotonic relationship is not contradictory because NA, Rct, and kobs describe different aspects of the electrode and photocatalytic reaction system. The Mott–Schottky results are therefore treated as evidence of altered apparent electronic characteristics rather than as a direct predictor of photocatalytic activity.
For the comparative band-edge analysis, a separate representative negative-slope linear fit was selected from each original Mott–Schottky dataset to determine the x-axis intercept and apparent flat-band potential. This fitting procedure was distinct from the three adjacent negative-slope fitting windows used only to evaluate the fitting-range sensitivity of the apparent N
A descriptor in
Table S6. Consequently, the Mott–Schottky R
2 values reported in
Table S7 correspond to the representative intercept fits and are not expected to fall within the R
2 ranges reported in
Table S6. By combining the resulting apparent E
fb values with the Tauc-derived apparent optical band gaps, comparative apparent Fermi-level, valence-band, and conduction-band positions were estimated. The apparent E
F values ranged from −0.076 to +0.169 V, the apparent E
VB values ranged from +0.024 to +0.269 V, and the apparent E
CB values ranged from −1.547 to −1.284 V versus Ag/AgCl. For Ce-CuO, the estimated apparent E
F, E
VB, and E
CB values were −0.076, +0.024, and −1.454 V versus Ag/AgCl, respectively. The resulting comparative apparent band alignment is illustrated in
Figure S12. These positions provide an internally consistent basis for comparing the samples but should not be interpreted as direct absolute energy-level measurements. Their non-monotonic relationship with photocatalytic activity further indicates that the apparent band positions alone do not determine the overall reaction performance.
The electrochemical impedance spectroscopy (EIS) results (
Figure 7c,d) provide insight into charge-transfer behavior. The Nyquist plots exhibit semicircular arcs typical of charge-transfer processes at the electrode/electrolyte interface. The fitted charge-transfer resistance (R
ct) values (
Figure 7d) follow the order: Ce-CuO (216 Ω·cm
2) < Sm-CuO (298 Ω·cm
2) < Er-CuO (354 Ω·cm
2) < Tm-CuO (512 Ω·cm
2) < Yb-CuO (687 Ω·cm
2) < pristine CuO (1280 Ω·cm
2). The lower fitted R
ct values after RE modification indicate reduced interfacial charge-transfer resistance under the electrochemical measurement conditions. Ce-CuO shows the lowest fitted resistance, representing an approximately 83% reduction compared with pristine CuO and indicating a comparatively favorable interfacial charge-transfer environment. The particularly low fitted R
ct of Ce-CuO is consistent with favorable Ce-associated surface electronic interactions and may be partially related to its mixed-valence surface chemistry. Tm-CuO and Yb-CuO also exhibit lower R
ct values than pristine CuO, confirming that RE modification changes the interfacial impedance characteristics. However, EIS reflects the combined electrode/electrolyte interfacial response and does not independently demonstrate a Ce
3+/Ce
4+ redox pathway, photogenerated-carrier lifetime, charge-separation efficiency, or electron–hole recombination kinetics. Moreover, the photocatalytic activity trend does not strictly follow either R
ct or the apparent N
A descriptor alone, as particularly illustrated by the comparison between Sm-CuO and Er-CuO. This non-monotonic behavior indicates that activity is governed by the combined optical, interfacial, adsorption-related, and surface-reaction characteristics of the catalyst. In the absence of PL, time-resolved PL, or transient photocurrent measurements, the present electrochemical results are therefore interpreted as indirect evidence of favorable interfacial charge-transfer characteristics rather than direct proof of enhanced photogenerated charge separation or suppressed recombination.
Previous electrochemical studies of rare-earth-containing oxide electrodes provide useful context for the element-dependent impedance behavior observed here. For example, PrCoO
3, NdCoO
3, and SmCoO
3 perovskite electrodes exhibited distinct cyclic-voltammetric and impedance responses that were correlated with differences in rare-earth-dependent structural disorder, electrical conductivity, and electrochemical behavior [
21]. In another oxide-electrode system, Ce-containing modified PbO
2 electrodes showed altered oxidation characteristics in cyclic voltammetry and lower fitted charge-transfer resistance than the corresponding comparison electrodes [
22]. These studies support the broader view that lanthanide identity and incorporation mode can influence oxide-electrode surface redox behavior and interfacial charge-transfer characteristics. However, the host oxides, electrolytes, electrode reactions, and modification routes in those studies differ substantially from the present RE-modified CuO photocatalysts. Therefore, they are used only as electrochemical context and not as evidence that the same redox or transport mechanisms operate in the present system. Because cyclic voltammetry was not performed here, changes in surface redox peak positions or redox kinetics are not directly claimed.
3.4. Literature-Derived Kinetic Contextualization
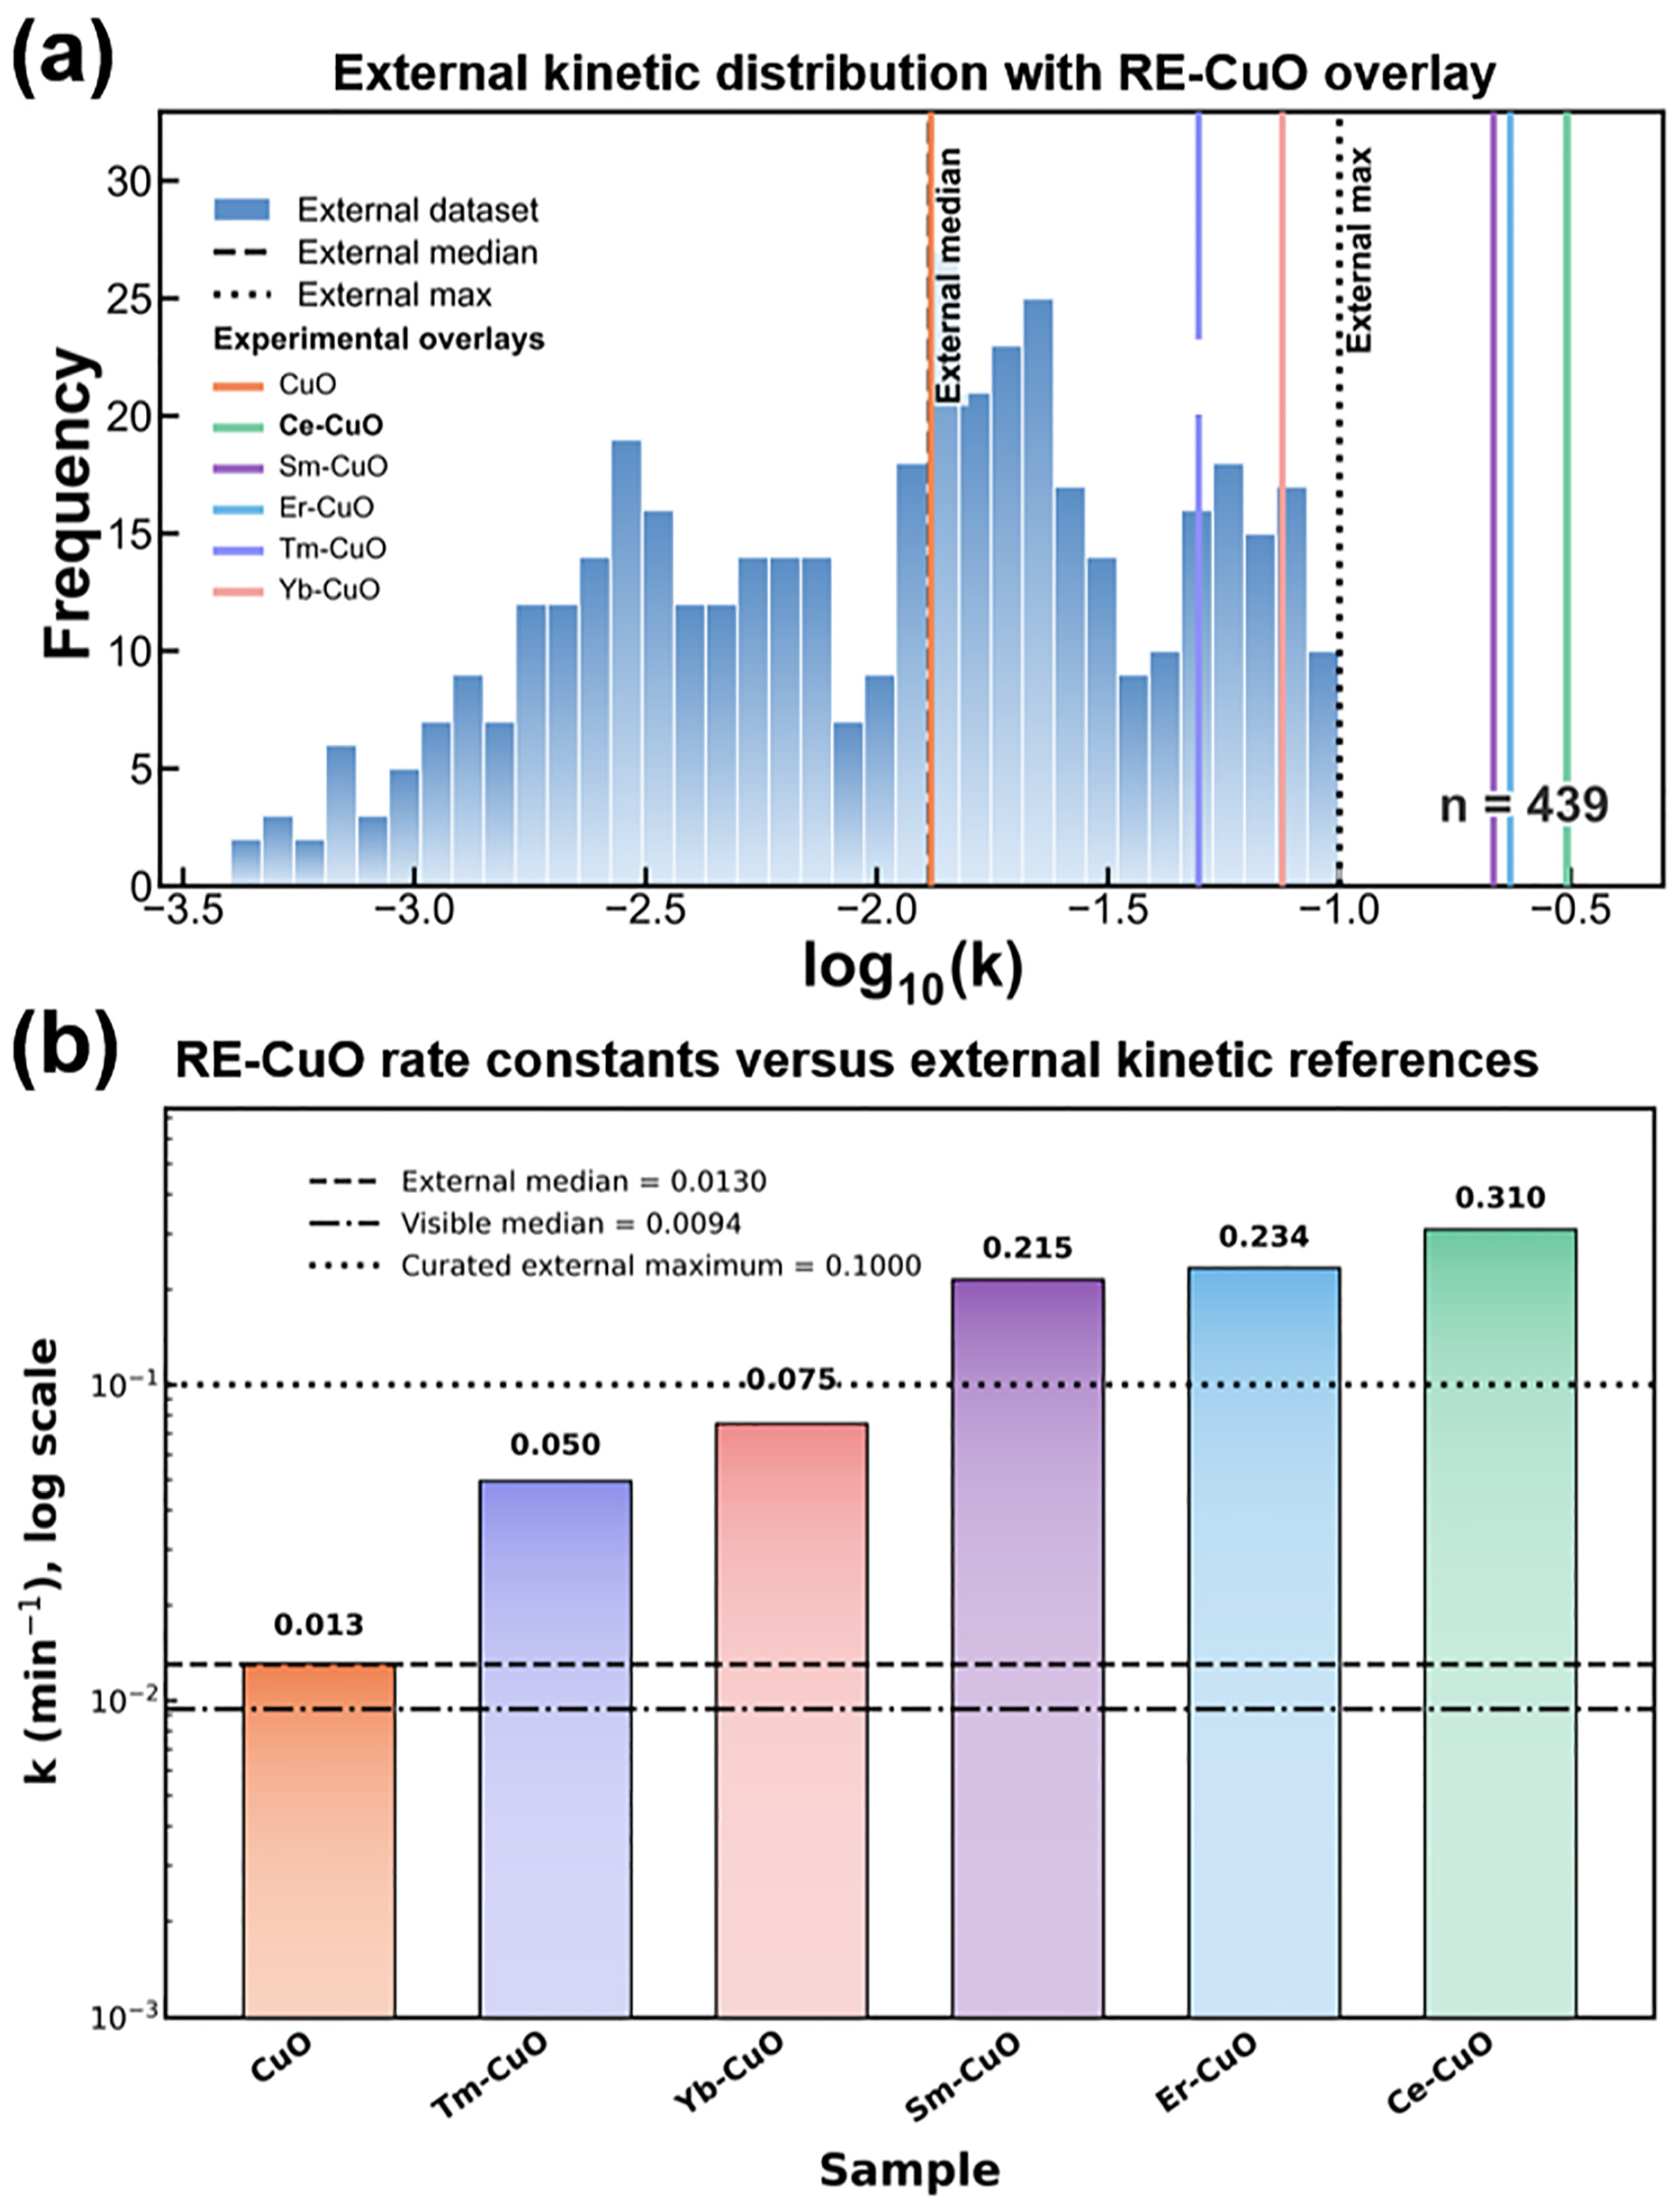
The experimentally measured apparent rate constants, k
obs, were compared with a curated external dataset comprising 439 photocatalytic degradation records collected from 54 literature references. The external dataset exhibited a median apparent rate constant of 0.0130 min
−1, a 95th percentile of 0.0751 min
−1, and a curated maximum of 0.1000 min
−1. As shown in
Figure 8, pristine CuO (k
obs = 0.0131 min
−1) was located close to the external median. Tm-CuO (0.0496 min
−1) was positioned above the median, while Yb-CuO (0.0753 min
−1) was located near the 95th percentile. Sm-CuO (0.2154 min
−1), Er-CuO (0.2342 min
−1), and Ce-CuO (0.3104 min
−1) exceeded the curated maximum of the external reference dataset.
These positions provide only a descriptive external reference for the experimentally measured kinetics. The literature records were obtained under heterogeneous irradiation spectra and intensities, catalyst dosages, pollutant identities and concentrations, pH values, adsorption procedures, and reactor configurations. Therefore, the comparison is not interpreted as a condition-normalized performance ranking or as evidence that the prepared catalysts are intrinsically superior to every catalyst represented in the external dataset. Reference-grouped regression evaluation further showed weak predictive robustness, with the best-performing model yielding a median RMSE of 0.5587 and a median R
2 of −0.0033. Consequently, the model outputs were not used to predict the performance of the prepared catalysts, support mechanistic interpretation, or independently validate Ce-CuO. The external-dataset summary is provided in
Table S8, the dataset construction and preprocessing procedure is detailed in
Table S9, the repeated reference-grouped model robustness is summarized in
Table S10, and the sample-level kinetic contextualization is provided in
Table S11.
To complement the external kinetic contextualization,
Figure S13 presents a descriptive experimental descriptor map relating the representative apparent k
obs to the inverse fitted charge-transfer resistance, 1/R
ct, with bubble size representing the corresponding decolorization efficiency. Ce-CuO occupies the region of comparatively high k
obs and high 1/R
ct, consistent with its comparatively low fitted R
ct. However, the non-monotonic positions of the remaining samples demonstrate that fitted charge-transfer resistance alone does not determine photocatalytic activity.
Figure S13 is therefore interpreted only as an internal cross-descriptor visualization and not as a machine-learning prediction, mechanistic proof, or single-parameter causal relationship.
3.5. Temperature-Dependent Kinetics and Reactive-Species Analysis
Figure S14a–f show the temperature-dependent photocatalytic decolorization profiles of MO over pristine and RE-modified CuO catalysts in the temperature range of 303–333 K under simulated solar irradiation. The decolorization efficiency increased monotonically with increasing temperature for all samples, indicating that the apparent photocatalytic kinetics were thermally promoted under the investigated conditions. Ce-CuO exhibited the highest activity and achieved near-complete MO decolorization at 333 K within 12 min, whereas pristine CuO showed the lowest activity and comparatively weak temperature dependence.
The apparent pseudo-first-order rate constants (kobs), obtained from the linear fitting of −ln(C/C0) against irradiation time, increased with increasing temperature. At each investigated temperature, the apparent rate constants generally followed the order Ce-CuO > Er-CuO > Sm-CuO > Yb-CuO > Tm-CuO > pristine CuO, consistent with the corresponding decolorization trends.
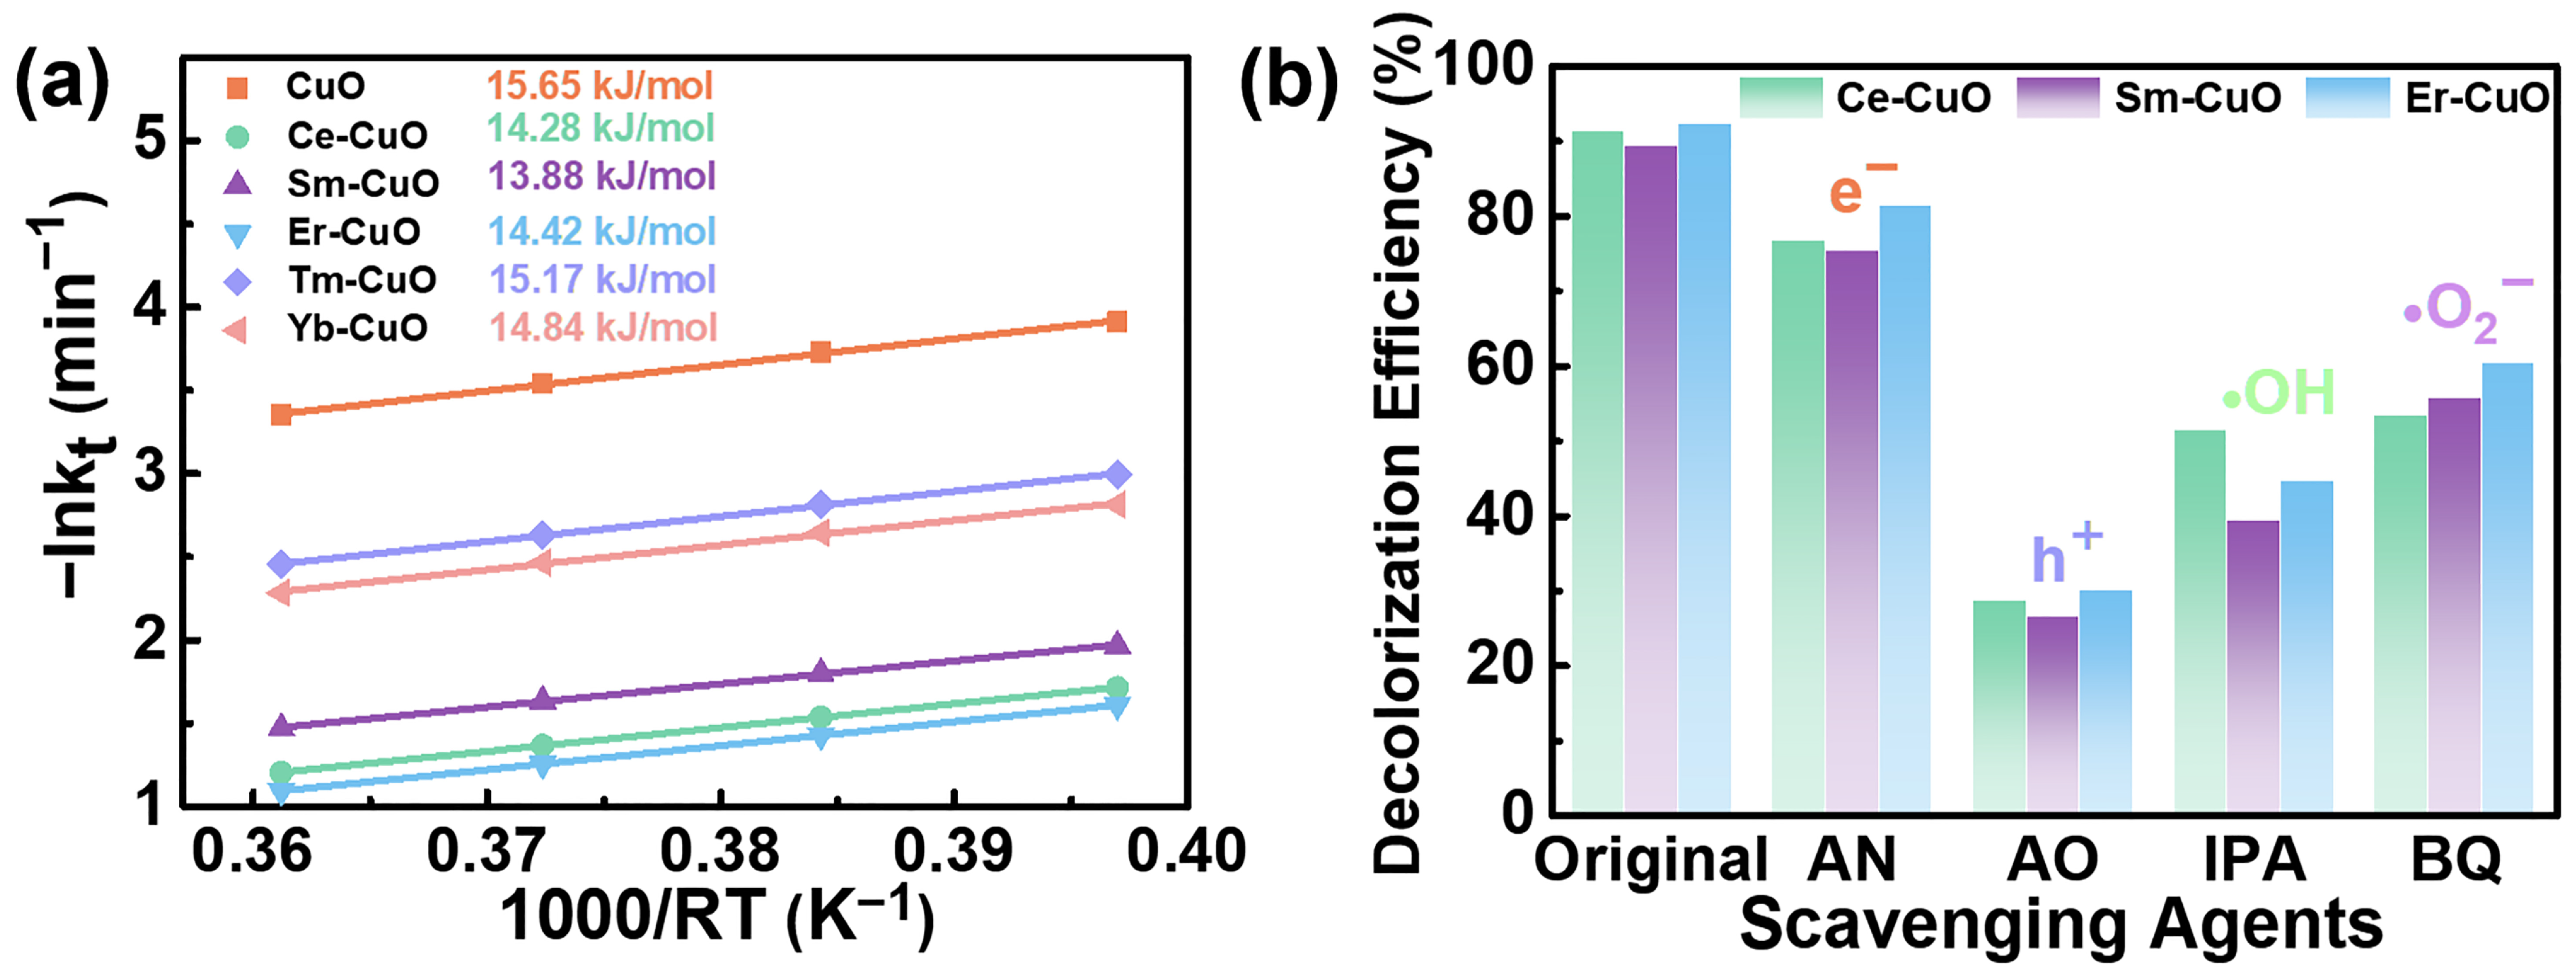
An Arrhenius plot was constructed by plotting -lnk
T as a function of 1000/RT (
Figure 9a). The apparent activation energies were calculated to be 15.65 kJ mol
−1 for pristine CuO, 15.17 kJ mol
−1 for Tm-CuO, 14.84 kJ mol
−1 for Yb-CuO, 14.42 kJ mol
−1 for Er-CuO, 14.28 kJ mol
−1 for Ce-CuO, and 13.88 kJ mol
−1 for Sm-CuO.
The relatively narrow Ea range indicates that the large differences in photocatalytic activity cannot be explained by the apparent activation barrier alone. Variations in the effective pre-exponential term and in the measured apparent rate constants may reflect the combined influence of light absorption, pollutant adsorption, accessible surface-reaction sites, interfacial charge-transfer characteristics, particle aggregation, and other sample-dependent factors under the fixed reaction conditions. Because photoluminescence, time-resolved photoluminescence, and transient photocurrent measurements were not performed, these kinetic differences are not attributed directly to enhanced photogenerated charge separation or suppressed electron–hole recombination.
Reactive-species involvement was evaluated using AgNO
3, ammonium oxalate, isopropyl alcohol, and p-benzoquinone as scavengers for electrons, holes, ⋅OH, and ⋅O
2−, respectively. As shown in
Figure 9b, ammonium oxalate produced the strongest inhibition of MO decolorization, followed by isopropyl alcohol and p-benzoquinone, whereas AgNO
3 showed a comparatively smaller effect. This inhibition pattern suggests that photogenerated holes are the principal oxidative species under the investigated conditions, while ⋅OH and ⋅O
2− also contribute to MO transformation. Because scavenger molecules may additionally influence adsorption, surface reactions, and interfacial processes, these results are interpreted qualitatively and are not used to quantify the absolute contribution of each reactive species.
3.6. Proposed Photocatalytic Mechanism
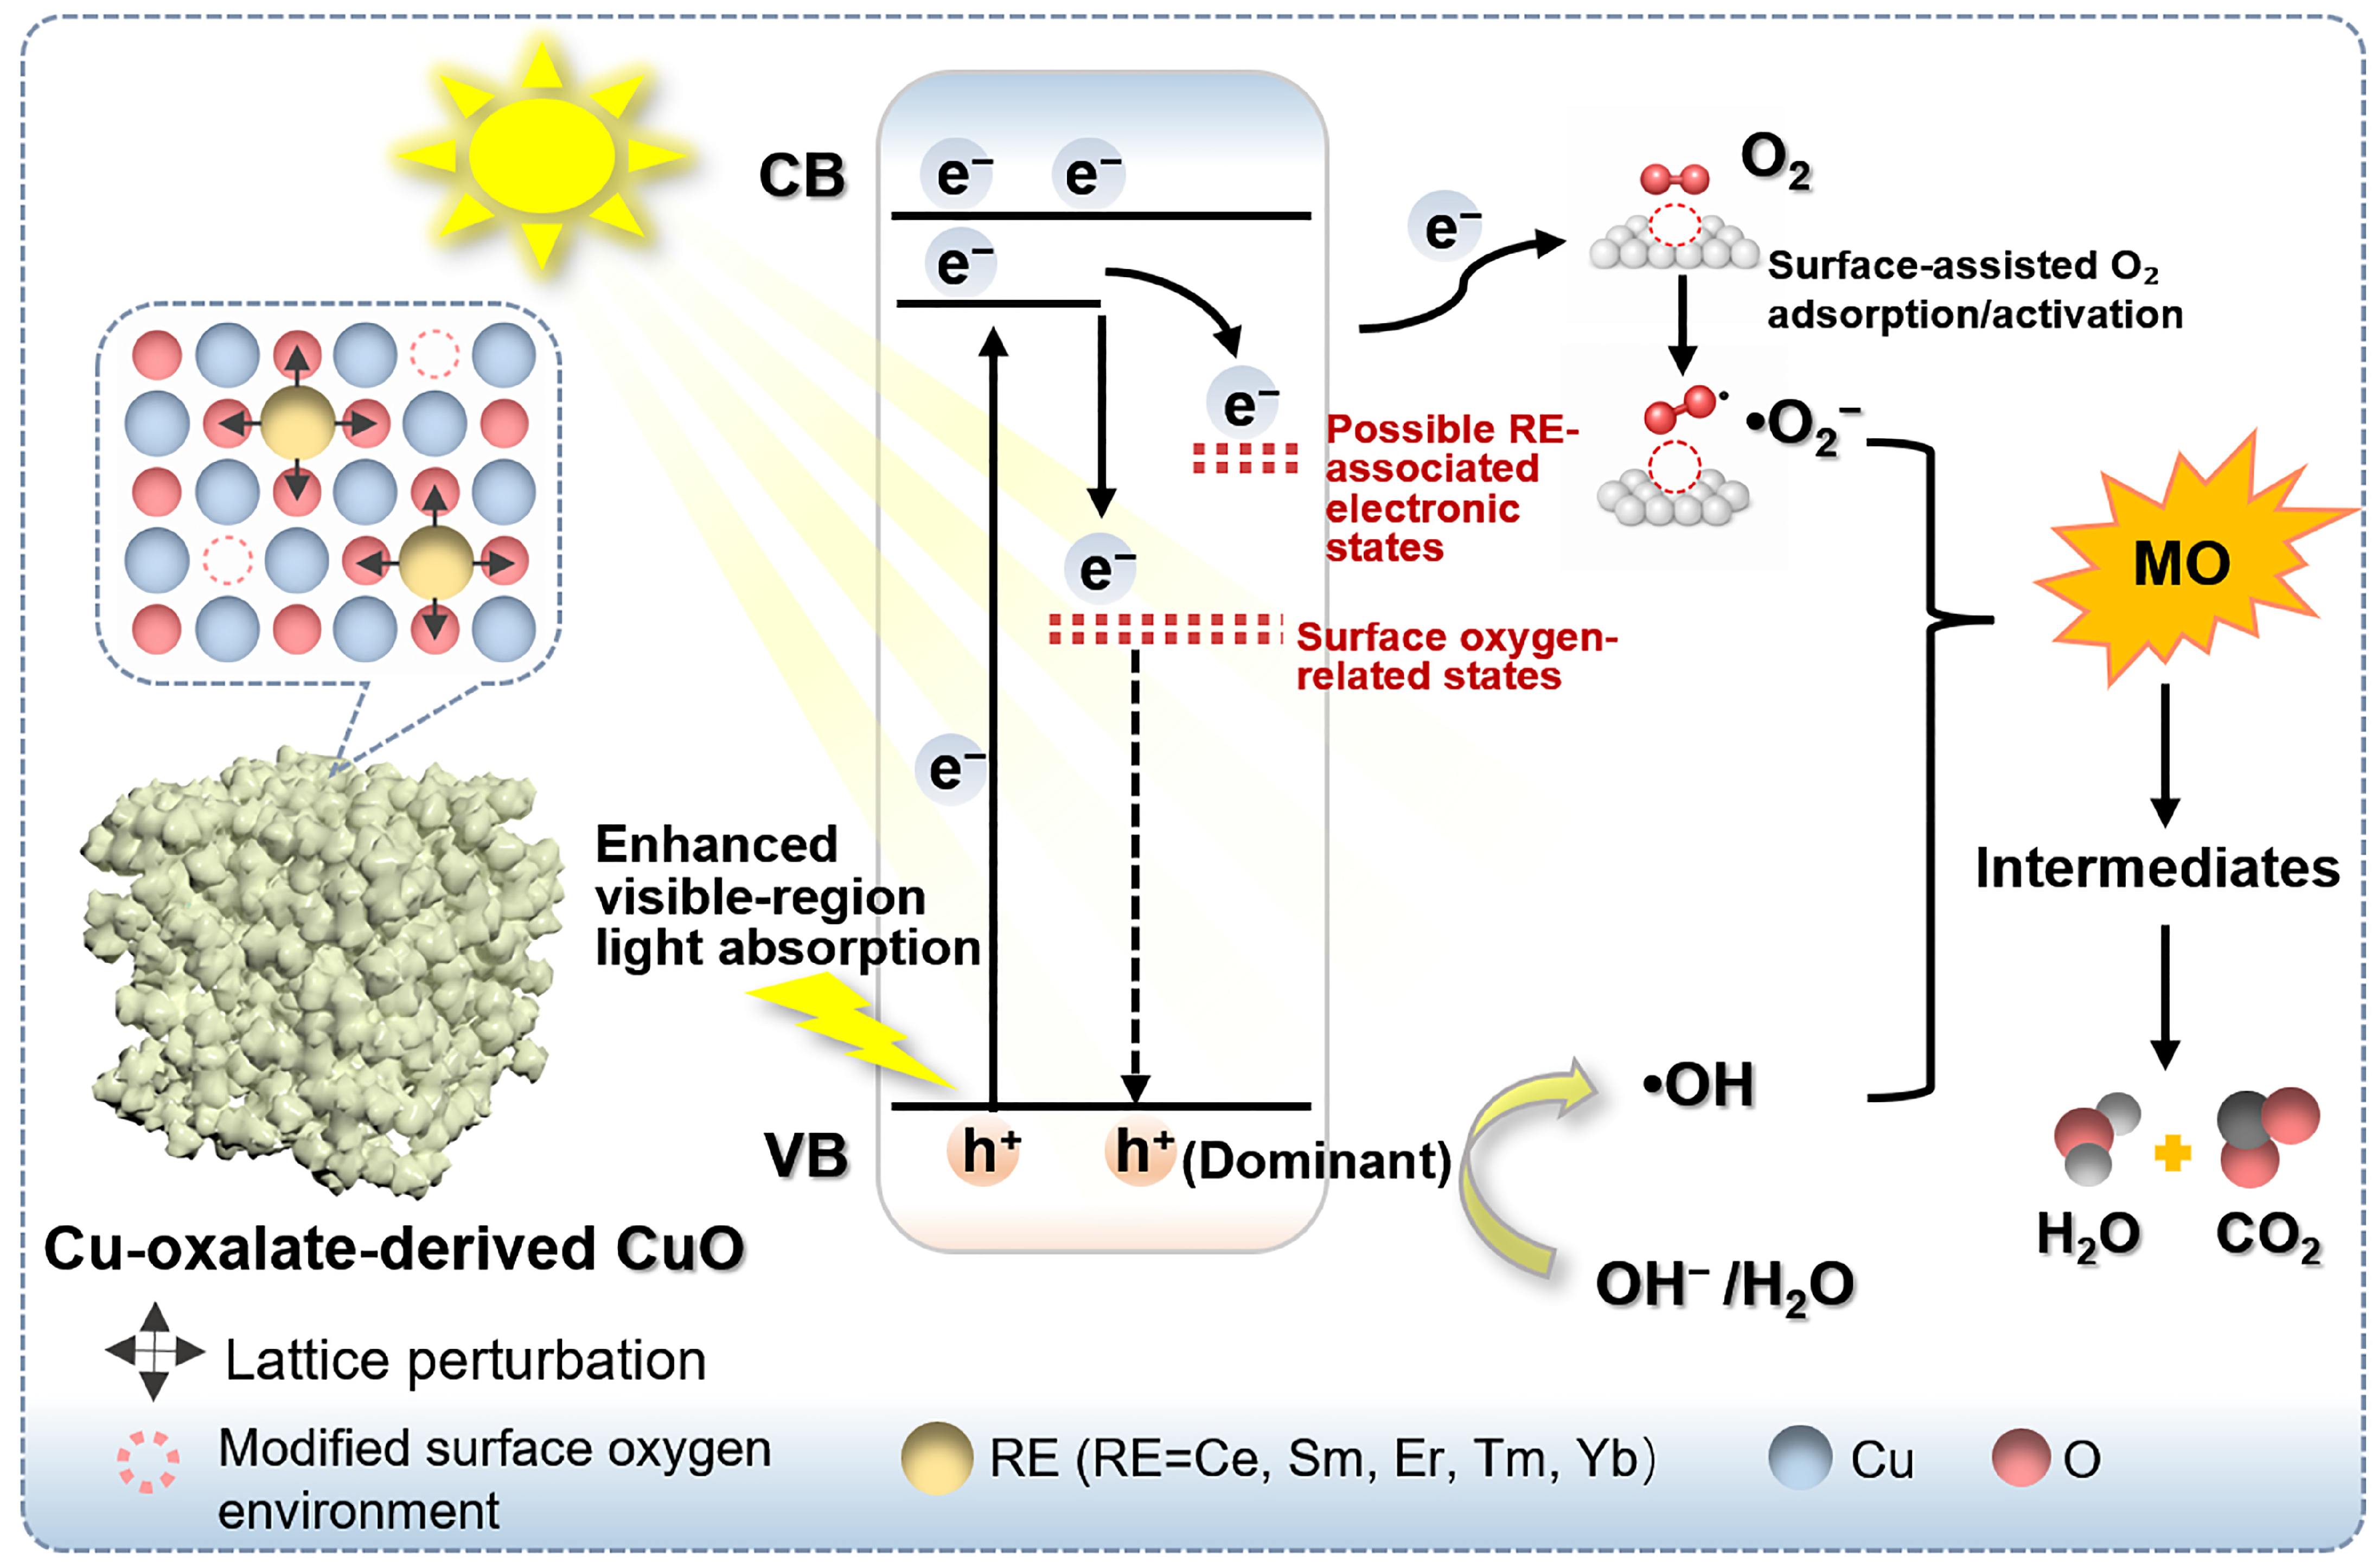
On the basis of the combined optical, electrochemical, surface-chemical, kinetic, NPOC, and reactive-species-scavenging results, a conservative photocatalytic transformation pathway is proposed in
Figure 10. Under simulated solar irradiation, CuO absorbs incident photons with sufficient energy to generate conduction-band electrons and valence-band holes. RE modification is associated with modest apparent band-gap narrowing, altered surface oxygen chemical environments, changes in the apparent majority-carrier-density descriptors, and reduced fitted interfacial charge-transfer resistance relative to pristine CuO. Possible RE-associated electronic states and surface oxygen-related states may influence the transient accommodation and interfacial transfer of photogenerated electrons. However, because photoluminescence, time-resolved photoluminescence, transient photocurrent, and operando spectroscopic measurements were not performed, these states are represented qualitatively in
Figure 10 and are not treated as directly demonstrated electron-trapping centers.
The scavenger experiments showed that ammonium oxalate produced the strongest inhibition of MO decolorization, indicating that photogenerated holes were the principal oxidative species under the investigated conditions. Isopropyl alcohol and p-benzoquinone also inhibited the reaction, suggesting the participation of ·OH and ·O2−, respectively, whereas AgNO3 produced a comparatively smaller effect. Photogenerated holes may therefore directly oxidize adsorbed MO molecules, while conduction-band electrons may be transferred to surface-adsorbed O2 to generate ·O2−. In addition, the participation of ·OH is represented in Equation (20), which is consistent with hole-driven oxidation involving surface OH−/H2O under the present reaction conditions. Taken together, the scavenger results support a mechanism in which h+ plays the dominant role, while ·OH and ·O2− act as additional reactive oxidative species that promote the transformation of MO.
For Ce-CuO, the ex situ XPS results are consistent with the coexistence of Ce
3+- and Ce
4+-related surface states. Previous studies of Ce-containing oxide photocatalysts provide precedent for Ce
4+/Ce
3+ electron exchange and subsequent transfer of an electron to adsorbed O
2 [
16,
17,
18,
55]. Moreover, a previous Ce-loaded CuO study also proposed the Ce
4+/Ce
3+-assisted O
2-activation route, providing direct literature precedent in a compositionally related CuO-based system [
31]. On this basis, Ce
4+ may temporarily accept an electron to form Ce
3+, followed by electron transfer from Ce
3+ to adsorbed O
2 and regeneration of Ce
4+. Earlier Ce-modified CuO studies support composition-dependent changes in optical and photocatalytic behavior [
9,
31], but they do not establish that the identical operando Ce cycle occurs in the present material. The proposed electron-exchange sequence could facilitate interfacial O
2 activation; however, dynamic Ce
3+/Ce
4+ interconversion was not monitored under irradiation and is therefore considered a literature-supported mechanistic possibility rather than a directly demonstrated elementary process.
The general photoexcitation and oxygen-reduction steps can be summarized as follows [
8,
17,
18]:
For the proposed Ce-related electron-exchange pathway in Ce-CuO, based on the Ce
4+/Ce
3+ redox/O
2-activation precedent reported previously [
31,
55],
Further oxidation may produce a mixture of residual organic intermediates and mineralized products [
48,
49]:
In the present experiment, the progressive decrease in the principal MO absorption band and the transient spectral feature at 410–430 nm in
Figure S8 provide direct spectral evidence for disruption of the MO chromophore and the temporary presence of spectrally distinct transformation intermediates. Prior MO-transformation studies show that changes in the characteristic UV–vis bands can accompany chromophore cleavage and intermediate formation, whereas assignment of individual products requires chromatographic or mass-spectrometric evidence [
48,
49,
56]. A recent related study employed high-resolution mass spectrometry together with in silico toxicity assessment for product identification and residual-risk evaluation [
56], underscoring that decolorization alone does not necessarily demonstrate complete detoxification. Because the intermediates in the present work were not identified by chromatographic or mass-spectrometric analysis, a specific molecular degradation sequence is not assigned. As shown in
Figure S9, the NPOC concentration decreased from 4.94 to 1.405 mg L
−1 after 9 min of Ce-CuO treatment, corresponding to an apparent aqueous organic-carbon reduction of 71.6%. This result indicates that the pronounced spectral decolorization was accompanied by substantial organic-carbon removal and deep oxidative transformation rather than simple chromophore bleaching alone. At the same time, the residual NPOC shows that mineralization was not complete within the tested reaction period. Therefore, the mechanistic pathway shown in
Figure 10 and Equations (18)–(23) is interpreted as reflecting substantial transformation of MO into intermediate species together with partial conversion to mineralized products. Accordingly, the CO
2 and H
2O shown in
Figure 10 and Equation (23) represent possible products of the mineralized fraction rather than complete conversion of all MO-derived carbon.
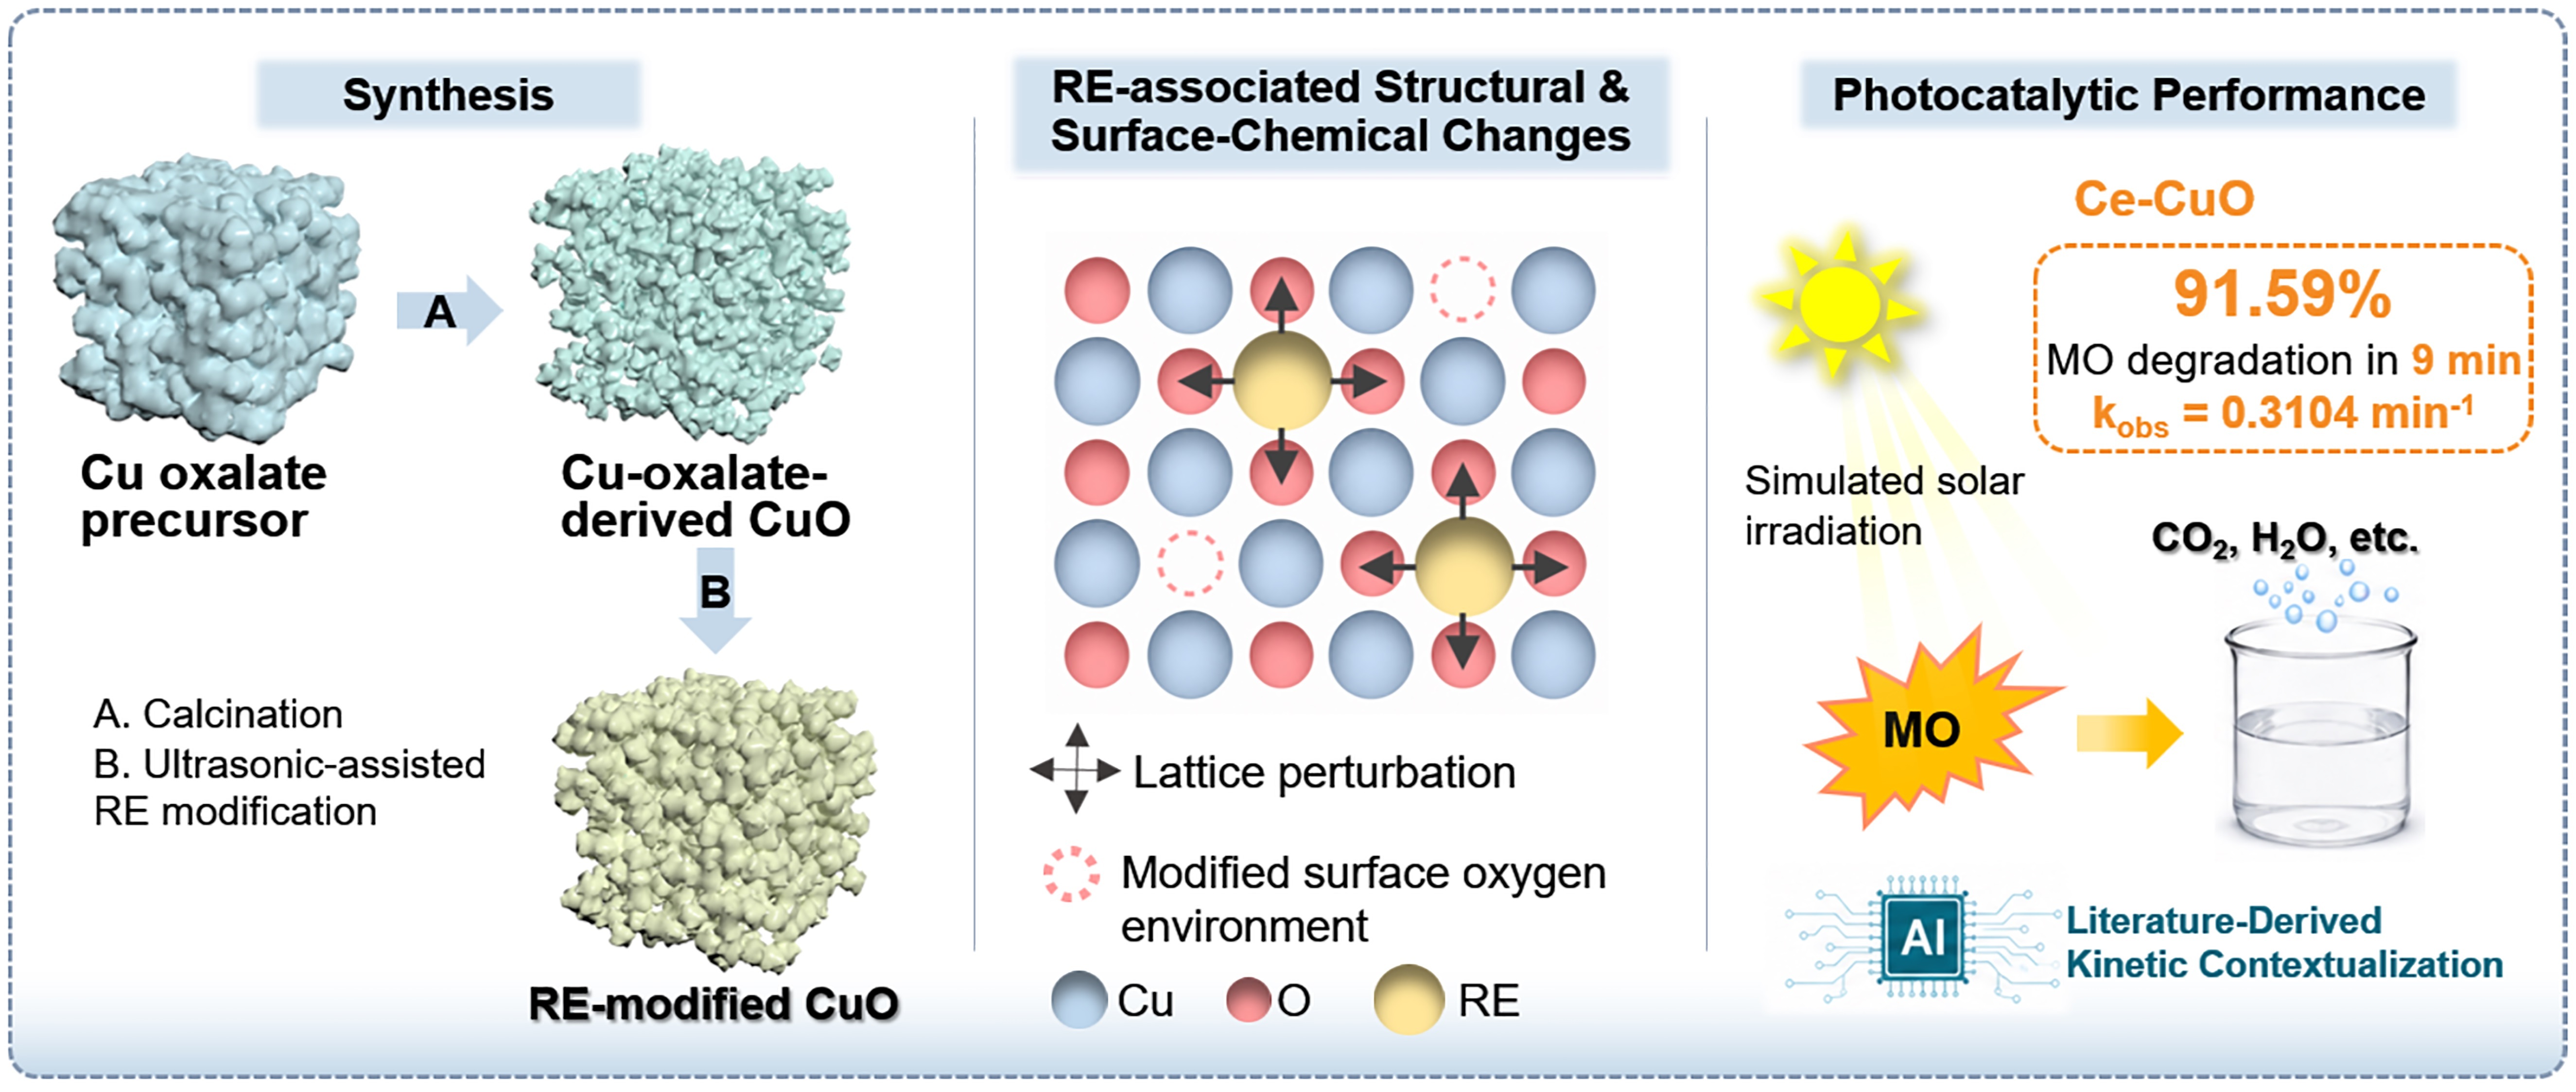
Overall, the superior performance of Ce-CuO is interpreted as arising from the combined influence of its visible-region optical response, modified surface oxygen environment, apparent majority-carrier-density characteristics, and comparatively low fitted interfacial charge-transfer resistance. Within this framework, the dominant contribution of photogenerated holes, the auxiliary participation of ·OH and ·O2−, and the possible Ce4+/Ce3+-mediated O2 activation pathway together provide a reasonable explanation for the enhanced short-time MO decolorization observed for Ce-CuO. Possible RE-associated electronic states and Ce3+/Ce4+ electron exchange may contribute to interfacial electron transfer and O2 activation, but neither process is presented as independently demonstrated. The proposed mechanism therefore describes experimentally supported reactive-species involvement and conservative literature-supported interfacial pathways without assigning the observed activity to a single unverified elementary mechanism.




 ,
,