1. Introduction
Due to differences in pore size, hierarchical honeycomb nanoporous materials have better practical applications than single-porous nanoporous materials in all respects. However, there are few studies on the stress–strain relationships of hierarchical honeycomb nanoporous materials through the spherical nanoindentation; thus, the functions of hierarchical nanoporous materials are limited to a certain extent.
Usually, the stress–strain (σ-ε) relationship of a material is obtained via uniaxial tensile or uniaxial compression tests. The elastoplastic mechanical properties of the material can also be measured from the relationship curves. However, for small-sized components that cannot be prepared for standard tensile or compression specimens, the material properties of the small-sized components mentioned above need to be obtained by other means. So far, it has been the intent of many scholars to obtain the corresponding stress–strain curves of small-sized specimens through spherical nanoindentation technology which is consistent with the relevant properties obtained by standard tensile tests or compression tests [
1]; moreover, the mechanical properties of small-sized materials are finally obtained from the σ-ε curves. Pathak et al. [
2,
3,
4,
5] developed a method for extracting the spherical indentation σ-ε relationship from the corresponding indentation force–depth curve, and the indentation elastic modulus and the indentation yielding stress were obtained from the indentation σ-ε relationship. Weaver et al. [
6] compared the Al-6061 spherical indentation σ-ε relationship with the results of the uniaxial tensile test, and found that the scale factor between the uniaxial tensile yield strength and the indentation yield strength was approximately 1.9. Weaver et al. [
7] studied the mechanical response of single-phase α-Ti-64, single-crystal (α-β), few-crystalline and polycrystalline clusters of Ti-64 using spherical indentations, and found that the indentation modulus and the yield strength of multiple indentations remained relatively constant, but decreased with the indenter size. The method of the indentation σ-ε relationship has also been extended to other composites [
8,
9,
10,
11,
12,
13,
14,
15,
16] from the load–displacement data through spherical nanoindentation experiments. In all the studies examined, it can be seen that the appropriate definitions of the contact area, the stress and the strain in the indentation are very important.
In this paper, based on the former research on spherical indentation, the suitable calculation formulas for the hierarchical honeycomb nanoporous materials in the nanoindentation are selected, uniaxial compression tests on the hierarchical honeycomb nanoporous materials are simulated, and the spherical nanoindentation macroscopic stress–macroscopic strain relationship of the hierarchical materials is derived via the spherical nanoindentation and the uniaxial compression. From the macroscopic stress–macroscopic strain relationships, the macroscopic nanoindentation modulus and the macroscopic nanoindentation yielding strength of the hierarchical nanoporous materials are analyzed using the empirical formulas. These can not only complement existing studies on the hierarchical honeycomb nanoporous materials, but also contribute to further research on this material.
2. Theory
To obtain the stress and the strain relation corresponding to the material from the curve of the nanoindentation force–nanoindentation depth relation, the contact radius
has been calibrated by many researchers [
6,
17,
18,
19,
20,
21] through combining Hertz theory and Sneddon tests to examine the frictionless contact on the two isotropic materials. Further, homogeneous bodies with quadratic surfaces can be calibrated to take into account the complex changes in the sample surface geometry [
4] and generally estimated using the spherical nanoindenter as the following equation:
Here,
is the nanoindenter radius and
is the contact penetration calculated by the following equation [
22]
Here,
is the maximal depth,
is the maximal force, and
is 0.75 for the sphere nanoindenter.
is calculated by
, and
is the effective elastic modulus calculated by the following equations:
where
is a dimensionless parameter related to the geometry of the nanoindenter (for the circular nanoindenter,
).
and
denote the elastic modulus of the specimen and the nanoindenter, respectively.
and
are, respectively, the Poisson’s ratio of the specimen and the nanoindenter [
22].
The contact area
and the nanoindentation stress
[
22,
23] are defined as follows:
Because the distribution of the stress and the strain in the nanoindentation zone is extremely uneven, the nanoindentation representative stress
and the nanoindentation representative strain
of the hierarchical nanoporous material are defined as follows [
2,
4,
5,
6,
17,
18,
19,
20,
21,
22,
23,
24]:
Here,
is the limiting factor (Patel
[
18], Weaver
[
6], Tabor
[
19], Liu
[
24] and segmented-function representation [
25]). The value of the limiting C* is defined by comparing the results of the nanoindentation and the uniaxial tensile or uniaxial compression tests on the material.
C* is decided by the indentation strain and increases with the increasing strain.
C* depends on the type of indenters and the materials [
18,
19,
20,
24,
25].
3. Results and Discussion
In this part, the 3D finite-element nanoindentation models of the hierarchical honeycomb nanoporous films are established, uniaxial compression tests on the hierarchical honeycomb nanoporous materials are simulated, and the spherical nanoindentation macroscopic stress–macroscopic strain relationship of the hierarchical honeycomb nanoporous material is defined by the combination of the nanoindentation and the uniaxial compression simulation in the end. Further, the macroscopic elastic modulus and the macroscopic yielding stress of the hierarchical material are obtained from the stress–strain curve. At the same time, the results are analyzed with the empirical formula.
3.1. Nanoindentation on the Hierarchical Honeycomb Nanoporous Materials
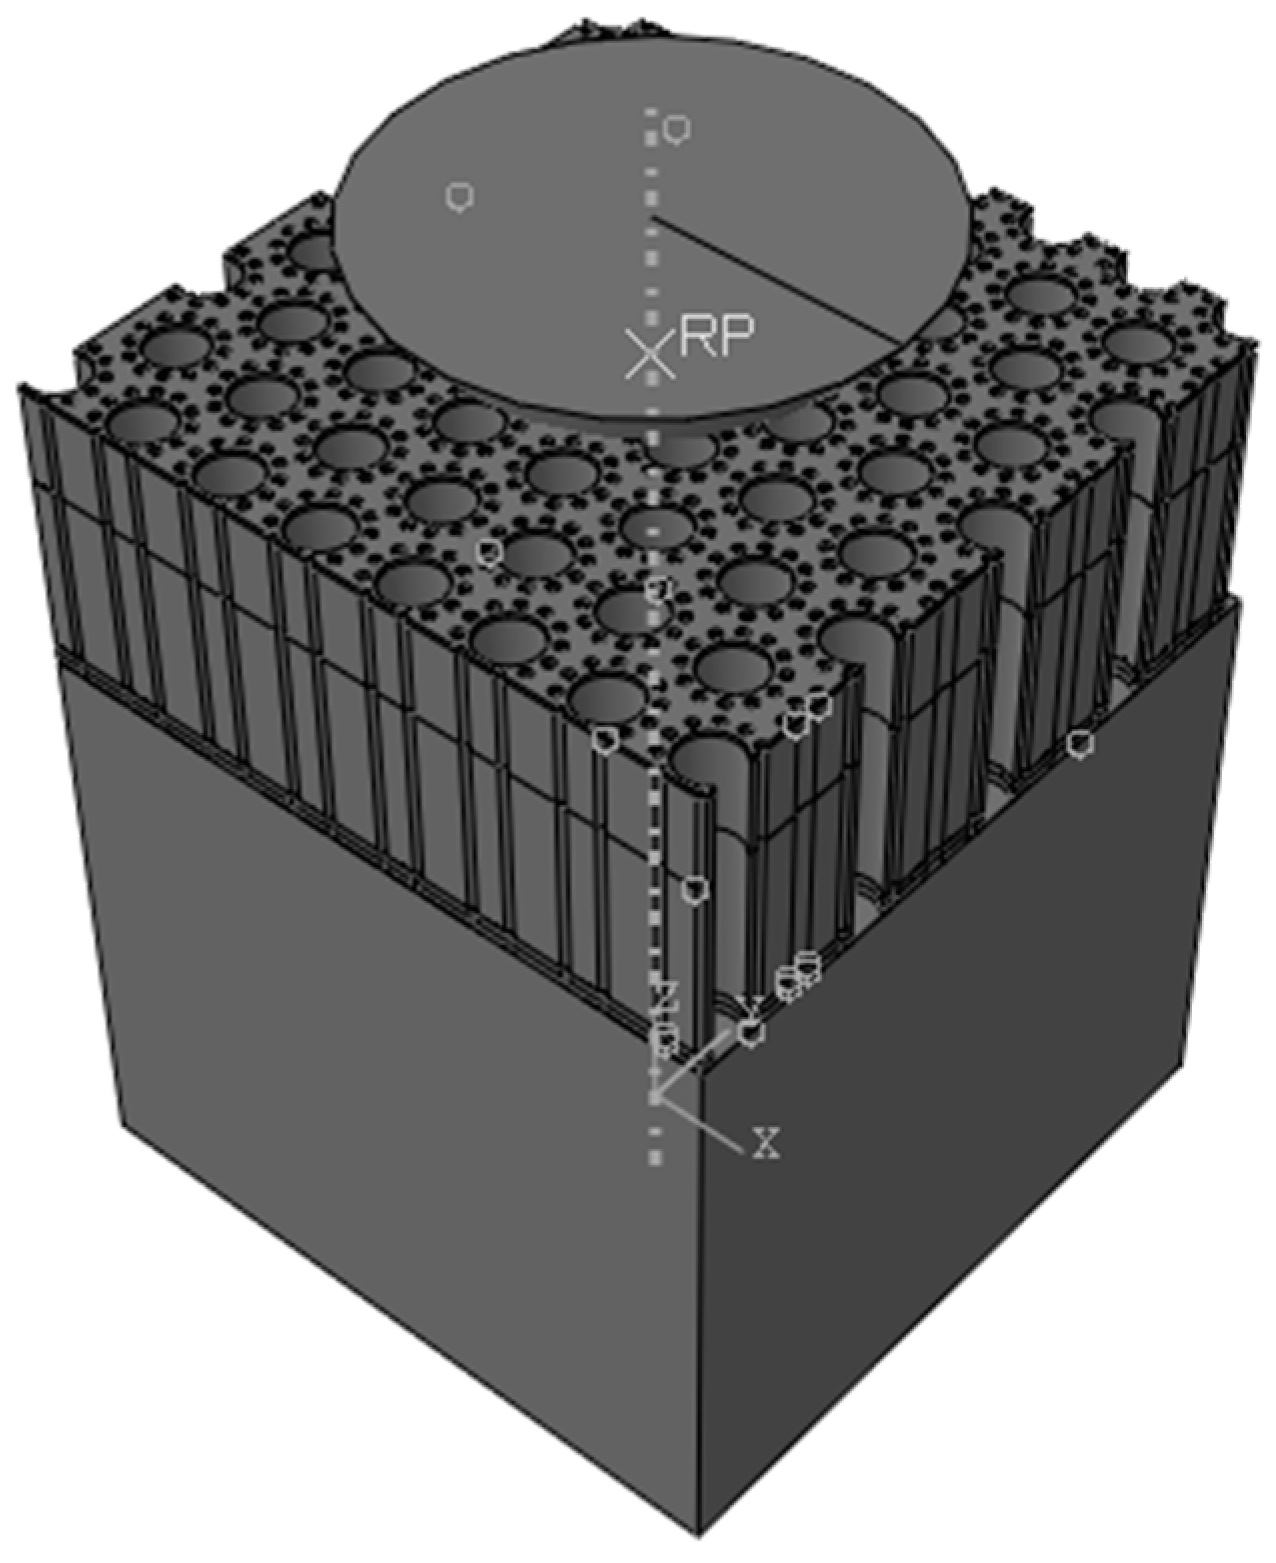
The 3D finite nanoindentation models of the hierarchical honeycomb nanoporous film with a relative density of 54.4% (one big hole R = 49.541 nm, twelve small holes r = 8.777 nm shown in
Figure 1) are nanoindented from 5 nm to 55 nm by Abaqus 6.14. The spherical nanoindenter is assumed to be a rigid body (
). The hierarchical nanoporous films are simulated using C3D8R elements, and the elements close to the nanoindenter tip are refined to obtain accurate results. The elastic Si substrate (the elastic modulus E = 127 GPa, Poisson’s ratio
) is modeled with C3D8R elements. The friction effects between the spherical nanoindenter and the hierarchical nanoporous film are ignored [
26]. The film–substrate interface retains perfect integrity. Both the film and the substrate are assumed to be homogeneous and isotropic. The solid material (the elastic modulus E = 55 GPa, Poisson’s ratio
, the yielding stress
) of the hierarchical honeycomb nanoporous materials with a film thickness of 500 nm is assumed to be the elastic–perfectly plastic material. In the analysis, the macro Poisson’s ratio
of the hierarchical nanoporous materials is equivalent to Poisson’s ratio
of the solid materials [
27,
28,
29,
30] and
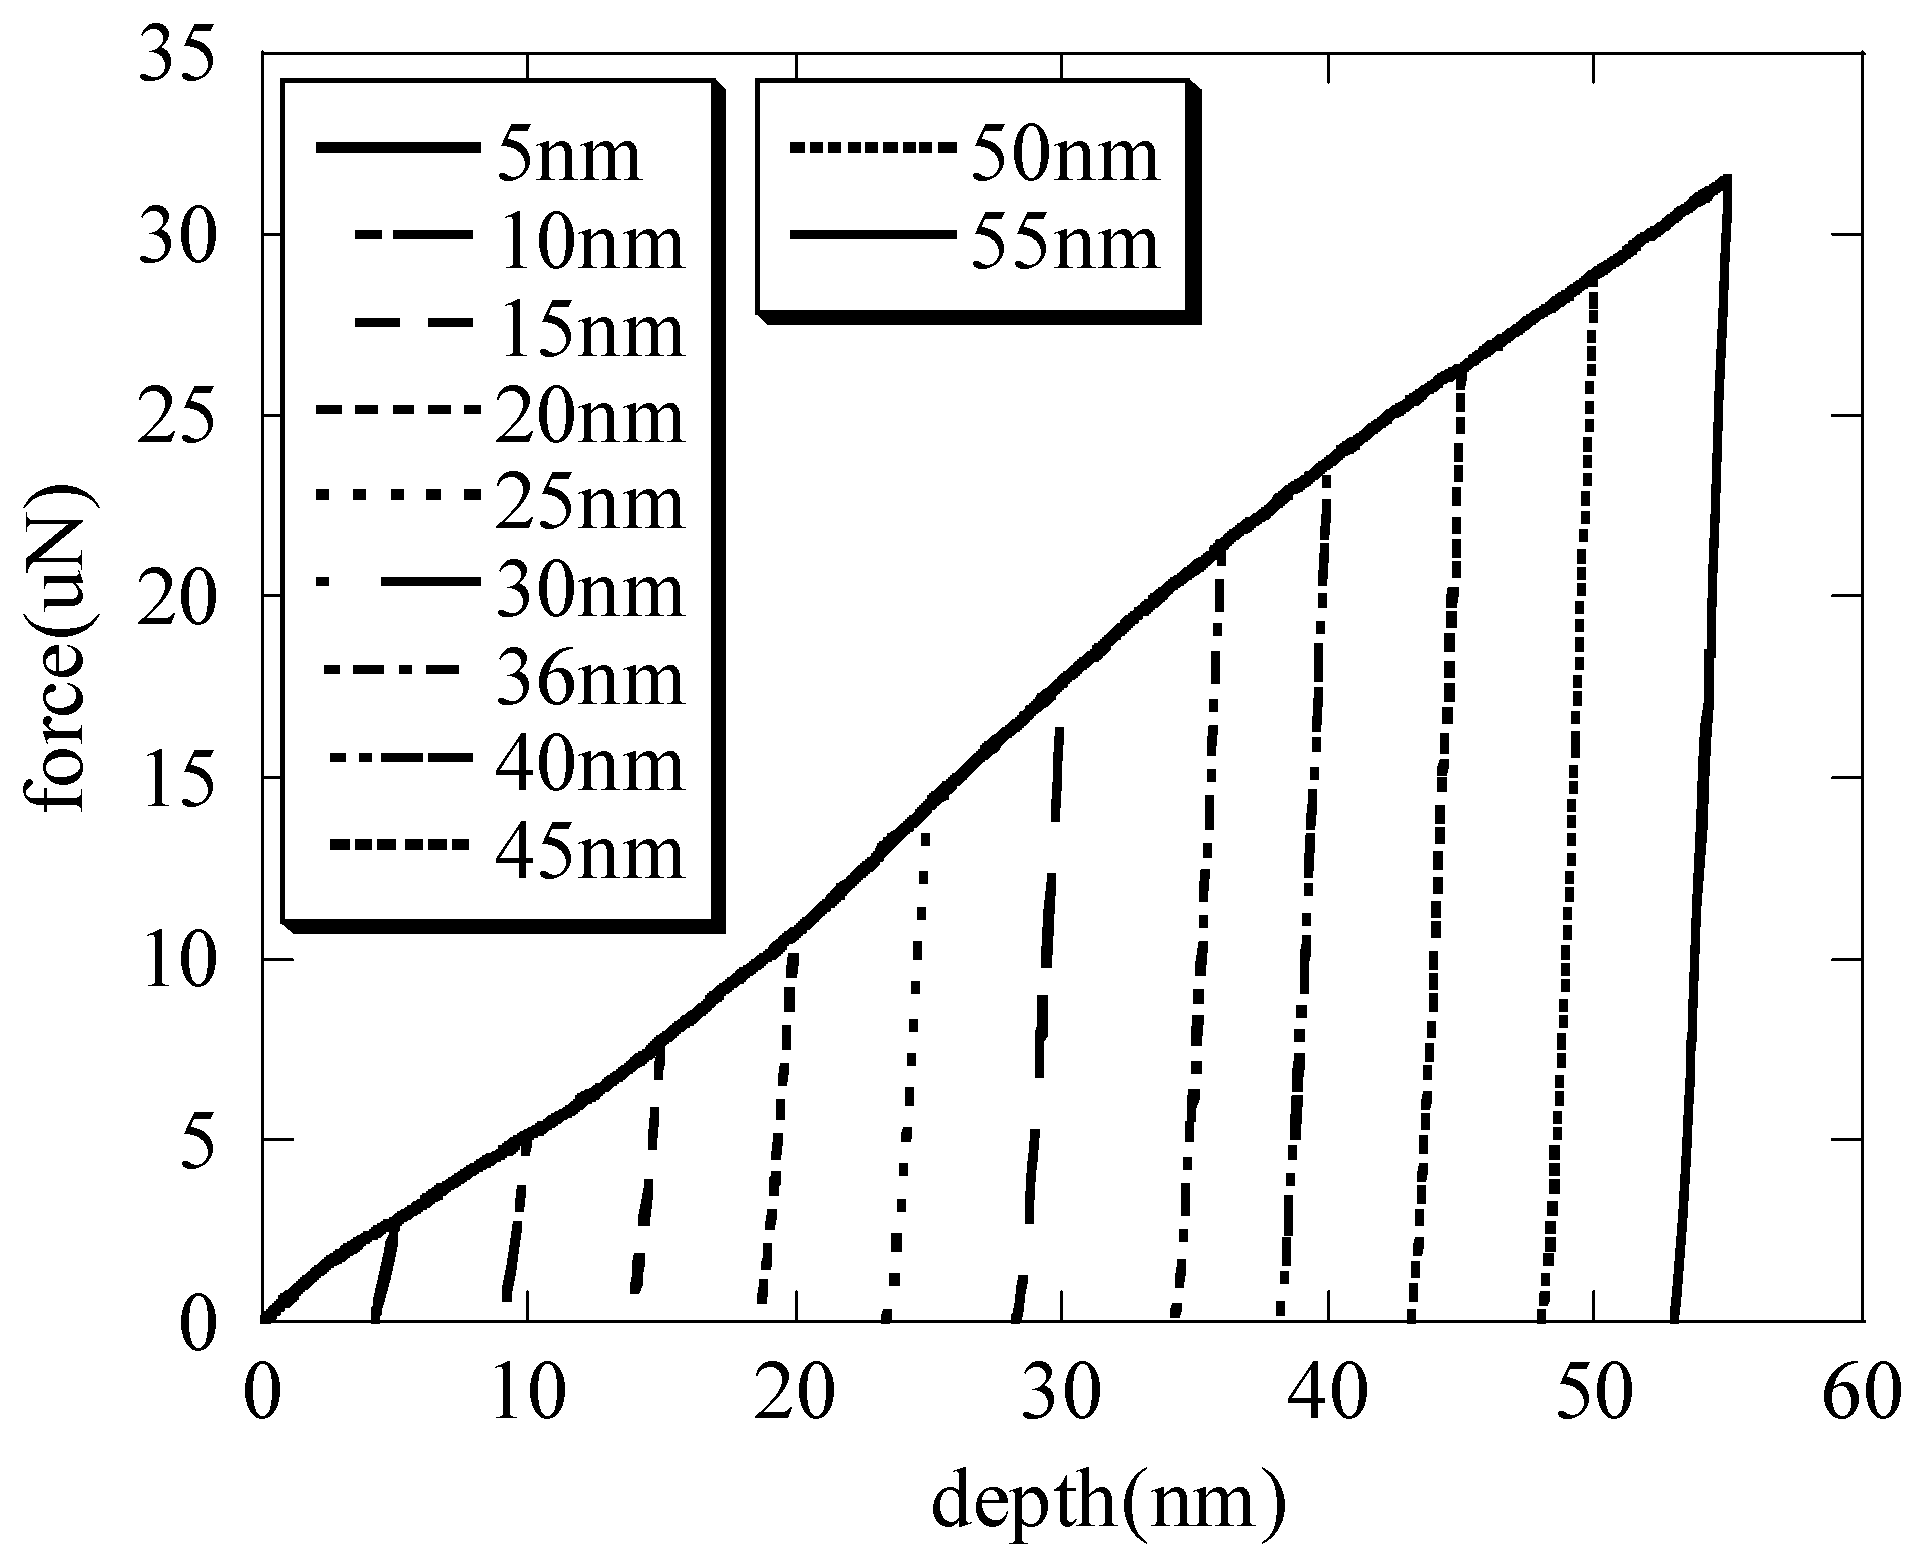
for the rigid nanoindenter. The force–depth curves that are nanoindented with different maximum depths on the specimens are shown in
Figure 2.
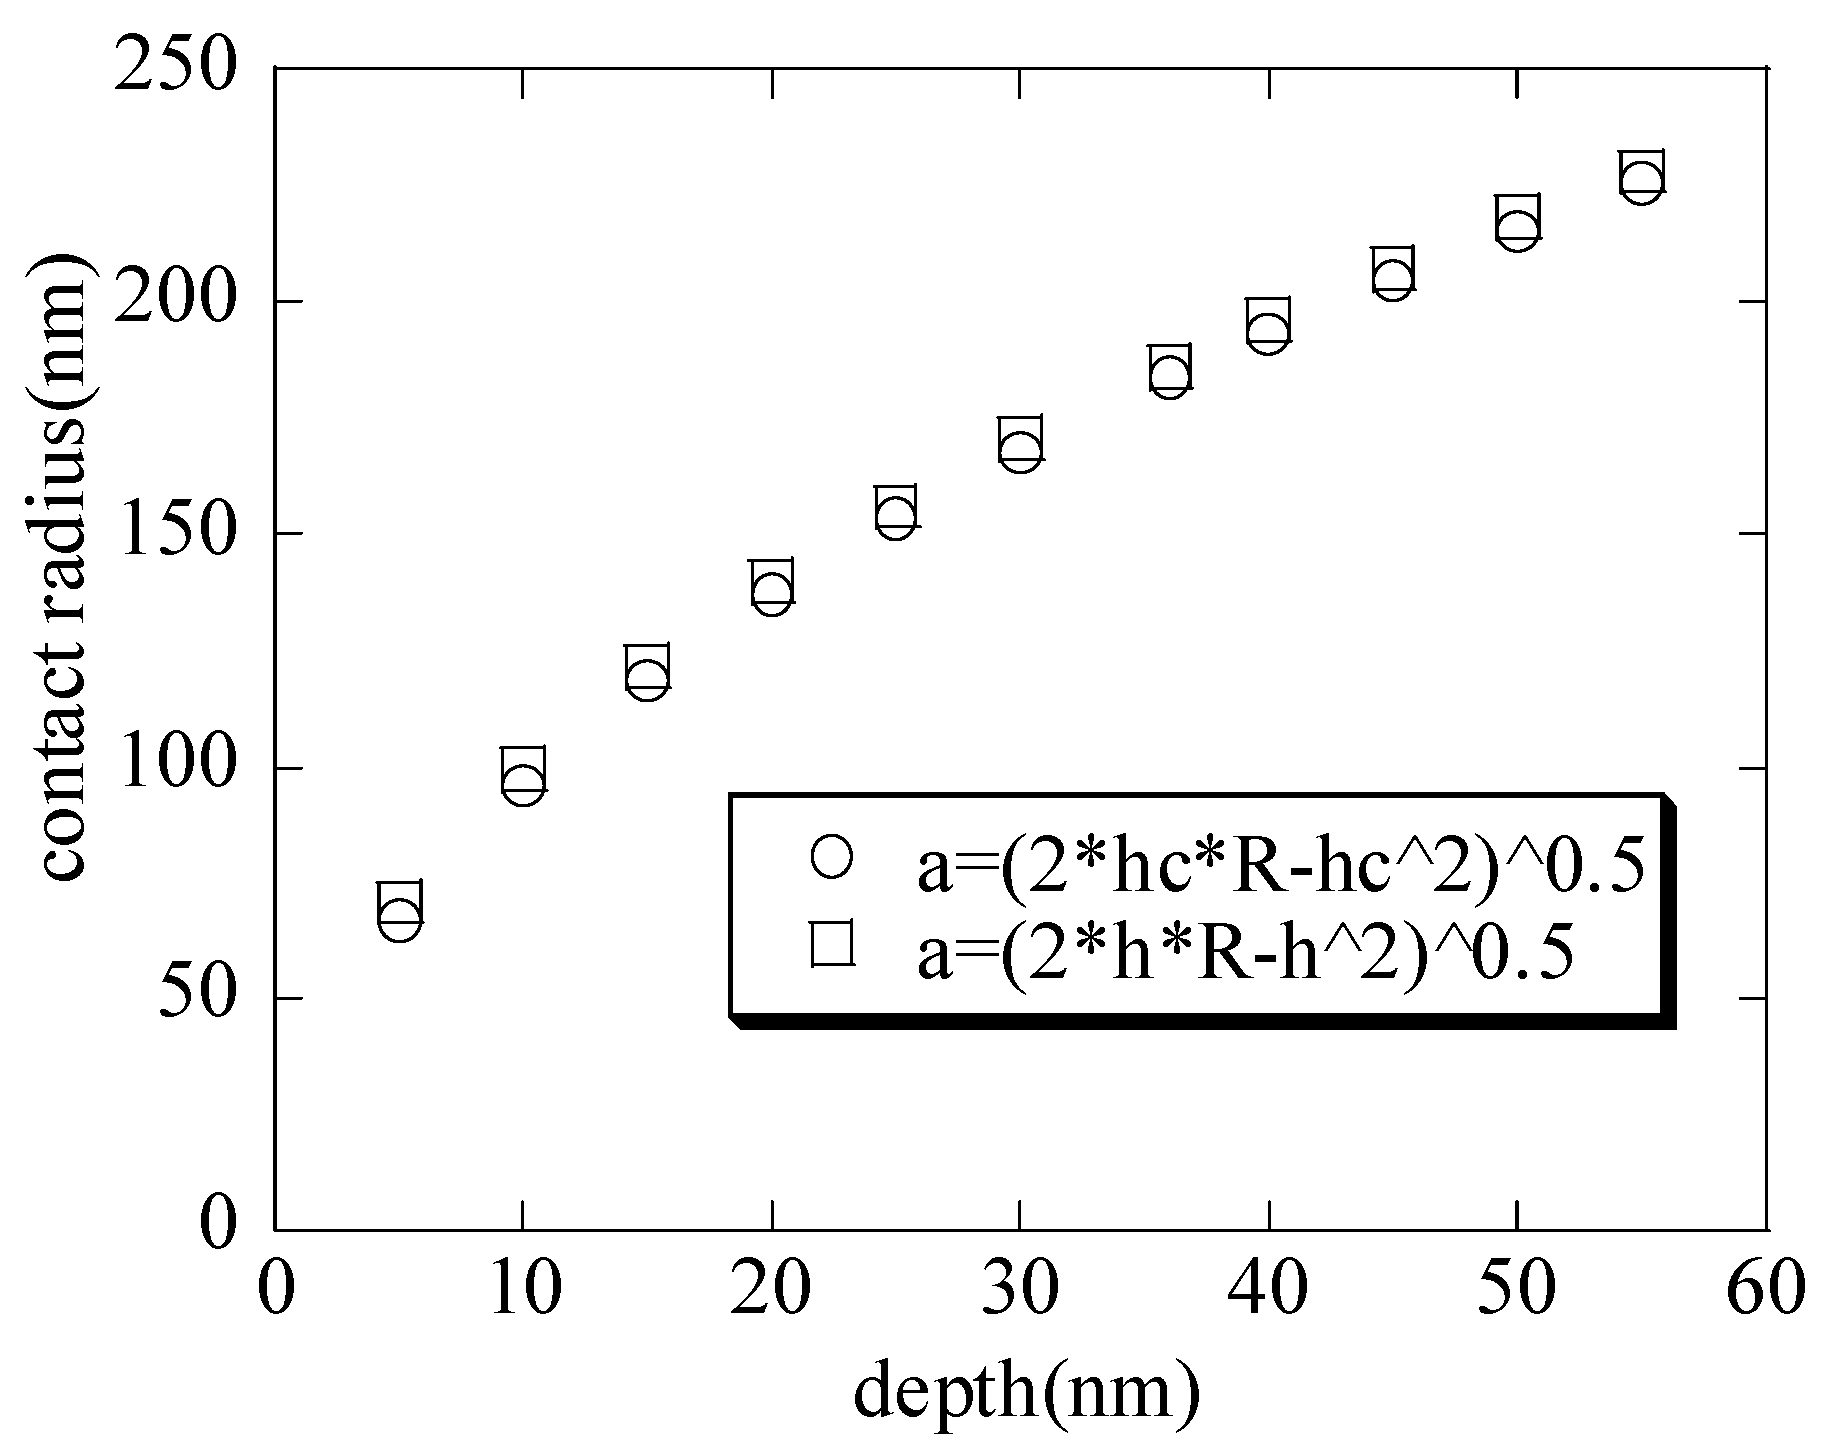
With the increasing maximum depth, the contact radii (shown in
Figure 3) are calculated by substituting the contact depth
and the total depth
into Equation (1), respectively. It is seen that the contact radii are basically the same; thus, the contact radius
when the nanoindenter radius is far greater than the depth. This is also consistent with the literature [
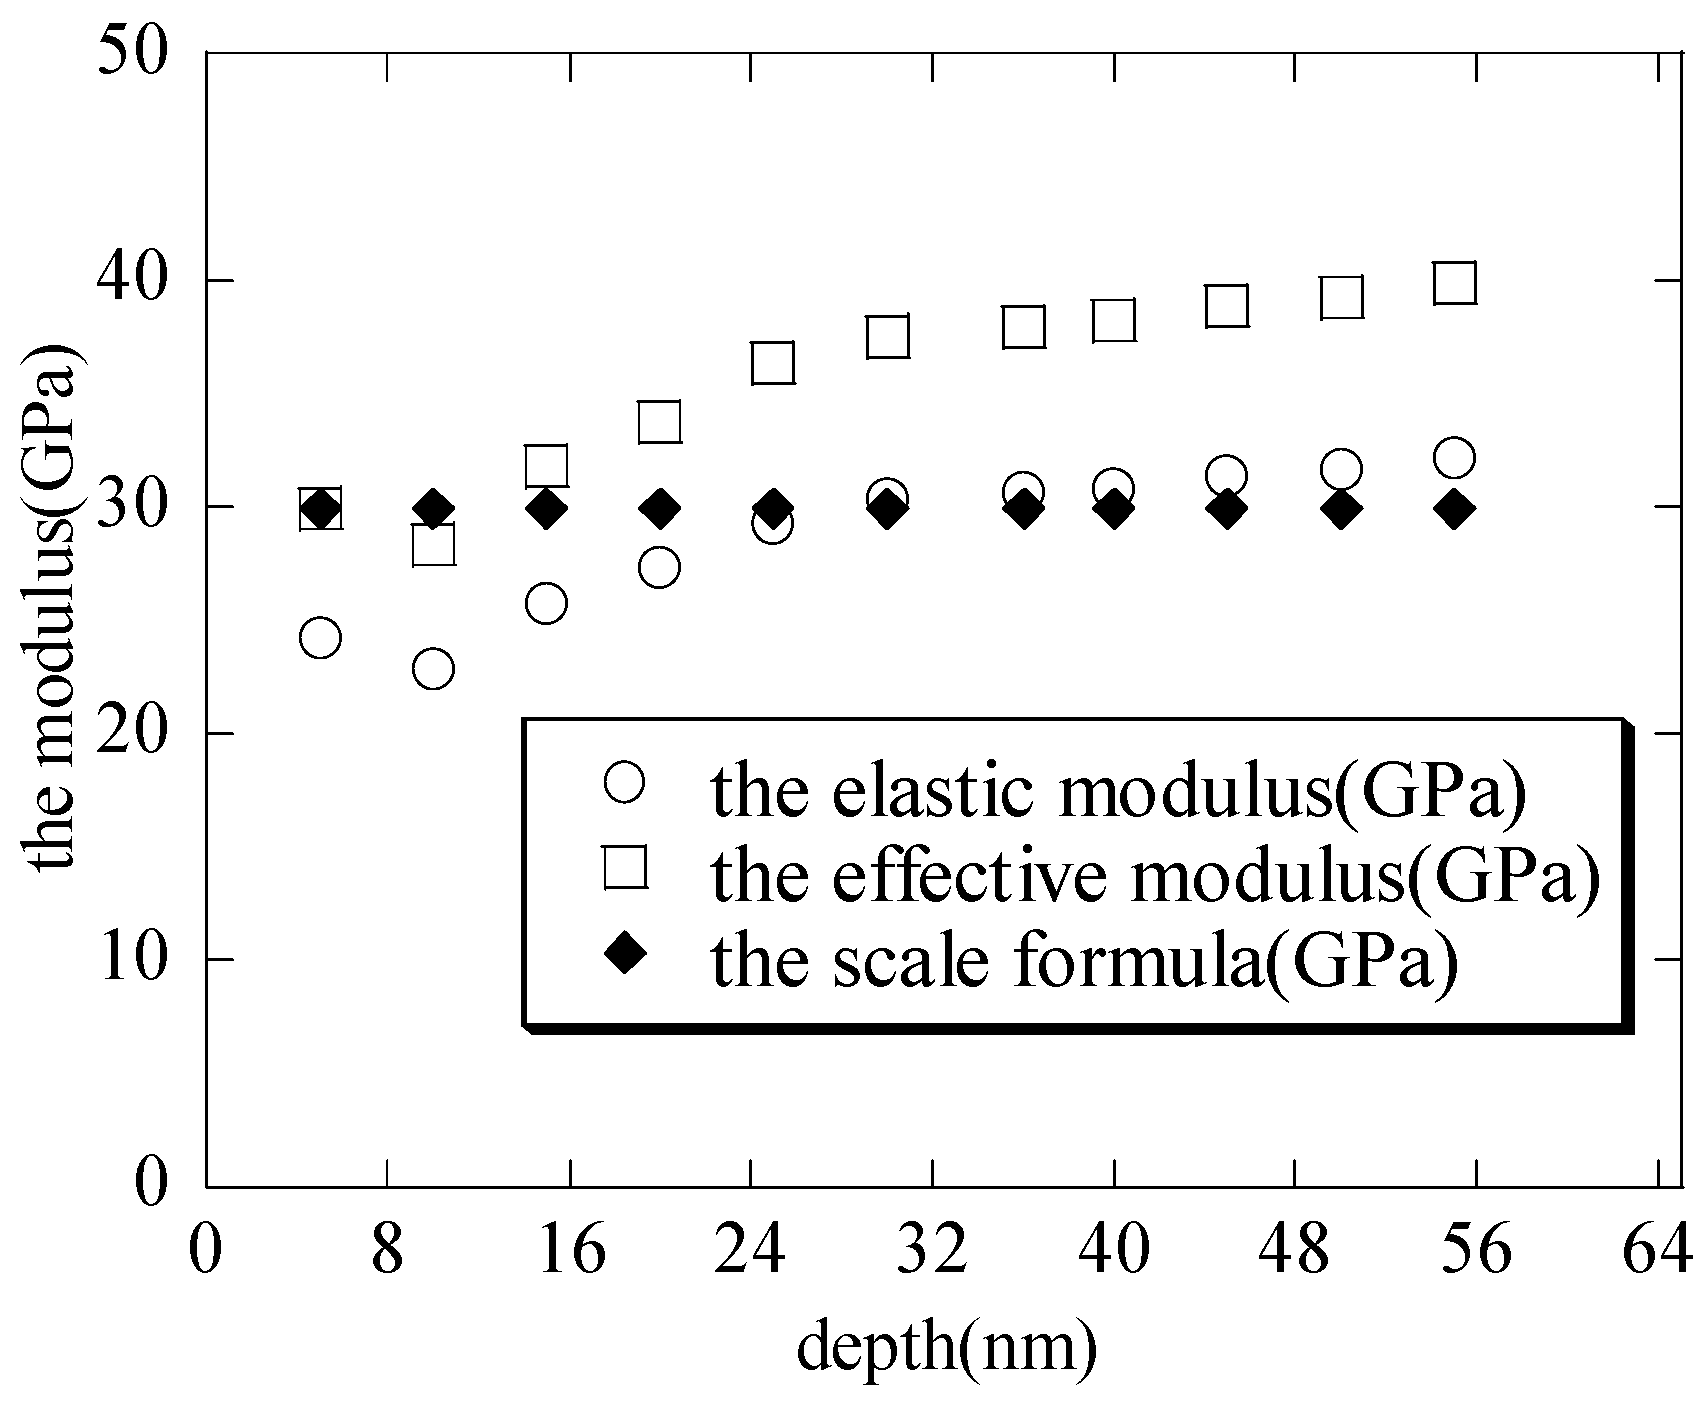
1]. With the increasing maximum depth, the macroscopic elastic moduli (shown in
Figure 4) of the hierarchical nanoporous film are closer to the results of the scale formula (
) [
27,
28,
29,
30]. It can also be seen that if the nanoindentation depth of the hierarchical nanoporous materials is too shallow, it cannot reflect the macroscopic mechanical properties of the hierarchical nanoporous materials, and if it is too deep, the results of the hierarchical nanoporous materials will be affected by the substrate. Thus, it is necessary to choose the appropriate nanoindentation depth to more accurately reflect the mechanical properties of the hierarchical nanoporous material. From the results in
Figure 4, the hierarchical nanoporous film is nanoindented to a depth of 30 nm in the latter analysis.
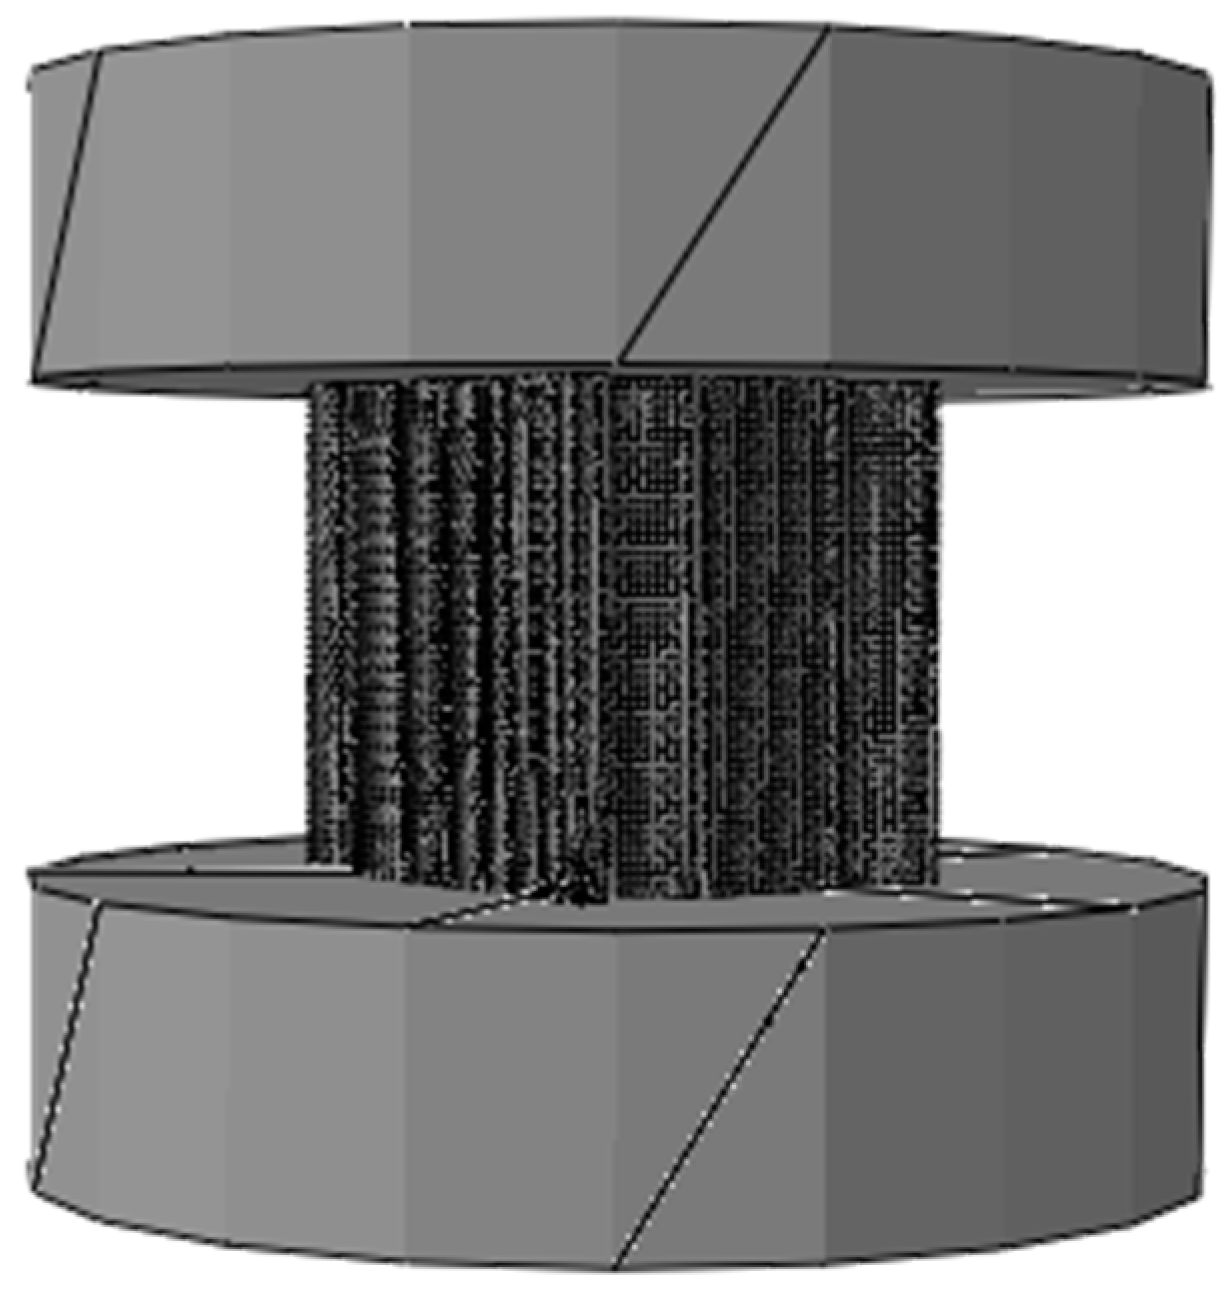
3.2. Uniaxial Compression Simulation Tests on the Hierarchical Honeycomb Nanoporous Materials
The uniaxial compression tests on the hierarchical honeycomb nanoporous materials (one big hole R = 49.541 nm, twelve small holes r = 8.777 nm shown in
Figure 1) with the relative density 54.4% are simulated by Abaqus 6.14 (shown in
Figure 5). The solid materials (the elastic modulus E = 55 GPa, Poisson’s ratio
and the different yielding stresses
from 110 MPa to 620 MPa) of the hierarchical honeycomb specimens are the elastic–perfectly plastic material. In order to ensure the compression on the enough holes and to obtain more accurate macroscopic mechanical properties of the hierarchical nanoporous materials, the size of the specimens is set at
. The hierarchical honeycomb nanoporous specimens are compressed down to 25 nm.
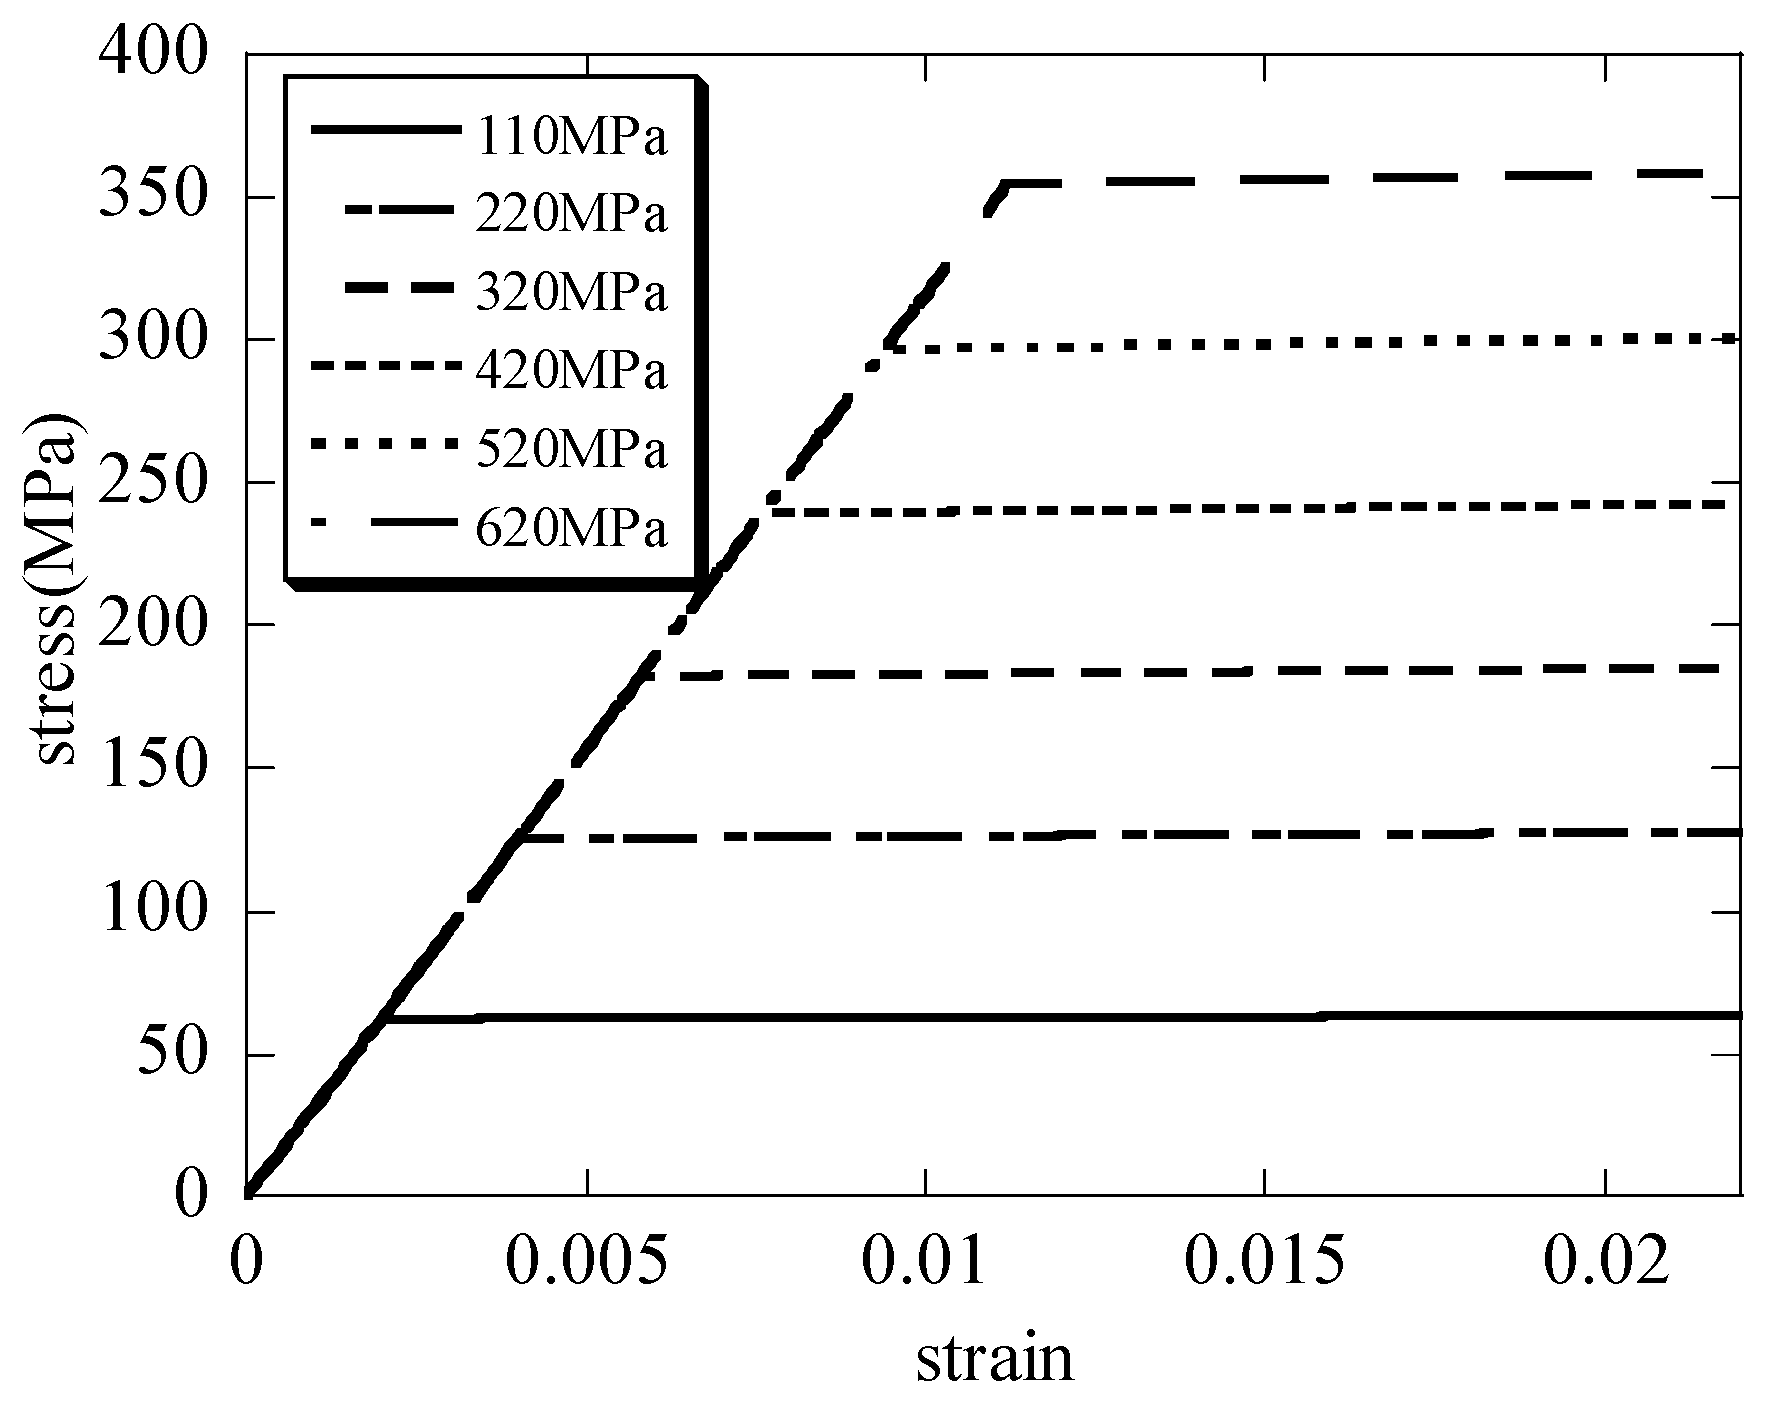
The macroscopic stress and the macroscopic strain curves of the hierarchical honeycomb nanoporous materials are seen in
Figure 6. It can be seen that when the solid materials of the hierarchical nanoporous materials are assumed to be elastic–perfectly plastic, the results in
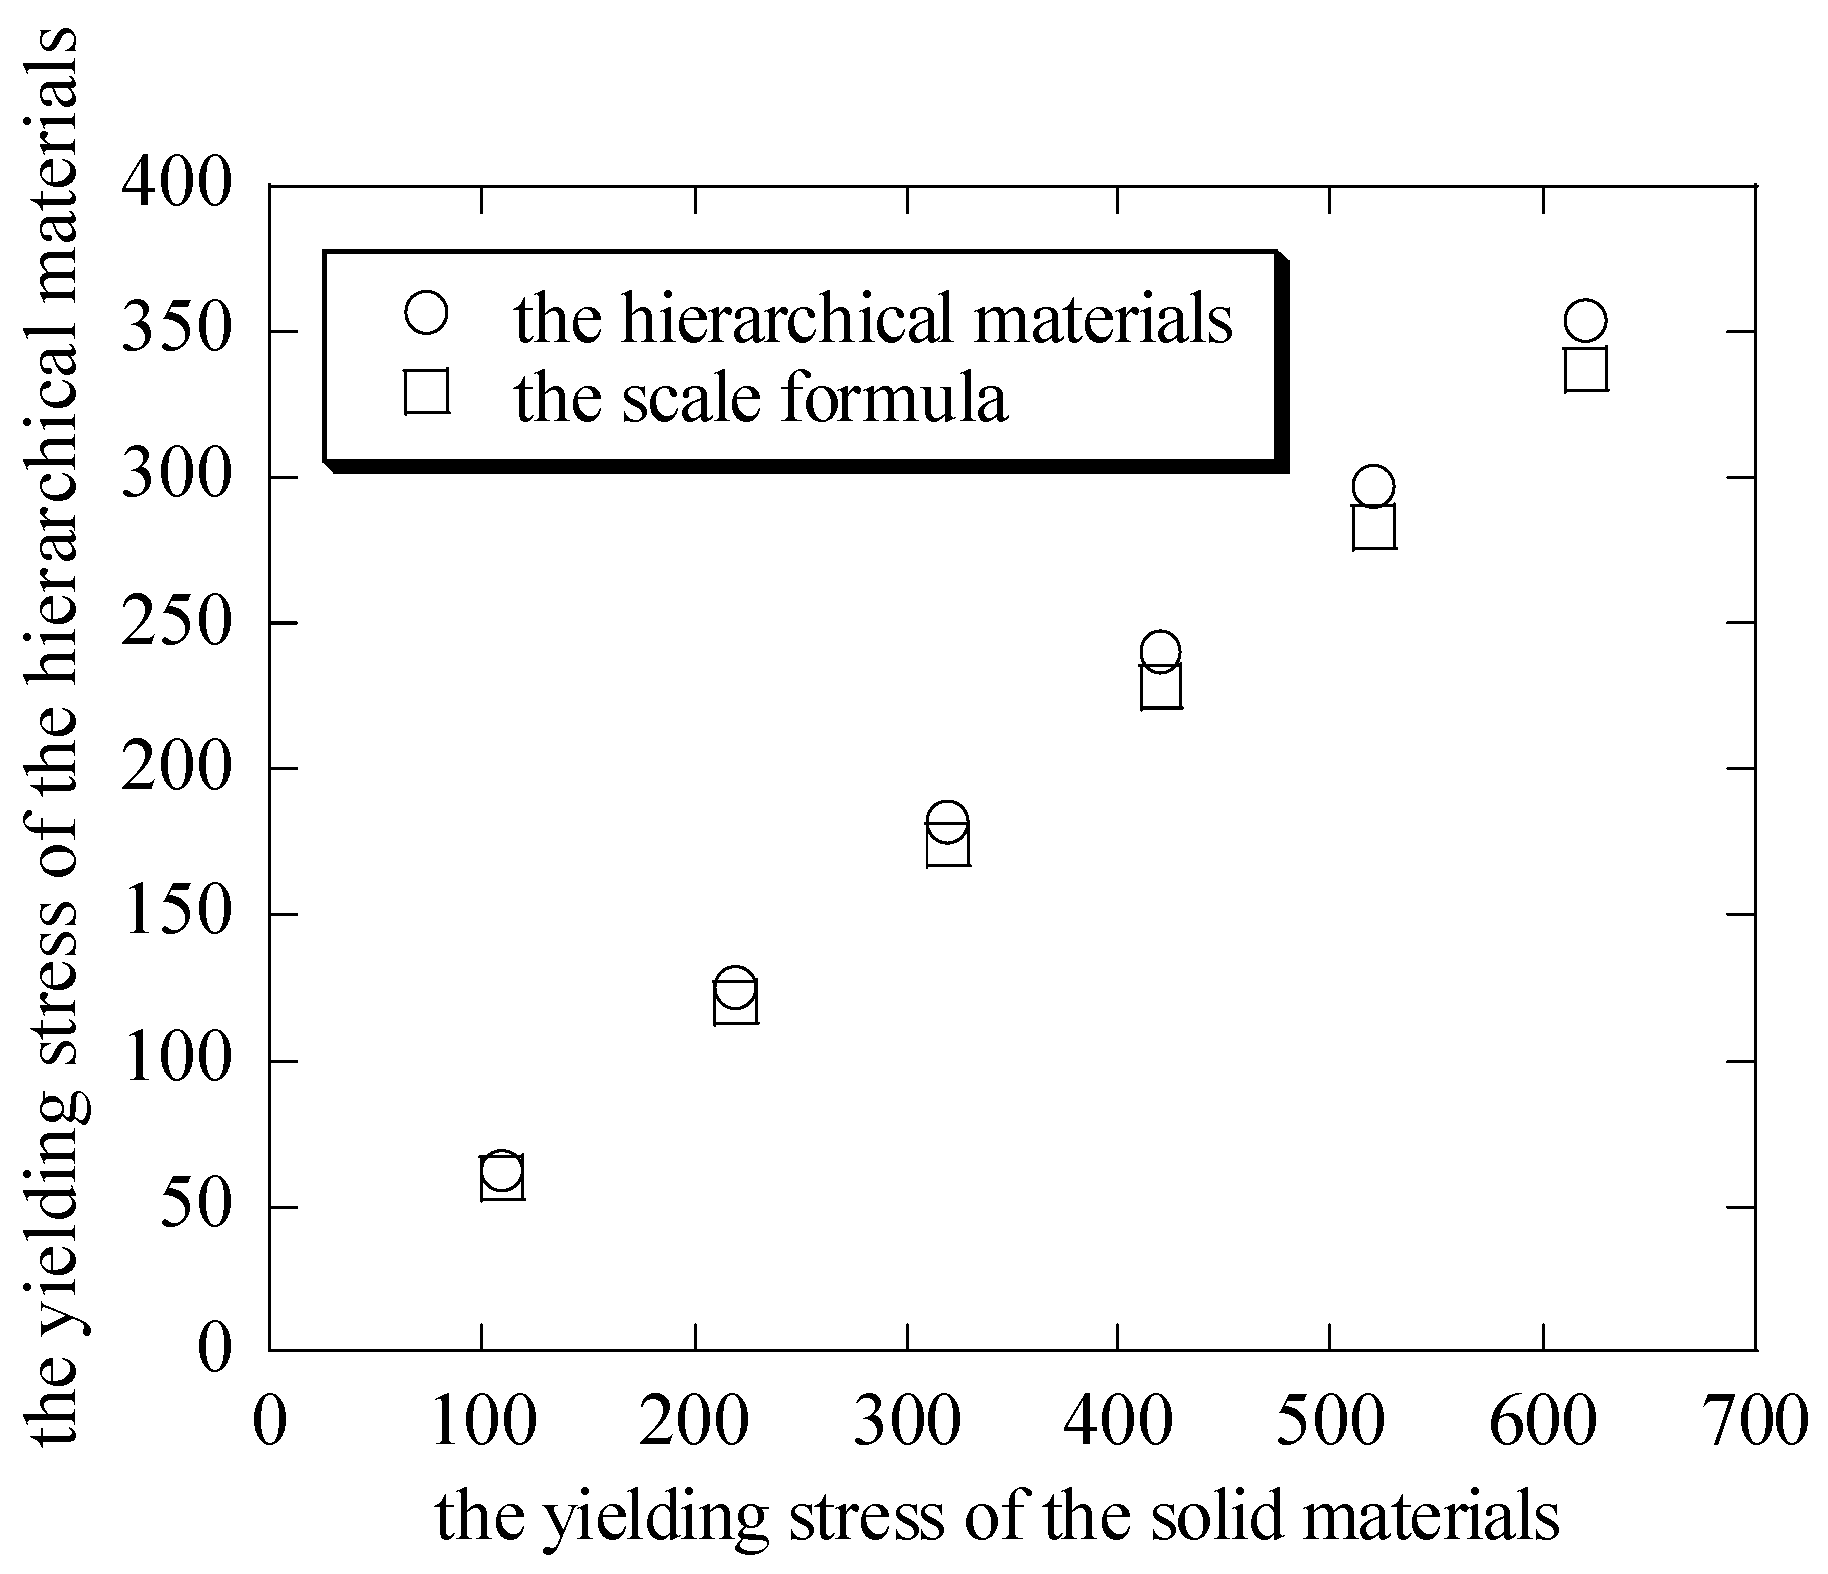
Figure 6 have showed the elastic–perfectly plastic behavior when the hierarchical nanoporous materials are uniaxially compressed. From the curves, the differences of the yielding stresses
between the hierarchical materials and the scale formula (
[
27,
28,
29,
30]) are shown in
Figure 7. It can be seen that the macroscopic yielding stresses
in the uniaxial compression tests on the hierarchical honeycomb nanoporous materials are close to the results of the scale formula.
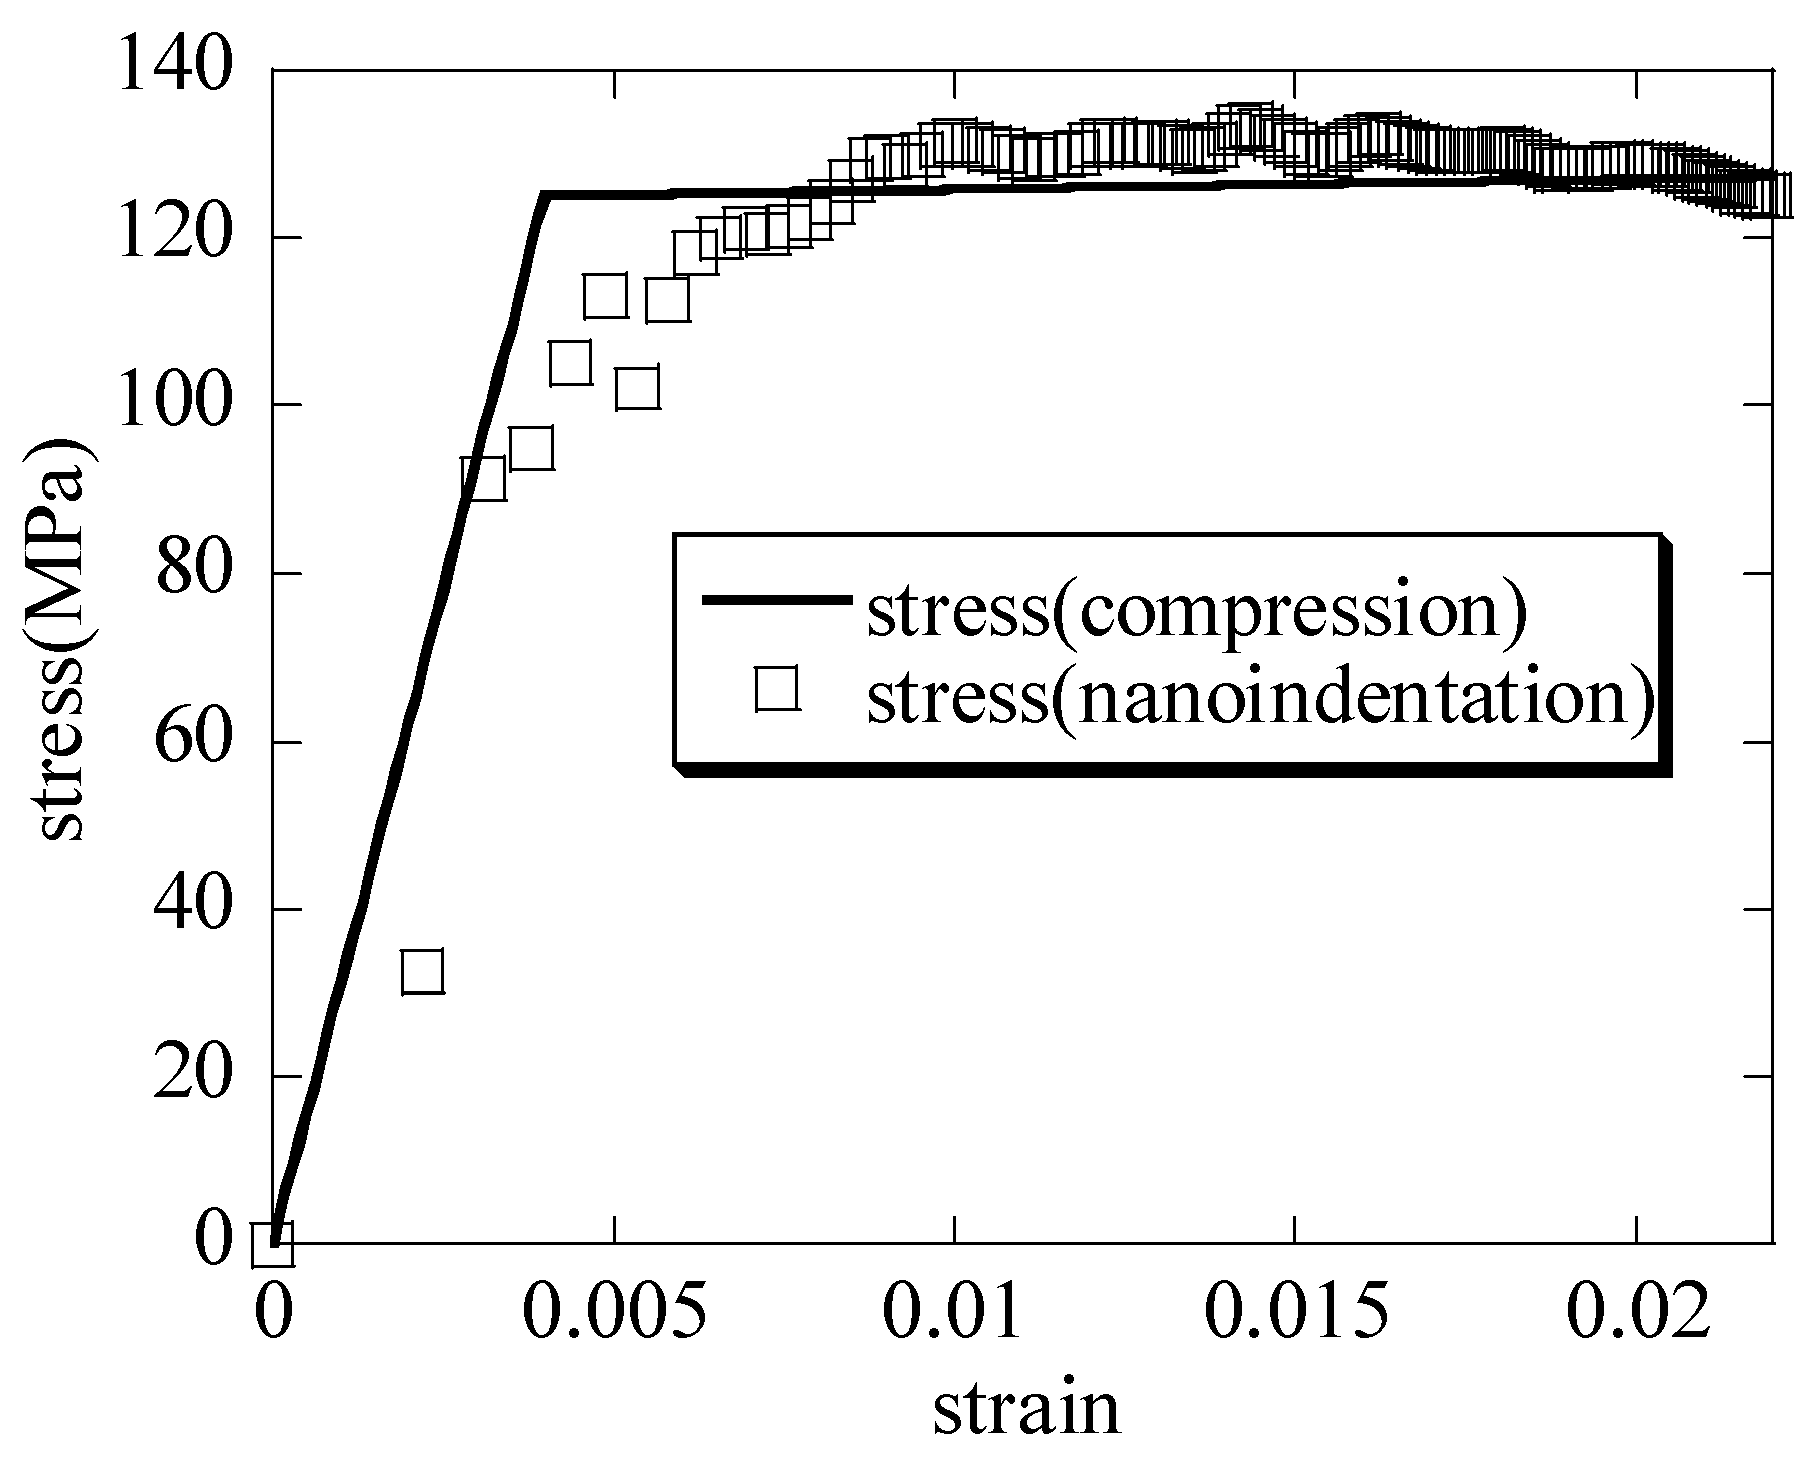
3.3. The Determination of the Macroscopic Stress–Macroscopic Strain Relationship on the Hierarchical Honeycomb Nanoporous Materials
The hierarchical honeycomb nanoporous material is nanoindented to a depth of 30 nm and is compressed down to 25 nm; the macroscopic stress–macroscopic strain curves of the nanoindentation and the compression are shown in
Figure 8. When the nanoindentation-representative stresses of the hierarchical nanoporous material in the nanoindentation are defined, the limiting factor
shown in Equation (7) is the segmented-function representation given as follows:
From the curves, the macroscopic elastic modulus
and the macroscopic yielding stress
of the hierarchical nanoporous material by the nanoindentation and the uniaxial compression are obtained, and the results are compared with the scale formula in
Table 1. It can be seen that the results are close to one another.
4. Conclusions
In this paper, the spherical nanoindentation macroscopic stress–macroscopic strain curve of the hierarchical honeycomb nanoporous material is obtained by combining the spherical nanoindentation and the uniaxial compression. At the same time, the macroscopic elastic modulus and the macroscopic yielding stress of the hierarchical material are obtained from the curves by these methods. The conclusions are derived as follows:
(1) When the nanoindenter radius is far greater than the depth, the elastoplastic contact radius
is approximately calculated by the total depth
. This is also consistent with the literature [
1]. With the increasing maximum depth, the macro elastic moduli of the hierarchical nanoporous film are close to the results of the scale formula (
).
(2) When the hierarchical materials are uniaxially compressed down to 25 nm, the macroscopic stress and the macroscopic strain curves of the hierarchical honeycomb nanoporous materials which have different yielding stresses from 110 MPa to 620 MPa are obtained. The results show that the macroscopic yielding stresses of the hierarchical honeycomb nanoporous materials are close to the results of the scale formula (). At the same time, it can be seen that when the solid materials of the hierarchical nanoporous materials are assumed to be elastic–perfectly plastic, the hierarchical nanoporous materials that are uniaxially compressed show the elastic–perfectly plastic behavior.
(3) Taking into account the extremely uneven distribution of the stress and the strain in the nanoindentation zone when the nanoindentation representative stress and the nanoindentation representative strain of the hierarchical nanoporous material are defined, the limiting factor is represented as the segmented function ( ). At the same time, the macroscopic stress –macroscopic strain curve of the hierarchical nanoporous materials nanoindented to a depth of 30 nm is basically consistent with the curve of the hierarchical nanoporous materials that is uniaxially compressed down to 25 nm. Moreover, the macro elastic modulus and the macro yielding stress of the hierarchical nanoporous material from the two constitutive curves are close to the results of the scale formula ().
Author Contributions
Conceptualization, F.H.; Methodology, F.H.; Software, F.H.; Validation, F.H.; Formal analysis, F.H.; Investigation, F.H.; Resources, F.H.; Data curation, F.H.; Writing—original draft, F.H.; Writing—review & editing, F.H., H.Z. and J.Z.; Visualization, F.H.; Supervision, F.H.; Project administration, F.H.; Funding acquisition, F.H. and H.Z. All authors have read and agreed to the published version of the manuscript.
Funding
The authors are grateful for the financial support of this work by the Natural Science Basic Research Program of Shaanxi (Program No. 2022JQ-057) and the Horizontal Topic Research Program in Xi’an, China (2022-KJ535).
Data Availability Statement
Data are contained within the article.
Conflicts of Interest
The authors declare no conflict of interest.
References
- Ruiz-Moreno, A.; Hähner, P.; Fumagalli, F.; Haiblikova, V.; Conte, M.; Randall, N. Stress−strain curves and derived mechanical parameters of P91 steel from spherical nanoindentation at a range of temperatures. Mater. Des. 2020, 194, 108950. [Google Scholar]
- Pathak, S.; Kalidindi, S.R.; Klemenz, C.; Orlovskaya, N. Analyzing indentation stress-strain response of LaGaO3 single crystals using spherical indenters. J. Eur. Ceram. Soc. 2008, 28, 2213–2220. [Google Scholar]
- Kalidindi, S.R.; Pathak, S. Determination of the effective zero-point and the extraction of spherical nanoindentation stress-strain curves. Acta Mater. 2008, 56, 3523–3532. [Google Scholar]
- Pathak, S.; Kalidindi, S.R. Spherical nanoindentation stress-strain curves. Mater. Sci. Eng. R Rep. 2015, 91, 1–36. [Google Scholar]
- Pathak, S.; Stojakovic, D.; Kalidindi, S.R. Measurement of the local mechanical properties in polycrystalline samples using spherical nanoindentation and orientation imaging microscopy. Acta Mater. 2009, 57, 3020–3028. [Google Scholar] [CrossRef]
- Weaver, J.S.; Khosravani, A.; Castillo, A.; Kalidindi, S.R. High throughput exploration of process-property linkages in Al-6061 using instrumented spherical microindentation and microstructurally graded samples. Integr. Mater. Manuf. Innov. 2016, 5, 192–211. [Google Scholar] [CrossRef]
- Weaver, J.S.; Kalidindi, S.R. Mechanical characterization of Ti-6Al-4V titanium alloy at multiple length scales using spherical indentation stress-strain measurements. Mater. Des. 2016, 111, 463–472. [Google Scholar] [CrossRef]
- Millan-Espitia, N.; Mohan, S.; Pilchak, A.L.; Kalidindi, S.R. Mechanical Responses of Primary-α Ti Grains in Polycrystalline Samples: Part I—Measurements of Spherical Indentation Stress–Strain Curves. Integr. Mater. Manuf. Innov. 2021, 10, 82–98. [Google Scholar] [CrossRef]
- Castillo, A.; Kalidindi, S.R. A bayesian framework for the estimation of the single crystal elastic parameters from spherical indentation stress-strain measurements. Front. Mater. 2019, 6, 136. [Google Scholar] [CrossRef]
- Rossi, A.; Castillo, A.; Przybyla, C.; Kalidindi, S.R. Study of Local Mechanical Responses in an Epoxy–Carbon Fiber Laminate Composite Using Spherical Indentation Stress–Strain Protocols. Integr. Mater. Manuf. Innov. 2019, 8, 495–508. [Google Scholar] [CrossRef]
- Kim, H.N.; Mandal, S.; Basu, B.; Kalidindi, S.R. Probing Local Mechanical Properties in Polymer-Ceramic Hybrid Acetabular Sockets Using Spherical Indentation Stress-Strain Protocols. Integr. Mater. Manuf. Innov. 2019, 8, 257–272. [Google Scholar]
- Khosravani, A.; Caliendo, C.M.; Kalidindi, S.R. New insights into the microstructural changes during the processing of dual-phase steels from multiresolution spherical indentation stress–strain protocols. Metals 2020, 10, 18. [Google Scholar] [CrossRef]
- Parvinian, S.; Yabansu, Y.C.; Khosravani, A.; Garmestani, H.; Kalidindi, S.R. High-Throughput Exploration of the Process Space in 18% Ni (350) Maraging Steels via Spherical Indentation Stress–Strain Protocols and Gaussian Process Models. Integr. Mater. Manuf. Innov. 2020, 9, 199–212. [Google Scholar]
- Iskakov, A.; Kalidindi, S.R. Multiresolution investigations of thermally aged steels using spherical indentation stress-strain protocols and image analysis. Mech. Mater. 2022, 167, 104265. [Google Scholar]
- Mohan, S.; Millan-Espitia, N.; Yao, M.; Steenberge, N.V.; Kalidindi, S.R. Critical Evaluation of Spherical Indentation Stress-Strain Protocols for the Estimation of the Yield Strengths of Steels. Exp. Mech. 2021, 61, 641–652. [Google Scholar]
- Abba, M.T.; Kalidindi, S.R. Protocols for studying the time-dependent mechanical response of viscoelastic materials using spherical indentation stress-strain curves. Mech. Time-Depend. Mater. 2022, 26, 1–20. [Google Scholar]
- Hertz, H.; Jones, D.; Schott, G. Miscellaneous Papers; Macmillan: New York, NY, USA, 1896. [Google Scholar]
- Patel, D.K.; Kalidindi, S.R. Correlation of spherical nanoindentation stress-strain curves to simple compression stress-strain curves for elastic-plastic isotropic materials using finite element models. Acta Mater. 2016, 112, 295–302. [Google Scholar]
- Tabor, D. The Hardness of Metals; Clarendon Press: New York, NY, USA, 1951. [Google Scholar]
- Wang, K.; Chen, J.; Wang, F.; Liang, X.; Sun, Z. Progress in Stress-Strain Relationship Using Spherical Nanoindentation. Mater. Rep. 2019, 33, 1490–1499. [Google Scholar]
- Kim, S.; Polycarpou, A.A.; Liang, H. Morphology and electric potential-induced mechanical behavior of metallic porous nanostructures. Friction 2020, 8, 604–612. [Google Scholar]
- Olive, W.C.; Pharr, G.M. An improved technique for determining hardness and elastic modulus using load and displacement sensing indentation experiments. J. Mater. Res. 1992, 7, 1564–1583. [Google Scholar] [CrossRef]
- Field, J.S.; Swain, M.V.A. Simple predictive model for spherical indentation. J. Mater. Res. 1993, 8, 297–306. [Google Scholar]
- Liu, J.; Lang, F.; Wang, S. Study on mechanical properties of 2024-T4 aluminum alloy based on nanoindentation technique. Light Met. 2023, 8, 47–52. [Google Scholar]
- Leitner, A.; Maier-Kiener, V.; Kiener, D. Essential refinements of spherical nanoindentation protocols for the reliable determination of mechanical flow curves. Mater. Des. 2018, 146, 69–80. [Google Scholar] [CrossRef]
- Pharr, G.M. Measurement of mechanical properties by ultra-low load indentation. Mater. Sci. Eng. A 1998, 253, 151–159. [Google Scholar]
- Gibson, L.; Ashby, M. Cellular Solids: Structure and Properties; Cambridge University Press: Cambridge, UK, 1999. [Google Scholar]
- Huang, Z. Micromechanics of Composite Material; Science and Technology Press: Beijing, China, 2004. [Google Scholar]
- Hashin, Z. Analysis of composite materials—A survey. J. Appl. Mech. 1983, 50, 481–505. [Google Scholar]
- Han, F.; Chen, C.; Shen, Y. The mechanical properties of a transverse isotropic voided material. Compos. Struct. 2011, 93, 2213–2221. [Google Scholar]
| Disclaimer/Publisher’s Note: The statements, opinions and data contained in all publications are solely those of the individual author(s) and contributor(s) and not of MDPI and/or the editor(s). MDPI and/or the editor(s) disclaim responsibility for any injury to people or property resulting from any ideas, methods, instructions or products referred to in the content. |
© 2025 by the authors. Licensee MDPI, Basel, Switzerland. This article is an open access article distributed under the terms and conditions of the Creative Commons Attribution (CC BY) license (https://creativecommons.org/licenses/by/4.0/).


