
Synthesis, Characterization, Magnetic Properties, and Applications of Carbon Dots as Diamagnetic Chemical Exchange Saturation Transfer Magnetic Resonance Imaging Contrast Agents: A Review

 ,
,  , , , , ,
Abstract

1. Introduction
2. Synthesis of CDs
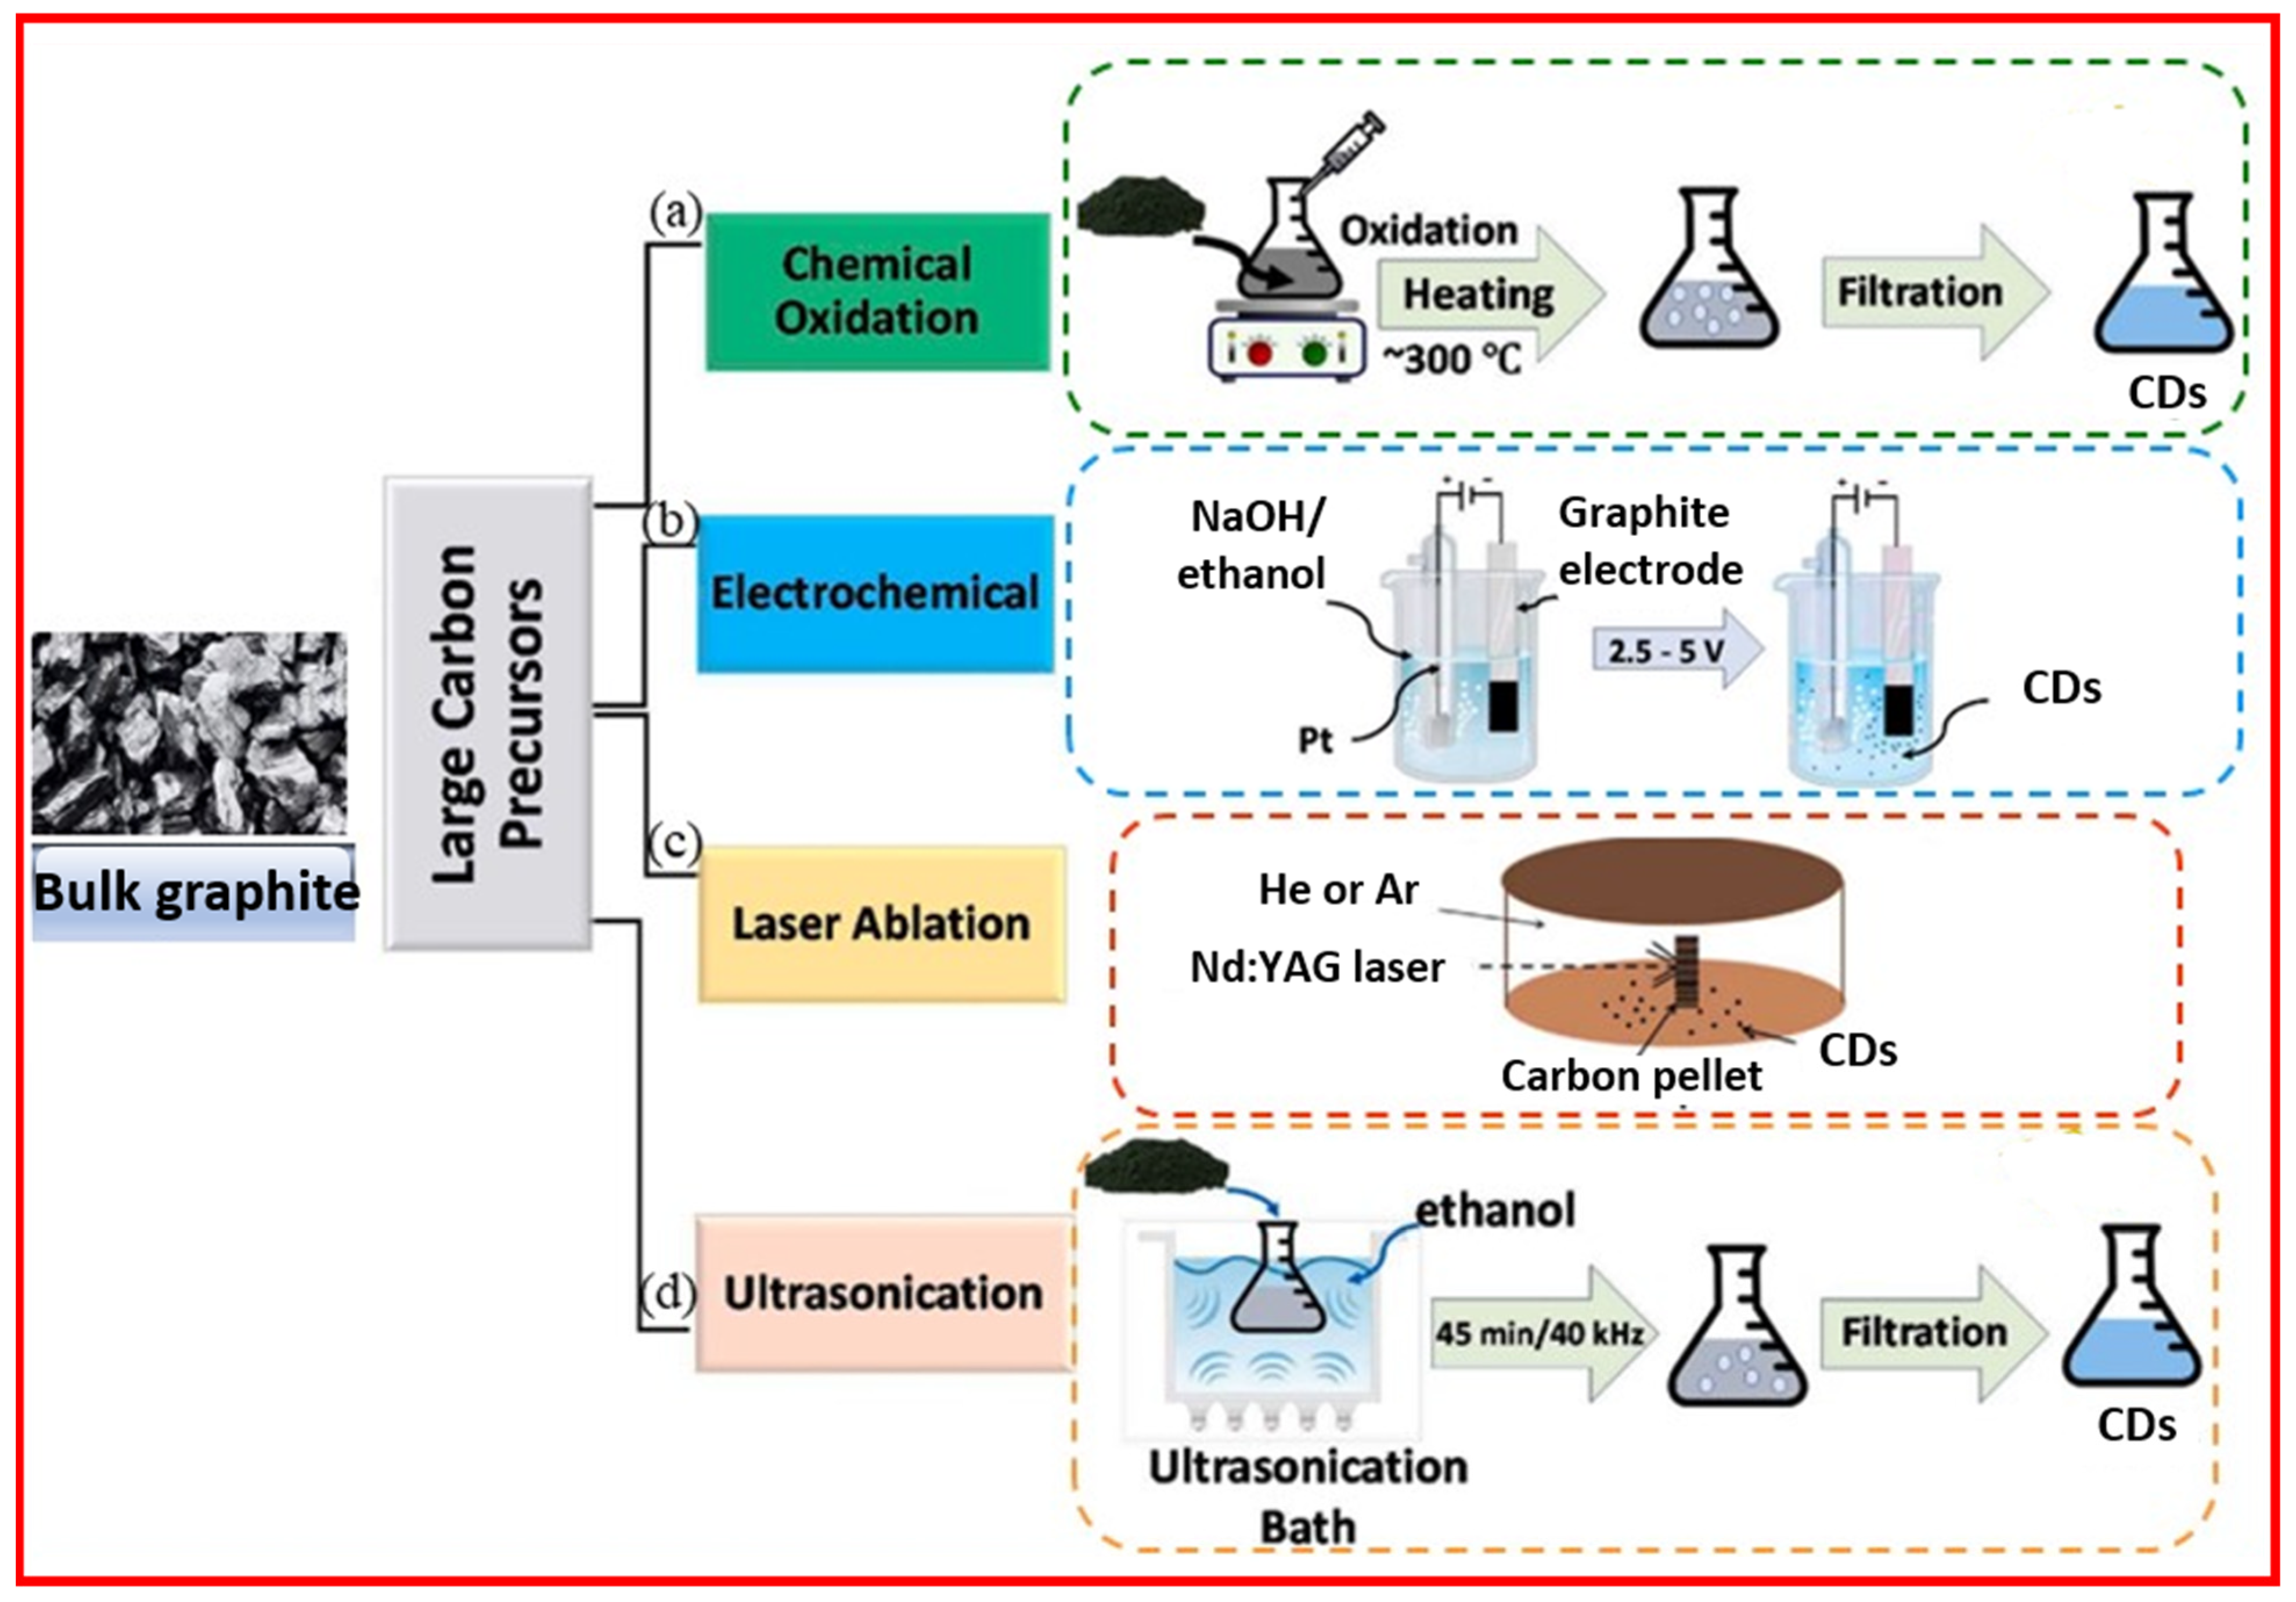
2.1. Top-Down Approach
2.1.1. Chemical Oxidation
2.1.2. Electrochemical Oxidation
2.1.3. Laser Ablation
2.1.4. Ultrasonic-Assisted Method
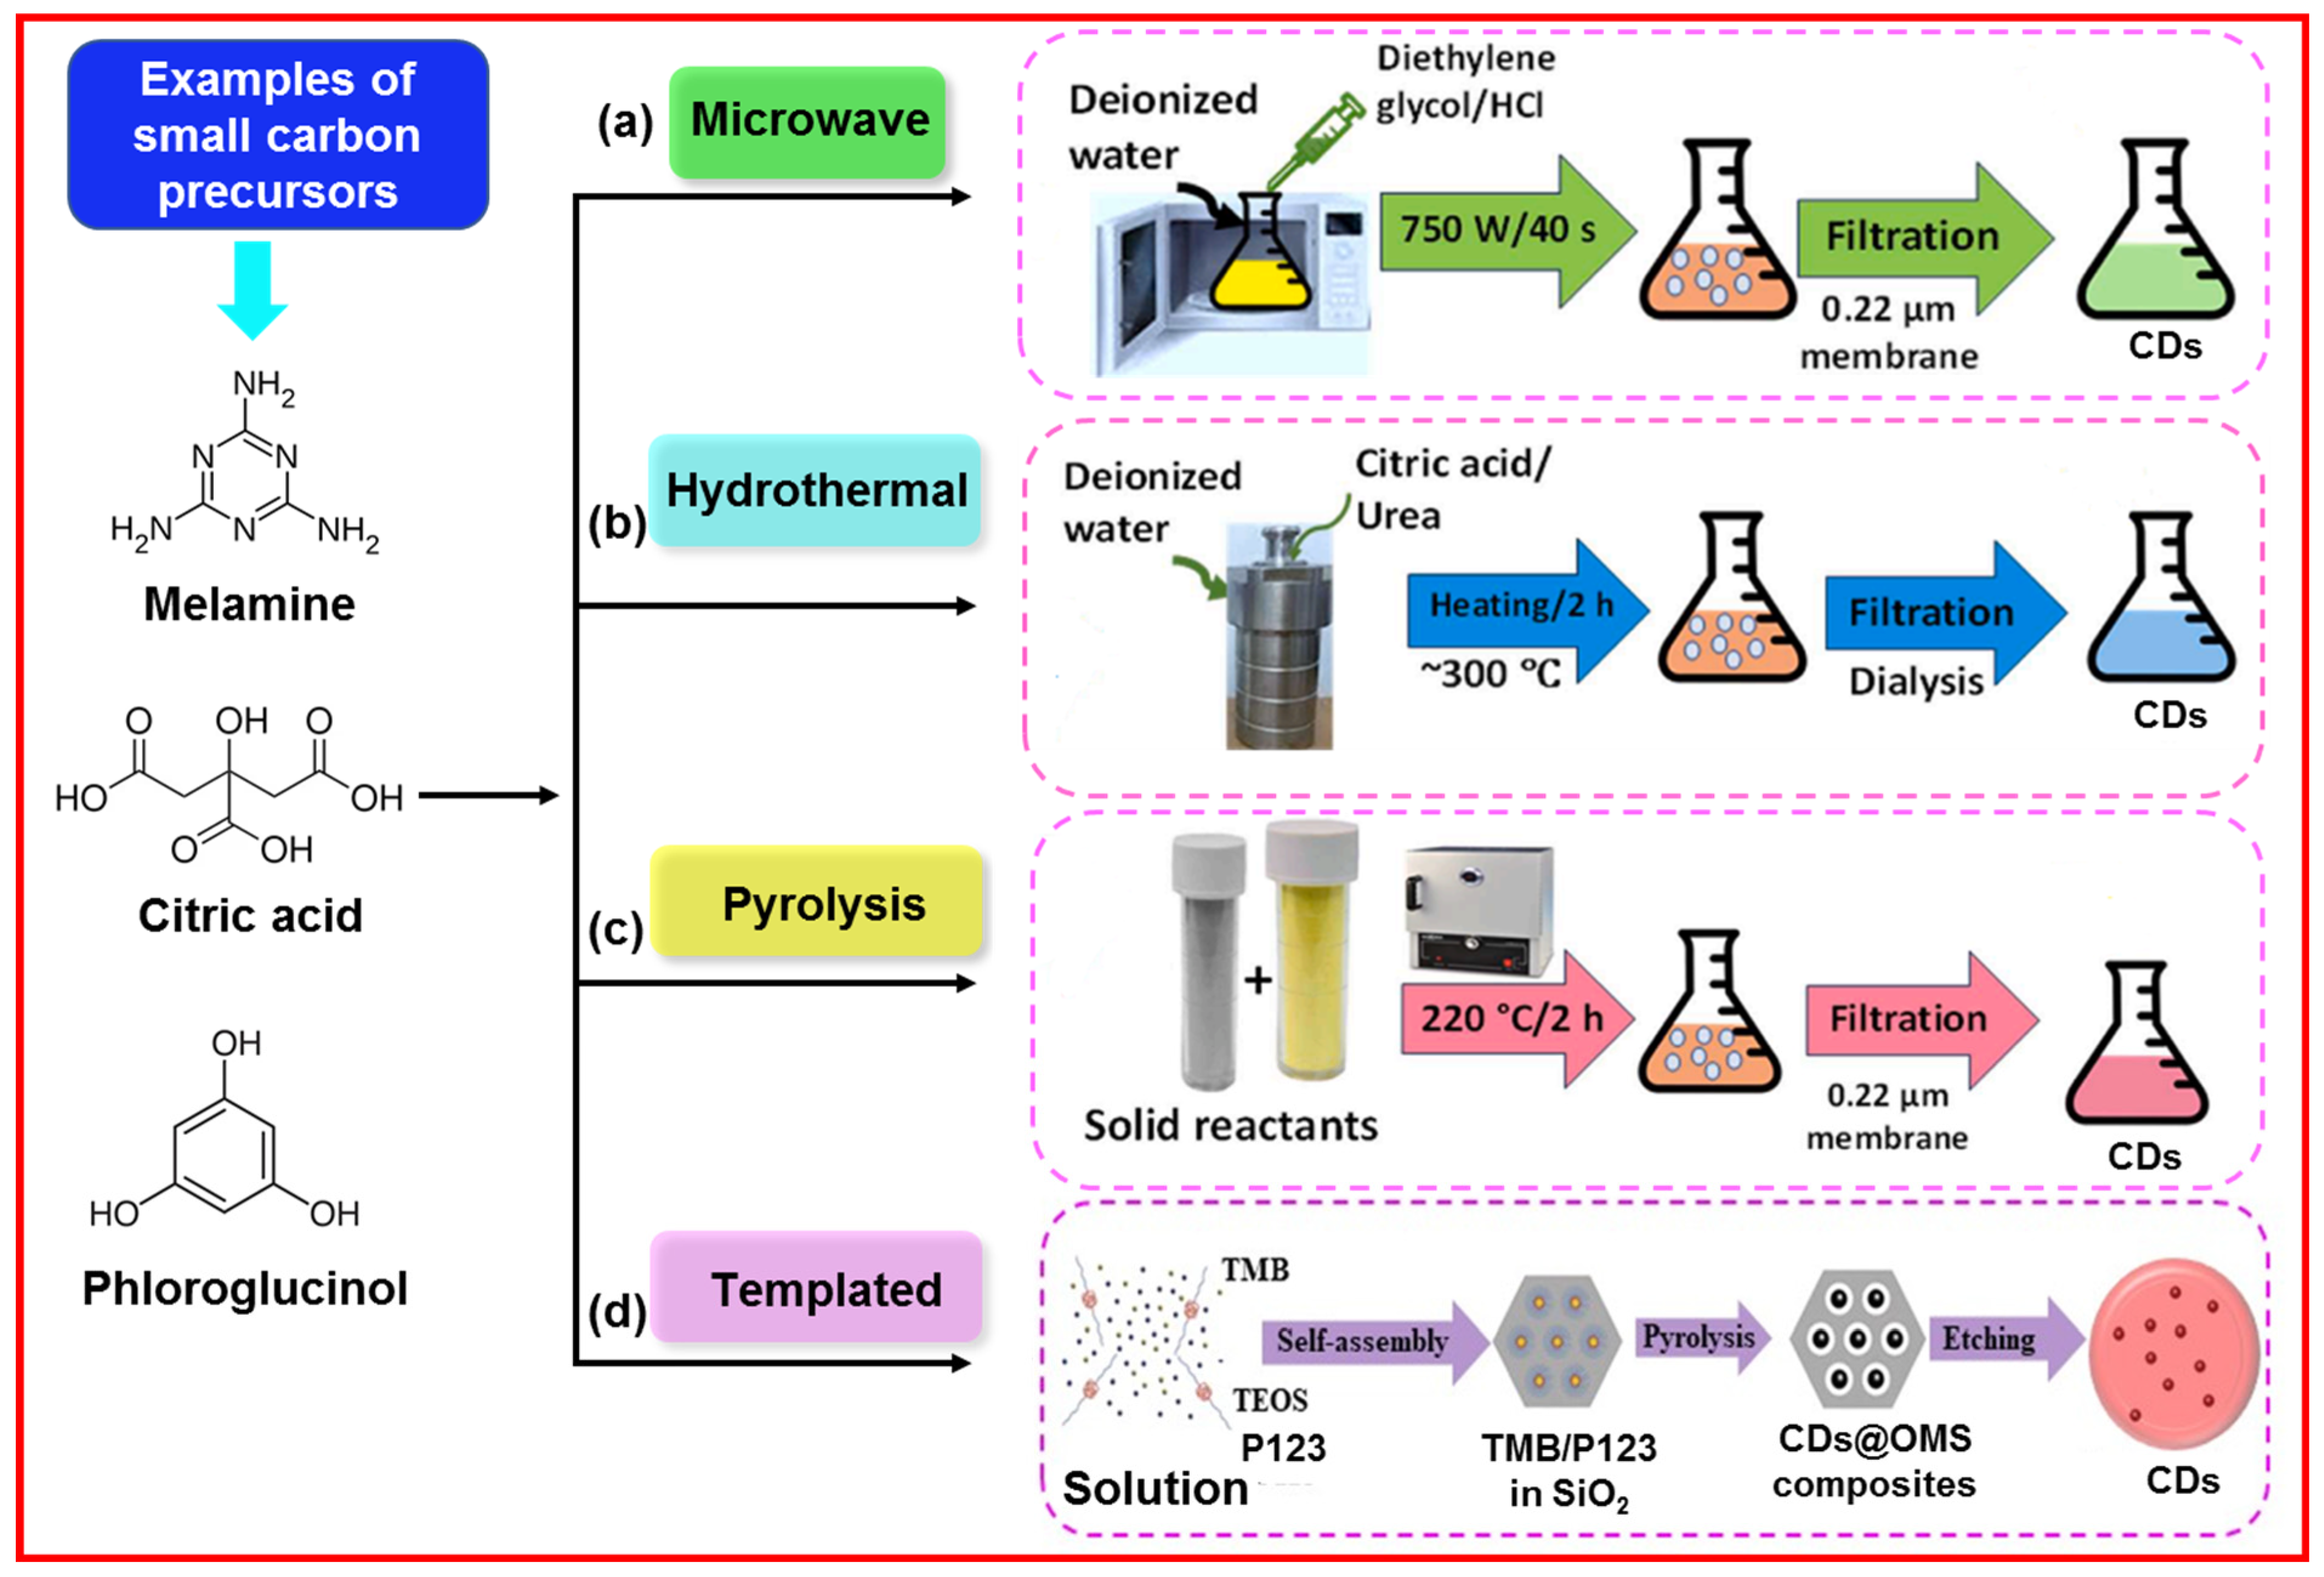
2.2. Bottom-Up Approach
2.2.1. Microwave-Assisted Method
2.2.2. Hydrothermal Method
2.2.3. Pyrolysis Method
2.2.4. Templated Method
3. Characterizations
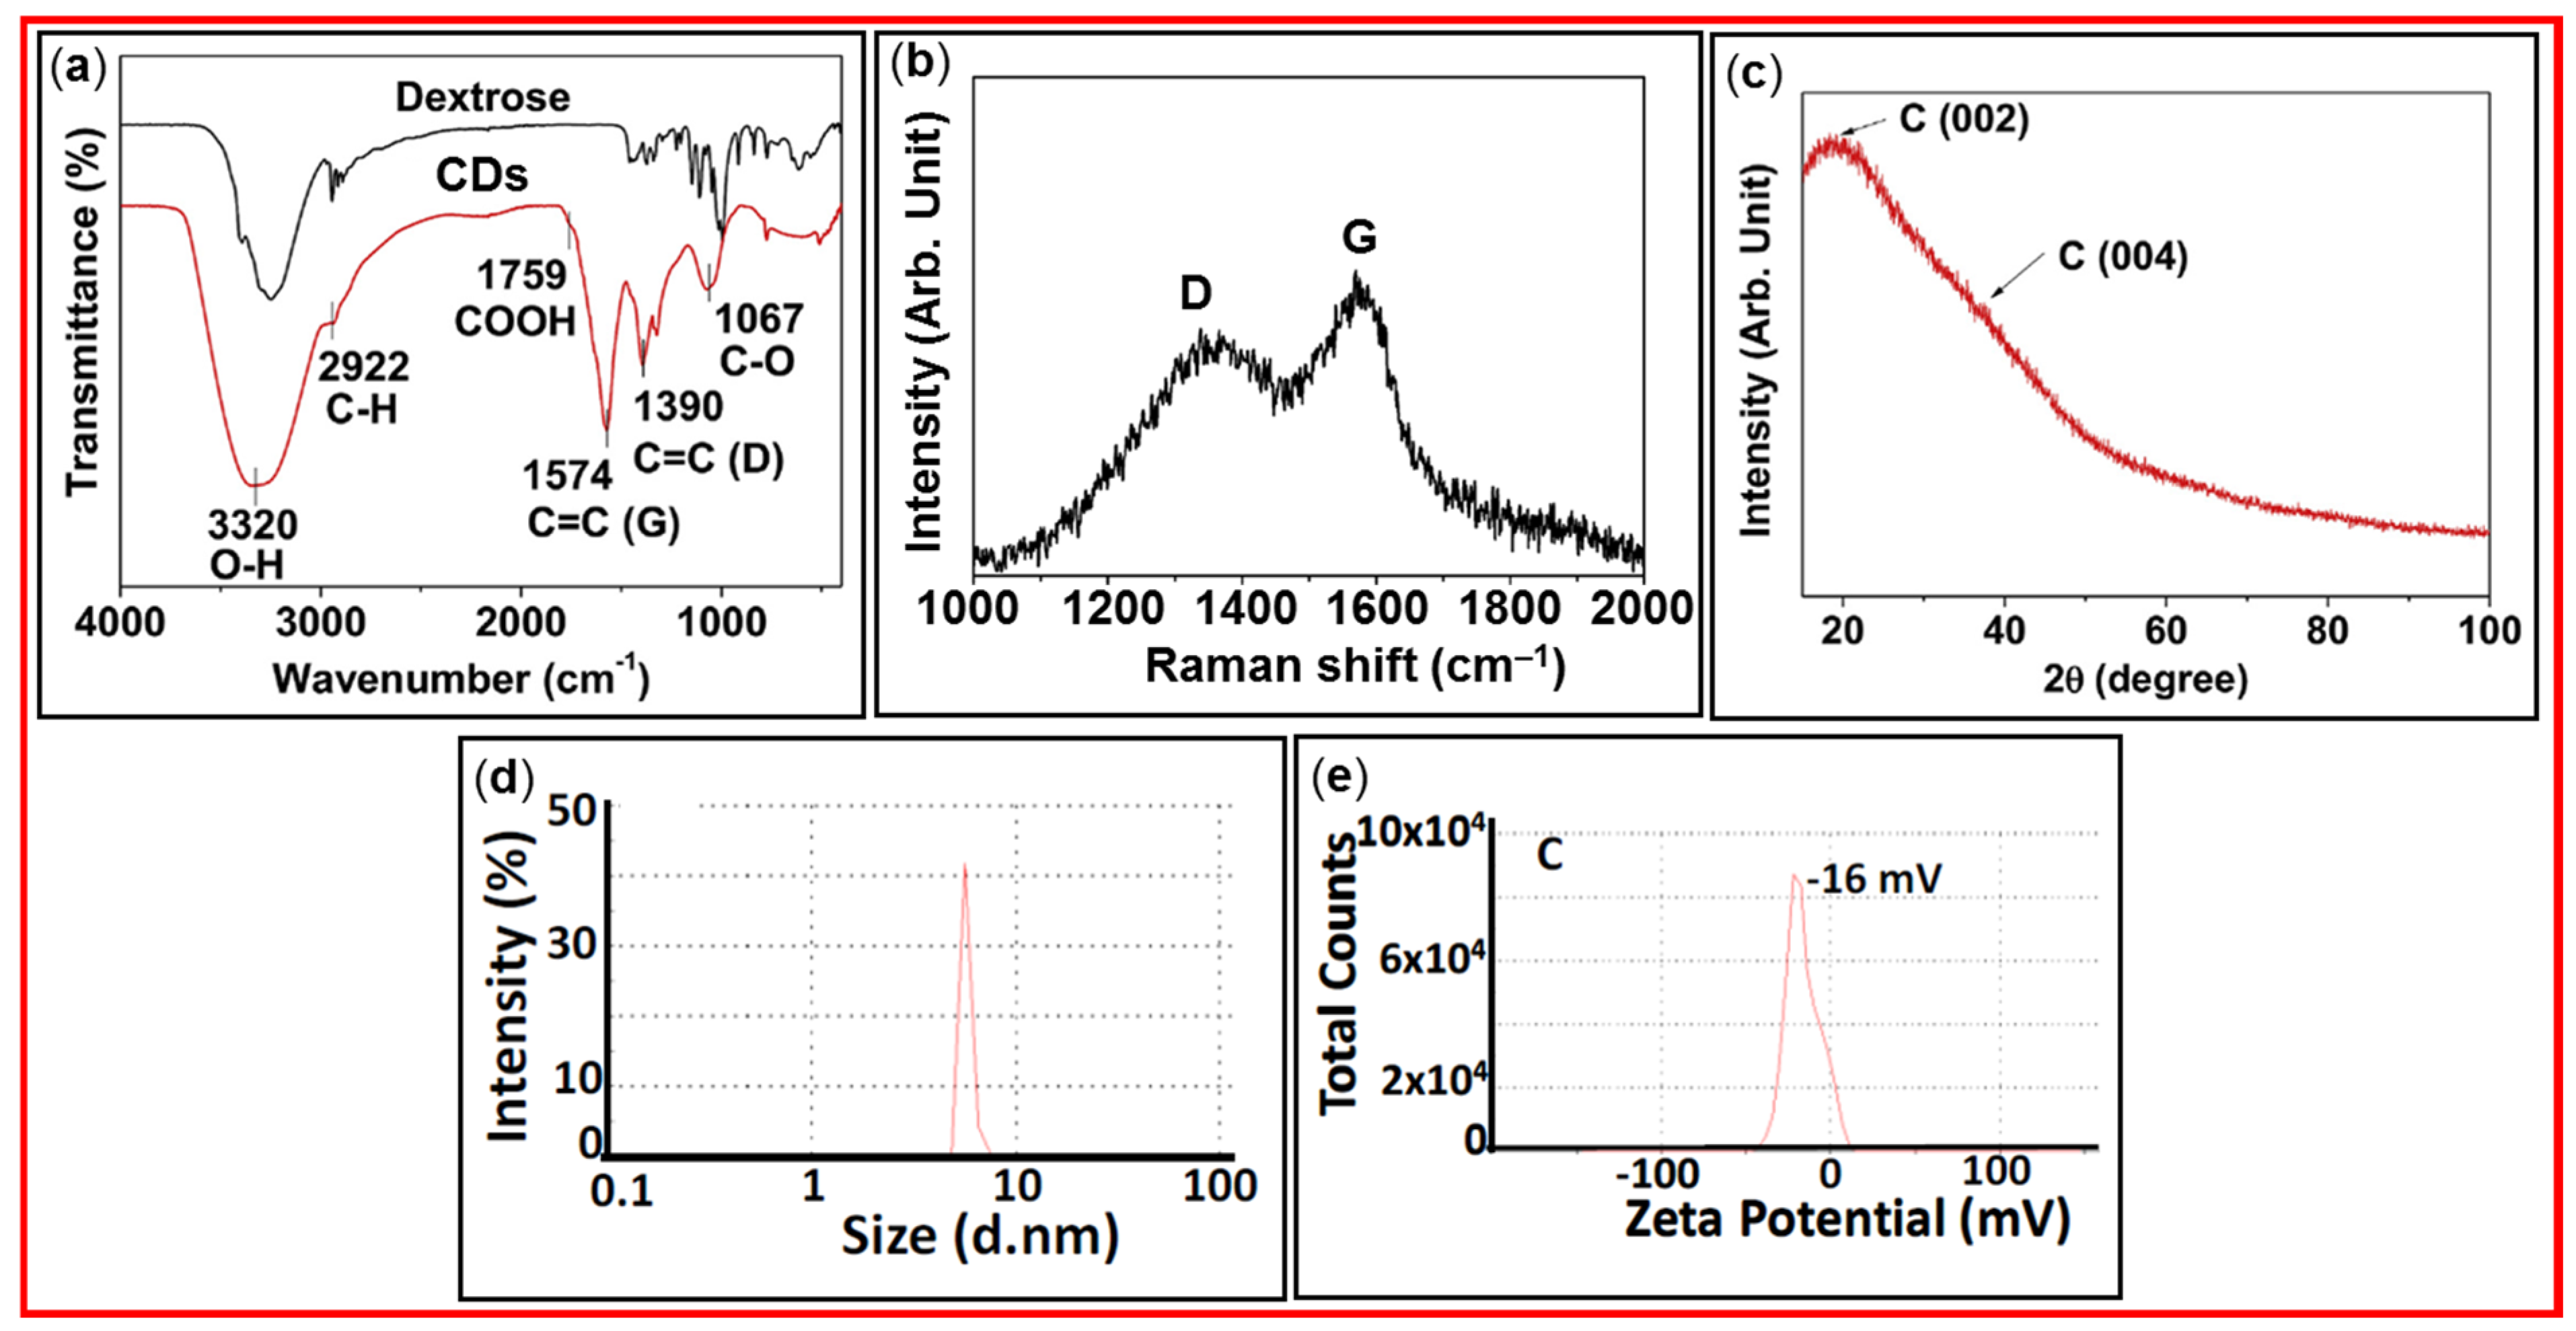
3.1. FT-IR Absorption, Raman, XRD, DLS, and Zeta Potential Analyses
3.2. Magnetic Properties
3.2.1. VSM
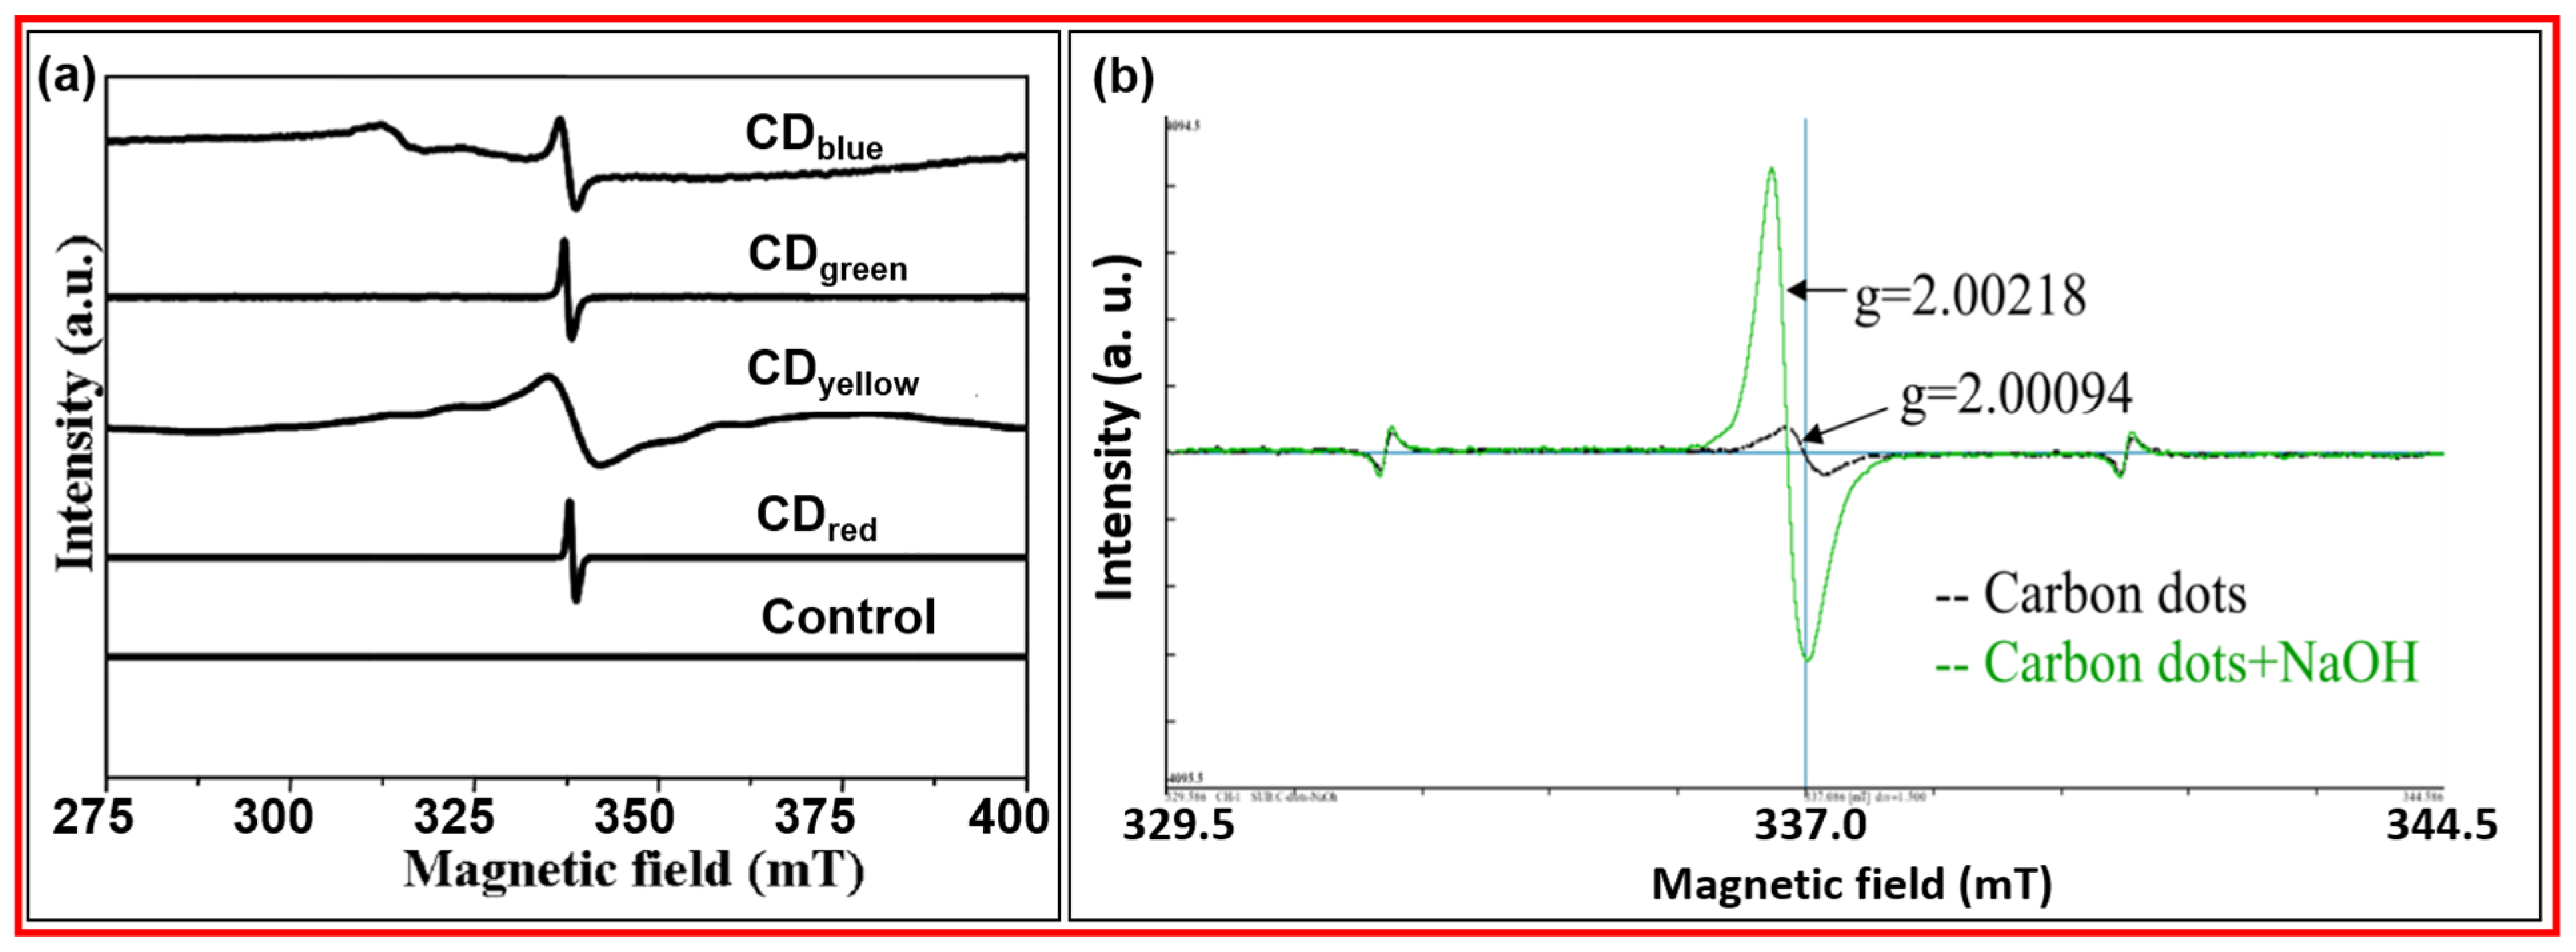
3.2.2. EPR
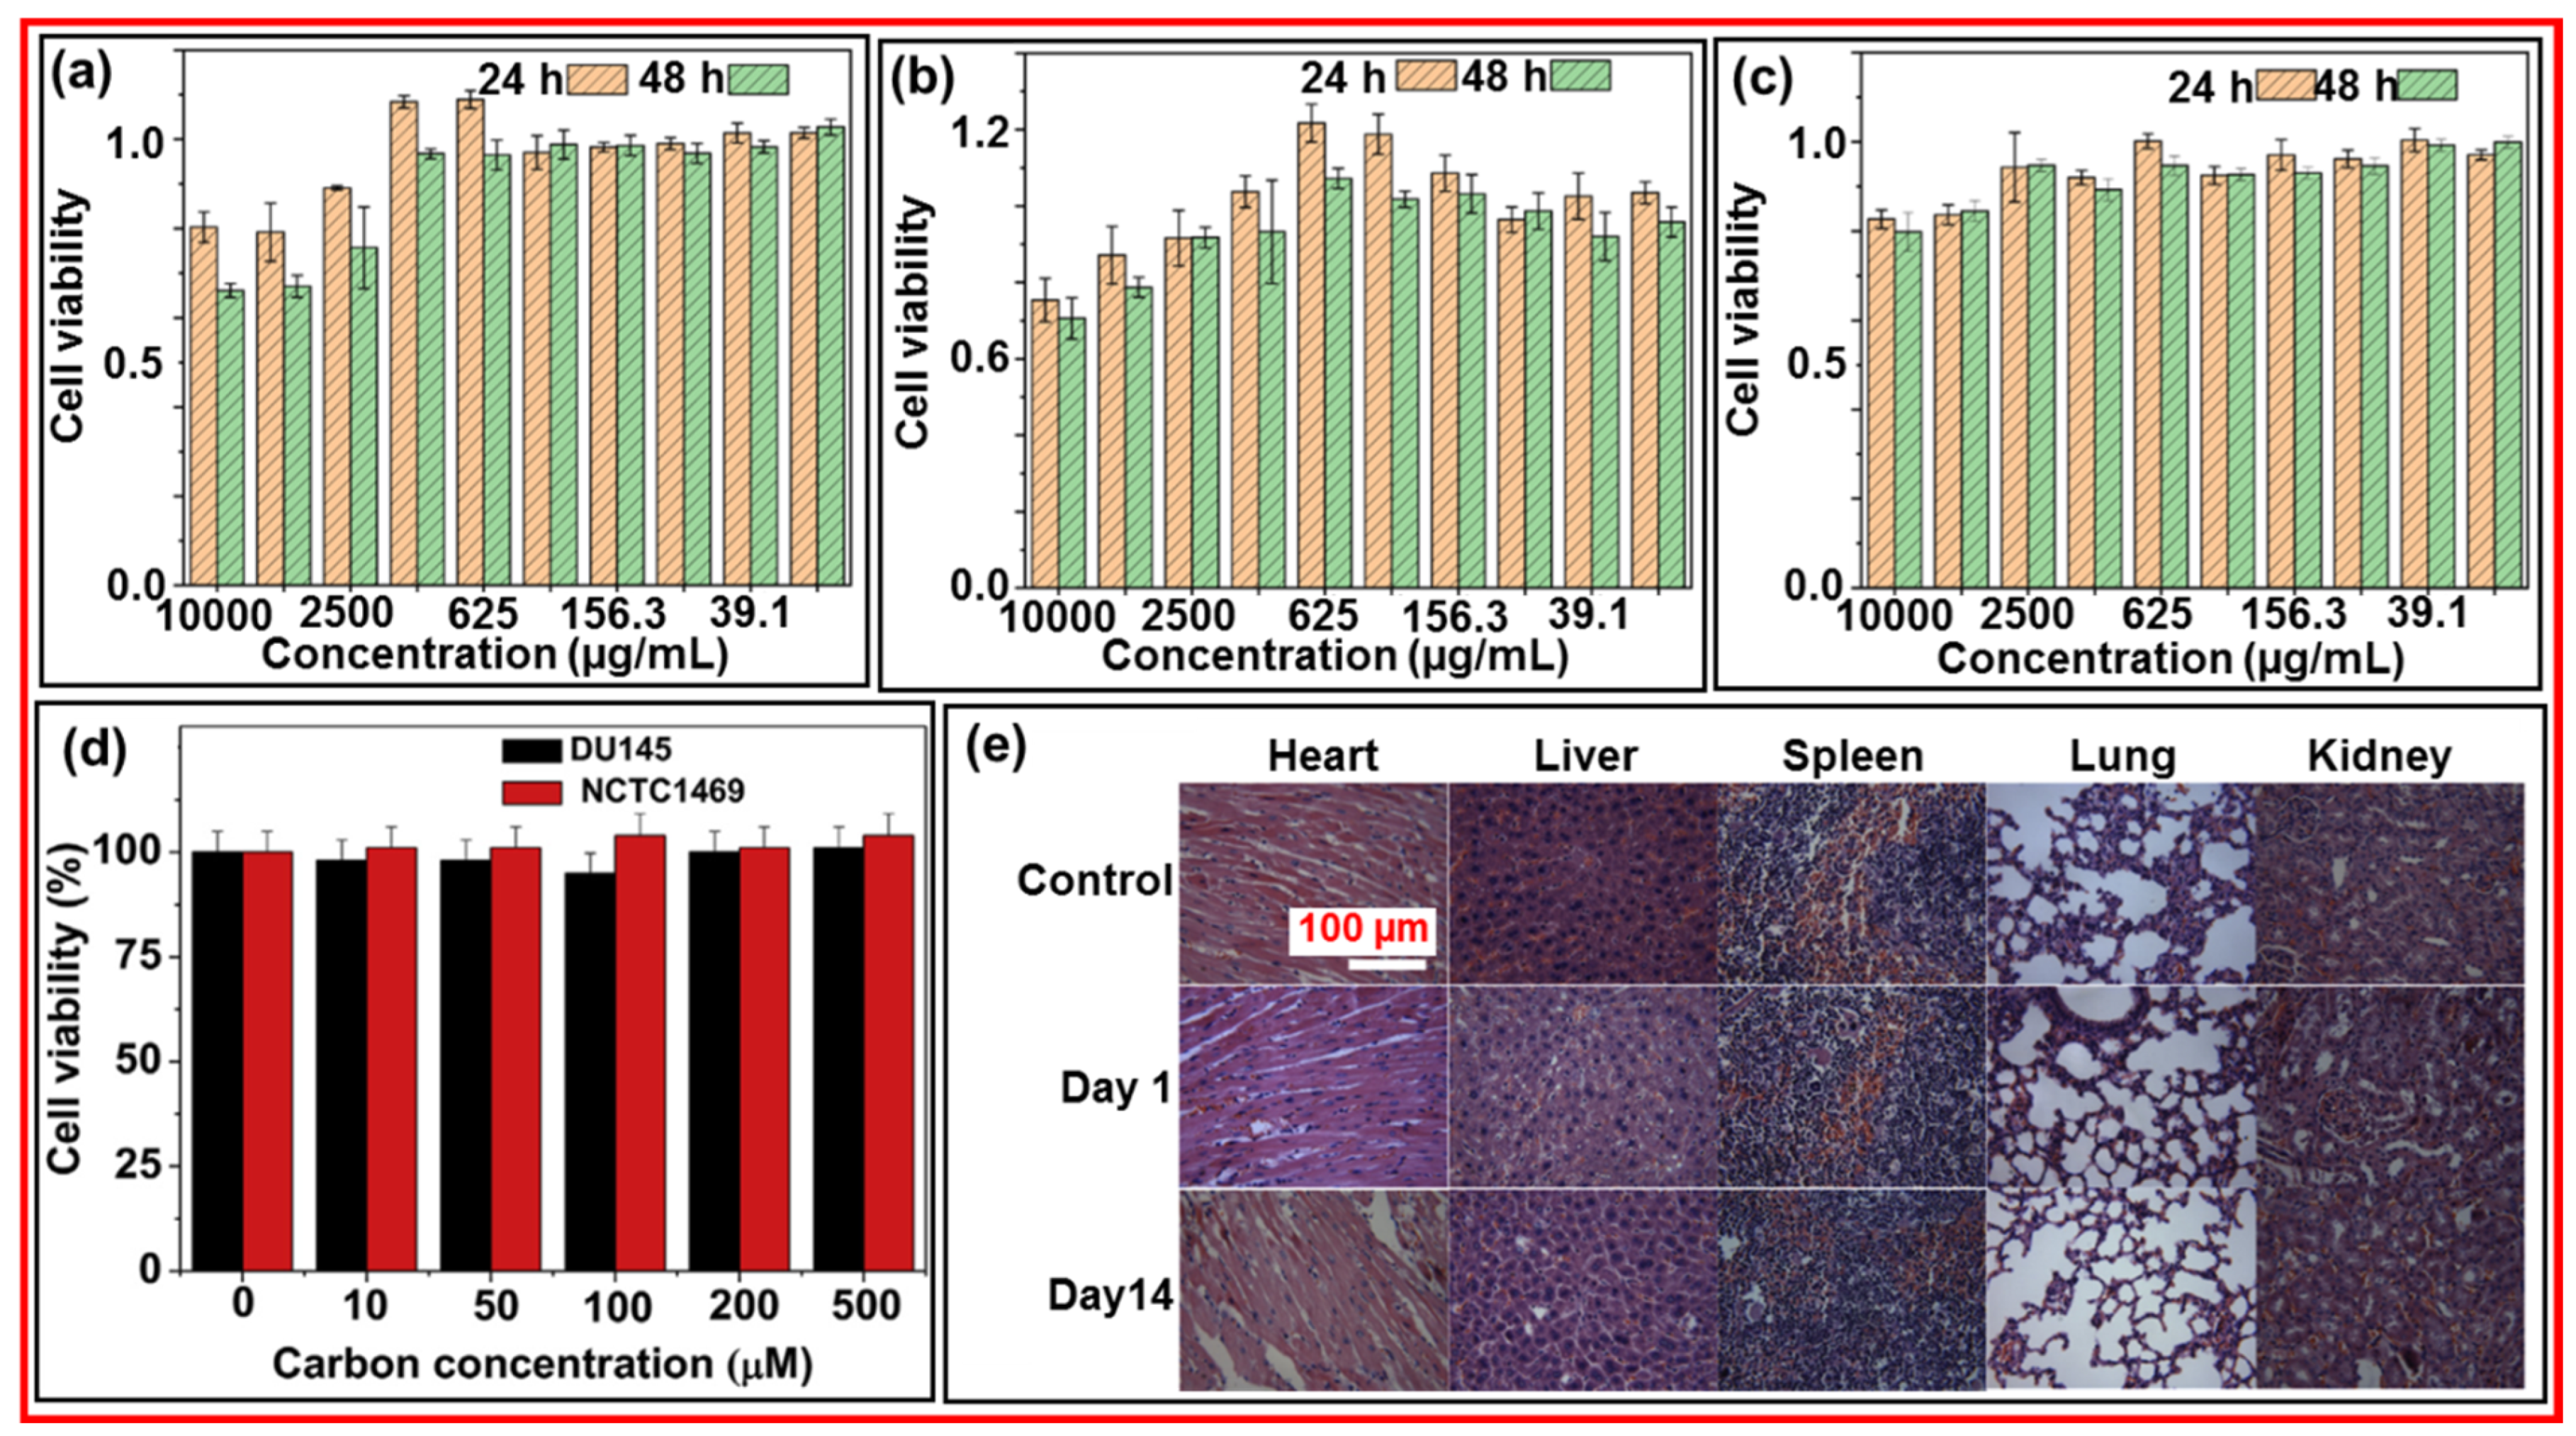
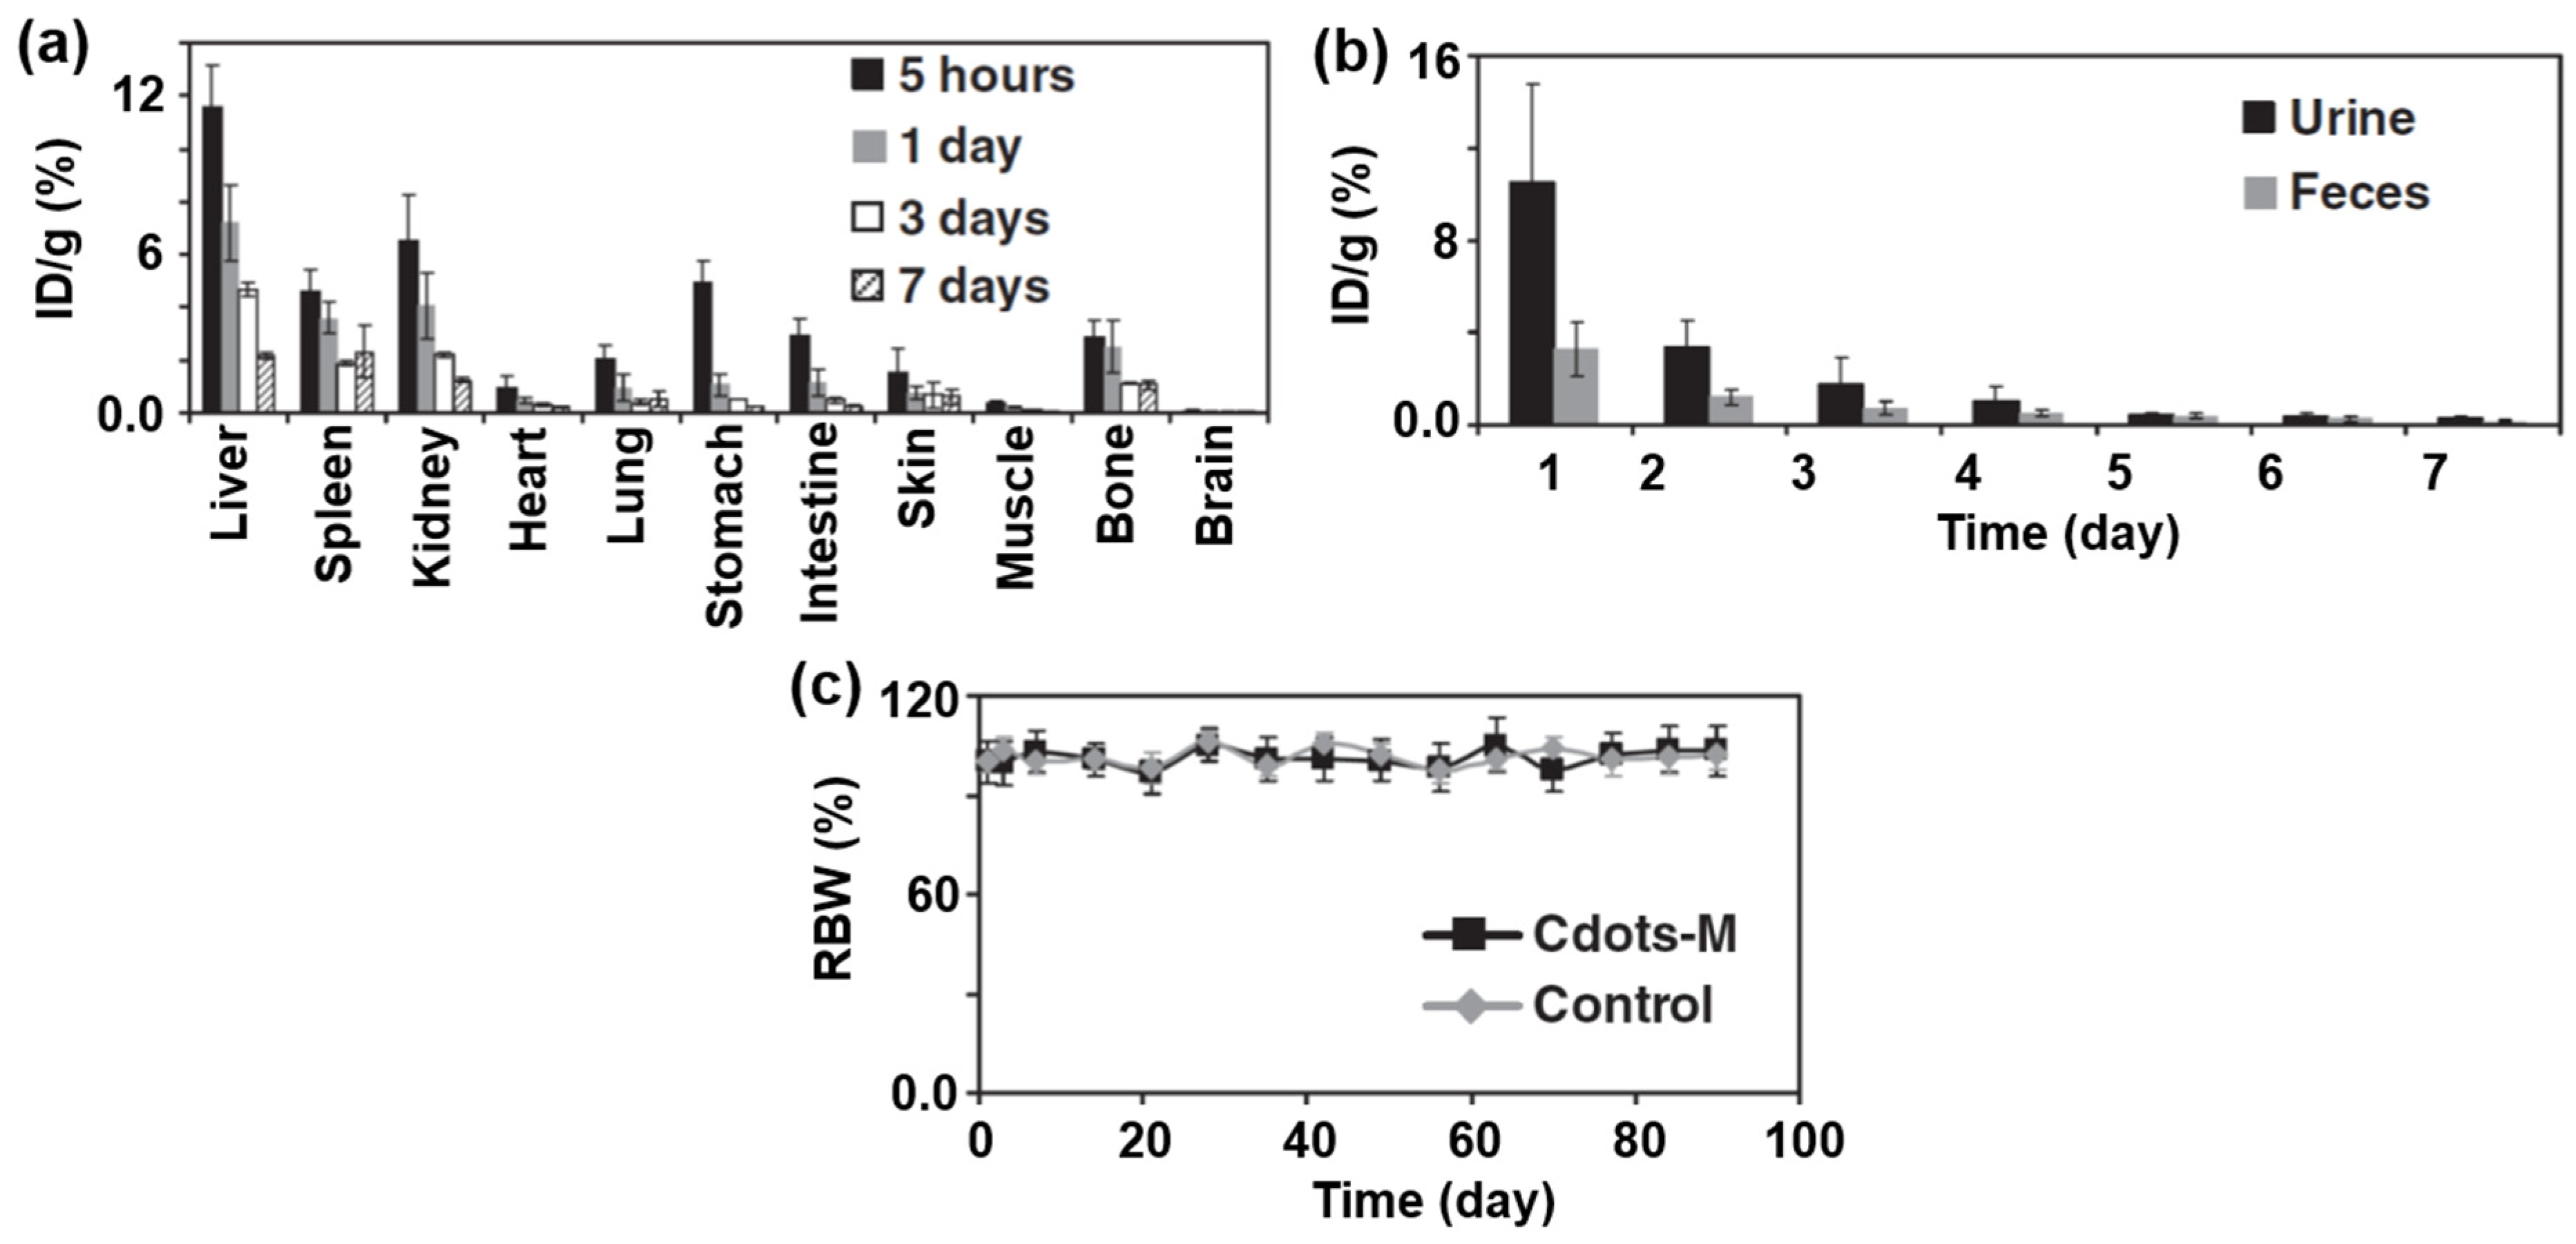
3.3. In Vitro and In Vivo Cytotoxicity
4. CDs as diaCEST MRI Contrast Agents
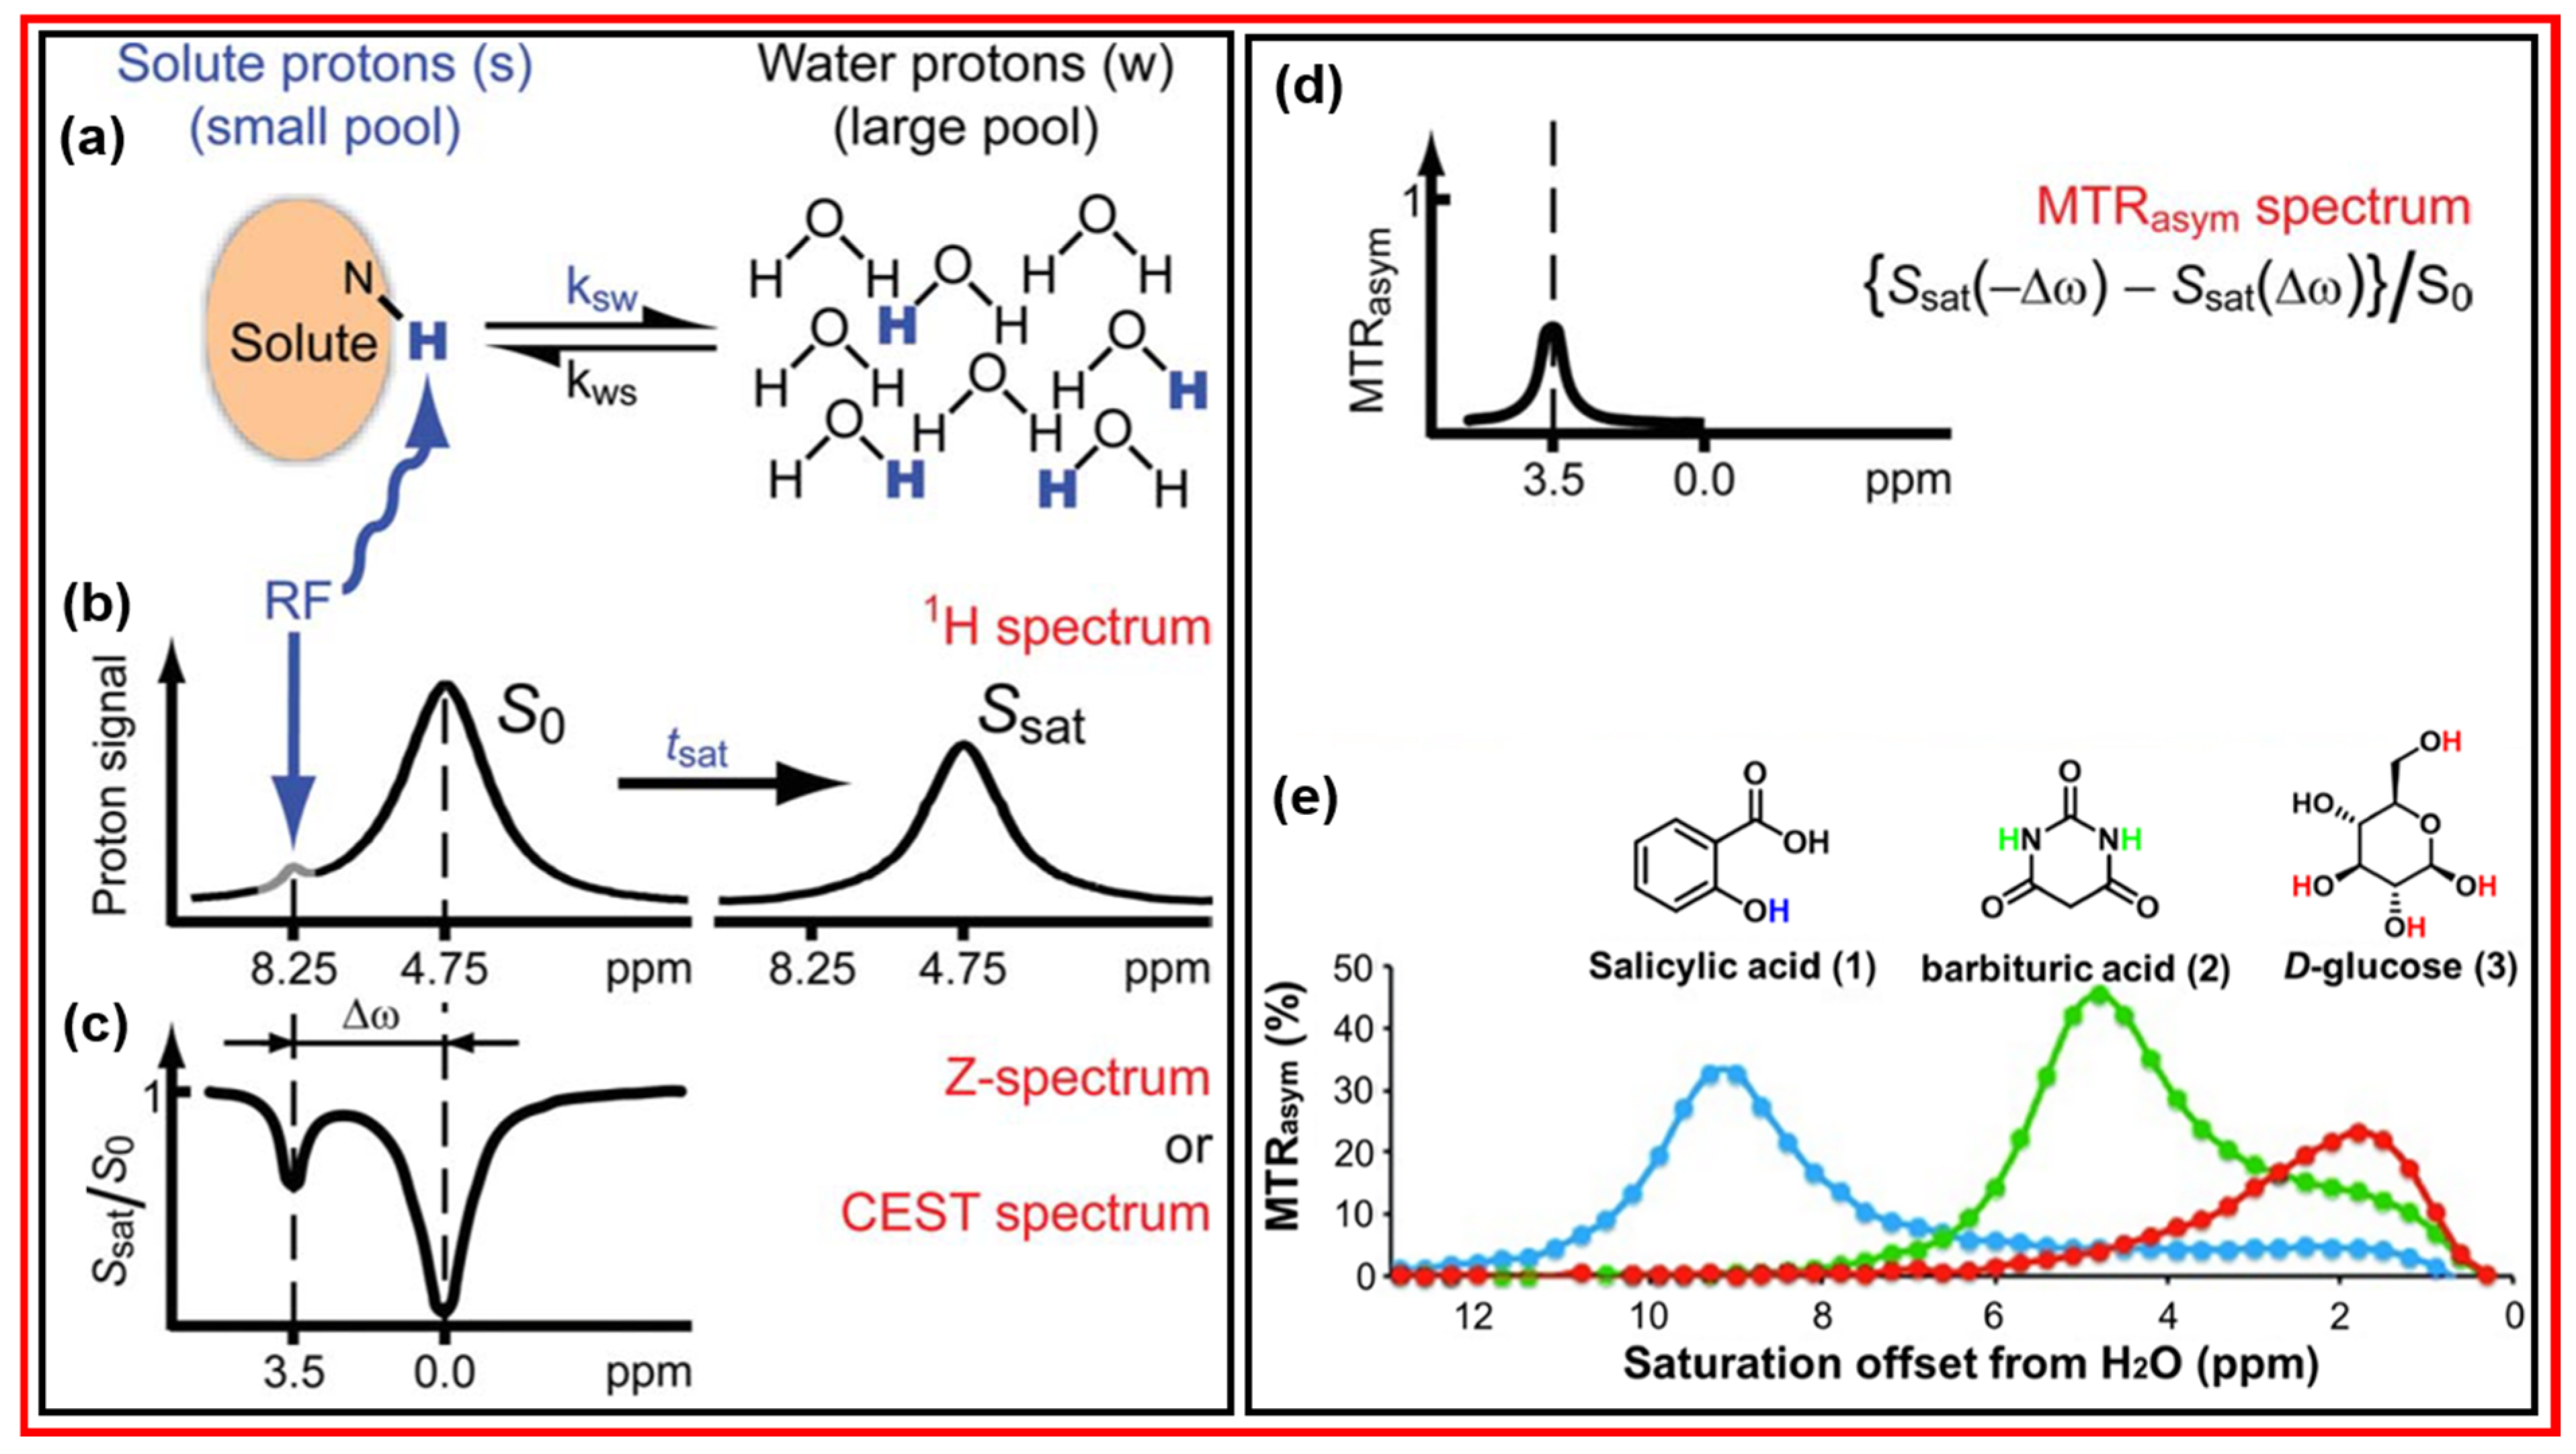
4.1. Principle of CEST
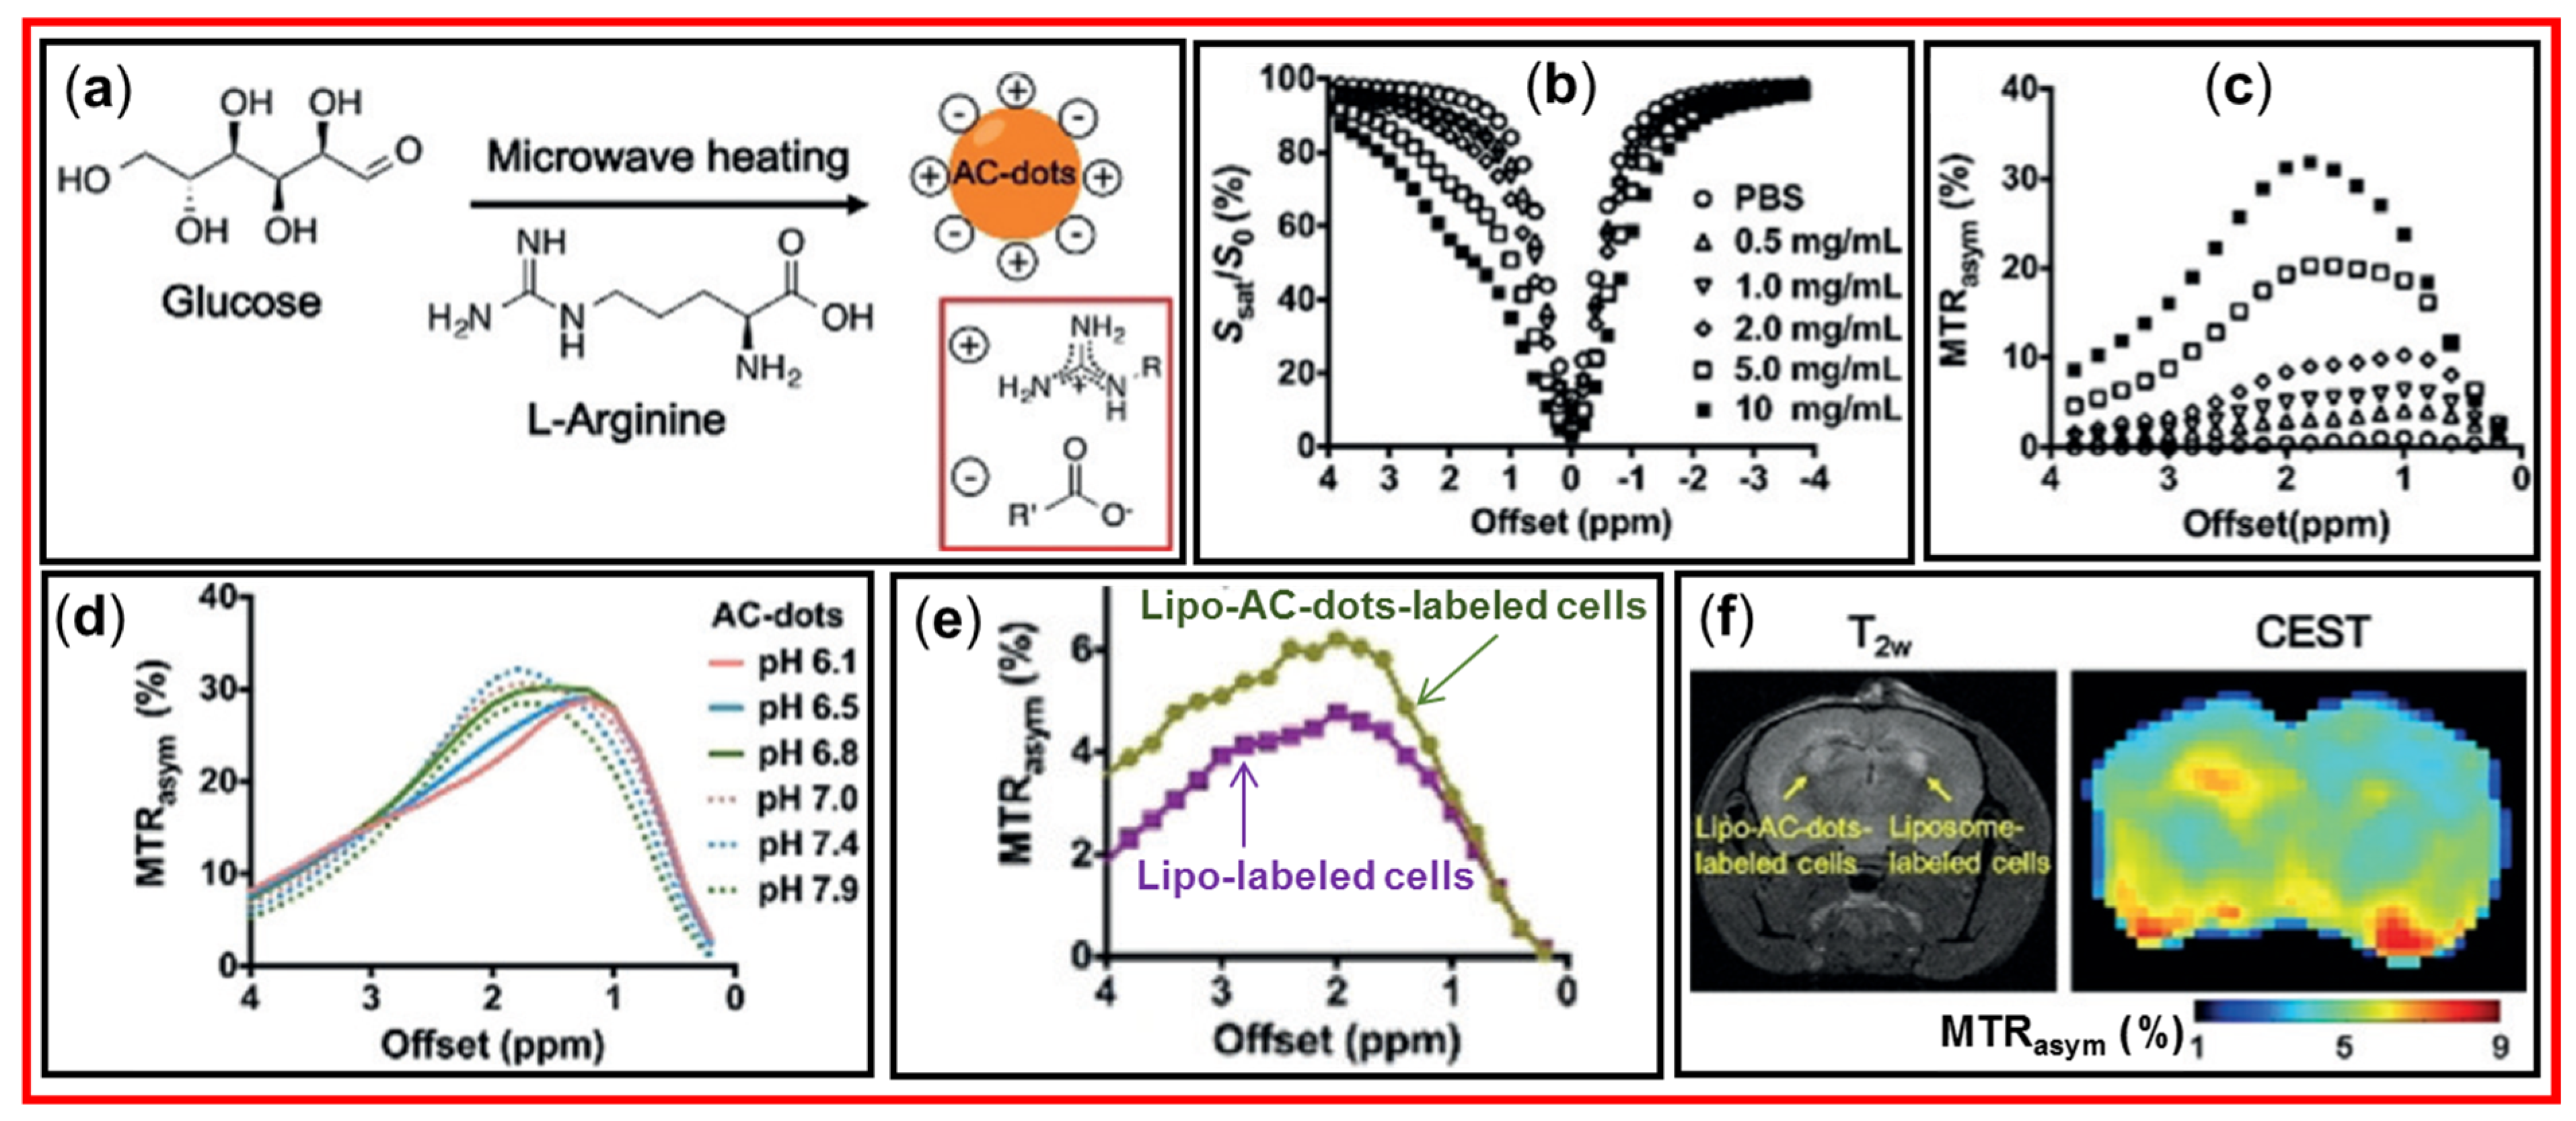
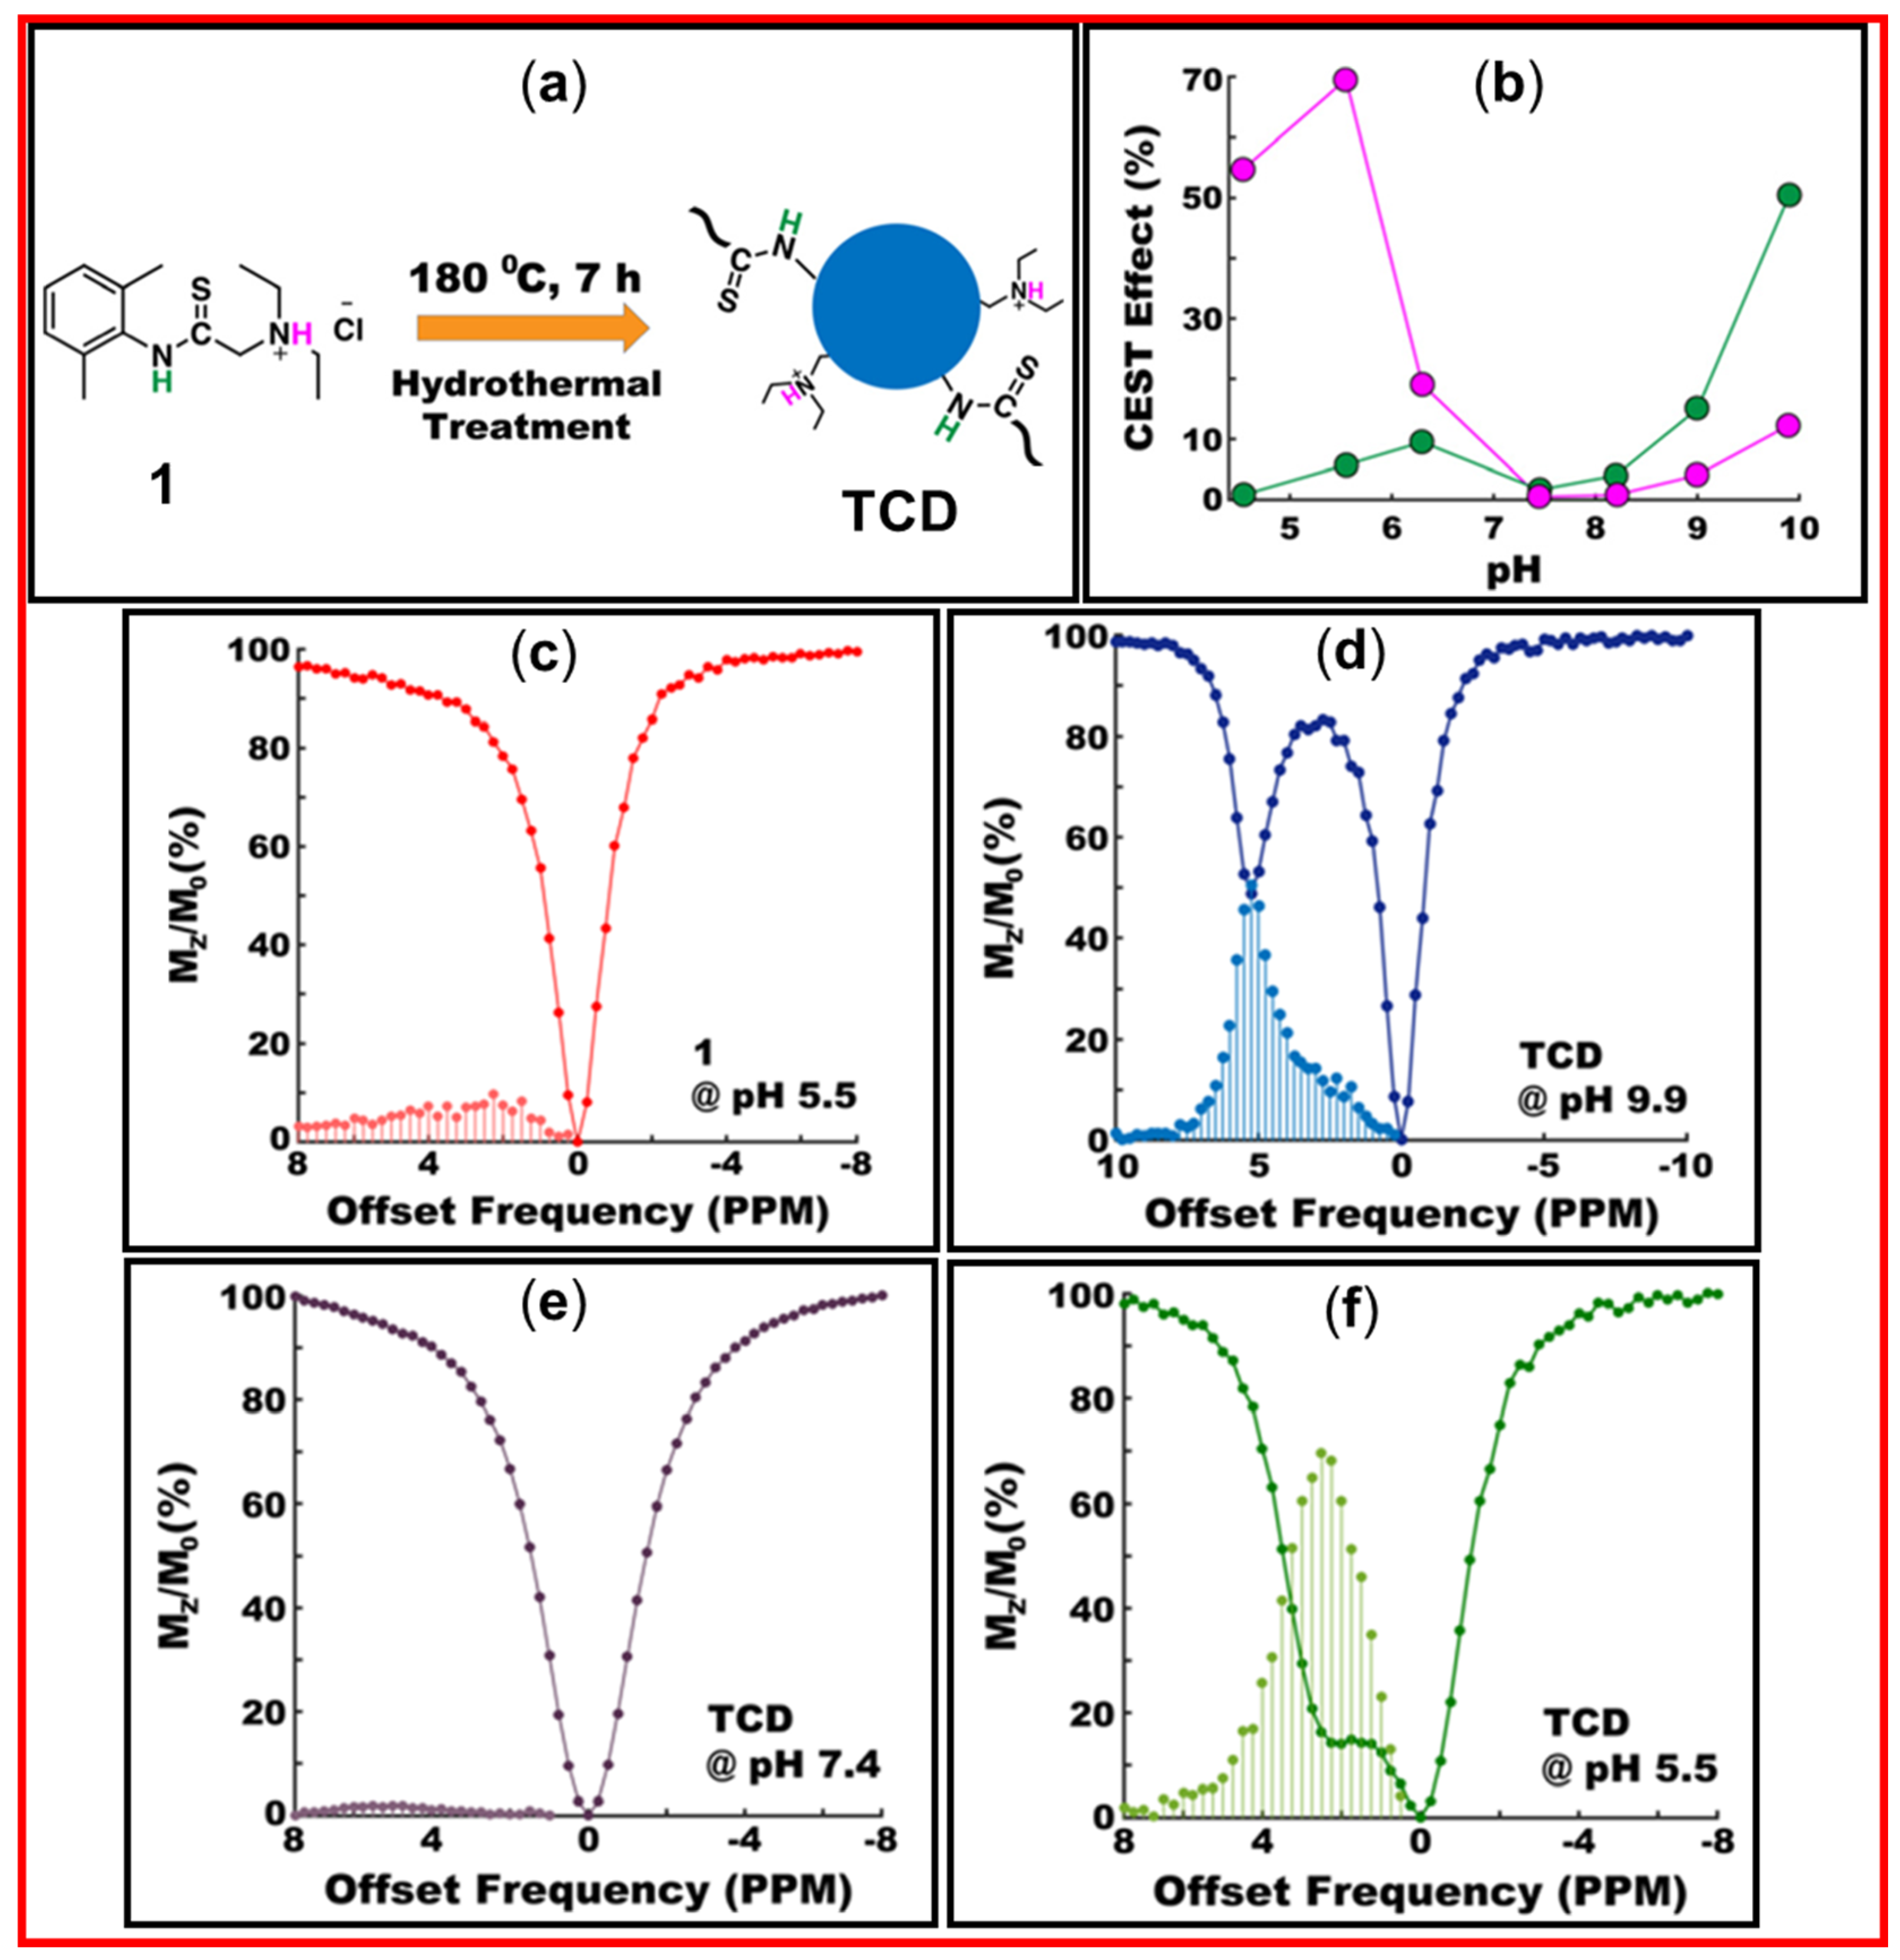
4.2. Applications of CDs as diaCEST MRI Contrast Agents
4.3. Comparison with Other MRI Contrast Agents
5. Conclusions and Future Perspectives
Author Contributions
Funding
Data Availability Statement
Conflicts of Interest
References
- Xu, X.; Ray, R.; Gu, Y.; Ploehn, H.J.; Gearheart, L.; Raker, K.; Scrivens, W.A. Electrophoretic Analysis and Purification of Fluorescent Single-Walled Carbon Nanotube Fragments. J. Am. Chem. Soc. 2004, 126, 12736–12737. [Google Scholar] [CrossRef] [PubMed]
- Sun, Y.-P.; Zhou, B.; Lin, Y.; Wang, W.; Fernando, K.A.S.; Pathak, P.; Meziani, M.J.; Harruff, B.A.; Wang, X.; Wang, H.; et al. Quantum-Sized Carbon Dots for Bright and Colorful Photoluminescence. J. Am. Chem. Soc. 2006, 128, 7756–7757. [Google Scholar] [CrossRef] [PubMed]
- Su, W.; Wu, H.; Xu, H.; Zhang, Y.; Li, Y.; Li, X.; Fan, L. Carbon Dots: A Booming Material for Biomedical Applications. Mater. Chem. Front. 2020, 4, 821–836. [Google Scholar]
- Salvi, A.; Kharbanda, S.; Thakur, P.; Shandilya, M.; Thakur, A. Biomedical Application of Carbon Quantum Dots: A Review. Carbon Trends 2024, 17, 100407. [Google Scholar]
- Hebbar, A.; Selvaraj, R.; Vinayagam, R.; Varadavenkatesan, T.; Kumar, P.S.; Duc, P.A.; Rangasamy, G. A Critical Review on the Environmental Applications of Carbon Dots. Chemosphere 2023, 313, 137308. [Google Scholar]
- Long, C.; Jiang, Z.; Shangguan, J.; Qing, T.; Zhang, P.; Feng, B. Applications of Carbon Dots in Environmental Pollution Control: A Review. Chem. Eng. J. 2021, 406, 126848. [Google Scholar] [CrossRef]
- Hu, J.; Sun, Y.; Aryee, A.A.; Qu, L.; Zhang, K.; Li, Z. Mechanisms for Carbon Dots-Based Chemosensing, Biosensing, and Bioimaging: A Review. Anal. Chim. Acta 2022, 1209, 338885. [Google Scholar]
- Khan, M.E.; Mohammad, A.; Yoon, T. State-of-the-Art Developments in Carbon Quantum Dots (CQDs): Photo-Catalysis, Bio-Imaging, and Bio-Sensing Applications. Chemosphere 2022, 302, 134815. [Google Scholar]
- Ali, H.; Ghosh, S.; Jana, N.R. Fluorescent Carbon Dots as Intracellular Imaging Probes. WIREs Nanomed. Nanobiotechnol. 2020, 12, e1617. [Google Scholar] [CrossRef]
- Wang, Z.-X.; Wang, Z.; Wu, F.-G. Carbon Dots as Drug Delivery Vehicles for Antimicrobial Applications: A Minireview. ChemMedChem 2022, 17, e202200003. [Google Scholar]
- Jia, Q.; Zhao, Z.; Liang, K.; Nan, F.; Li, Y.; Wang, J.; Ge, J.; Wang, P. Recent Advances and Prospects of Carbon Dots in Cancer Nanotheranostics. Mater. Chem. Front. 2020, 4, 449–471. [Google Scholar] [CrossRef]
- Tran, N.-A.; Hien, N.T.; Hoang, N.M.; Dang, H.-L.T.; Huy, D.Q.; Van Quy, T.; Hanh, N.T.; Vu, N.H.; Dao, V.-D. Carbon Dots in Environmental Treatment and Protection Applications. Desalination 2023, 548, 116285. [Google Scholar] [CrossRef]
- Xiao, Y.; Wang, Z.; Fu, J.; Zhang, J.; He, Q.; Lu, H.; Zhou, Q.; Wang, H. Recent Advances in the Synthesis, Characterization, and Application of Carbon Dots in the Field of Wastewater Treatment: A Comprehensive Review. Water 2025, 17, 210. [Google Scholar] [CrossRef]
- Yang, H.-L.; Bai, L.-F.; Geng, Z.-R.; Chen, H.; Xu, L.-T.; Xie, Y.-C.; Wang, D.-J.; Gu, H.-W.; Wang, X.-M. Carbon Quantum Dots: Preparation, Optical Properties, and Biomedical Applications. Mater. Today Adv. 2023, 18, 100376. [Google Scholar] [CrossRef]
- Hu, S.; Zhang, W.; Chang, Q.; Yang, J.; Lin, K. A Chemical Method for Identifying the Photocatalytic Active Sites on Carbon Dots. Carbon 2016, 103, 391–393. [Google Scholar] [CrossRef]
- Dhenadhayalan, N.; Lin, K.-C.; Suresh, R.; Ramamurthy, P. Unravelling the Multiple Emissive States in Citric-Acid-Derived Carbon Dots. J. Phys. Chem. C 2016, 120, 1252–1261. [Google Scholar] [CrossRef]
- Qureshi, Z.A.; Dabash, H.; Ponnamma, D.; Abbas, M.K.G. Carbon Dots as Versatile Nanomaterials in Sensing and Imaging: Efficiency and Beyond. Heliyon 2024, 10, e31634. [Google Scholar] [CrossRef]
- Mandal, S. Elucidating carbon dot research coupled with bibliometric analysis. Next Res. 2024, 1, 100051. [Google Scholar] [CrossRef]
- Zhang, J.; Yuan, Y.; Gao, M.; Han, Z.; Chu, C.; Li, Y.; van Zijl, P.C.M.; Ying, M.; Bulte, J.W.M.; Liu, G. Carbon Dots as a New Class of Diamagnetic Chemical Exchange Saturation Transfer (diaCEST) MRI Contrast Agents. Angew. Chem. Int. Ed. Engl. 2019, 58, 9871–9875. [Google Scholar] [CrossRef]
- Pandey, S.; Keerthana, A.C.; Madhulika, S.; Prasad, P.; Peruncheralathan, S.; Ghosh, A. Hydrothermal Treatment as a Means of Improving the Solubility and Enhancing the diaCEST MRI Contrast Efficiency. New J. Chem. 2022, 46, 14888–14893. [Google Scholar] [CrossRef]
- Pandey, S.; Ghosh, R.; Ghosh, A. Preparation of Hydrothermal Carbon Quantum Dots as a Contrast Amplifying Technique for the diaCEST MRI Contrast Agents. ACS Omega 2022, 7, 33934–33941. [Google Scholar] [CrossRef]
- Pandey, S.; Ghosh, A. Going Above and Beyond: Achieving High Contrast and Higher Offset through Carbon Dot-Based diaCEST MRI Contrast Agents. Chem. Biomed. Imaging 2025, 3, 123–131. [Google Scholar] [CrossRef] [PubMed]
- Tu, L.; Li, Q.; Qiu, S.; Li, M.; Shin, J.; Wu, P.; Singh, N.; Li, J.; Ding, Q.; Hu, C.; et al. Recent Developments in Carbon Dots: A Biomedical Application Perspective. J. Mater. Chem. B 2023, 11, 3038–3053. [Google Scholar] [CrossRef]
- Kabasawa, H. MR Imaging in the 21st Century: Technical Innovation over the First Two Decades. Magn. Reson. Med. Sci. 2021, 21, 71–82. [Google Scholar] [PubMed]
- Ward, K.M.; Aletras, A.H.; Balaban, R.S. A New Class of Contrast Agents for MRI Based on Proton Chemical Exchange Dependent Saturation Transfer (CEST). J. Magn. Reson. 2000, 143, 79–87. [Google Scholar] [PubMed]
- Hancu, I.; Dixon, W.T.; Woods, M.; Vinogradov, E.; Sherry, A.D.; Lenkinski, R.E. CEST and PARACEST MR contrast agents. Acta Radiol. 2010, 51, 910–923. [Google Scholar] [PubMed]
- Yang, X.; Song, X.; Li, Y.; Liu, G.; Ray Banerjee, S.; Pomper, M.G.; McMahon, M.T. Salicylic Acid and Analogues as diaCEST MRI Contrast Agents with Highly Shifted Exchangeable Proton Frequencies. Angew. Chem. Int. Ed. 2013, 52, 8116–8119. [Google Scholar] [CrossRef]
- Cui, L.; Ren, X.; Sun, M.; Liu, H.; Xia, L. Carbon Dots: Synthesis, Properties and Applications. Nanomaterials 2021, 11, 3419. [Google Scholar] [CrossRef]
- El-Azazy, M.; Osman, A.I.; Nasr, M.; Ibrahim, Y.; Al-Hashimi, N.; Al-Saad, K.; Al-Ghouti, M.A.; Shibl, M.F.; Al-Muhtaseb, A.H.; Rooney, D.W.; et al. The Interface of Machine Learning and Carbon Quantum Dots: From Coordinated Innovative Synthesis to Practical Application in Water Control and Electrochemistry. Coord. Chem. Rev. 2024, 517, 215976. [Google Scholar]
- Tao, H.; Yang, K.; Ma, Z.; Wan, J.; Zhang, Y.; Kang, Z.; Liu, Z. In Vivo NIR Fluorescence Imaging, Biodistribution, and Toxicology of Photoluminescent Carbon Dots Produced from Carbon Nanotubes and Graphite. Small 2012, 8, 281–290. [Google Scholar]
- Qiao, Z.-A.; Wang, Y.; Gao, Y.; Li, H.; Dai, T.; Liu, Y.; Huo, Q. Commercially Activated Carbon as the Source for Producing Multicolor Photoluminescent Carbon Dots by Chemical Oxidation. Chem. Commun. 2009, 46, 8812–8814. [Google Scholar] [CrossRef] [PubMed]
- Rocco, D.; Moldoveanu, V.G.; Feroci, M.; Bortolami, M.; Vetica, F. Electrochemical Synthesis of Carbon Quantum Dots. ChemElectroChem 2023, 10, e202201104. [Google Scholar] [PubMed]
- Bao, L.; Zhang, Z.-L.; Tian, Z.-Q.; Zhang, L.; Liu, C.; Lin, Y.; Qi, B.; Pang, D.-W. Electrochemical Tuning of Luminescent Carbon Nanodots: From Preparation to Luminescence Mechanism. Adv. Mater. 2011, 23, 5801–5806. [Google Scholar] [CrossRef]
- Liu, M.; Xu, Y.; Niu, F.; Gooding, J.J.; Liu, J. Carbon Quantum Dots Directly Generated from Electrochemical Oxidation of Graphite Electrodes in Alkaline Alcohols and the Applications for Specific Ferric Ion Detection and Cell Imaging. Analyst 2016, 141, 2657–2664. [Google Scholar] [CrossRef] [PubMed]
- Gayen, B.; Palchoudhury, S.; Chowdhury, J. Carbon Dots: A Mystic Star in the World of Nanoscience. J. Nanomater. 2019, 2019, 3451307. [Google Scholar] [CrossRef]
- Kumar, P.; Dua, S.; Kaur, R.; Kumar, M.; Bhatt, G. A Review on Advancements in Carbon Quantum Dots and Their Application in Photovoltaics. RSC Adv. 2022, 12, 4714–4759. [Google Scholar] [CrossRef] [PubMed]
- Cui, L.; Ren, X.; Wang, J.; Sun, M. Synthesis of Homogeneous Carbon Quantum Dots by Ultrafast Dual-Beam Pulsed Laser Ablation for Bioimaging. Mater. Today Nano 2020, 12, 100091. [Google Scholar] [CrossRef]
- Hu, S.; Liu, J.; Yang, J.; Wang, Y.; Cao, S. Laser Synthesis and Size Tailor of Carbon Quantum Dots. J. Nanoparticle Res. 2011, 13, 7247–7252. [Google Scholar] [CrossRef]
- Park, S.Y.; Lee, H.U.; Park, E.S.; Lee, S.C.; Lee, J.-W.; Jeong, S.W.; Kim, C.H.; Lee, Y.-C.; Huh, Y.S.; Lee, J. Photoluminescent Green Carbon Nanodots from Food-Waste-Derived Sources: Large-Scale Synthesis, Properties, and Biomedical Applications. ACS Appl. Mater. Interfaces 2014, 6, 3365–3370. [Google Scholar] [CrossRef]
- Wu, M.; Wang, Y.; Wu, W.; Hu, C.; Wang, X.; Zheng, J.; Li, Z.; Jiang, B.; Qiu, J. Preparation of Functionalized Water-Soluble Photoluminescent Carbon Quantum Dots from Petroleum Coke. Carbon 2014, 78, 480–489. [Google Scholar] [CrossRef]
- Nikita, V.T.; Evgeny, V.K.; Pavel, D.K.; Yuan, X.; Mikhail, Y.L.; Weiren, Z.; Alexander, V.B.; Anatoly, V.F.; Andrey, L.R.; Ivan, D.R. sp2-sp3-Hybridized Atomic Domains Determine Optical Features of Carbon Dots. ACS Nano 2019, 13, 10737–10744. [Google Scholar]
- Choi, Y.; Choi, Y.; Kwon, O.-H.; Kim, B.-S. Carbon Dots: Bottom-Up Syntheses, Properties, and Light-Harvesting Applications. Chem. Asian J. 2018, 13, 586–598. [Google Scholar] [CrossRef] [PubMed]
- Yang, Y.; Wu, D.; Han, S.; Hu, P.; Liu, R. Bottom-up Fabrication of Photoluminescent Carbon Dots with Uniform Morphology via a Soft–Hard Template Approach. Chem. Commun. 2013, 49, 4920–4922. [Google Scholar] [CrossRef]
- Zhu, H.; Wang, X.; Li, Y.; Wang, Z.; Yang, F.; Yang, X. Microwave Synthesis of Fluorescent Carbon Nanoparticles with Electrochemiluminescence Properties. Chem. Commun. 2009, 34, 5118–5120. [Google Scholar] [CrossRef]
- Choi, Y.; Thongsai, N.; Chae, A.; Jo, S.; Kang, E.B.; Paoprasert, P.; Park, S.Y.; In, I. Microwave-Assisted Synthesis of Luminescent and Biocompatible Lysine-Based Carbon Quantum Dots. J. Ind. Eng. Chem. 2017, 47, 329–335. [Google Scholar] [CrossRef]
- Yu, T.; Wang, H.; Guo, C.; Zhai, Y.; Yang, J.; Yuan, J. A Rapid Microwave Synthesis of Green-Emissive Carbon Dots with Solid-State Fluorescence and pH-Sensitive Properties. Royal. Soc. Open Sci. 2018, 5, 180245. [Google Scholar] [CrossRef]
- Jiang, L.; Cai, H.; Zhou, W.; Li, Z.; Zhang, L.; Bi, H. RNA-Targeting Carbon Dots for Live-Cell Imaging of Granule Dynamics. Adv. Mater. 2023, 35, 2210776. [Google Scholar] [CrossRef] [PubMed]
- Wang, R.; Lu, K.-Q.; Tang, Z.-R.; Xu, Y.-J. Recent Progress in Carbon Quantum Dots: Synthesis, Properties and Applications in Photocatalysis. J. Mater. Chem. A 2017, 5, 3717–3734. [Google Scholar] [CrossRef]
- Li, J.-Y.; Liu, Y.; Shu, Q.-W.; Liang, J.-M.; Zhang, F.; Chen, X.-P.; Deng, X.-Y.; Swihart, M.T.; Tan, K.-J. One-Pot Hydrothermal Synthesis of Carbon Dots with Efficient Up- and Down-Converted Photoluminescence for the Sensitive Detection of Morin in a Dual-Readout Assay. Langmuir 2017, 33, 1043–1050. [Google Scholar] [CrossRef]
- Lin, L.; Wang, Y.; Xiao, Y.; Liu, W. Hydrothermal Synthesis of Carbon Dots Codoped with Nitrogen and Phosphorus as a Turn-on Fluorescent Probe for Cadmium(II). Microchim. Acta 2019, 186, 147. [Google Scholar] [CrossRef]
- Liu, Y.; Li, W.; Wu, P.; Ma, C.; Wu, X.; Xu, M.; Luo, S.; Xu, Z.; Liu, S. Hydrothermal Synthesis of Nitrogen and Boron Co-Doped Carbon Quantum Dots for Application in Acetone and Dopamine Sensors and Multicolor Cellular Imaging. Sens. Actuators B Chem. 2019, 281, 34–43. [Google Scholar] [CrossRef]
- Bao, W.; Lan, Y.; Lu, H.; Li, G.; Yu, M.; Yang, J.; Wei, L.; Su, Q. A Dual-Function Carbon Quantum Dot Fluorescent Probe for the Detection of Fe3+ and Sunset Yellow. ChemistrySelect 2022, 7, e202202375. [Google Scholar] [CrossRef]
- Wang, C.; Yang, M.; Shi, H.; Yao, Z.; Liu, E.; Hu, X.; Guo, P.; Xue, W.; Fan, J. Carbon Quantum Dots Prepared by Pyrolysis: Investigation of the Luminescence Mechanism and Application as Fluorescent Probes. Dye. Pigment. 2022, 204, 110431. [Google Scholar] [CrossRef]
- Ţucureanu, V.; Matei, A.; Avram, A.M. FTIR Spectroscopy for Carbon Family Study. Crit. Rev. Anal. Chem. 2016, 46, 502–520. [Google Scholar] [CrossRef]
- Tegafaw, T.; Oh, I.T.; Cha, H.; Yue, H.; Miao, X.; Ho, S.L.; Ahmad, M.Y.; Marasini, S.; Ghazanfari, A.; Kim, H.-K.; et al. Facile Synthesis of Stable Colloidal Suspension of Amorphous Carbon Nanoparticles in Aqueous Medium and Their Characterization. J. Phys. Chem. Solids 2018, 120, 96–103. [Google Scholar]
- John, B.K.; Abraham, T.; Mathew, B. A Review on Characterization Techniques for Carbon Quantum Dots and Their Applications in Agrochemical Residue Detection. J. Fluoresc. 2022, 32, 449–471. [Google Scholar] [PubMed]
- Liu, Y.; Zhou, Q.; Yuan, Y.; Wu, Y. Hydrothermal Synthesis of Fluorescent Carbon Dots from Sodium Citrate and Polyacrylamide and Their Highly Selective Detection of Lead and Pyrophosphate. Carbon 2017, 115, 550–560. [Google Scholar]
- Edison, T.N.J.I.; Atchudan, R.; Sethuraman, M.G.; Shim, J.-J.; Lee, Y.R. Microwave Assisted Green Synthesis of Fluorescent N-Doped Carbon Dots: Cytotoxicity and Bio-Imaging Applications. J. Photochem. Photobiol. B 2016, 161, 154–161. [Google Scholar] [PubMed]
- Shen, T.-Y.; Jia, P.-Y.; Chen, D.-S.; Wang, L.-N. Hydrothermal Synthesis of N-Doped Carbon Quantum Dots and Their Application in Ion-Detection and Cell-Imaging. Spectrochim. Acta. A. Mol. Biomol. Spectrosc. 2021, 248, 119282. [Google Scholar]
- Wang, Y.; Chang, X.; Jing, N.; Zhang, Y. Hydrothermal Synthesis of Carbon Quantum Dots as Fluorescent Probes for the Sensitive and Rapid Detection of Picric Acid. Anal. Methods 2018, 10, 2775–2784. [Google Scholar]
- Yu, C.; Xuan, T.; Chen, Y.; Zhao, Z.; Sun, Z.; Li, H. A Facile, Green Synthesis of Highly Fluorescent Carbon Nanoparticles from Oatmeal for Cell Imaging. J. Mater. Chem. C 2015, 3, 9514–9518. [Google Scholar] [CrossRef]
- Xue, M.; Zou, M.; Zhao, J.; Zhan, Z.; Zhao, S. Green Preparation of Fluorescent Carbon Dots from Lychee Seeds and Their Application for the Selective Detection of Methylene Blue and Imaging in Living Cells. J. Mater. Chem. B 2015, 3, 6783–6789. [Google Scholar] [CrossRef] [PubMed]
- Gao, W.; Song, H.; Wang, X.; Liu, X.; Pang, X.; Zhou, Y.; Gao, B.; Peng, X. Carbon Dots with Red Emission for Sensing of Pt2+, Au3+, and Pd2+ and Their Bioapplications in Vitro and in Vivo. ACS Appl. Mater. Interfaces 2018, 10, 1147–1154. [Google Scholar] [CrossRef] [PubMed]
- Qiang, R.; Yang, S.; Hou, K.; Wang, J. Synthesis of Carbon Quantum Dots with Green Luminescence from Potato Starch. New J. Chem. 2019, 43, 10826–10833. [Google Scholar] [CrossRef]
- Thambiraj, S.; Shankaran, D.R. Green Synthesis of Highly Fluorescent Carbon Quantum Dots from Sugarcane Bagasse Pulp. Appl. Surf. Sci. 2016, 390, 435–443. [Google Scholar]
- Rodriguez-Loya, J.; Lerma, M.; Gardea-Torresdey, J.L. Dynamic Light Scattering and Its Application to Control Nanoparticle Aggregation in Colloidal Systems: A Review. Micromachines 2024, 15, 24. [Google Scholar] [CrossRef]
- Boruah, J.S.; Sankaranarayanan, K.; Chowdhury, D. Insight into Carbon Quantum Dot–Vesicles Interactions: Role of Functional Groups. RSC Adv. 2022, 12, 4382–4394. [Google Scholar] [CrossRef]
- Yahaya Pudza, M.; Zainal Abidin, Z.; Abdul Rashid, S.; Md Yasin, F.; Noor, A.S.M.; Issa, M.A. Eco-Friendly Sustainable Fluorescent Carbon Dots for the Adsorption of Heavy Metal Ions in Aqueous Environment. Nanomaterials 2020, 10, 315. [Google Scholar] [CrossRef] [PubMed]
- Lee, K.H.; Noesges, B.A.; McPherson, C.; Khan, F.; Brillson, L.J.; Winter, J.O. Oxidation of Quantum Dots Encapsulated in Block Copolymer Micelles as a Function of Polymer Terminal Charge. Nanoscale 2022, 14, 11779–11789. [Google Scholar] [CrossRef]
- Parkansky, N.; Alterkop, B.; Boxman, R.L.; Leitus, G.; Berkh, O.; Barkay, Z.; Rosenberg, Y.; Eliaz, N. Magnetic Properties of Carbon Nano-Particles Produced by a Pulsed Arc Submerged in Ethanol. Carbon 2008, 46, 215–219. [Google Scholar] [CrossRef]
- Lähderanta, E.; Lashkul, A.V.; Lisunov, K.G.; Zherebtsov, D.A.; Galimov, D.M.; Titkov, A.N. Magnetic Properties of Carbon Nanoparticles. IOP Conf. Ser. Mater. Sci. Eng. 2012, 38, 012010. [Google Scholar] [CrossRef]
- Liu, J.; Bi, H.; Cesar Morais, P.; Zhang, X.; Zhang, F.; Hu, L. Room-Temperature Magnetism in Carbon Dots and Enhanced Ferromagnetism in Carbon Dots-Polyaniline Nanocomposite. Sci. Rep. 2017, 7, 2165. [Google Scholar] [CrossRef] [PubMed]
- Tripti; Kumar, S.; Kumar, P. Pennisteum Glaucum-Derived Carbon Dots Synthesized through Green Approach to Degrade Rose Bengal and Methylene Blue Dyes Photocatalytically. Diam. Relat. Mater. 2024, 148, 111467. [Google Scholar]
- Bhunia, S.K.; Saha, A.; Maity, A.R.; Ray, S.C.; Jana, N.R. Carbon Nanoparticle-Based Fluorescent Bioimaging Probes. Sci. Rep. 2013, 3, 1473. [Google Scholar] [CrossRef]
- Zhao, L.; Di, F.; Wang, D.; Guo, L.-H.; Yang, Y.; Wan, B.; Zhang, H. Chemiluminescence of Carbon Dots under Strong Alkaline Solutions: A Novel Insight into Carbon Dot Optical Properties. Nanoscale 2013, 5, 2655–2658. [Google Scholar] [CrossRef] [PubMed]
- Yang, S.-T.; Wang, X.; Wang, H.; Lu, F.; Luo, P.G.; Cao, L.; Meziani, M.J.; Liu, J.-H.; Liu, Y.; Chen, M.; et al. Carbon Dots as Nontoxic and High-Performance Fluorescence Imaging Agents. J. Phys. Chem. C Nanomater. Interfaces 2009, 113, 18110–18114. [Google Scholar] [CrossRef]
- Belkahla, H.; Boudjemaa, R.; Caorsi, V.; Pineau, D.; Curcio, A.; Lomas, J.S.; Decorse, P.; Chevillot-Biraud, A.; Azaïs, T.; Wilhelm, C.; et al. Carbon dots, a powerful non-toxic support for bioimaging by fluorescence nanoscopy and eradication of bacteria by photothermia. Nanoscale Adv. 2019, 1, 2571–2579. [Google Scholar] [CrossRef]
- Das, S.; Mondal, S.; Ghosh, D. Carbon Quantum Dots in Bioimaging and Biomedicines. Front. Bioeng. Biotechnol. 2024, 11, 1333752. [Google Scholar] [CrossRef] [PubMed]
- Havrdova, M.; Hola, K.; Skopalik, J.; Tomankova, K.; Petr, M.; Cepe, K.; Polakova, K.; Tucek, J.; Bourlinos, A.B.; Zboril, R. Toxicity of Carbon Dots-Effect of Surface Functionalization on the Cell Viability, Reactive Oxygen Species Generation and Cell Cycle. Carbon 2016, 99, 238–248. [Google Scholar] [CrossRef]
- Wang, X.; Wu, T.; Yang, Y.; Zhou, L.; Wang, S.; Liu, J.; Zhao, Y.; Zhang, M.; Zhao, Y.; Qu, H.; et al. Ultrasmall and Highly Biocompatible Carbon Dots Derived from Natural Plant with Amelioration against Acute Kidney Injury. J. Nanobiotechnol. 2023, 21, 63. [Google Scholar] [CrossRef]
- Wang, L.; Li, B.; Xu, F.; Li, Y.; Xu, Z.; Wei, D.; Feng, Y.; Wang, Y.; Jia, D.; Zhou, Y. Visual in Vivo Degradation of Injectable Hydrogel by Real-Time and Non-Invasive Tracking Using Carbon Nanodots as Fluorescent Indicator. Biomaterials 2017, 145, 192–206. [Google Scholar] [CrossRef] [PubMed]
- Truskewycz, A.; Yin, H.; Halberg, N.; Lai, D.T.H.; Ball, A.S.; Truong, V.K.; Rybicka, A.M.; Cole, I. Carbon Dot Therapeutic Platforms: Administration, Distribution, Metabolism, Excretion, Toxicity, and Therapeutic Potential. Small 2022, 18, 2106342. [Google Scholar] [CrossRef]
- Oluwasola, I.E.; Ahmad, A.L.; Shoparwe, N.F.; Ismail, S. Gadolinium Based Contrast Agents (GBCAs): Uniqueness, Aquatic Toxicity Concerns, and Prospective Remediation. J. Contam. Hydrol. 2022, 250, 104057. [Google Scholar] [CrossRef]
- Luo, N.; Yang, C.; Tian, X.; Xiao, J.; Liu, J.; Chen, F.; Zhang, D.; Xu, D.; Zhang, Y.; Yang, G.; et al. A General Top-down Approach to Synthesize Rare Earth Doped-Gd2 O3 Nanocrystals as Dualmodal Contrast Agents. J. Mater. Chem. B 2014, 2, 5891–5897. [Google Scholar] [CrossRef] [PubMed]
- Yao, Y.Y.; Gedda, G.; Girma, W.M.; Yen, C.L.; Ling, Y.C.; Chang, J.Y. Magnetofluorescent Carbon Dots Derived from Crab Shell for Targeted Dual-Modality Bioimaging and Drug Delivery. ACS Appl. Mater. Interfaces 2017, 9, 13887–13899. [Google Scholar] [CrossRef]
- Wang, H.; Shen, J.; Li, Y.; Wei, Z.; Cao, G.; Gai, Z.; Hong, K.; Banerjeem, P.; Zhou, S. Magnetic iron oxide-fluorescent carbon dots integrated nanoparticles for dual-modal imaging, near-infrared light-responsive drug carrier and photothermal therapy. Biomater. Sci. 2014, 2, 915–923. [Google Scholar] [CrossRef] [PubMed]
- Liu, X.; Jiang, H.; Ye, J.; Zhao, C.; Gao, S.; Wu, C.; Li, C.; Li, J.; Wang, X. Nitrogen-Doped Carbon Quantum Dot Stabilized Magnetic Iron Oxide Nanoprobe for Fluorescence, Magnetic Resonance, and Computed Tomography Triple-Modal In Vivo Bioimaging. Adv. Funct. Mater. 2016, 26, 8694–8706. [Google Scholar] [CrossRef]
- Huang, C.-C.; Khu, N.-H.; Yeh, C.-S. The Characteristics of Sub 10 Nm Manganese Oxide T1 Contrast Agents of Different Nanostructured Morphologies. Biomaterials 2010, 31, 4073–4078. [Google Scholar] [CrossRef] [PubMed]
- Pan, D.; Schmieder, A.H.; Wickline, S.A.; Lanza, G.M. Manganese-Based MRI Contrast Agents: Past, Present, and Future. Tetrahedron 2011, 67, 8431–8444. [Google Scholar]
- Wahab, A.; Suhail, M.; Eggers, T.; Shehzad, K.; Akakuru, O.U.; Ahmad, Z.; Sun, Z.; Iqbal, M.Z.; Kong, X. Innovative perspectives on metal free contrast agents for MRI: Enhancing imaging efficacy, and AI-driven future diagnostics. Acta Biomater. 2025, 193, 83–106. [Google Scholar] [PubMed]
- Van Zijl, P.C.M.; Yadav, N.N. Chemical Exchange Saturation Transfer (CEST): What Is in a Name and What Isn’t? Magn. Reson. Med. 2011, 65, 927–948. [Google Scholar] [CrossRef] [PubMed]
- Wu, B.; Warnock, G.; Zaiss, M.; Lin, C.; Chen, M.; Zhou, Z.; Mu, L.; Nanz, D.; Tuura, R.; Delso, G. An Overview of CEST MRI for Non-MR Physicists. EJNMMI Phys. 2016, 3, 19. [Google Scholar] [CrossRef] [PubMed]
- Chan, K.W.Y.; Bulte, J.W.M.; McMahon, M.T. Diamagnetic Chemical Exchange Saturation Transfer (diaCEST) Liposomes: Physicochemical Properties and Imaging Applications. Wiley Interdiscip. Rev. Nanomed. Nanobiotechnol. 2014, 6, 111–124. [Google Scholar] [CrossRef] [PubMed]
- Vinogradov, E.; Sherry, A.D.; Lenkinski, R.E. CEST: From Basic Principles to Applications, Challenges and Opportunities. J. Magn. Reson. 2013, 229, 155–172. [Google Scholar] [CrossRef]
- Su, H.; Chan, K.W.Y. Design Chemical Exchange Saturation Transfer Contrast Agents and Nanocarriers for Imaging Proton Exchange in Vivo. ACS Nano 2024, 18, 33775–33791. [Google Scholar] [CrossRef]
- Yu, Q.; Yu, Z.; Yang, L.; Yuan, Y. Recent Progress on diaCEST MRI for Tumor Imaging. JUSTC 2023, 53, 0601. [Google Scholar] [CrossRef]
- Woods, M.; Woessner, D.E.; Dean Sherry, A. Paramagnetic Lanthanide Complexes as PARACEST Agents for Medical Imaging. Chem. Soc. Rev. 2006, 35, 500–511. [Google Scholar] [CrossRef]
- Aime, S.; Barge, A.; Delli Castelli, D.; Fedeli, F.; Mortillaro, A.; Nielsen, F.U.; Terreno, E. Paramagnetic Lanthanide(III) Complexes as pH-Sensitive Chemical Exchange Saturation Transfer (CEST) Contrast Agents for MRI Applications. Magn. Reson. Med. 2002, 47, 639–648. [Google Scholar] [CrossRef]
- Zhang, X.; Yuan, Y.; Li, S.; Zeng, Q.; Guo, Q.; Liu, N.; Yang, M.; Yang, Y.; Liu, M.; McMahon, M.T.; et al. Free-base porphyrins as CEST MRI contrast agents with highly upfield shifted labile protons. Magn. Reson. Med. 2019, 82, 577–585. [Google Scholar] [CrossRef]
- Chan, K.W.Y.; McMahon, M.T.; Kato, Y.; Liu, G.; Bulte, J.W.M.; Bhujwalla, Z.M.; Artemov, D.; van Zijl, P.C.M. Natural D-Glucose as a Biodegradable MRI Contrast Agent for Detecting Cancer. Magn. Reson. Med. 2012, 68, 1764–1773. [Google Scholar] [CrossRef] [PubMed]
- Ghosal, K.; Ghosh, A. Carbon Dots: The next Generation Platform for Biomedical Applications. Mater. Sci. Eng. C 2019, 96, 887–903. [Google Scholar] [CrossRef] [PubMed]
- Ding, H.; Xiao, T.; Ren, F.; Qiu, Y.; Shen, Z.; Chen, X.; Mijowska, E.; Chen, H. Carbon-Based Nanodots for Biomedical Applications and Clinical Transformation Prospects. BMEMat 2024, 2, e12085. [Google Scholar]
- Wang, B.; Lu, S. The Light of Carbon Dots: From Mechanism to Applications. Matter 2022, 5, 110–149. [Google Scholar] [CrossRef]
- Xiao, Y.-D.; Paudel, R.; Liu, J.; Ma, C.; Zhang, Z.-S.; Zhou, S.-K. MRI Contrast Agents: Classification and Application (Review). Int. J. Mol. Med. 2016, 38, 1319–1326. [Google Scholar] [CrossRef] [PubMed]
- Sieber, M.A.; Lengsfeld, P.; Walter, J.; Schirmer, H.; Frenzel, T.; Siegmund, F.; Weinmann, H.-J.; Pietsch, H. Gadolinium-Based Contrast Agents and Their Potential Role in the Pathogenesis of Nephrogenic Systemic Fibrosis: The Role of Excess Ligand. J. Magn. Reson. Imaging JMRI 2008, 27, 955–962. [Google Scholar]
- Geppert, M.; Himly, M. Iron Oxide Nanoparticles in Bioimaging—An Immune Perspective. Front. Immunol. 2021, 12, 688927. [Google Scholar]


| Carbon Precursor | FT-IR (cm−1) | Raman Shift (cm−1) | Ref. | ||
|---|---|---|---|---|---|
| Wavenumber | Vibration Mode | D-Band | G-Band | ||
| Sodium citrate and polyacrylamide | 3436 and 1410 | N-H/O-H stretching and O-H bending, respectively | 1363 | 1582 | [57] |
| 1590 | N-H bending or asymmetric stretching of carboxylate anions | ||||
| 1648 and 1059 | C=O stretching and C-N stretching, respectively | ||||
| L-ascorbic acid and β-alanine | 1720 | C=O stretching | 1365 | 1595 | [58] |
| 1370 | O-H bending | ||||
| 1214 | C-O stretching | ||||
| 1050 | C-N stretching | ||||
| Glucose and m-phenylenediamine | 3400 | N-H/O-H stretching | 1357 | 1565 | [59] |
| 1605 | C=N or C=O stretching | ||||
| 1137 | Benzene C-H stretching | ||||
| Mandelic acid and ethylenediamine | 3352 to 3031 | O-H and N-H stretching | 1358 | 1574 | [60] |
| 2926 and 1367 | C-H stretching and bending, respectively | ||||
| 1570 | C=O stretching | ||||
| 1059 | C-O stretching | ||||
| 692 | N-H deformation | ||||
| Oatmeal | 3432 | O-H/N-H stretching | 1359 | 1584 | [61] |
| 2921 | C-H stretching | ||||
| 1625 and 1382 | C=O asymmetric and symmetric stretching, respectively | ||||
| 1241 and 1151 | C-N and C-OH stretching, respectively | ||||
| 1091 | C-O stretching | ||||
| Lychee seeds | 3443 | O-H or N-H stretching | 1387 | 1585 | [62] |
| 2981 | C-H stretching | ||||
| 1633 | C=O stretching | ||||
| 1055 | C-O stretching | ||||
| Citric acid and neutral red | 3496 | O-H stretching | 1340 | 1596 | [63] |
| 1720 | C=O stretching | ||||
| 1210 | C-O-C stretching | ||||
| 3296 | N-H stretching | ||||
| 1551 and 1412 | C=C and C-N stretching, respectively | ||||
| Classification | Operational Principle | Chemical | Contrast | Imaging Performance Parameter | Sensitivity | Clinical Usage |
|---|---|---|---|---|---|---|
| Conventional | Acceleration of water proton spin relaxations | metal chelates such as Gd(III)-chelates, Mn(II)-chelates, Fe(III)-chelate | Positive (T1) or negative (T2) | r1, r2/r1 | High | Gd(III)-chelates |
| metal oxide nanoparticles such as Gd2O3, Fe3O4, MnO | ||||||
| CEST | paraCEST (water exchange) | Eu(III)-chelates, Dy(III)-chelates, Tm(III)-chelates | MTRasym | ksw, Δω | Low | - |
| diaCEST (proton exchange) | molecules and CDs with functional groups of -OH, -COOH, -NH2 |
Disclaimer/Publisher’s Note: The statements, opinions and data contained in all publications are solely those of the individual author(s) and contributor(s) and not of MDPI and/or the editor(s). MDPI and/or the editor(s) disclaim responsibility for any injury to people or property resulting from any ideas, methods, instructions or products referred to in the content. |
© 2025 by the authors. Licensee MDPI, Basel, Switzerland. This article is an open access article distributed under the terms and conditions of the Creative Commons Attribution (CC BY) license (https://creativecommons.org/licenses/by/4.0/).
Share and Cite
Mulugeta, E.; Tegafaw, T.; Liu, Y.; Zhao, D.; Baek, A.; Kim, J.; Chang, Y.; Lee, G.H. Synthesis, Characterization, Magnetic Properties, and Applications of Carbon Dots as Diamagnetic Chemical Exchange Saturation Transfer Magnetic Resonance Imaging Contrast Agents: A Review. Nanomaterials 2025, 15, 542. https://doi.org/10.3390/nano15070542
Mulugeta E, Tegafaw T, Liu Y, Zhao D, Baek A, Kim J, Chang Y, Lee GH. Synthesis, Characterization, Magnetic Properties, and Applications of Carbon Dots as Diamagnetic Chemical Exchange Saturation Transfer Magnetic Resonance Imaging Contrast Agents: A Review. Nanomaterials. 2025; 15(7):542. https://doi.org/10.3390/nano15070542
Chicago/Turabian StyleMulugeta, Endale, Tirusew Tegafaw, Ying Liu, Dejun Zhao, Ahrum Baek, Jihyun Kim, Yongmin Chang, and Gang Ho Lee. 2025. "Synthesis, Characterization, Magnetic Properties, and Applications of Carbon Dots as Diamagnetic Chemical Exchange Saturation Transfer Magnetic Resonance Imaging Contrast Agents: A Review" Nanomaterials 15, no. 7: 542. https://doi.org/10.3390/nano15070542
APA StyleMulugeta, E., Tegafaw, T., Liu, Y., Zhao, D., Baek, A., Kim, J., Chang, Y., & Lee, G. H. (2025). Synthesis, Characterization, Magnetic Properties, and Applications of Carbon Dots as Diamagnetic Chemical Exchange Saturation Transfer Magnetic Resonance Imaging Contrast Agents: A Review. Nanomaterials, 15(7), 542. https://doi.org/10.3390/nano15070542