3.1. Examination of Electrode Characteristics
The zeolite Y is a type of synthetic molecular sieve belonging to the faujasite (FAU) family of zeolites. The pore structure of ZY features supercages approximately 12 Å in diameter, connected by windows around 8 Å in diameter, formed by rings of 12 interconnected tetrahedra (12-rings) [
29]. The chemical composition of the analyzed zeolite Y, determined by XRF measurements, was as follows (in wt. %): SiO
2—62.25, Al
2O
3—21.34, Na
2O—16.05, K
2O—0.03, MgO—0.09, CaO—0.14, TiO
2—0.01, Fe
2O
3—0.02, and other—0.07. The calculated silica-to-aluminum (Si/Al) molar ratio of 4.9 indicates that ZY is a low-silica zeolite with a high aluminum content. This composition results in a high cation-exchange capacity and a hydrophilic surface character, which promotes the adsorption of polar, electroactive molecules on the electrode surface.
The textural properties of ZY and MWCNTs (
Table 1) significantly influence their suitability for electrode modification. Zeolite Y exhibits an exceptionally high BET surface area, providing abundant active sites for electroactive species and potentially enhancing their accumulation and selectivity in modified electrodes. In contrast, MWCNTs present a much higher external surface area and wider pore widths, offering efficient electron transfer, which makes them excellent candidates for enhancing electrode conductivity and facilitating fast electrochemical kinetics.
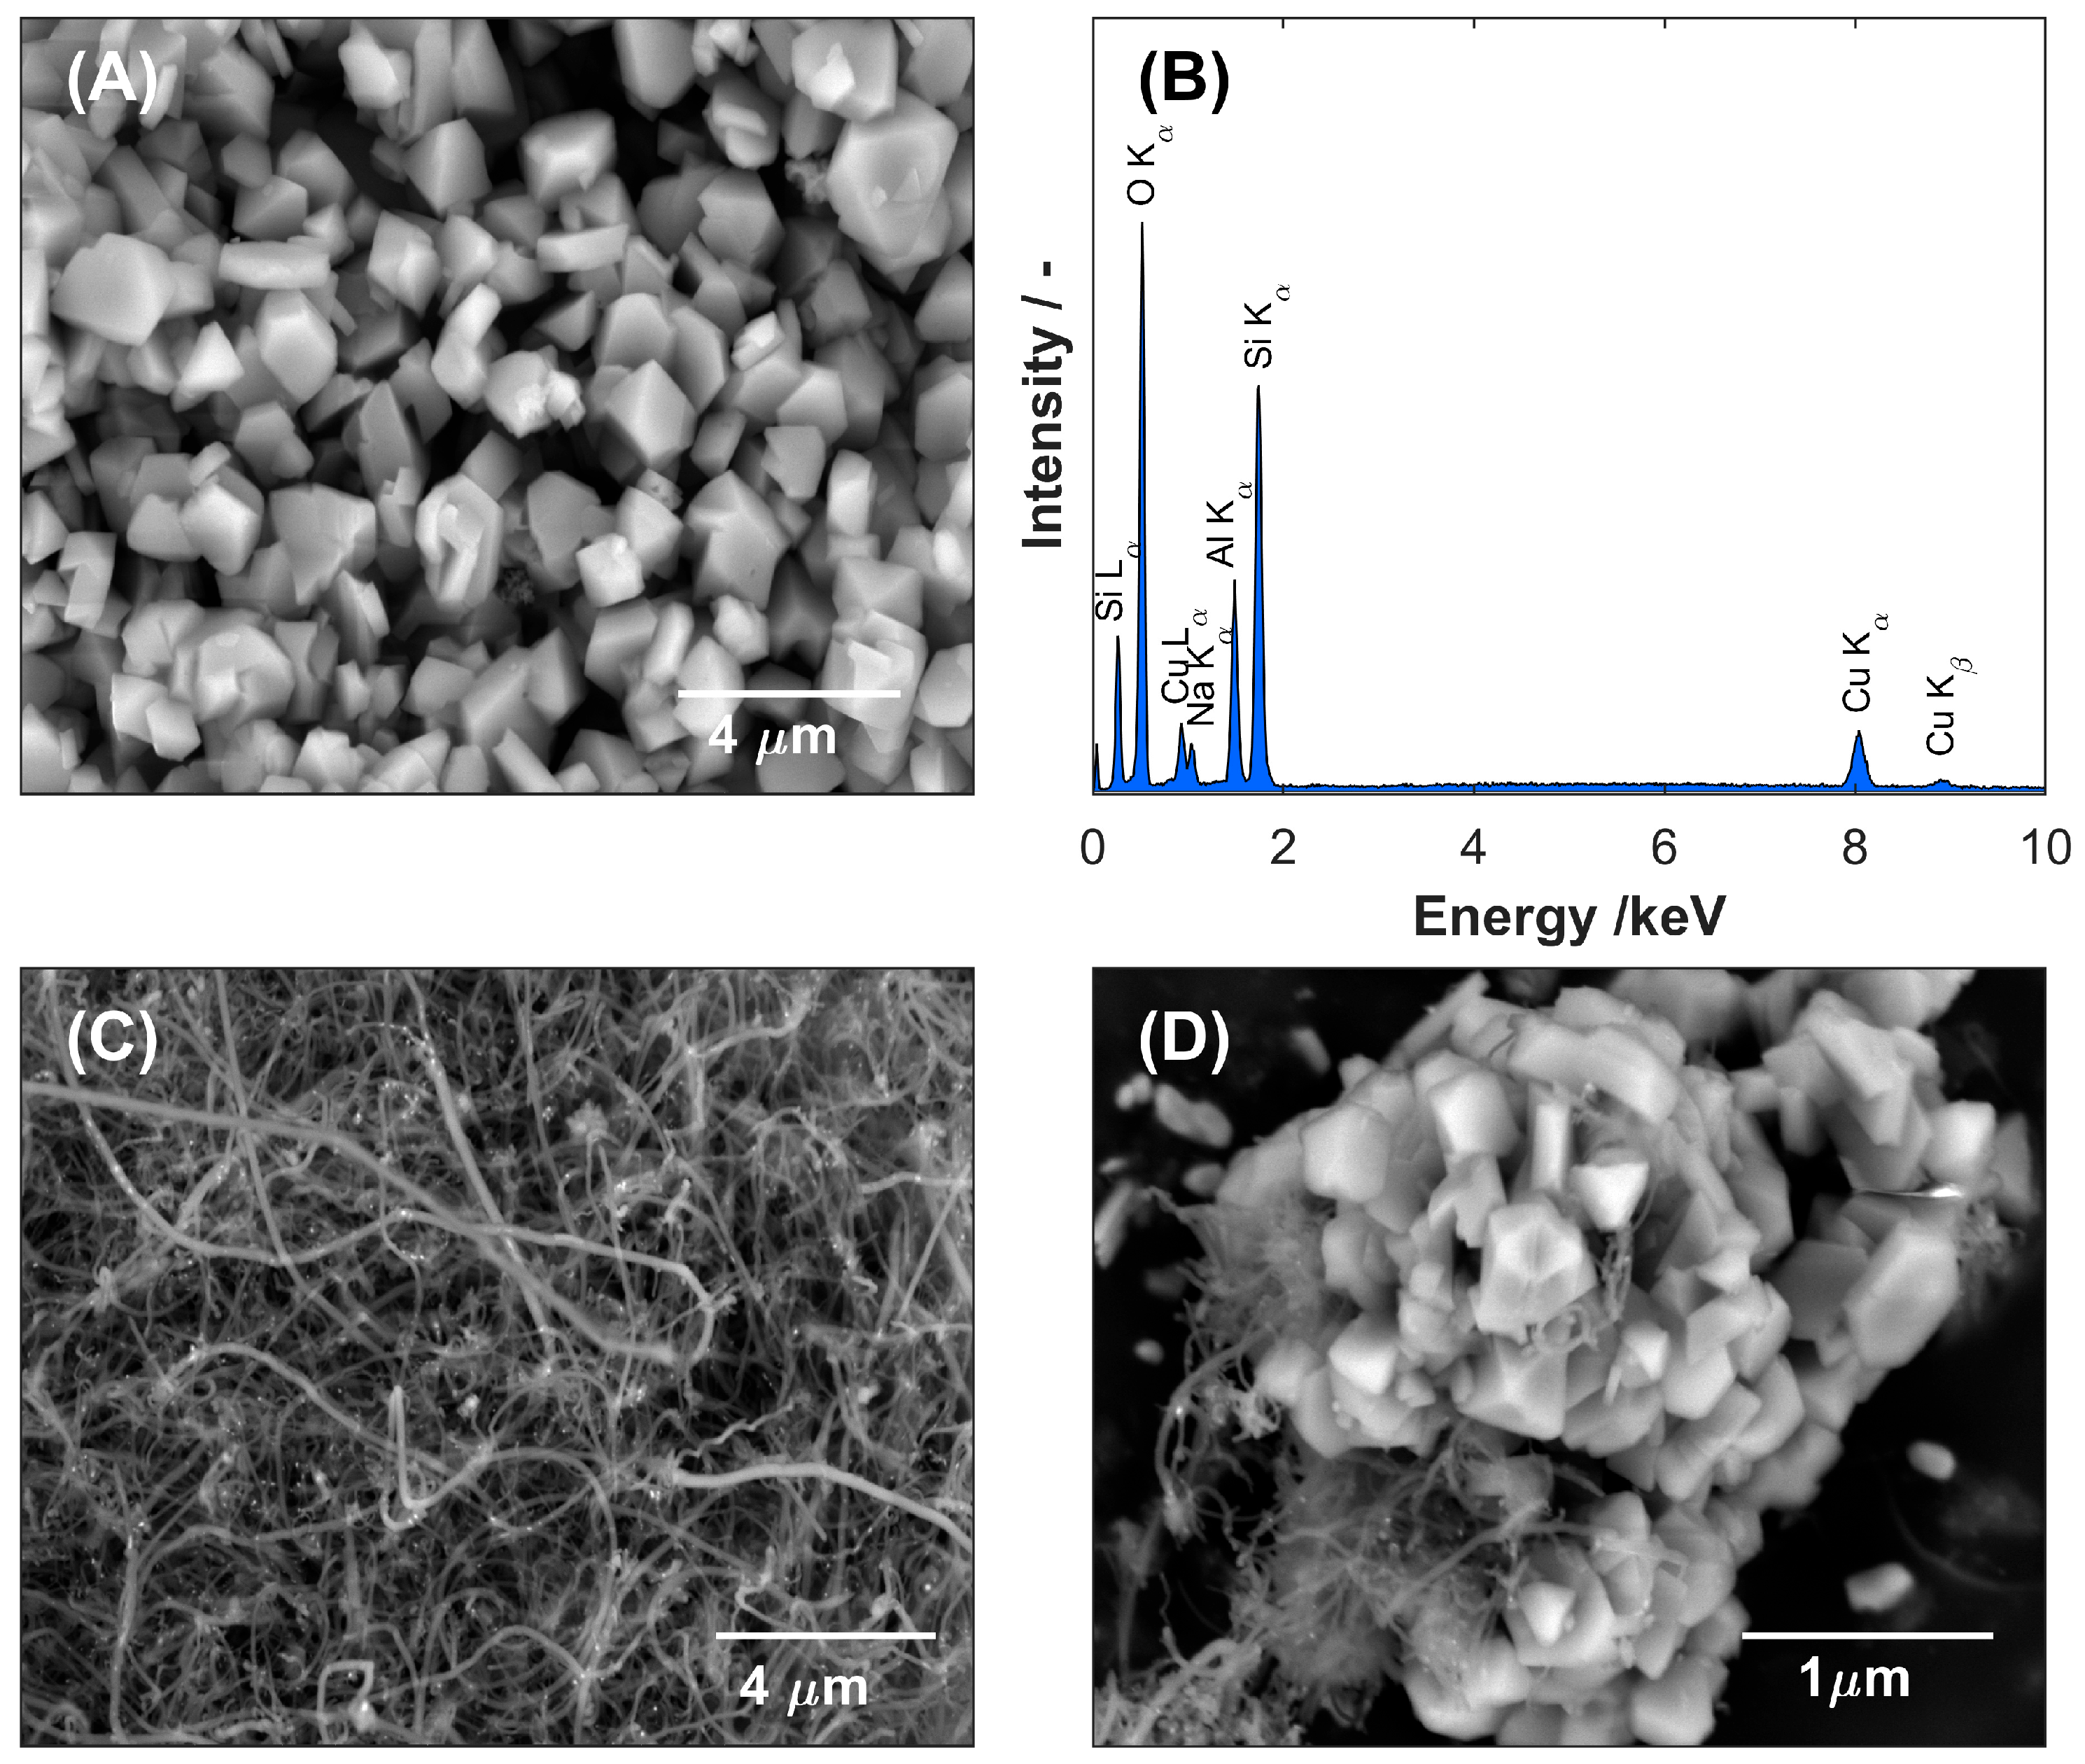
The SEM image of zeolite Y (
Figure 1A) shows densely packed, well-defined crystalline particles with predominantly faceted morphologies. The crystallites show the characteristic polyhedral geometry of faujasite-type zeolites and appear to have a relatively uniform size distribution within the sub-micrometer range. Individual particles form a compact and continuous modification layer that fully covers the GCE substrate and confirms successful immobilization of the zeolite coating. At the same time, the EDS analysis of zeolite Y performed before and after the ion-exchange process confirmed the effective substitution of sodium cations with copper ions. This replacement was evidenced by the marked reduction in the intensity of the Na peak with the simultaneous appearance of characteristic Cu peaks (Lα and Cu Kα/Kβ) in the EDS spectrum of Cu-ZY (
Figure 1B). The copper content in the ZY structure was quantified by averaging the atomic concentrations obtained from multiple surface points, resulting in a value of 7.6% at. The SEM observation of the MWCNTs-modified layer (
Figure 1C) reveals a dense, interconnected network of entangled nanotubes uniformly coating the surface of GCE. The nanotubes display high aspect ratios, smooth surfaces, and multiple concentric walls, characteristic of multi-walled structures. In addition, minor bundling of nanotubes can be observed, likely as a result of van der Waals interactions, which contributes to the mechanical stability of the modified layer while maintaining its overall high conductivity and electrochemical activity. Finally, in the morphology of the Cu-ZY/MWCNTs modifying layer (
Figure 1D) within the entangled network of nanotubes, Cu-ZY zeolite particles are distinctly observed as dispersed granular clusters, adhered to, and partially embedded within the nanotube matrix.
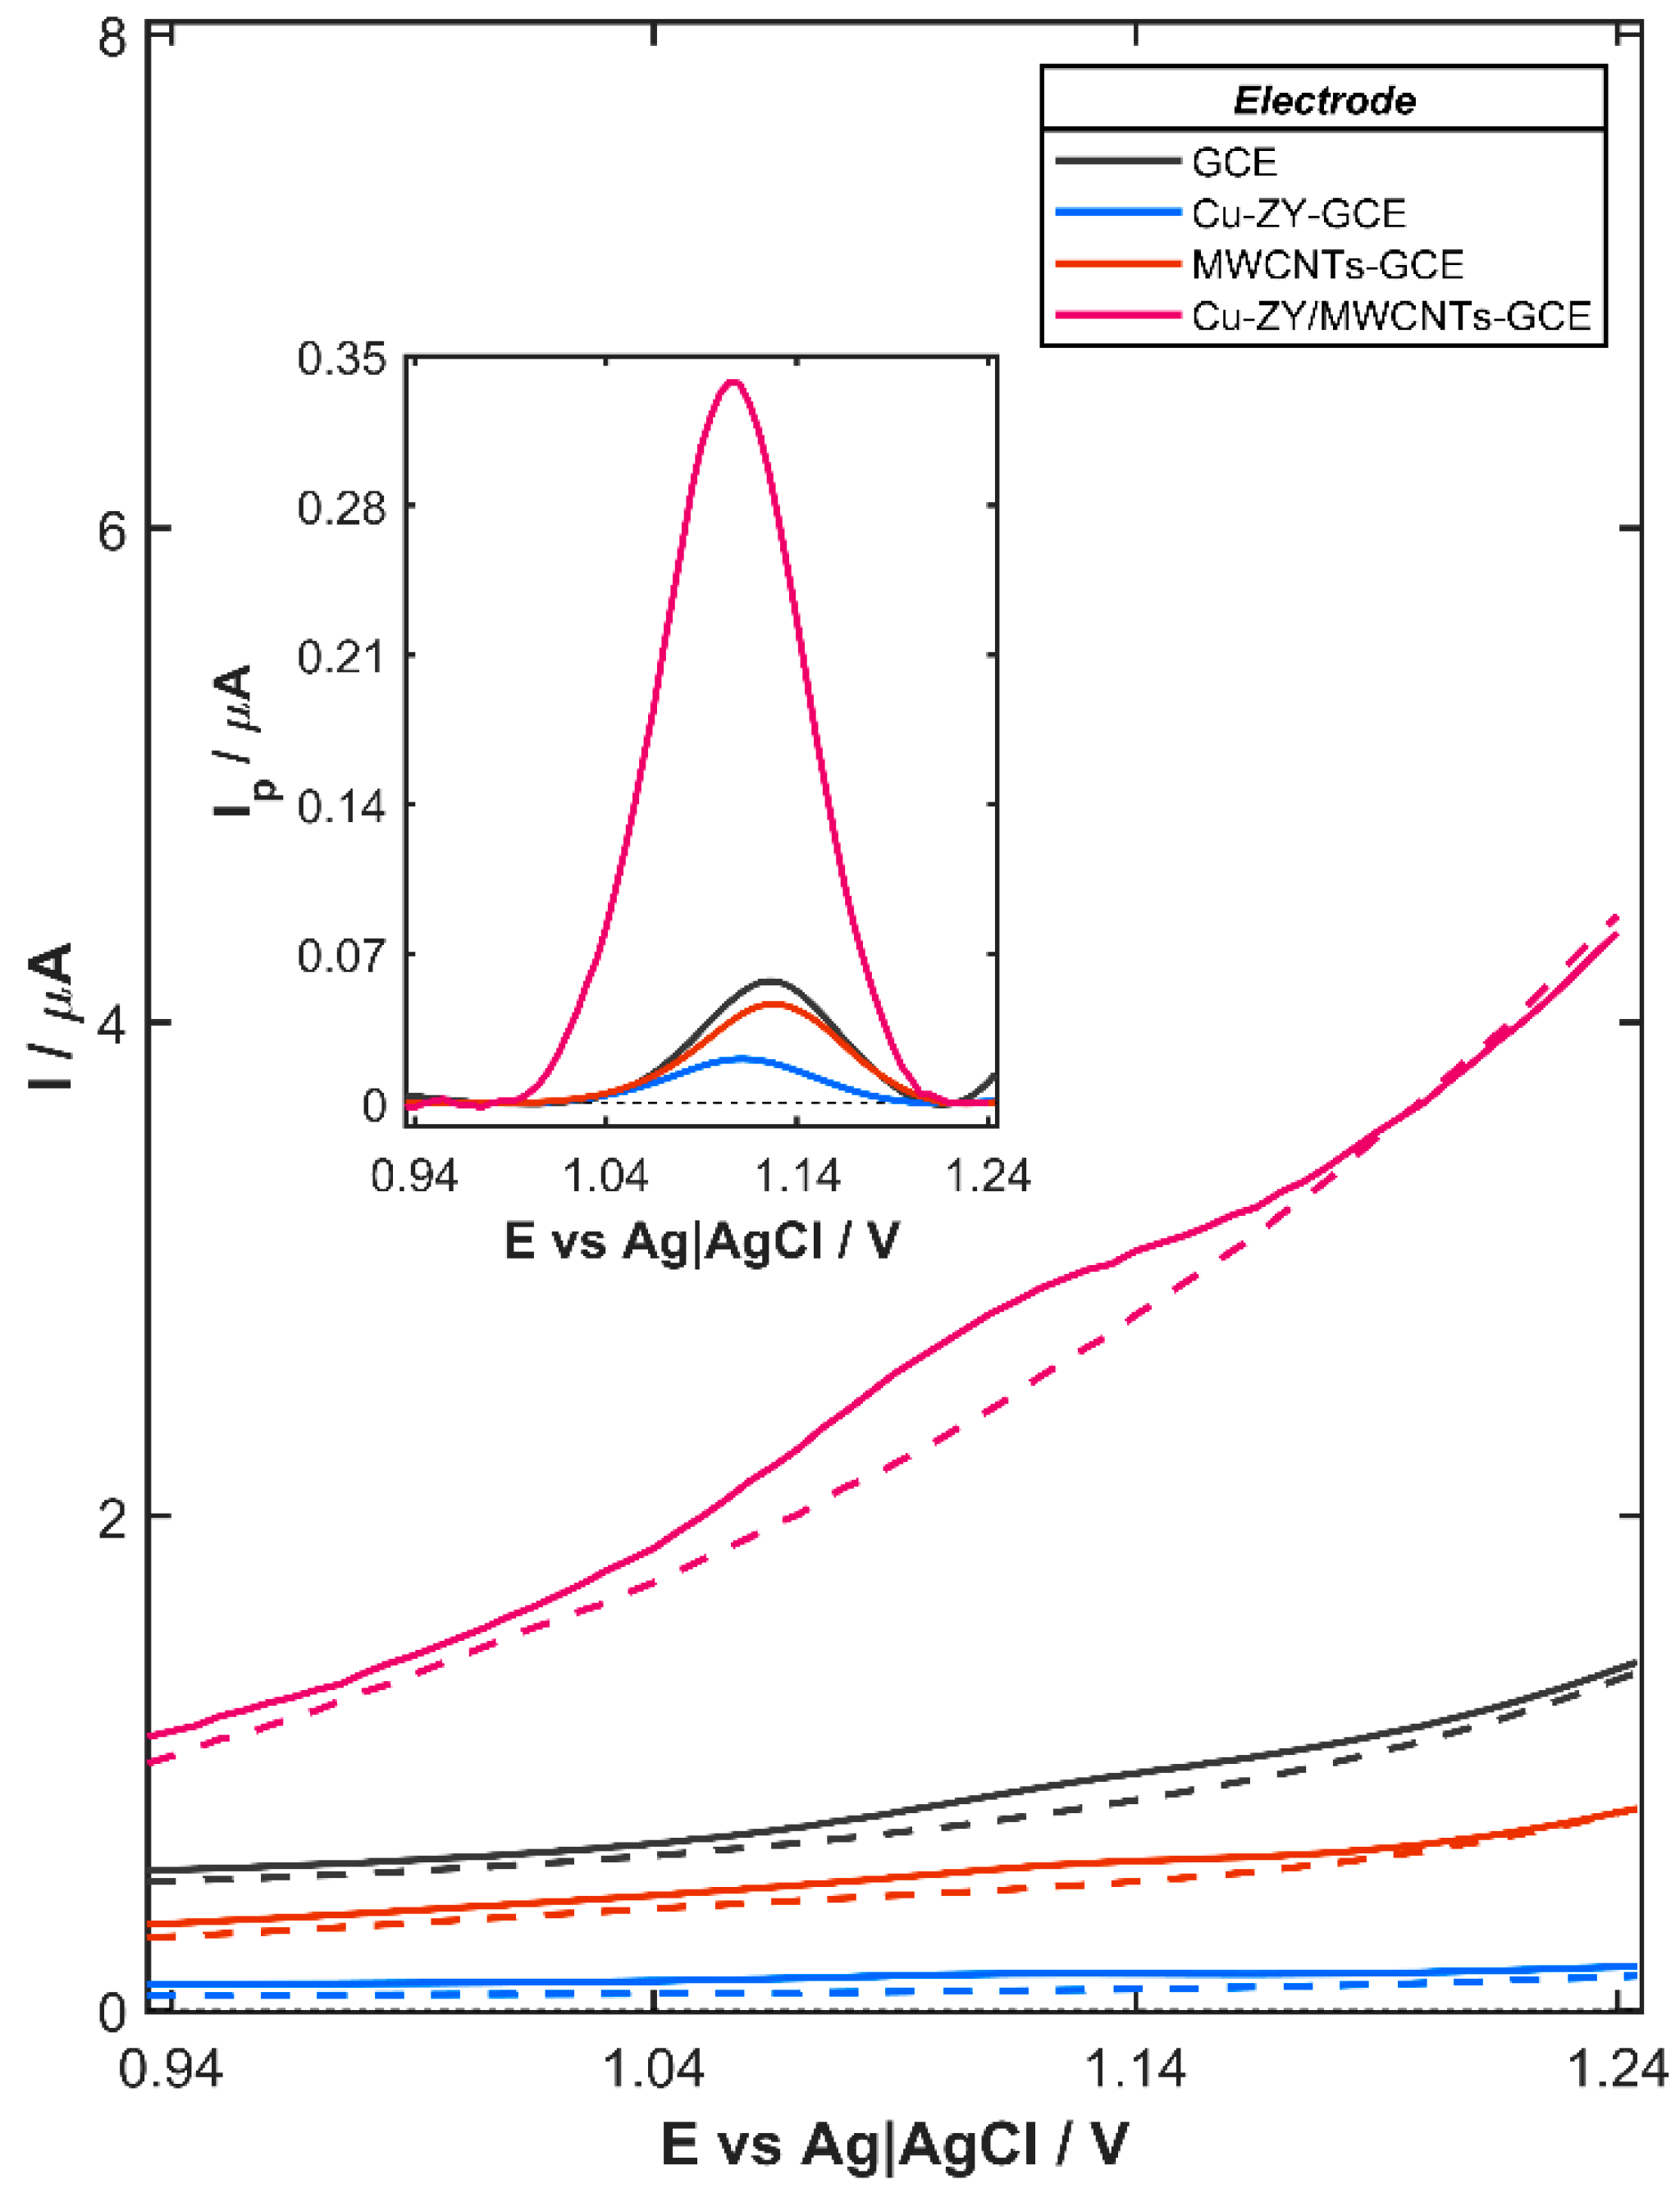
Synergistic integration of the complementary properties of Cu-ZY and MWCNTs results in a significantly improved electrochemical performance of the Cu-ZY/MWCNTs-modified GCE toward agomelatine oxidation, as demonstrated by the DPV response recorded in the presence of 80 µg L
−1 AGO in 0.04 mol L
−1 BRB solution (pH 3.0). As shown in
Figure 2, the bare GCE, which serves as the substrate for the modifying layer, exhibited a discernible AGO oxidation signal, which becomes more pronounced after background subtraction (inset in
Figure 2). A similar behavior is observed for GCE modified with the layer containing only Cu-ZY (Cu-ZY-GCE) or MWCNTs (MWCNTs-GCE), indicating that neither component alone is sufficient to significantly enhance the electrochemical signal. The relatively low response observed for the Cu-ZY-GCE (0.021 µA) is attributed to the intrinsic properties of the zeolites. Although Cu-ZY provides catalytic sites, its overall electrical conductivity is limited due to the insulating nature of the aluminosilicate framework. As a result, electron transfer between the electrode surface and agomelatine molecules is inefficient, leading to a weak oxidation signal. On the contrary, while MWCNTs offer high electrical conductivity, the electrochemical response of MWCNTs-GCE also remains relatively low and is equal to 0.046 µA. This behavior can be associated with the absence of specific catalytic or adsorption sites for the analyte, which limits interaction between the AGO molecules and the electrode surface, thereby diminishing the efficiency of the oxidation process. The combination of Cu-ZY and MWCNTs overcomes these individual limitations, producing a synergistic effect that significantly improves electron transfer and interaction with AGO. Consequently, the oxidation signal on Cu-ZY/MWCNTs-GCE (0.338 µA) is greatly enhanced, reaching values nearly 12- and 6-times higher than those recorded on Cu-ZY-GCE and MWCNTs-GCE, respectively. Furthermore, the catalytic effect of Cu-ZY is clearly demonstrated by the shift in the oxidation peak potential from +1128 mV for the bare GCE to +1105 mV for Cu-ZY/MWCNTs-GCE. This significant reduction in the overpotential indicates facilitated electron transfer due to the lower energy barrier for the oxidation of AGO, which contributes to enhanced sensitivity and selectivity of the sensor.
The enhanced electrochemical response of Cu-ZY/MWCNTs-GCE can be further explained by the specific interactions between AGO molecules and Cu ions presented within the zeolite framework, which act as Lewis acid sites capable of transferring electrons to adsorbed molecules [
30]. These Cu sites interact with electron-rich functional groups of agomelatine, promoting its adsorption and increasing the local concentration of AGO near the conductive MWCNTs network, thereby enhancing electron transfer during oxidation. Moreover, Cu species in zeolites can undergo changes in oxidation between Cu
2+ and Cu
+ states, enabling them to act as effective catalysts in numerous oxidation reactions [
31]. The coordinated Cu centers may also directly participate in the electrocatalytic oxidation of AGO by transiently accepting electrons from the molecule, lowering the overpotential for the oxidation process. Such a dual role of Cu ions, enhanced adsorption via Lewis acid-base interactions and catalytic promotion of electron transfer [
32], provides a possible explanation for the observed synergistic enhancement, complementing the high conductivity and electron transport offered by MWCNTs
3.2. Optimization of the Experimental Conditions
The high sensitivity, low detection limit, excellent peak resolution, and reproducible measurement of small current changes associated with analyte redox reactions make differential pulse voltammetry (DPV) particularly advantageous for the quantitative determination of agomelatine. To ensure the most suitable experimental conditions for the determination of AGO, the pH of the supporting electrolyte and key instrumental parameters of the DPV technique were systematically optimized using a univariate approach. Peak current measurements for 80 µg L−1 AGO were repeated three times at each value of the varying parameter, and the associated standard deviation was evaluated. Based on the shape, symmetry, and height of the recorded signal, the most appropriate value of pH of the BRB solution and step potential (Es), pulse amplitude (dE), pulse time (tacc), and accumulation time (tacc) was chosen.
3.2.1. pH Value of Supporting Electrolyte
The influence of the pH of 0.04 mol L−1 Britton-Robinson buffer solution on the electrochemical response of agomelatine (80 µg L−1), including peak potential and peak current, was investigated over the pH range of 2.0 to 4.0. The results indicate that within this pH range, both the peak current and peak potential of AGO remained essentially unchanged. This behavior is consistent with the very high pKa reported for agomelatine (~15.96) for the relevant acidic functional group, indicating that the molecule remains fully protonated within this acidic range. As the electroactive species does not undergo changes in protonation between pH 2 and pH 4, no significant variation in either peak potential or peak current is observed. These results suggest that within this pH region, the redox process of agomelatine is independent of proton concentration and proceeds without proton-coupled electron transfer. The electroactive form of agomelatine remains stable and dominant under these conditions, implying that the electrode reaction on the Cu-ZY/MWCNTs-GCE is governed primarily by electron transfer.
Among the media tested, the BRB solution at pH 3.0 provided the most stable and intense voltammetric response. At this pH, AGO remains predominantly protonated, which enhances its electrostatic attraction to the negatively charged surface of the modified electrode and promotes more efficient pre-concentration of the analyte. Moreover, acidic conditions stabilize the redox-active Cu species in the Cu-ZY catalyst and facilitate proton-coupled electron-transfer steps [
33] that govern the electrocatalytic oxidation of AGO. At higher pH values, both the protonation state of AGO and the stability of the Cu active sites are less favorable, resulting in decreased oxidation currents. Accordingly, the choice of pH 3.0 as the supporting electrolyte represents an optimal compromise, providing both maximal signal intensity and reproducibility, while maintaining the chemical and electrochemical stability of the analyte and the electrode surface.
3.2.2. Optimization of DPV Instrumental Parameters
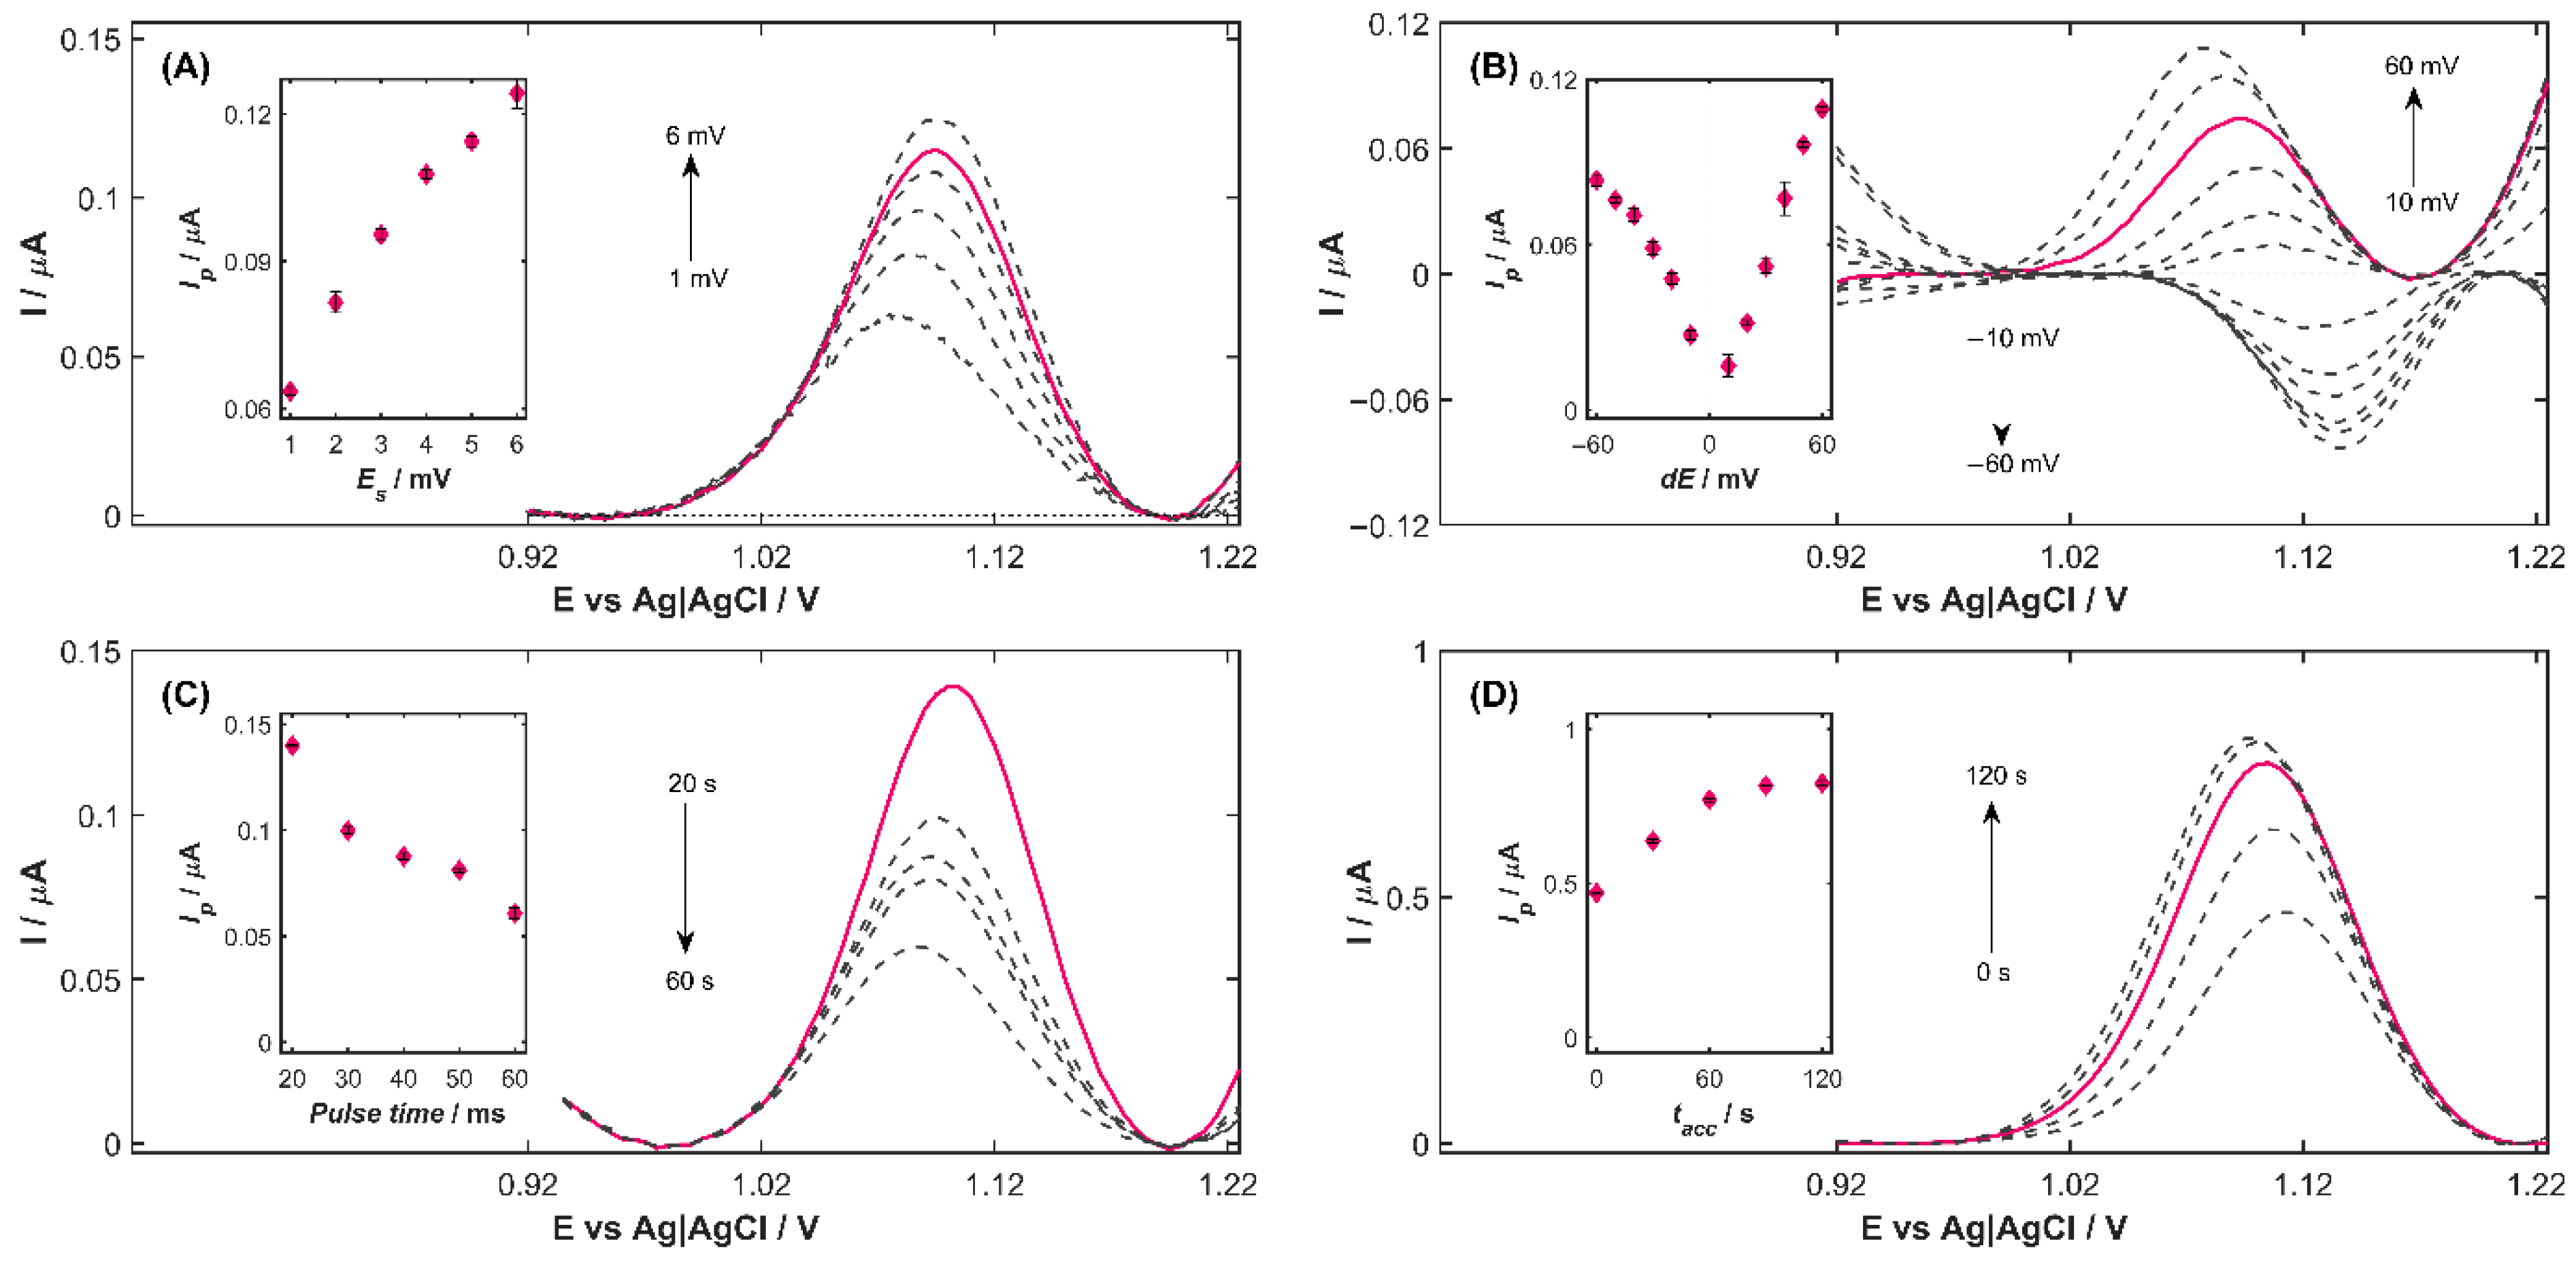
To select the most appropriate potential step (
Es), DPV curves were recorded at step values ranging from 1 to 6 mV (
Figure 3A) while maintaining a pulse time of 40 ms and a pulse amplitude of 40 mV under the previously established measurement conditions. The results demonstrate that increasing the step potential value leads to a pronounced enhancement of the peak current. Specifically, raising
Es from 1 to 6 mV produced an increase in peak current from 0.0635 to 0.1242 μA, corresponding to a 95.5% improvement of the agomelatine oxidation signal. The dependence of the peak current
Ip (after background subtraction) on the step potential height (inset in
Figure 3A) initially exhibits a linear relationship. As
Es increases further, the increments in the peak current become progressively smaller, and the
Ip (
Es) function begins to level off. At the same time, a noticeable broadening of the half-peak width is observed at higher
Es values. From these observations,
Es = 5 mV (pink line in
Figure 3A) was identified as the optimal step potential for agomelatine determination using the Cu-ZY/MWCNTs-GCE, providing a well-defined, reproducible peak without significant loss of signal intensity, and was applied in subsequent experiments.
For pulse amplitude (
dE) optimization,
dE values ranging from 10 to 60 mV in both positive and negative modes were tested using the previously selected
Es. As shown in
Figure 3B, the oxidation peak potential of AGO shifted toward more negative potentials with positive pulse amplitudes, whereas negative pulse amplitudes induced a shift in the peak potential toward more positive values. Simultaneously, higher pulse amplitude values lead to less reproducible measurement results. The dependence of the peak current on the pulse amplitude (inset in
Figure 3B) indicated that
Ip of AGO increased with the absolute value of
dE in both negative and positive modes. However, at equivalent magnitudes, positive pulse amplitudes consistently produced higher peak currents than negative ones, indicating better sensitivity and signal reproducibility in the positive mode. Taking into account the aforementioned factors, the value of
dE = +40 mV (pink line in
Figure 3B) was considered optimal for the determination of AGO.
Pulse time (
timp), defined as the sum of waiting time (
tw) and current sampling time (
tp), was selected based on the DPV curves (
Figure 3C) recorded for five
timp values (20, 30, 40, 50, and 60 ms) using the previously selected step potential of 5 mV and a pulse amplitude of 40 mV. The main purpose of using the waiting time is to reduce the background current (
Ib), whose primary component is the capacitive current. It can be noted that increasing the pulse time resulted in lower peak current values, as reflected in the decreasing trend of the peak current versus pulse time relationship (inset in
Figure 3C). Considering both the peak current height and the repeatability of the measurements, the optimal
timp was found to be 20 ms, corresponding to 10 ms of waiting time and 10 ms of current sampling time. This value was used in all subsequent measurements.
The accumulation time (
tacc) plays a critical role in the enhancement of the analytical signal in voltammetric measurements by allowing the analyte to pre-concentrate on the electrode surface. To establish the optimal
tacc for agomelatine determination, the current response of Cu-ZY/MWCNTSs-GCE was recorded in the presence of 80 µg L
−1 AGO over an accumulation time range of 0–120 s, using the previously optimized parameters:
Es = 5 mV,
dE = 40 mV,
tw = 10 ms, and
ts = 10 ms (
Figure 3D). As indicated by the results, increasing
tacc from 0 to 60 s led to a proportional increase in the peak current (inset in
Figure 3D), reflecting enhanced AGO accumulation and more efficient electron transfer at the surface of Cu-ZY/MWCNTs-GCE. For
tacc = 60 s, the analytical signal was 64% higher compared to measurements performed without the preconcentration step (
tacc = 0 s). Extending the accumulation time beyond 60 s results in a negligible signal enhancement, with the AGO peak height reaching a gradual stabilization, suggesting that the electrode surface becomes nearly saturated with AGO. Therefore,
tacc = 60 s was chosen as the optimal accumulation time, since it ensures a considerable increase in peak current while maintaining a reasonable analysis duration. This condition provides the best balance between sensitivity improvement and practical efficiency for the voltammetric determination of AGO.
3.3. Analytical Performance
Under optimized conditions, the analytical performance of Cu-ZY/MWCNTs-GCE in 0.04 mol L
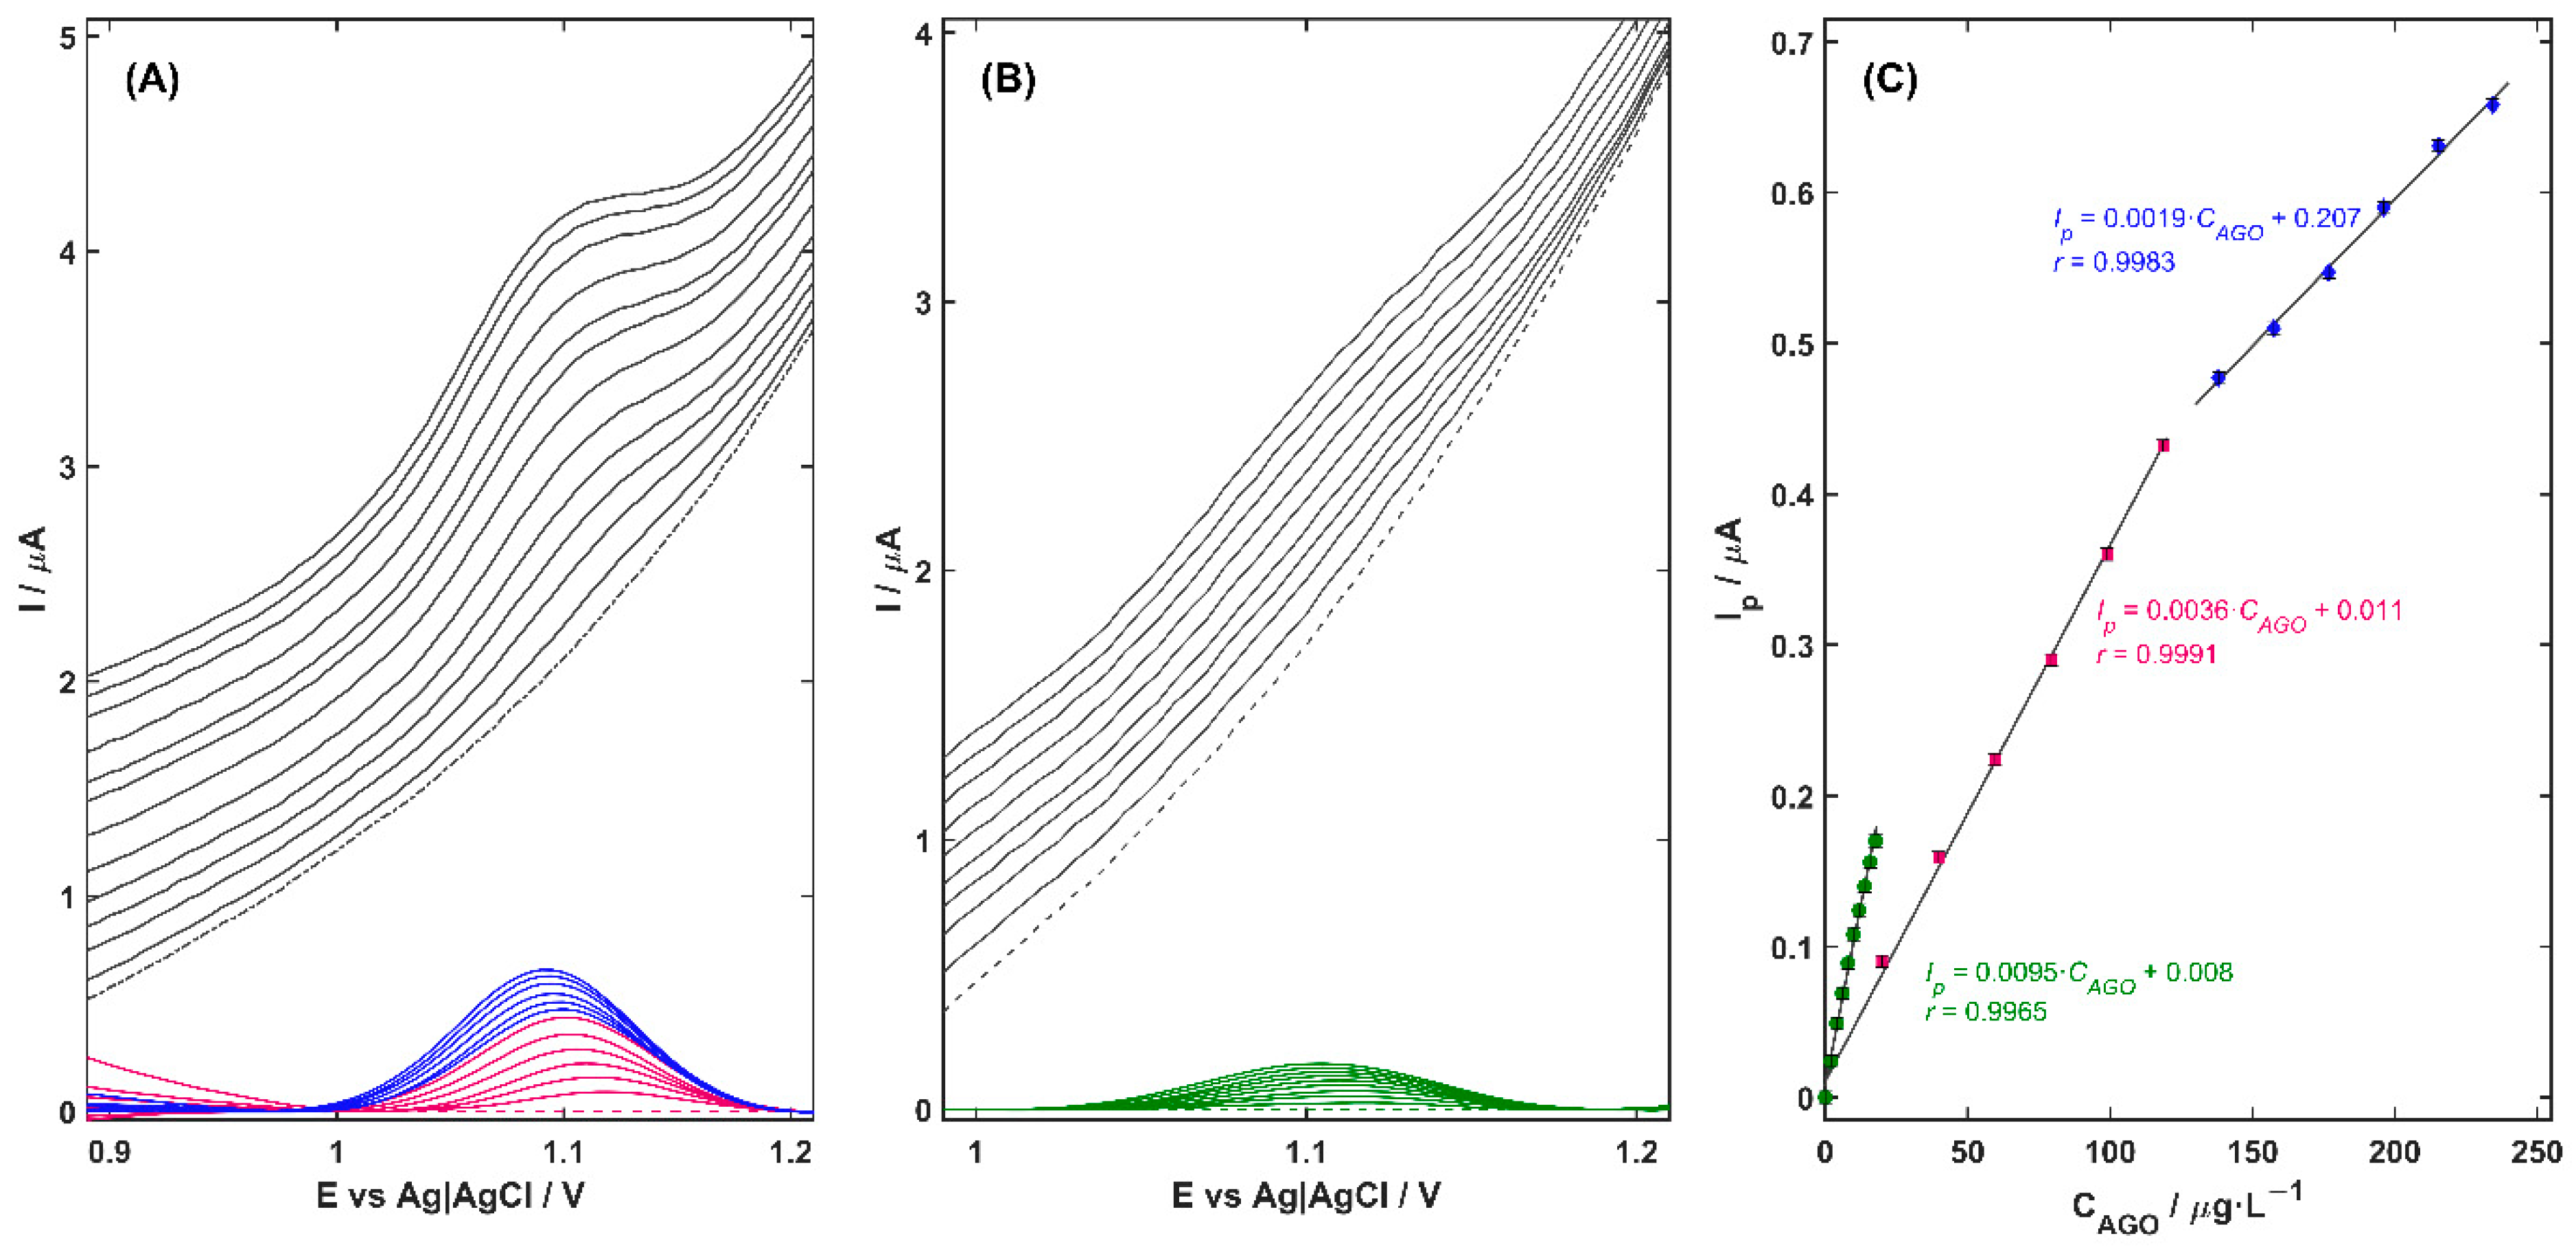
−1 BRB solution (pH 3.0) for the quantification of AGO was investigated over a series of increasing analyte concentrations using the DPV technique, under two modes of operation: direct detection and detection following preconcentration on the electrode surface (
Figure 4A,B, respectively). Background-corrected voltammograms, shown as colored curves in
Figure 4, were obtained by subtracting the signal recorded in the blank electrolyte (dashed line). From these, linear calibration plots of peak current versus AGO concentration were constructed (
Figure 4C), and the resulting analytical parameters, including sensitivity, linear range (
LR), limit of detection (
LOD), and limit of quantification (
LOQ), are summarized in
Table 2. The
LOD and
LOQ values were calculated using the standard formulas:
LOD = 3.3·
SD/
b and
LOQ = 10·
SD/
b, where
SD is the standard deviation of the
y-intercepts of the regression line, and
b is the slope of the calibration curve.
As can be noted, the Cu-ZY/MWCNTs-GCE exhibits a pronounced linear correlation between the oxidation peak current and AGO concentration throughout all tested concentration ranges. In the absence of a preconcentration step (
tacc = 0 s,
Figure 4A), the AGO peak current increased linearly over two concentration ranges—the first from 20.0 to 118.6 µg L
−1 (pink curves) and the second from 138.1 to 234 µg L
−1 (blue curves) with a correlation coefficient (
r) of 0.9991 and 0.9983, respectively. Extending the preconcentration time to 60 s (
Figure 4B) had a significant impact on the analytical performance of the Cu-ZY/MWCNTs-GCE sensor. A nearly threefold increase in sensor sensitivity was obtained, as reflected by the calibration slope that increased from 0.0036 to 0.0095 µA L µg
−1. This improvement was accompanied by a significant reduction in both the detection and quantification limits, which reached the value of 4.3·10
−9 mol L
−1 and 1.3·10
−8 mol L
−1, respectively (
Table 2). These findings indicate that the introduction of a preconcentration step during the measurements enables the detection of even trace-level changes in analyte concentration. The increased accumulation of the analyte at the electrode surface enhances the signal-to-noise ratio, facilitating clear differentiation of the target analyte from potential interfering species. This improvement not only enhances the reliability, accuracy, precision, and reproducibility of the measurement but also extends the applicability of the Cu-ZY/MWCNTs-GCE to real-world samples containing low AGO concentrations.
To date, only a limited number of studies have reported the use of voltammetric approaches for the electrochemical determination of agomelatine employing various modified electrodes (
Table 3). In comparison, the Cu-ZY/MWCNTs-GCE demonstrates analytical performance that is not only comparable to but, in several key aspects, superior to previously reported sensors. Notably, the sensor exhibits exceptionally broad linear dynamic ranges, enabling accurate and reliable quantification of agomelatine from low nanomolar to submicromolar concentrations without the need for electrode reconditioning. This wide working range minimizes procedural complexity and enhances the reproducibility of measurements. Moreover, the Cu-ZY/MWCNTs-GCE demonstrates remarkable versatility, with successful application across multiple real matrices, including pharmaceutical tablets, urine, human plasma, and wastewater, underscoring its strong potential for both clinical and environmental monitoring of agomelatine.
Beyond its favorable analytical performance, the Cu-ZY/MWCNTs-GCE offers important practical advantages over previously reported sensing platforms. The modified electrode is fabricated through a simple, rapid, and cost-effective drop-casting procedure that does not require sophisticated equipment, expensive chemicals, or a multistep synthesis procedure. Importantly, the modified electrode is immediately ready for measurement after solvent evaporation, with no requirement for additional electrochemical activation. These features highlight the operational convenience, economic benefits, and robustness of the proposed Cu-ZY/MWCNTs-GCE, supporting its suitability for routine electrochemical determination of agomelatine across a diverse array of sample types.
3.4. Stability, Reproducibility and Selectivity of Cu-ZY/MWCNTs-GCE
The synergistic combination of the unique features of Cu-ZY and MWCNTs leads to the development of the AGO sensing platform, which exhibits excellent selectivity, stability, and reproducibility. The short-term stability and repeatability of Cu-ZY/MWCNTs-GCE were confirmed by relative standard deviation (
RSD) values of 1.9% and 2.7% obtained for four consecutive voltammograms recorded in 0.04 mol L
−1 BRB solution (pH 3.0) at AGO concentrations of 140 µg L
−1 and 10 µg L
−1, respectively. After storage under laboratory conditions for 7, 14, and 21 days, the peak current for both AGO concentrations changes by less than 16.5%, demonstrating the excellent long-term stability of the sensor. The reproducibility of the sensor was further evaluated using ten independently prepared electrodes (
Section 2.3.2), for which the
RSD of 9% for the analytical signal confirmed the consistent voltammetric response and reliability of the Cu-ZY/MWCNTs-GCE fabrication procedure.
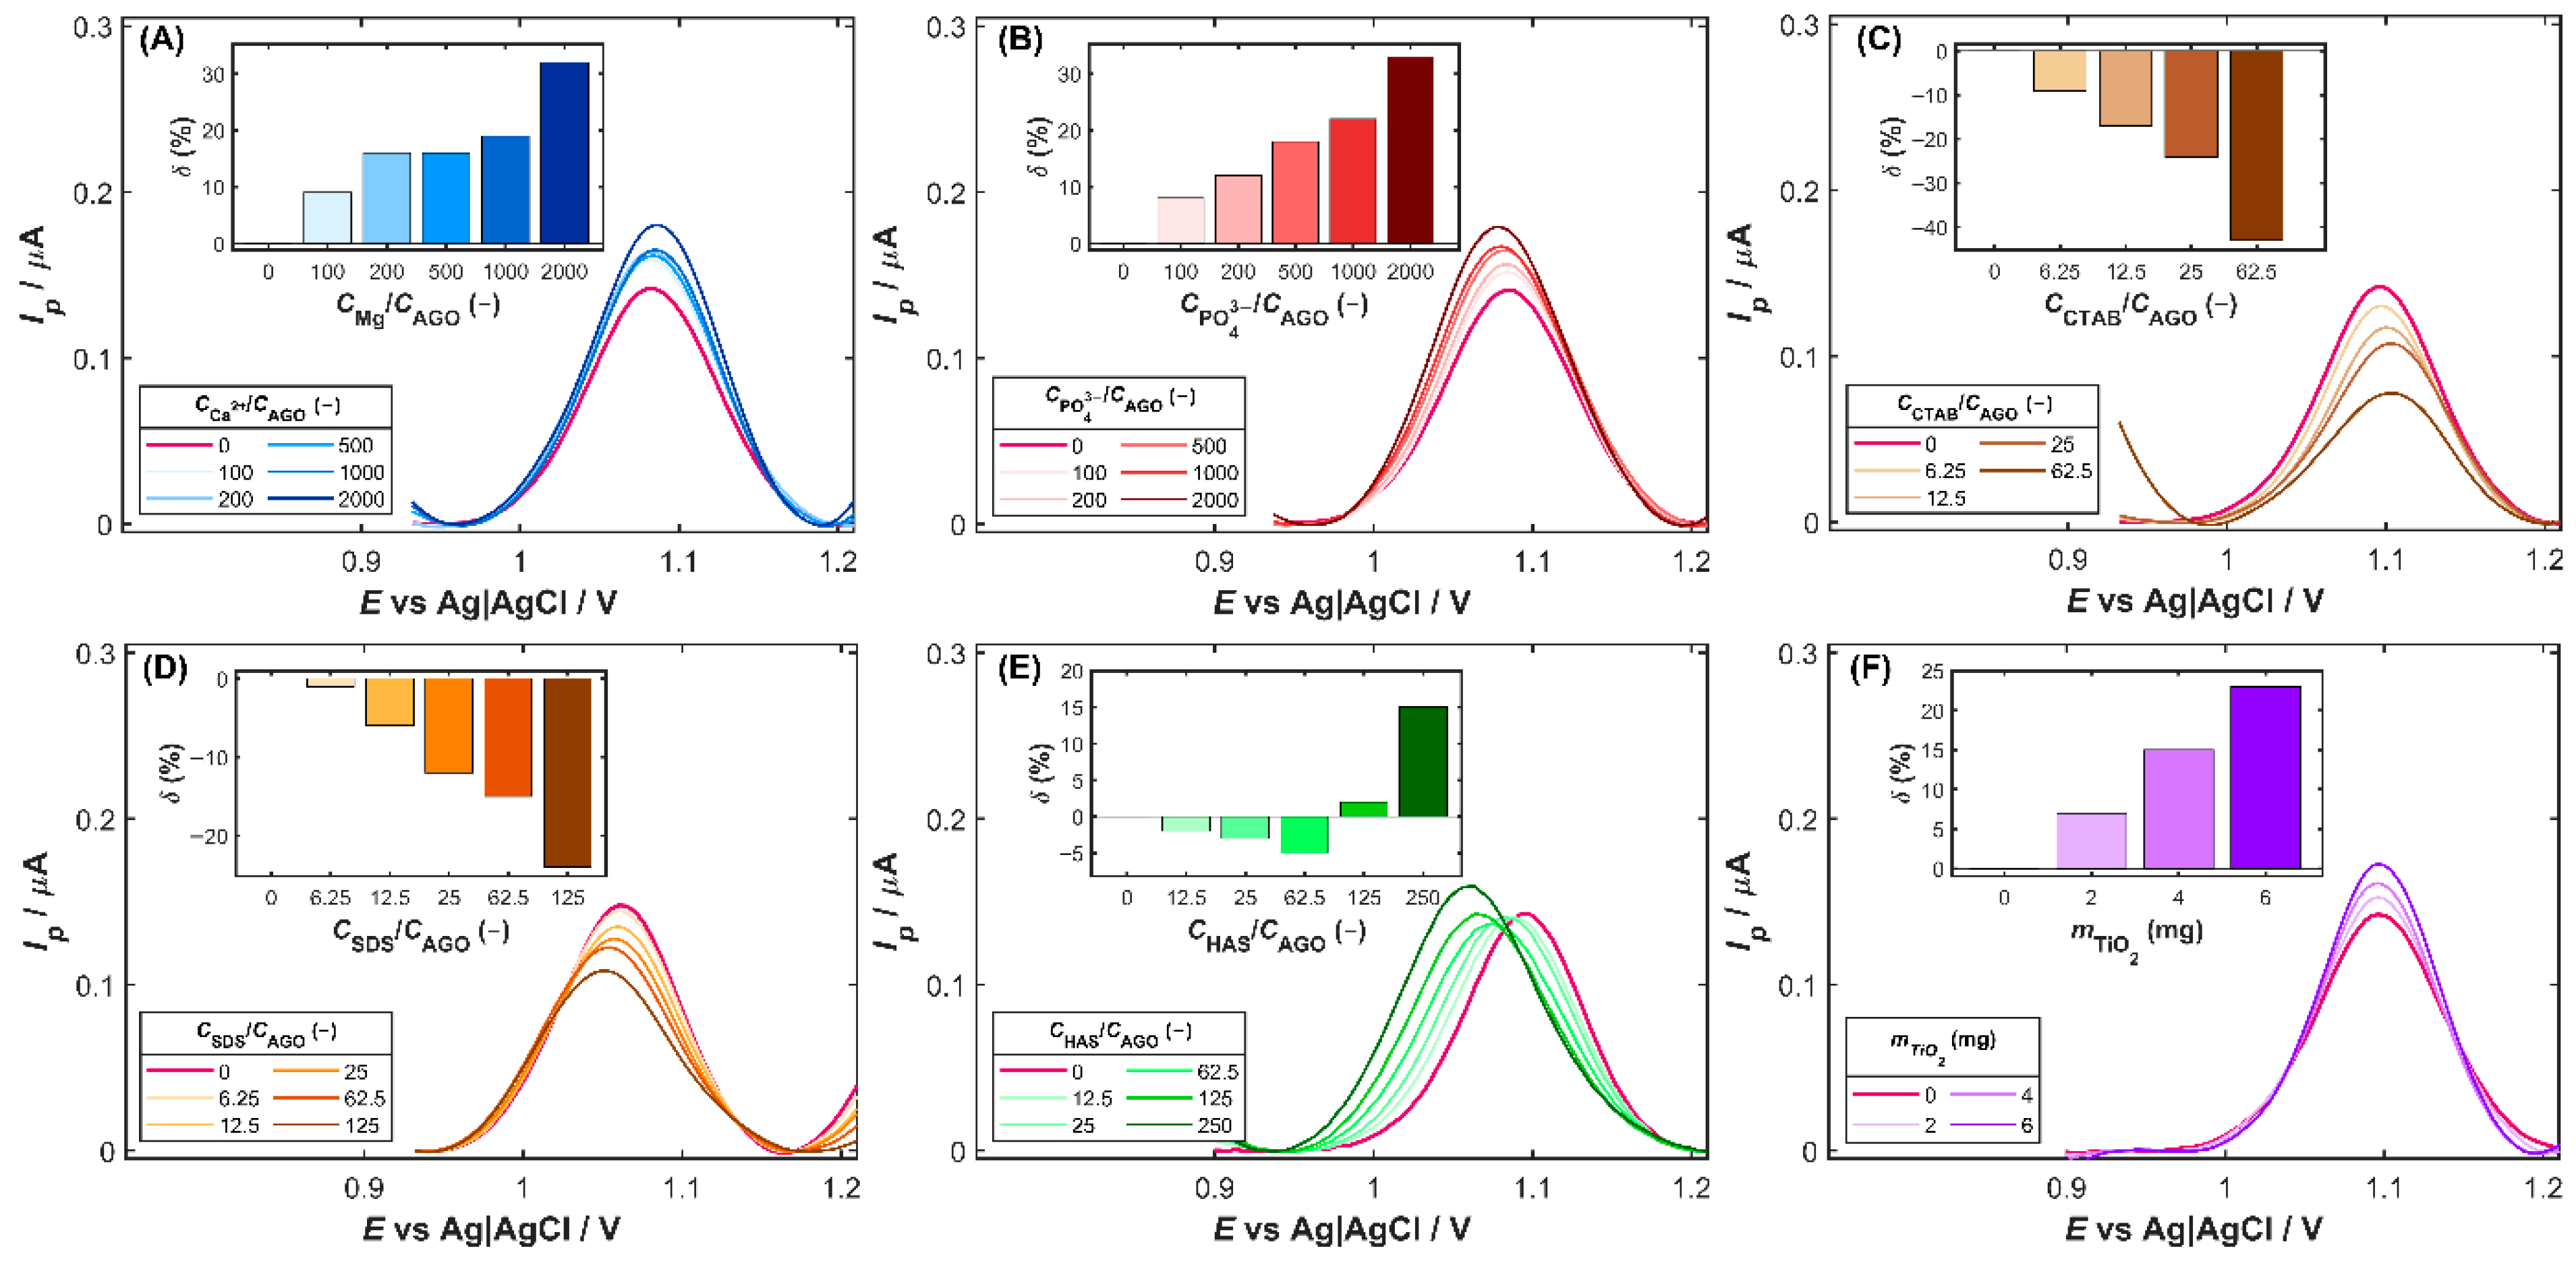
Selectivity studies were carried out to evaluate the sensor’s ability to distinguish the target analyte from potentially interfering substances. The electrode response was tested in the presence of common coexisting species, including pharmaceutical excipients, typical biomolecules, and surface-active compounds. Consequently, DPV measurements were performed for 80 µg L−1 of AGO solution in the presence of a 10–2000-fold excess of inorganic ions (K+, Na+, Ca2+, Mg2+, Cl−, NO3−, SO42−, PO43−), a 5–125-fold excess of surfactants (SDS, CTAB, and Triton X-100), and a 10–250-fold excess of humic acid (HAS) and uric acid (UA). To assess the influence of common tablet excipients (titanium dioxide, starch, magnesium stearate, and cellulose), individually weighed portions of 2–6 mg were introduced directly into the voltammetric cell containing 80 µg L−1 of AGO. The substance tested was considered to exhibit an interference effect when its presence caused a change in the AGO peak current (δ) exceeding ±10% of its initial value, or when a noticeable distortion of the peak shape and/or a shift in peak potential was observed.
Among inorganic ions, the most pronounced effect on the AGO oxidation signal is exhibited by magnesium and phosphate ions (
Figure 5A and
Figure 5B, respectively). Both ions produced a slight improvement in the anodic peak current with increasing interferent-to-analyte ratios. In the presence of Mg
2+, the oxidation current gradually increased, reaching approximately 130% of the initial value at the highest excess of magnesium. A similar trend was observed for phosphate ions (
Figure 5B), which caused an increase of up to 30% in the initial peak current. The observed current enhancement in the presence of Mg
2+ or PO
43− may be attributed to improved ionic conductivity and stabilization of the electrode/solution interface, possibly facilitating charge transfer during the oxidation process.
Of the surfactants examined, the cationic CTAB and the anionic SDS have distinct effects on the oxidation signal of agomelatine. The presence of CTAB (
Figure 5C) led to a noticeable decrease in the anodic peak current of AGO with increasing surfactant concentration, reducing it to about 57% of the initial value at the highest CTAB level tested. A similar but less intense effect was observed for SDS (
Figure 5D), which decreased the oxidation current to about 67% of the initial value. In both cases, suppression of the oxidation signal is probably associated with the adsorption of surfactant molecules onto the electrode surface, which form interfacial layers that hinder the electron transfer. In the case of CTAB, the positively charged headgroups may interact electrostatically with the electrode surface or the oxidized form of AGO, while the negatively charged SDS molecules can form a compact film that limits analyte access to the electroactive sites. The presence of humic acids (HAS), naturally occurring organic substances in aquatic and terrestrial environments, resulted in a gradual suppression of the AGO oxidation signal at excess levels ranging from 12.5 to 65.5 times the analyte concentration (
Figure 5E). This behavior suggests the formation of a weakly conductive film of adsorbed humic macromolecules that partially hinders charge transfer and diffusion of AGO to the active side on the Cu-ZY/MWCNTs-GCE surface. However, beyond a 125-fold excess of HAS, a pronounced enhancement of the anodic signal occurred, which may be attributed to structural rearrangements and aggregation of humic acids at elevated concentrations, resulting in the pre-concentration of AGO through hydrophobic interactions with humic components. Furthermore, a shift in the AGO oxidation potential towards less positive values in the presence of humic acids was observed, due to weak interactions between AGO and humic macromolecules that facilitate its oxidation [
34]. It should be noted that the influence of surface-active compounds and organic matter is expected to be negligible in typical environmental waters, where their concentrations are at nanomolar levels. Consequently, the voltammetric determination of agomelatine in most environmental matrices is largely unaffected by these substances.
In the case of the excipients commonly present in pharmaceutical formulations, starch, cellulose, and magnesium stearate caused negligible enhancement of the AGO oxidation signal, remaining within the acceptable tolerance range. On the contrary, titanium dioxide induced more pronounced changes in the AGO peak current (
Figure 5F). At the highest amount of TiO
2 tested (6 mg) introduced into the voltammetric cell, the DVP signal increased by approximately 25% relative to its initial value. This effect may arise from the adsorption of AGO molecules on the TiO
2 surface and catalytic or capacitive interactions that enhance electron transfer at the electrode interface. Additionally, the increased surface heterogeneity caused by TiO
2 particles likely facilitates charge transfer, thus strengthening the AGO oxidation signal [
35].
To minimize the impact of matrix components on the voltammetric response of AGO, appropriate sample pretreatment and calibration strategies can be employed. Filtration or centrifugation effectively removes suspended solids and particulate matter, while solid-phase extraction (SPE) allows partial elimination of surfactants and humic macromolecules from the solution. Additionally, the standard addition method can be applied to compensate for residual matrix effects, ensuring reliable quantification under real-sample conditions.
3.5. Analysis of the Real Samples
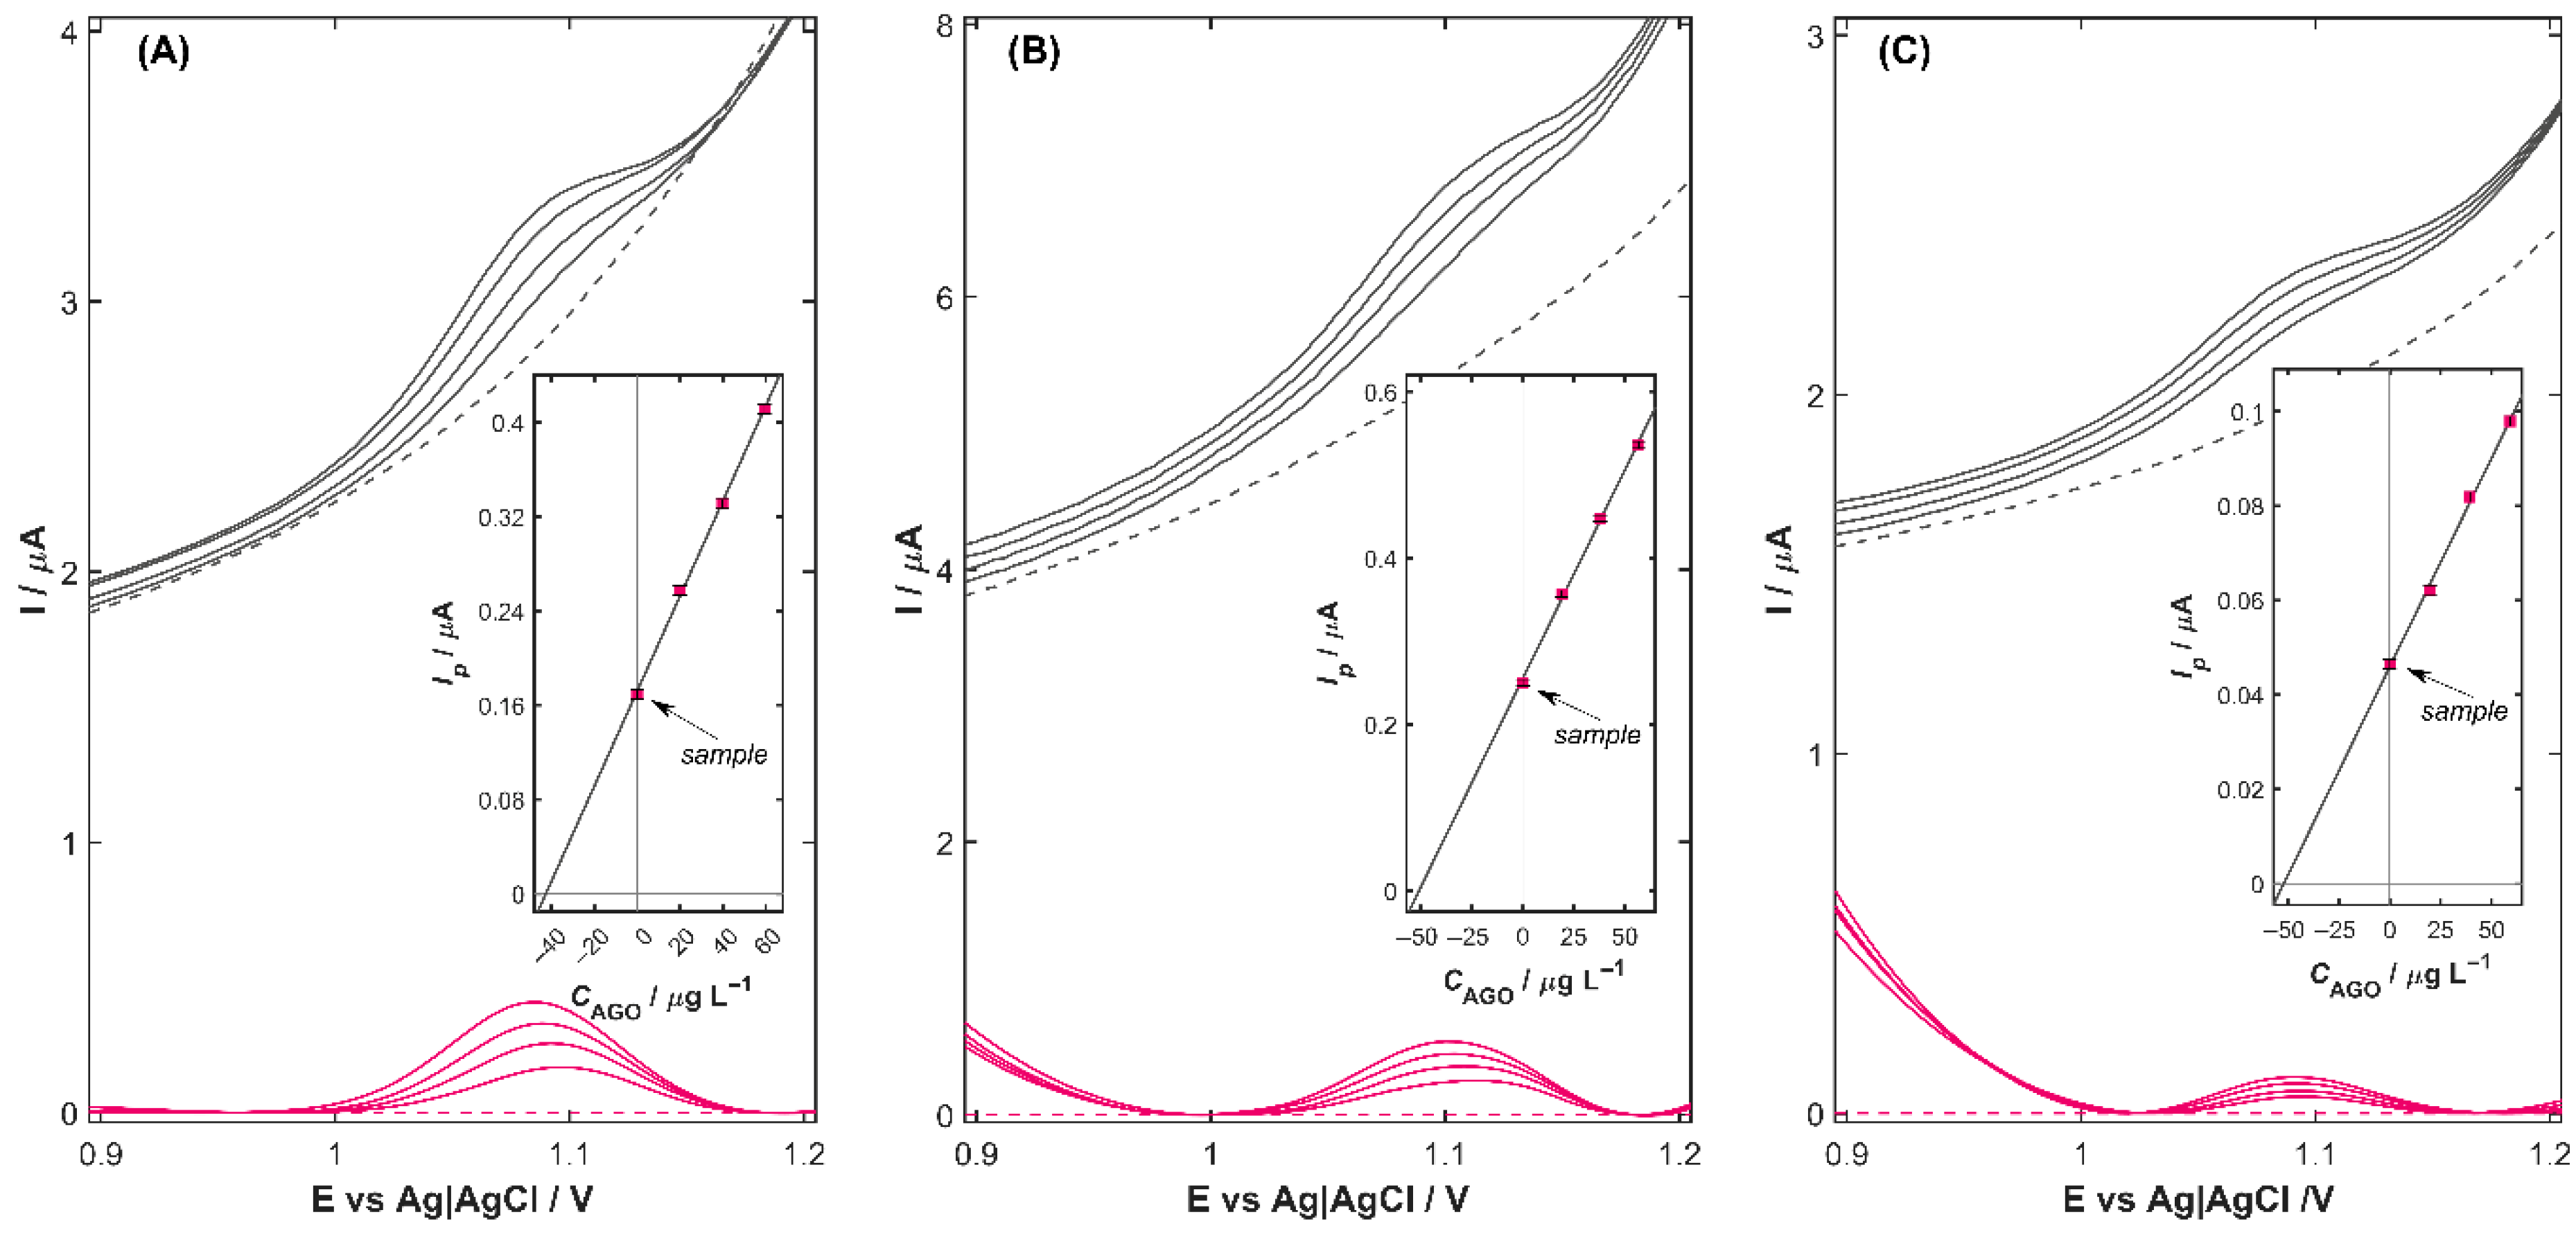
An analysis of real samples using the developed protocol was carried out to assess its practical applicability. The performance of the Cu-ZY/MWCNTs-GCE in complex matrices (
Figure 6) was evaluated by analyzing pharmaceutical tablets, as well as spiked samples of certified reference materials (CRM) of human serum, urine, and wastewater. To minimize matrix effects, the quantification was performed according to the standard addition method (
Section 2.3.3), while the baseline correction step was realized by subtracting the background signal measured in the supporting electrolyte without the analyte (dashed line in
Figure 6), resulting in colored-marked analytical curves. The accuracy of the proposed method was confirmed by calculating the relative error (
RE) for pharmaceutical samples and the recovery values for spiked CRM wastewater and biological fluid samples (
Table 4).
As shown in
Figure 6, all tested samples exhibited well-defined AGO oxidation signals with no interference from matrix constituents, demonstrating the high selectivity and interference-resistant characteristics of Cu-ZY/MWCNTs-GCE. The results obtained for the commercial tablet showed good agreement with the labeled content, with an
RE of 7.2% and an
RSD of 3.0%, indicating that the excipients do not adversely affect the electrochemical response of the proposed sensor. For CRM analysis of wastewater, human serum and urine spiked with AGO, the calculated recoveries ranged from 97.8% to 108.8%, highlighting the robust performance and capacity of the Cu-ZY/MWCNTs-GCE for reliable and accurate detection of trace-level agomelatine within diverse and complex matrices. Overall, the successful quantification of agomelatine in real samples clearly demonstrates the robustness and practical relevance of the developed sensing platform. Its sensitivity, operational simplicity, and compatibility with pharmaceutical, clinical, and environmental samples position Cu-ZY/MWCNTs-GCE as a highly advantageous tool for routine monitoring, trace-level detection, and real-world analytical applications.
