Article

Enhancing Stability of Cu/ZnO Catalysts in the CO2 Hydrogenation to Methanol by the Addition of MoO3 and ReO3 Promoters

by
Jose Soriano Rodríguez
1,
José Manuel López Nieto
1,
Enrique Rodriguez-Castellón
2,
Antonia Infantes
2,
Daviel Gómez
1 and
Patricia Concepción
1,*
1
Instituto de Tecnología Química, Universitat Politècnica de València-Consejo Superior de Investigaciones Científicas (UPV-CSIC), Avenida de los Naranjos s/n, 46022 Valencia, Spain
2
Departamento de Química Inorgánica, Facultad de Ciencias, Cristalografía y Mineralogía, Instituto Interuniversitario de Investigación en Biorrefinerías I3B, Universidad de Málaga, Campus de Teatinos, 29071 Málaga, Spain
*
Author to whom correspondence should be addressed.
Nanomaterials 2025, 15(22), 1730; https://doi.org/10.3390/nano15221730
Submission received: 16 October 2025 / Revised: 5 November 2025 / Accepted: 12 November 2025 / Published: 17 November 2025
(This article belongs to the Special Issue Advanced Understanding of Metal-Based Catalysts)

Abstract

The catalytic hydrogenation of CO2 to methanol represents a promising route for carbon recycling and hydrogen storage. However, the stability of current catalysts remains one of the main technological challenges. In this work, we investigate the promotional effect of MoO3 and ReO3 on Cu/ZnO-based catalysts with metal loadings ranging from 0.06 to 3.5 wt%. Spectroscopic (XPS and in situ Raman) and kinetic studies reveal that the incorporation of ultra-low promoter amounts (0.06 wt%) enhances methanol productivity, whereas higher concentrations lead to partial blocking of the active copper sites. Rhenium promotes the stabilization of Cu+ species, while molybdenum establishes strong Cu-Mo interactions that modify the reducibility and surface composition of the catalyst. Remarkably, long-term stability tests (80 h, 240 °C, 20 bar and CO2/H2 = 3) demonstrate that Mo-promoted catalysts exhibit superior durability, reducing the deactivation constants by up to 82% compared to the un-promoted Cu/ZnO sample. This enhanced stability is attributed to the higher Cu-MoO3 interaction, enhanced Cu dispersion and high water affinity of Mo species, which trap water as Mo-OH bonds, preventing copper sintering under reaction conditions. These findings highlight the dual role of Re and Mo in tuning both activity and stability, emphasizing the crucial influence of Mo on the long-term performance of Cu-based catalysts for CO2 to methanol conversion.

Graphical Abstract

1. Introduction

The increase in greenhouse gas emissions like CO2, due to the continued consumption of energy through fossil fuels such as coal and fuel oil, is one of the main contributors to climate change. In this area, carbon capture, storage and utilization (CCSU) technologies have gained great interest. The use of CO2 and renewable energy for the synthesis of high value-added chemicals and fuels has gained great interest [1,2]. In particular, the catalytic hydrogenation of CO2 to methanol is highly interesting, since methanol is a promising energy vector for a sustainable economy [3] and one of the most important feedstocks for the chemical industry. Currently, methanol is obtained from synthesis gas, coming from fossil fuels such as natural gas and coal [4,5]. Thus, the use of CO2 as a C1 building block and hydrogen, generated through renewable sources like water electrolysis, is a sustainable route for CO2 recycling and hydrogen storage. Many catalytic processes, including photo- [6,7,8], electro- [9] and thermo-catalytic CO2 reduction, have been investigated in recent years, being the last ones the more mature route. Nevertheless, the direct thermo-catalytic CO2 hydrogenation to produce methanol is a major challenge due to the chemical inertness of the CO2 molecule, (∆G0298K = 396 kJ/mol) along with the thermodynamic limitations of the reaction and the competitive reverse water gas shift reaction (RWGS) to CO [10,11,12]. The most studied catalysts for methanol synthesis from CO2 and H2 are those based on copper–zinc oxide because they show the best methanol formation yields; however, catalyst stability is still a critical point. Catalyst deactivation has been ascribed to metal sintering which is accelerated in the presence of the reaction generated by water. In this context, metal oxide promoters have been used to increase not only the stability of Cu/ZnO-based catalysts but also the activity and selectivity to methanol [13,14]. In this regard, the addition of Al2O3 in the commercial Cu/ZnO/Al2O3 formulation acts as a structural promoter, improving the dispersion of copper–zinc oxide nanoparticles and enhancing the thermal stability of the catalyst. In addition, other promoters such as Ga2O3, CeO2, Cr2O3, MgO, WO3, etc. have been studied [15,16,17,18,19,20,21,22,23]. For example, it has been proposed that adding a small amount of WO3 (2–5 at%) on a Cu-ZnO-ZrO2 catalyst increases both the activity and methanol selectivity [24]. This has been related to an increase in the dispersion of the active components and of the surface area of the catalyst, together with an increase in the number of basic sites and the reducibility of the catalyst [24]. The same authors performed a comparative study analyzing different transition metal oxide promoters, i.e., Cr2O3, MoO3 and WO3, on the catalytic performance of the Cu-ZnO-ZrO2 catalyst in the CO2 hydrogenation to methanol [25]. While the addition of Cr2O3 decreases the dispersion of active components, the catalyst surface area, as well as the CO2 adsorption capacity and reducibility, with a corresponding decrease in methanol yield, an opposite effect is observed by adding MoO3 and WO3, with methanol production being favored over WO3 than MoO3. According to these authors, methanol production is directly related to the surface area of metallic copper and the CO2 adsorption capacity of the catalyst. In contrast, other authors [26] did not find a promoting effect when adding MoO3 in a 2 wt% to a CuZnOAl2O3 catalyst. For the Cu/ZnO catalyst, Saito et al. [27] found that adding 5 wt% Cr2O3 increases the specific activity of copper by optimizing the Cu+/Cu0 ratio on the Cu surface, thus increasing the methanol yield. Also, a positive effect on stability was observed. Other promoters such as CeO2 and Ga2O3 have also been explored with an interesting influence on the catalytic performance [15,28,29,30]. While most of the literature studies usually focused on promoter loadings above 2 wt%, recently, it was found that the addition of ultra-low loadings of the promoter (0.01 wt%) (i.e., Ga, Ce, Zn) on Cu/SiO2 has an important effect on catalytic activity, explained by the stabilization of new active sites [31,32,33].
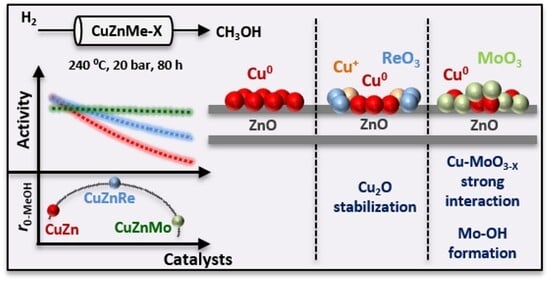
The use of ReO3 in Cu/ZnO catalysts in methanol synthesis has been less explored in the literature. However, it has shown interesting properties in Ni/Al2O3 and Ag/Al2O3 catalysts for improving metal dispersion, favoring H2 activation or hydrogen spillover and stabilizing the active site against sintering [34,35]. Accordingly, our work is focused on studying the promoting effect of this transition metal oxide on Cu/ZnO catalyst, and comparing it to the previously reported MoO3, paying special attention to catalyst stability and activity. Metal loadings going from ultra-low loading (0.06 wt%) to those usually reported in the literature (3.5 wt%) have been considered. Spectroscopic, catalytic and kinetic studies have been performed to identify the role of the promoter in both catalytic activity and catalyst stability. An interesting effect was found between the interaction of the Cu nanoparticle with the promoter; the copper dispersion and the water affinity of the promoter ascribed to its propensity of forming hydroxyl (Me-OH) groups, with their inhibiting effect on the sintering of the copper nanoparticles. This results in enhanced long-term catalytic activity.

2. Materials and Methods

2.1. Catalyst Synthesis

Cu/ZnO-based catalysts promoted with different amounts of transition metals (named, CuZnMe-X) were prepared by the coprecipitation method, modifying both the metal promoter (where Me is rhenium (Re) and molybdenum (Mo)) and the metal loading for each promoter (where X is between 0.06 and 3.50 wt.%). For this purpose, the same Zn:Cu ratio = 0.43 was kept constant in all cases, and the percentage of the different metal promoters was varied (Table 1).
In the synthesis of CuZnMe-X catalysts, the metal precursors employed were the following: Cu(NO3)2·3H2O (Sigma-Aldrich, puriss. p.a., 99–104%); (Zn(NO3)2·6H2O (Sigma-Aldrich, reagent grade, 98%) for the CuZn oxide reference; and NH4ReO4 (Sigma-Aldrich, >99%) or (NH4)6Mo7O24·4H2O (Sigma-Aldrich/Supelco, cryst. Extra pure) for the different metallic promoters.
In a typical synthesis procedure, the metallic precursors were dissolved in milliQ water to obtain a 1.1 M solution and at 0.50 mL/min (kd Scientific, KDS-200 syringe pump) into a beaker containing 200 mL of miliQ water at 65 °C, under constant stirring (350 rpm), using a 1.4 M NaOH solution to keep a constant pH of ca. 6.50. The controlled pH of 6.5 was chosen based on previous optimization studies on co-precipitated Cu/ZnO catalysts, in which this value ensures the simultaneous precipitation of Cu(II) and Zn(II) ions, while preventing the appearance of separate Cu(OH)2 or Zn(OH)2 phases [36,37,38]. The suspension was then aged under stirring at 65 °C for 2 h. The precipitate was then filtered, washed with warm deionized water to pH = 7 and dried overnight at 100 °C. The resulting dark solid was calcined in a muffle furnace as follows: from 25 to 200 °C (2 °C/min; dwell time of 1 h), from 200 to 360 °C (2 °C/min; dwell time of 1 h), and finally held at 360 °C for 9 h. After calcination, the samples were reduced in H2 (20 mL/min) at 200 °C for 3 h with a heating rate of 5 °C/min. The absence of residual Na in the final catalyst (Figure S3) was confirmed by XPS analysis at the Na 1s core line.

2.2. Catalyst Characterization

The chemical composition of unpromoted and promoted catalysts was analyzed by inductively coupled plasma optical emission spectrometry (ICP-OES) using a Varian 715-ES spectrometer (Varian, Inc., Palo Alto, CA, USA) after solid dissolution of the catalysts in an aqueous HNO3/HCl solution.
The surface areas of the solid samples for the different materials studied (250 mg) were calculated by applying the Brunauer–Emmett–Teller (BET) model to the interval of the N2 adsorption isotherm in which a linear relationship is maintained. The calcined samples were degassed in situ under vacuum at 150 °C. These isotherms were obtained from liquid nitrogen adsorption experiments at −196 °C in a Micromeritics flowsorb instrument.
X-ray diffraction patterns (XRD) were recorded with a PANalytical Cubix Pro diffractometer using monochromatic Cu Kα radiation (λ = 0.15406 nm). The average size of Cu0 and ZnO crystallites (JCPDS: 01-070-3038 and 01-079-0207, respectively) were calculated from the major peaks (2θ; 50.300 and 56.463°, respectively) using the Scherrer equation and assuming a shape factor k = 0.9.
High-resolution transmission electron microscopy (HRTEM) and scanning transmission electron microscopy (STEM) were carried out using a TALOS Model F200x equipment. Microanalyses were performed using an EDX Super-X system to determine the distribution of metals.
The reducibility of catalysts was determined by temperature-programmed reduction (TPR-H2) experiments on a Micromeritics Autochem 2910. About 50 mg of samples were initially cleaned with 30 mL/min Ar at room temperature for 30 min, and then a mixture of 10 vol% H2 in Ar was passed through the solid at a total flow rate of 50 mL/min, while increasing the temperature to 600 °C at a heating rate of 10 °C/min. The H2 consumption was measured using a thermal conductivity detector (TCD).
The surface concentration of metallic copper sites was quantified via N2O chemisorption followed by temperature-programmed reduction with H2 (TPR-H2), using a Micromeritics AutoChem 2910 instrument. A stoichiometric ratio of 1:2 (H2:CuS) was assumed for H2 uptake. Prior to analysis, 50 mg of each CuZnMe-X catalyst were pre-reduced under a pure H2 flow (20 mL/min) at 200 °C for 3 h. Subsequently, the samples were purged with argon at the same temperature to remove residual hydrogen. Once cooled to 25 °C, surface oxidation of metallic Cu0 to Cu2O was carried out by exposing the samples to a 1 vol% N2O/He mixture (10 mL/min) for 1 h. Following this step, the samples were flushed with argon at room temperature for 15 min. The re-oxidized copper surface was then subjected to TPR-H2 up to 400 °C (10 vol% H2 in Ar, 50 mL/min) at a linear heating rate of 10 °C/min.
Temperature-programmed desorption (TPD-CO2) studies on in situ reduced samples of the different metal promoters were performed using a ChemStar TPx (chemisorption analyzer) instrument with a quartz reactor at atmospheric pressure, connected on-line to a mass spectrometer (MS) OMNISTARTM (GSD 320 Gas Analysis System) and a thermal conductivity detector (TCD). First, samples (ca. 50 mg diluted in 300 mg of SiC) were activated at 200 °C in a pure H2 flow rate of 20 mL/min for 3 h. Then, the samples were cleaned with Ar (20 mL/min) at room temperature for 30 min. After stabilization, CO2 was pulsed to the sample 20 times using a four-way valve (61.0 µL loop) at 50 mL/min (5% CO2 in Ar) for 1 h. After the adsorption step, physisorbed CO2 was eliminated by using Ar steam (50 mL/min) for 30 min. After that, chemisorbed CO2 desorption measures took place at increasing temperatures (from room temperature up to 600 °C), keeping the inert flow rate at 50 mL/min. The CO2 desorption was followed by MS (m/z = 44).
Surface analysis was performed by X-ray photoelectron spectroscopy (XPS) using a SPECS system equipped with a Phoibos 150 MCD-9 multichannel analyzer and a non-monochromatic Al Kα X-ray source (hυ = 1486.6 eV). Spectra were acquired at an X-ray power of 50 W, a pass energy of 30 eV, and under ultra-high vacuum (UHV) conditions (~10−9 mbar). Approximately 10–30 mg of the catalyst were pressed into a pellet and mounted onto a stainless-steel sample holder. Prior to XPS analysis, CuZnMe-X samples were reduced under H2 flow (20 mL/min) at 200 °C and atmospheric pressure for 3 h in a high-pressure reaction cell (HPCR) directly connected to the XPS chamber under UHV. Gas flows were regulated using Bronkhorst mass flow controllers. All spectra were referenced to the C1s binding energy at 284.5 eV. Data processing was carried out using the CASA XPS software package (CasaXPS Version 2.3. 16Dev52).
Raman spectroscopy was performed using a Renishaw “inVia” spectrometer coupled with an Olympus optical microscope. The setup includes a 514 nm He-Ne green laser, a 785 nm diode laser, and a CCD detector. In situ Raman measurements at 1 bar were carried out using a Linkam THMS600 cell, which provides high-precision temperature control (±0.01 °C) over a wide range (−195 to 600 °C). Typically, for in situ experiments at 1 bar, samples were first reduced ex situ under H2 flow (20 mL/min) and then exposed to air for 1 h. This was followed by in situ reduction in H2 (20 mL/min) at 200 °C. The temperature was then increased directly to 260 °C under H2 flow, and the system was subsequently switched to reaction conditions using a CO2/H2 mixture (1:3 molar ratio, total flow: 20 mL/min) in the temperature range of 260–280 °C. Additional in situ Raman experiments were conducted under co-feeding conditions with ca. 3.1 vol% H2O at room temperature and pressure, introduced via a saturator and transported by an Ar flow (20 mL/min).
Thermogravimetric analyses were performed on a Mettler-Toledo thermobalance (TGA/SDTA 851). Specifically, for each experiment, 10 mg of the samples previously calcined in air at 360 °C were heated under a synthetic air atmosphere (50 mL/min) from room temperature up to 500 °C.

2.3. Catalytic Test

Catalytic studies of CO2 hydrogenation to methanol were performed in a stainless-steel fixed-bed reactor (11 mm inner diameter and 240 mm length), equipped with a back pressure regulator (BPR, Swagelok) that allows work at a pressure range of 1–20 bar. Typically, 200 mg of catalyst (particle size 400–600 mm) were diluted in SiC at a Cat/SiC weight ratio of 0.12. Samples were reduced in situ at atmospheric pressure prior to catalytic testing (20 mL/min H2, 200 °C, 3 h, 10 °C/min). Constant weight hourly space velocity experiments (WHSV, 30,000 mL/h gcat) were performed under concentrated reaction conditions (23.7 vol% CO2, 71.3 vol% H2, 5.0 vol% N2) at 20 bar. Reaction temperatures ranged from 220 to 280 °C. In addition, catalytic experiments were carried out by varying the WHSV (30000–3333 mL/h gcat) at a constant molar ratio of H2/CO2 = 3. Finally, long-term stability studies of the different catalysts were performed under conditions of 240 °C and 20 bar for 80 h. Direct analysis of the reaction products was performed by on-line gas chromatography (GC) using Agilent-8860 equipment with TCD (PLOT/U + mol sieve column) and FID (BR-Q Plot column) detectors. Blank experiments (in the presence of SiC) showed the absence of a homogeneous contribution to the reaction.

3. Results and Discussion

3.1. Characterization of Catalysts

The structural properties of CuZnMe-X catalysts promoted with different amounts of metal were studied by powder X-ray diffraction (XRD). The diffraction patterns of the as-prepared, calcined in air, H2 reduced, and after-reaction samples are shown Figure S1. Characteristic peaks of CuO (at 2θ = 32.5, 35.5, 38.8, 48.7, 53.5, 58.3, 61.5, 66.2, 67.9, 68.1, 72.4, 75.2°) and ZnO (at 2θ = 31.7, 34.4, 36.2, 47.5, 56.6, 62.8, 67.9, 69.1, 76.9°) phases were observed in the diffraction patterns of the as-prepared and calcined materials (Figures S1A and S1B, respectively), whereas, in the reduced materials, the characteristic peaks of the Cu0 (at 2θ = 43.2, 50.4, 74.0°) and ZnO phases were observed. However, no characteristic diffraction peaks of the rhenium and molybdenum phases were observed in any case, suggesting high dispersion of the metal promoter in all samples. This is confirmed by HRTEM and STEM-EDX mapping performed on ex situ reduced catalysts. As shown in Figure 1, independently of the promoter loading, molybdenum is well-dispersed over the sample in close contact with Cu and ZnO, whereas rhenium seems to interact preferentially with ZnO. In addition, similar distributions of the promoters have been found on spent samples (Figure S2), indicating no significant changes under reaction conditions.
The average particle size of Cu0 and ZnO were measured from the XRD patterns using Scherrer’s equation analysis (Table 1). It was shown that, independently on the metal loading, the addition of MoO3 results in a lower Cu particle size (around 8 nm) compared to that of Re (around 17 nm) and the un-promoted Cu/ZnO sample (23 nm). In addition, MoO3 favors a higher surface area of the catalyst (ca. 25 m2/g) compared to that of the un-promoted Cu/ZnO sample (10 m2/g) or CuZnRe-0.06 catalyst (ca. 9 m2/g). The amount of surface copper atoms determined from N2O chemisorption analysis does not follow the expected trend based on metal dispersion, being markedly lower for Mo-based catalysts, indicating partial blocking of surface copper atoms by either MoOX or ZnOx. In this direction, the XPS data in Table 1 shows a Cu/Zn ratio between 0.8 and 1 in all reduced catalysts, which is lower than the theoretical 2.4 associated with partial migration of ZnOx over the Cu nanoparticle, a trend already reported in the literature [39]. Furthermore, a marked decrease in the surface atomic Cu/Mo ratio of the MoO3-promoted samples is observed, specifically at high Mo loadings (with Cu/Mo of 5.02 and 0.80 in CuZnMo-0.44 and CuZnMo-3.5, respectively), compared to the Cu/Re ratio of the ReO3 promoted samples (with Cu/Re of 32.8 and 29.6 in CuZnRe-0.50 and CuZnRe-3.5, respectively). This is in line with the above reported STEM-EDX data, where Re atoms were mainly located close to ZnO, whereas Mo atoms were located close to Cu and ZnO. The XPS binding energies (BE, eV) of the Cu 2p3/2 and Zn 2p3/2 core lines (Figures S4 and S5) in the H2-reduced samples corresponds in all cases to Cu0 (Cu 2p3/2 ~932.6 ± 0.1 eV and CuL3M45M45 918.4 eV) and Zn2+ in ZnO (Zn 2p3/2 ~1022.0 ± 0.3 eV and ZnL3M45M45 987.8 eV). No shoulder is observed at KE 991.6 eV in the ZnL3M45M45 Auger line, discarding the possible formation of CuZn alloys [40,41]. A detailed analysis at the Cu AES peak shows a component at KE at ~916 eV in all promoted samples (Figure S5), while it is hardly observed on the un-promoted sample (Figure S6B), accounting for the stabilization of Cu+ species in the presence of the promoter. The contribution of Cu+ species seems to be highest on the samples with low promoter loadings (0.06 wt%), specifically in the presence of rhenium (see Table 1). However, the low transmission of the samples in IR spectroscopic studies due to its black color impedes the identification of Cu+ species by IR of CO as a probe molecule.
Finally, in the case of the Mo 3d core line (Figure S7B), a shift is observed in the BE of Mo 3d5/2 to lower values (from 233.3 to 232.6 eV) with increasing Mo loading from 0.06 to 3.5 wt%. This corresponds to a change in the dispersion and local environment of Mo6+ species from highly dispersed molybdenum oxide species in a tetrahedral coordination to a more MoO3 like state with octahedral coordination [42,43,44,45,46]. In addition, a new component at low BE, 230.8 eV, corresponding to Mo sites in a lower oxidation state (5+), appears at increasing Mo loadings. In the case of Re 4f7/2 (Figure S7A), an opposite effect is observed, with a shift to higher BE from 43.3 to 44.2 eV with increasing Re loading (from 0.5 to 3.5 wt%), which may be related to changes in the oxidation state (4+ and 6+, respectively). This indicates a more defective state of rhenium at low loadings, while it becomes more oxidized with increasing rhenium loading. This different trend in the chemical states of the metal oxide promoter can be associated with their different location, either on the Cu NP as in the case of Mo, which favor a more reduced state due to H2 spillover, or on the ZnO particles as in the case of Re, which favor a more oxidized state.
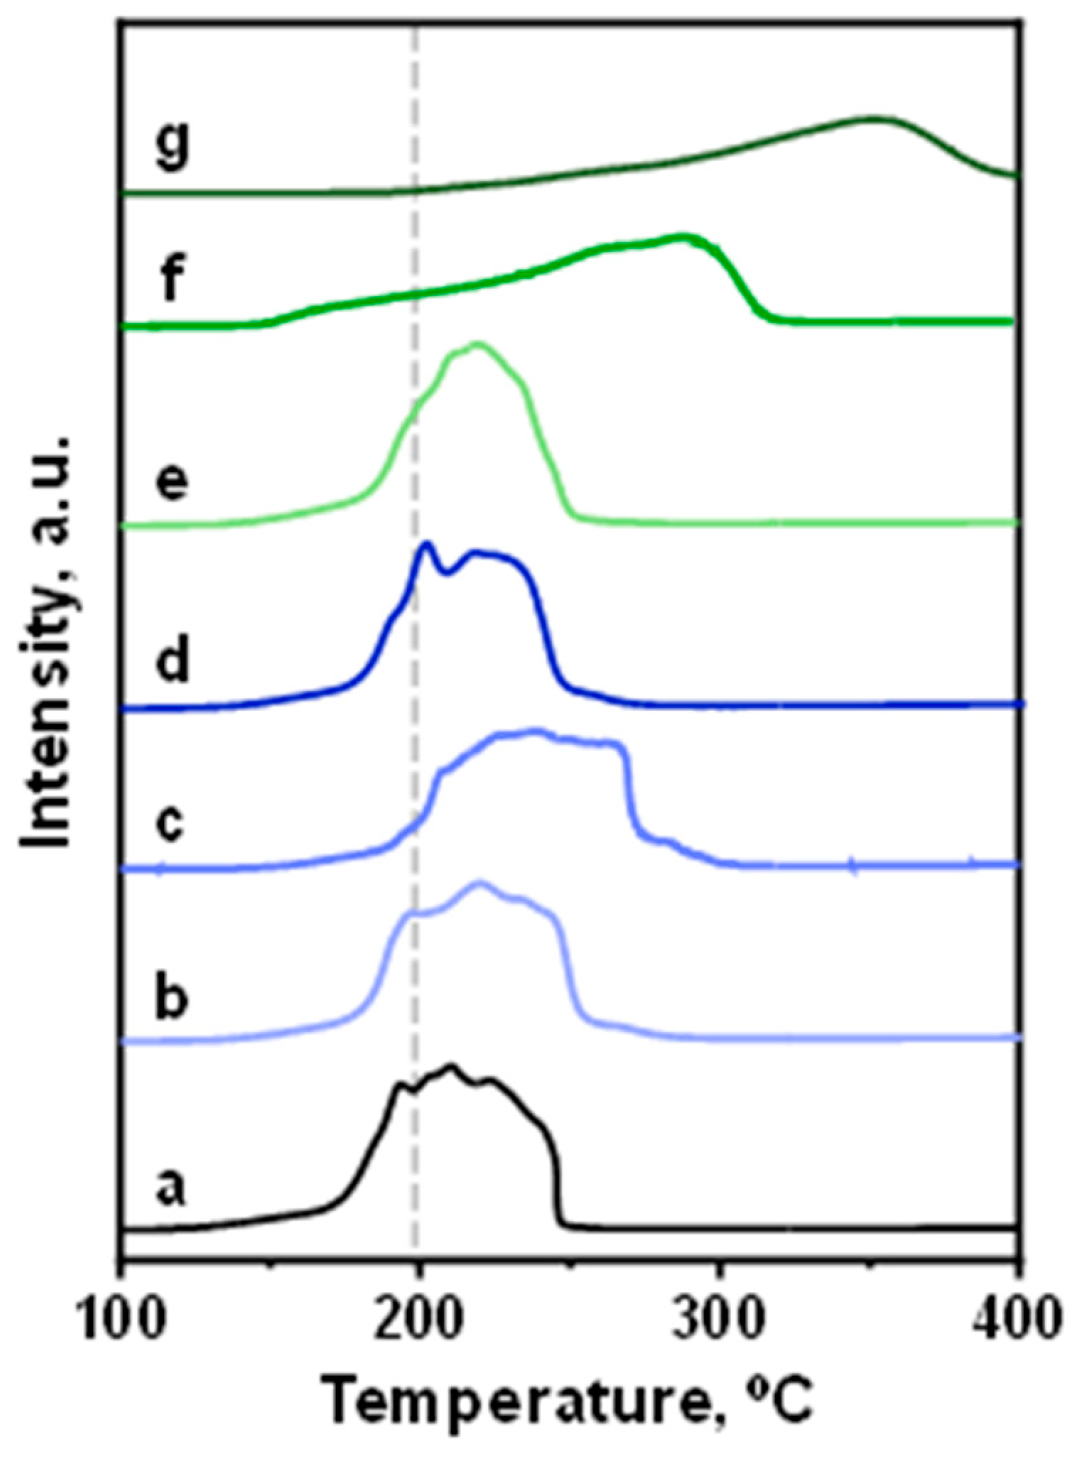
The reducibility of all samples calcined in air at 360 °C was studied by temperature-programmed reduction (H2-TPR). The results are shown in Figure 2. A broad reduction peak and a shift in the maxima reduction temperature to higher values were observed, specifically on the molybdenum-promoted catalysts (Figure 2, patterns f and g), indicating a copper–molybdenum interaction in line with EDX analysis.
The Raman spectra of calcined and in situ reduced samples are displayed in Figure 3. In all calcined samples (Figure 3A,B), a similar pattern is observed with bands at ca. 280, 337 and 630 cm−1, characteristic of CuO [47,48] (see CuO reference in Figure S8A), and at ca. 580 cm−1, corresponding to partially reduced copper species [49,50,51].
In MoO3-promoted samples, additional bands appear in the 800–900 cm−1 region, assigned to the asymmetric vibrational modes of bridging Mo-O-Mo and/or O-Mo-O bonds, and in the 900–1000 cm−1 range, associated with the symmetric and asymmetric stretching modes of terminal Mo=O bonds, which correspond to tetrahedral and/or octahedral Mo species on the surface [52,53]. The intensity of these bands increases with increasing Mo loading. However, in the case of ReO3-promoted samples, the weak and broad Raman features observed between 600 and 1000 cm−1 are consistent with disorder-induced scattering in ReO3, whose ideal cubic structure is Raman-inactive. These bands arise from oxygen vacancies and surface Re=O/ReO4 species formed upon mild oxidation [54,55].
Upon in situ reduction in H2 at 200 °C (Figure 3C,D), distinct differences emerge in the Raman spectra of the MoO3 and ReO3-promoted catalysts. In the MoO3-containing samples, a marked decrease in the intensity of the Cu2O- and CuO-related bands is observed. Additionally, two weak bands appear in the 430–490 cm−1 region, assigned to Cu-OH species [49] (see Cu(OH)2 reference in Figure S8B), likely originating due to water generated during the reduction process. Notoriously, no Raman bands related to Cu species are observed at higher Mo loadings (CuZnMo-3.50), and only the Raman bands of molybdenum species are observed. This is in line with XPS and N2O titration data where a partial blocking of surface copper sites is observed with increasing Mo loading under reducing conditions. In contrast, in the ReO3-promoted samples, an intense Raman band is observed at 560 cm−1, with a shoulder at 440 cm−1 (associated with reduced copper phases (Cu2O) and Cu(OH)X, respectively), which remains unaltered even at higher Re loadings. Regarding the nature of the promoter, in the case of the CuZnMo-3.5 sample, the initial components at 820 and 931 cm−1 decrease in intensity under in situ H2 conditions, leading to the formation of a single component at 889 cm−1, which is associated with Mo-O vibrations of shear defects in MoO3−X [56,57,58,59].
Finally, the Raman spectra of all catalysts under in situ reaction conditions (CO2/H2, 1/3 molar ratio, 260 °C) are comparatively presented in Figure S9. In principle, no substantial spectral changes are detected compared to the corresponding in situ reduced states, indicating that the structural features of the active phases remain largely unaltered under the applied reaction conditions. However, in the CuZnMo-3.50 sample (Figure S10), a broadening of the Raman band is observed at 889 cm−1, with a shoulder at 848 cm−1, which could be related to the formation of Mo-OH-like species [56].
Moreover, the surface basicity of reduced catalysts was studied by CO2 temperature-programmed desorption (CO2-TPD). Figure S11 shows three distinct CO2 desorption regions: below 200 °C, between 200 and 500 °C, and above 500 °C. The intermediate region (200–500 °C) is considered the catalytically relevant zone, as several authors have reported that a higher density of basic sites in this region is crucial for stabilizing reaction intermediates that enhance methanol selectivity [15,60]. This region is mainly associated with surface defects, low-coordination oxygen anions, and metal–oxygen pair sites [61,62]. In our study, minor variations are observed within the range of 200–500 °C, with a slightly higher desorption temperature in the Mo-promoted samples.

3.2. Catalytic Studies

The catalytic performance of the CuZnMe-X catalysts in CO2 hydrogenation at 20 bar, time–space velocity (WHSV) of 30,000 mL/h gcat and in the temperature range between 220 and 280 °C is given in Tables S2 and S3. As a reference, an un-promoted CuZn-based catalyst synthesized by the same method was used. In all cases, CO2 conversion as well as methanol production (expressed as gMeOH/h gcat) increase with reaction temperature, while the selectivity to methanol decreases at the expense of CO formation, which is consistent with the endothermic nature of the competing reverse water–gas shift (RWGS) secondary reaction. Compared to the un-promoted CuZn catalyst, and independent of the reaction temperature, the methanol production normalized to grams of the catalyst enhances for both CuZnMo and CuZnRe catalysts at low promoter loadings (0.06 and 0.5 wt%, respectively), while it is reduced at high promoter loading (i.e., 3.5 wt%) (Figure S12).
However, as reported in Table 1, the Mo promoter increases the surface area of the catalyst; thus, to more accurately assign activity to surfacedistributed centers, methanol production was normalized by the surface area of each catalyst (m2/gcat). Under these conditions, as before, both the CuZnRe-0.06 and CuZnRe-0.5 catalysts show enhanced methanol production (ca. 0.052 gMeOH/h m2cat at 240 °C) compared to that of the un-promoted CuZn catalyst (0.042 gMeOH/h m2cat) (Figure S13). In contrast, the CuZnMo-0.06 catalyst shows slightly lower methanol production (0.039 gMeOH/h m2cat at 240 °C) compared to the CuZn catalyst (0.042 gMeOH/h m2cat), being lower in the rest of the Mo- promoted catalysts. Consequently, the order of methanol production per catalyst surface area at 240 °C is CuZnRe-0.06 ≈ CuZnRe-0.5 > CuZn ≥ CuZnMo-0.06 ≈ CuZnRe-3.5 > CuZnMo-0.5 > CuZnMo-3.5. A similar trend is also observed in CO production, where the methanol versus CO production is higher in the Re-promoted samples than in the Mo-based catalysts (see Figures S12 and S13 and Table S2). CO comes from the reverse gas shift reaction (RWGS) which is considered a structure-sensitive reaction, influenced by Cu particle size [63], while the formation of additional Cu-ZnO-MeO3 interfacial sites providing additional sites for CO as well as for methanol formation cannot be excluded.
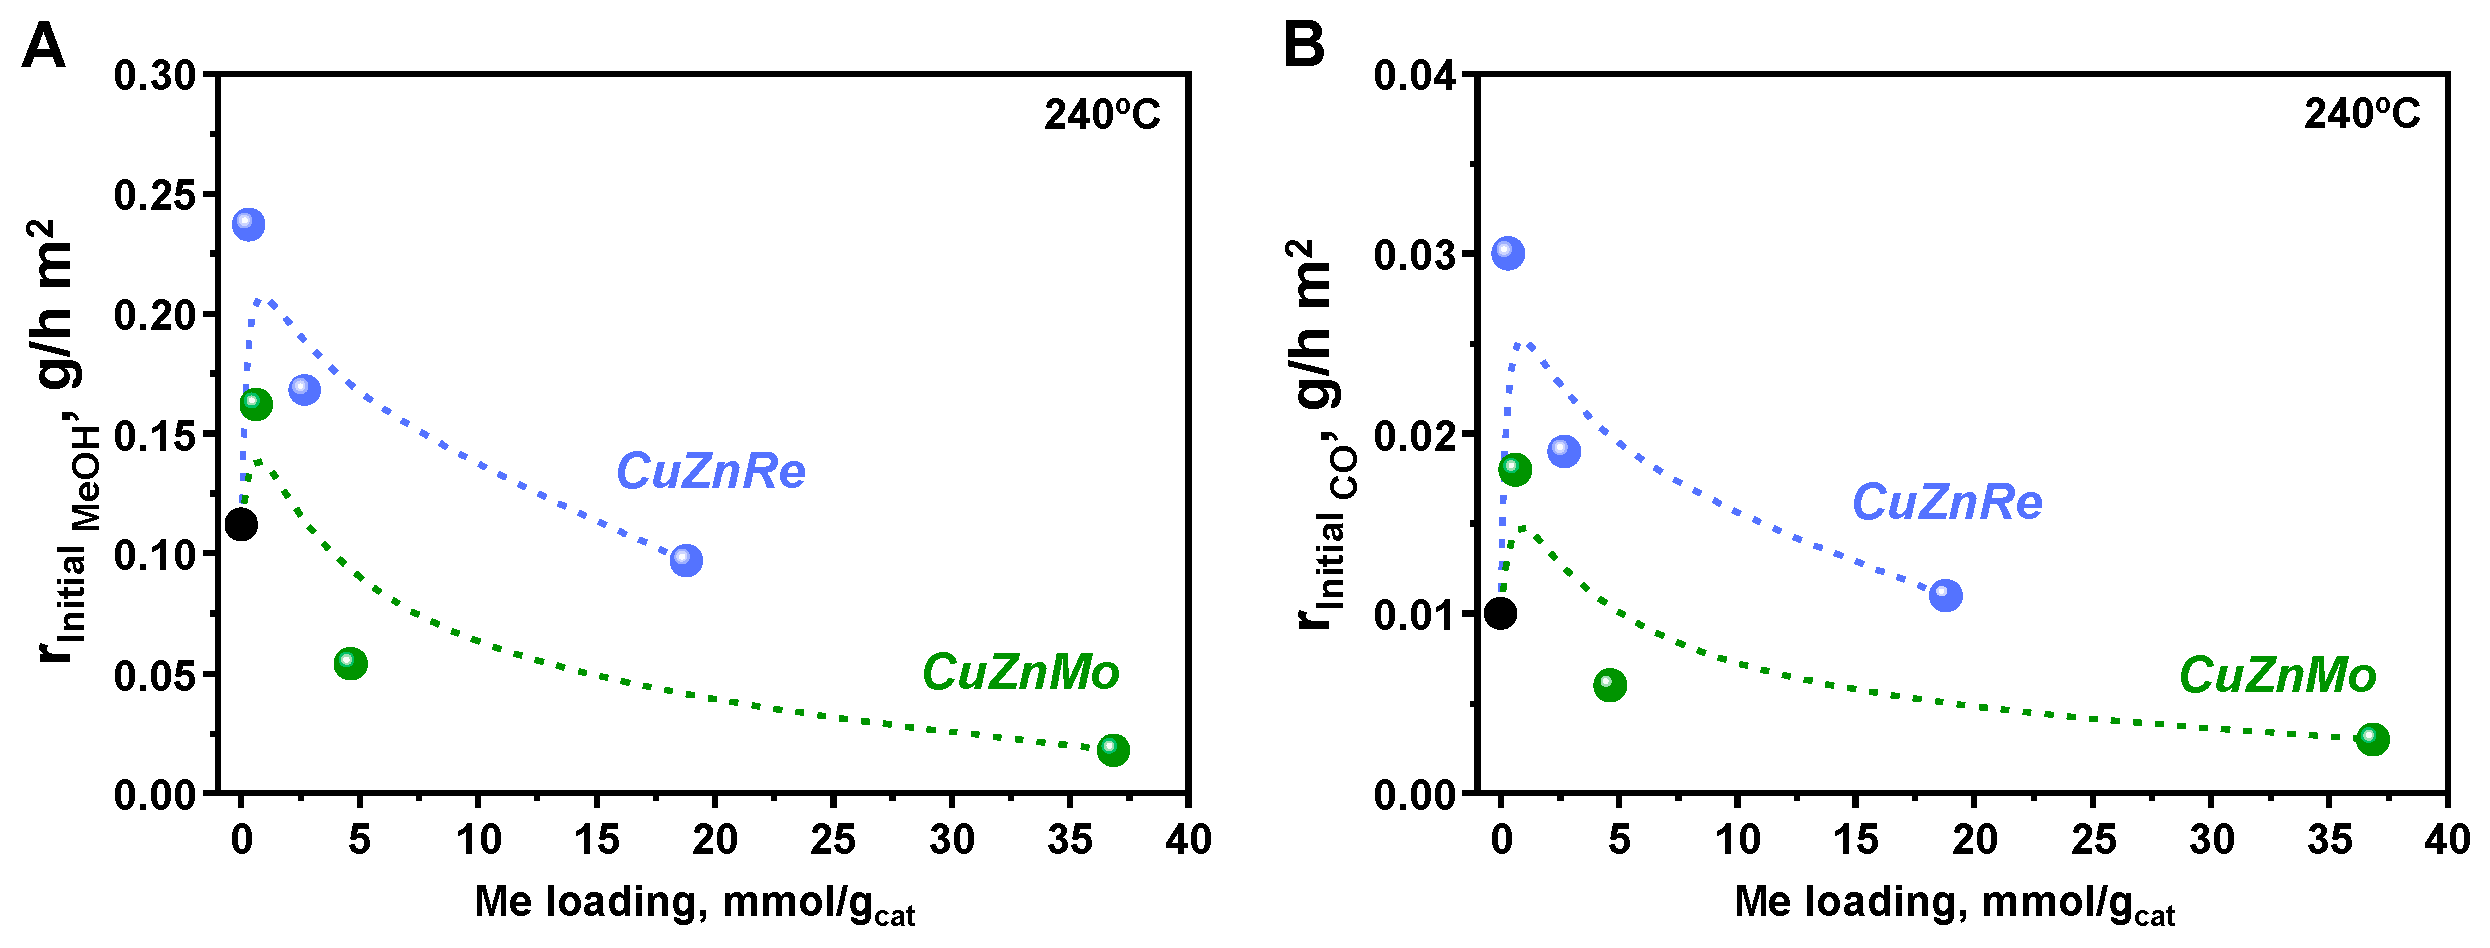
To determine the intrinsic activity of active sites, initial reaction rates of methanol and CO formation have been calculated at 240 °C and 20 bar (Table S4) and compiled in Figure 4. These initial rates have been determined by calculating the methanol and CO production extrapolated at zero contact time (see Figure S14). From these results, a volcano-like tendency is observed between the methanol and CO initial rate (gMeOH/h m2cat and gCO/h m2cat) and ReO3 and MoO3 loading, with a maximum value at ultra-low promoter loadings, which is independent of the reaction temperature. These results indicate clear differences between active centers and a drastic reduction in their intrinsic activities at increasing the amount of the promoter. Moreover, it is clearly seen that the methanol formation rate at a constant molar number (mmolMe/gcat) is higher in ReO3-promoted catalysts than in the MoO3-promoted ones.
Furthermore, the ratio between the initial rate of methanol formation versus CO is similar on all catalysts, around 9, except in the CuZnMo-3.5 sample with a value of 6.9, being slightly lower in all cases compared to that of the un-promoted CuZn catalyst (10.9) (Table S4). The similarity in these trends and the nearly constant MeOH/CO ratio suggest that both products share a common active site (see more details in SI).
The negative effect of the promoter at higher loadings, which is more pronounced in Mo-containing catalysts, is in line with the lower amount of copper atoms on the catalyst surface, as determined by N2O chemisorption analysis (Table 1), due to partial blocking of the copper particle by some promoter or ZnOx layers, as evidenced by XPS studies (Table 1 and Table S1). To remove this effect and determine the intrinsic activity of surfaceexposed copper sites, the initial rates of methanol and CO production have been normalized to the number of surface copper atoms determined by N2O titration (Table S4). In this case, a similar volcano trend as in Figure 4 is observed (Figure S15). Hence, Re-promoted catalysts exhibit a high initial intrinsic methanol rate per exposed Cu atom at ultra-low loadings, decreasing to an almost constant value at promoter loadings above 0.3 mmol/gcat, highlighting an electronic or structural effect localized at the active site under ultra-low Re loading. In contrast, Mo-promoted catalysts show significant variations in Cu-site reactivity, indicating that Mo negatively alters the intrinsic nature of the active site while also promoting partial blocking of surface copper atoms at higher loadings.
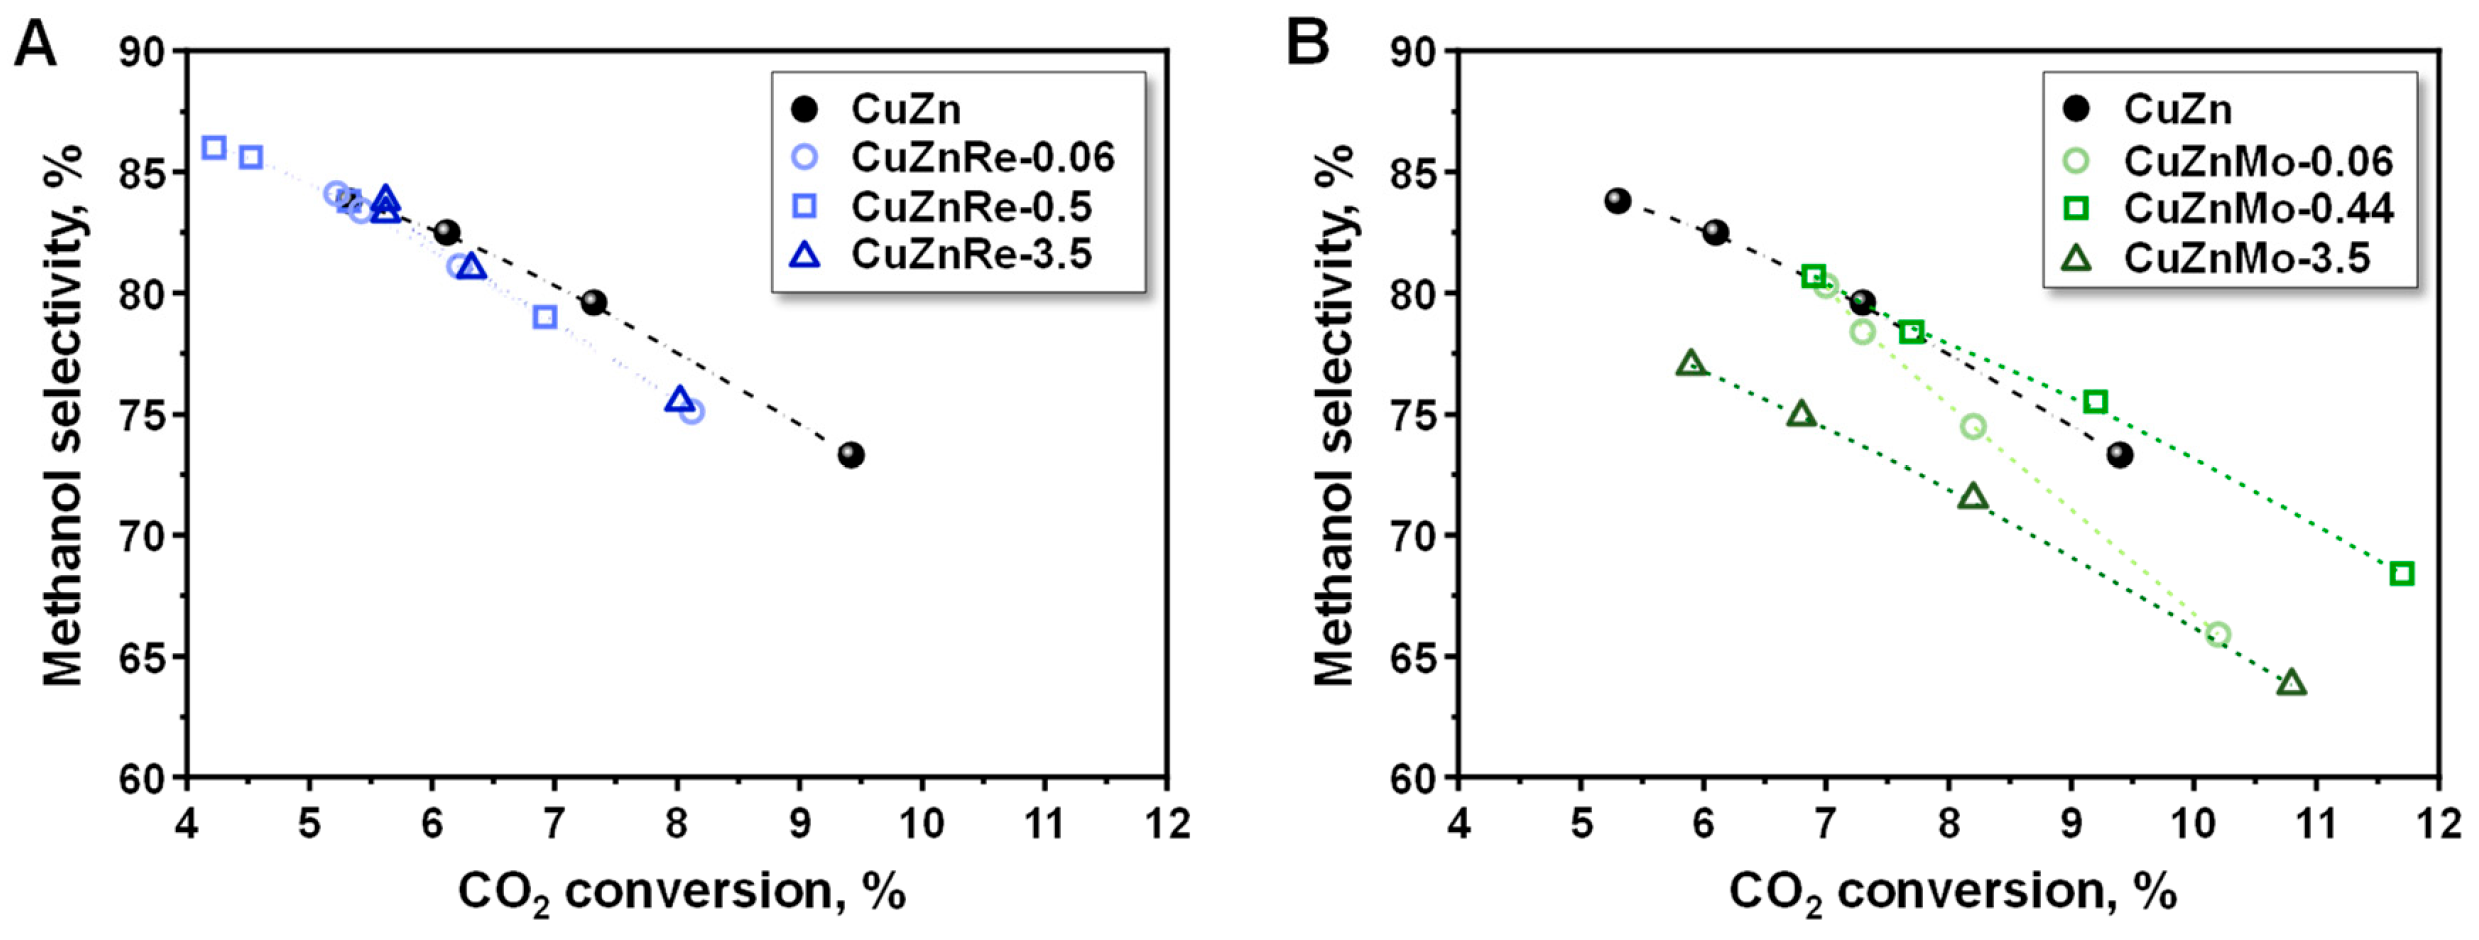
Next, in Figure 5, the variation in the selectivity to methanol with the CO2 conversion is compared. All Re-promoted samples show a similar trend in methanol selectivity, being slightly lower than that of the un-promoted CuZn sample (Figure 5A). However, major discrepancies are observed in the Mo-based samples (Figure 5B). This may be due to the different interaction of the promoter with the copper nanoparticle, as determined from STEM-EDX, affecting in major extend the nature of active sites in the Mo-based catalysts and resulting in significant variations in the reactivity of Cu sites, as discussed above. Hence, the lowest methanol selectivity is observed in the CuZnMo-3.5 sample. This sample displays heterogeneity in Mo sites, with stabilization of Mo5+ and Mo6+, and surface enrichment of Mo, which explains this different catalytic trend.
The previously described trends in methanol and CO production and selectivity are consistent with the differences observed in their apparent activation energies for methanol and CO formation (Figure S16 and Table S5). The addition of Re significantly decreases the apparent activation energy for methanol synthesis from 22 kJ/mol to approximately 14 kJ/mol. In the case of Mo, at low promoter loadings, the apparent activation energy for methanol formation is around 14.8 kJ/mol, but it increases almost linearly with Mo loading, reaching values close to 36.8 kJ/mol for the CuZnMo-3.5 sample. For CO formation, the apparent activation energy is consistently lower for all Re-promoted catalysts (~88 kJ/mol) compared to the CuZn reference (92.4 kJ/mol), whereas it is higher for Mo-containing samples (97.4–101.8 kJ/mol). These observations clearly reveal promoter-dependent differences in the nature of the active sites, the reaction mechanism and/or the adsorption enthalpy of key intermediates. The enhanced methanol formation observed at ultra-low Re and Mo loadings can be ascribed to the stabilization of Cu2O species, as confirmed by in situ Raman and XPS, reducing the energy barriers of methanol production. For Mo-promoted catalysts, the progressive increase in the apparent activation energy for methanol formation with Mo content correlates with the generation of structural defects and enhanced Cu-MoO3 interactions that modify the electronic properties of the copper sites leading to decreased methanol selectivity.

3.3. Stability Studies

An additional key aspect of Cu/ZnO catalysts is their stability under long-term reaction conditions. Therefore, long-term catalytic stability studies of selected CuZnMe-X catalysts were carried out at 240 °C, 20 bar and for 80 h and compared them with that of the un-promoted CuZn reference catalyst. As shown in Figure 6, the largest decrease in methanol production happens during the first 20 h, while from that time it practically stabilizes, with all samples showing the same catalytic trend with time on stream. Moreover, it is observed that the reference CuZn sample is the one that suffers the strongest deactivation, following the trend CuZn > CuZnRe-0.50 > CuZnMo-0.06 > CuZnMo-0.44 > CuZnMo-3.50. From these data, it seems clear that the addition of the different metallic promoters causes a notorious positive effect on the stability of the catalyst in methanol synthesis. The deactivation constants evaluated on selected catalysts after 20 and 80 h are given in Table 2 and Figure S17. There, at 20 and 80 h, the lowest deactivation constant is observed for CuZnMo-0.44 (K = 0.030 and 0.044, respectively) and CuZnMo-3.50 (K = 0.016 and 0.030, respectively), with significantly higher values for the reference CuZn catalyst (K = 0.164 and 0.168, respectively). Thus, after 80 h of reaction, the stability of CuZnMo-0.44 and CuZnMo-3.50 catalysts improved by 73.8% and 82.1%, respectively, with respect to un-promoted CuZn. Furthermore, a comparison with the commercial CuZnOAl2O3 catalyst (Figure S18) reveals comparable or even superior stability, despite the markedly lower surface areas (8–28 vs. 60–80 m2/gcat). This finding indicates that Re and Mo promoters improve the efficiency and resilience of the active sites, extending beyond the mere structural contribution of high surface areas.
Sintering of copper and zinc components has been widely reported as responsible for catalyst deactivation in Cu/ZnO catalysts in the methanol synthesis. In line with this, a clear increase in the size of Cu0 nanoparticles (about 40–55%) and, to a lesser extent, of ZnO nanoparticles (about 2–14%) is observed in all cases after 80 h catalytic stability studies, except in the most stable CuZnMo-0.44 and CuZnMo-3.50 samples, where the Cu particle size only increases by 38% and 20%, respectively (Table 2). This could be related to the increased copper dispersion favored by the larger catalyst surface area and smaller Cu particle size and the higher interaction of the Cu nanoparticle with MoO3, reducing Cu sintering. Another variable worth considering is the higher water affinity of MoO3 in trapping water from the catalyst surface in the form of Mo-OH moieties, compared with the higher hydrophobicity and lower water affinity of ReO3. TG analysis performed on calcined samples shows a higher water accumulation in the CuZnMo-0.44 and CuZnMo-3.50 samples (see Table S6 and Figures S19–S21), both showing enhanced stability. This could be related to the presence of Mo=O moieties that, in the presence of water, converted into Mo-OH, as demonstrated by in situ Raman studies performed on the CuZnMo-3.50 sample by co-adding ~3.1 vol% H2O/Ar (Figure S22).

4. Conclusions

This work demonstrates that the addition of MoO3 and ReO3 to Cu/ZnO catalysts strongly influences the physical and chemical properties of the catalyst and its performance in the CO2 hydrogenation to methanol. Both promoters show a volcano-type relationship, with ultra-low loadings (~0.06 wt%) maximizing CO2 conversion and methanol productivity, while at increasing promoter loading (to 3.5 wt%), the catalytic activity for CO2 conversion and the methanol yield tended to decrease. The enhanced performance at low loadings arises from the stabilization of Cu2O species and the creation of new interfacial sites at the metal–promoter boundary, which lower the apparent activation energy for methanol formation.
At higher promoter contents, partial coverage of Cu nanoparticles by MeOx or ZnOX layers reduces the number of exposed Cu sites, leading to decreased activity. Re is preferentially stabilized on ZnO and maintains Cu2O species under reaction conditions, whereas in the case of Mo-based catalysts additional effects at increasing Mo loadings have been observed increasing the apparent activation energy of methanol formation. This includes the coexistence of Mo6+, Mo5+ species, a large covering of the Cu NP with MoOx domains and a strong Cu-MoOX interaction. As a consequence, the overall decrease in activity as well as the methanol selectivity is due to CO formation.
Besides activity, catalyst stability is a key point in CO2-to-methanol conversion technology. Long-term catalytic studies performed up to 80 h showed that the Cu/ZnO-based reference sample underwent strong deactivation. However, the addition of molybdenum plays a key role in inhibiting catalyst deactivation. Specifically, samples CuZnMo-0.44 and CuZnMo-3.50 showed markedly lower deactivation compared to the reference CuZn catalyst. In addition to the interaction of the Cu nanoparticle with MoO3 and a higher Cu dispersion, the promoter’s affinity for water was proposed to play a key role in trapping water in a chemical bond, avoiding strong sintering of the copper particles, which is one of the main reasons for catalyst deactivation.

Supplementary Materials

The following supporting information can be downloaded at: https://www.mdpi.com/article/10.3390/nano15221730/s1.

Author Contributions

Conceptualization, P.C. and J.M.L.N.; Methodology, P.C., D.G. and J.S.R.; Analysis, J.S.R., A.I. and E.R.-C.; Investigation, P.C., J.S.R. and A.I.; Resources, P.C., J.M.L.N. and E.R.-C.; Writing—Original Draft Preparation, P.C. and J.S.R.; Writing—Review and Editing, P.C., J.S.R., J.M.L.N., D.G., A.I. and E.R.-C.; Supervision, P.C. All authors have read and agreed to the published version of the manuscript.

Funding

This research was funded by Ministerio de Ciencia, Innovación y Universidades, grants number PID2021-1262350B-C31 and PID2021-1262350B-C32 (funded by MCIN/AEI/10.13039/501100011033 and FEDER) and Generalitat Valenciana (GVA), grant number CIAICO/2021/2138. This study forms part of the Advanced Materials programme and was supported by MCIN with funding from European Union Next Generation EU (PRTR-C17.11) and Generalitad Valenciana (ref MFA/2022/016). D.G. thanks the Marie-Curie Postdoctoral (MSCA) Fellowship ID 101154019.

Data Availability Statement

All data are available by request to the corresponding authors.

Conflicts of Interest

The authors declare no conflicts of interest.

References

  1. Álvarez, A.; Bansode, A.; Urakawa, A.; Bavykina, A.V.; Wezendonk, T.A.; Makkee, M.; Gascon, J.; Kapteijn, F. Challenges in the Greener Production of Formates/Formic Acid, Methanol, and DME by Heterogeneously Catalyzed CO2 Hydrogenation Processes. Chem. Rev. 2017, 117, 9804–9838. [Google Scholar] [CrossRef]
  2. Artz, J.; Müller, T.E.; Thenert, K.; Kleinekorte, J.; Meys, R.; Sternberg, A.; Bardow, A.; Leitner, W. Sustainable Conversion of Carbon Dioxide: An Integrated Review of Catalysis and Life Cycle Assessment. Chem. Rev. 2018, 118, 434–504. [Google Scholar] [CrossRef]
  3. Olah, G.A. Towards Oil Independence through Renewable Methanol Chemistry. Angew. Chem. Int. Ed. 2013, 52, 104–107. [Google Scholar] [CrossRef]
  4. Ebrahimzadeh Sarvestani, M.; Norouzi, O.; Di Maria, F.; Dutta, A. From Catalyst Development to Reactor Design: A Comprehensive Review of Methanol Synthesis Techniques. Energy Convers. Manag. 2024, 302, 118070. [Google Scholar] [CrossRef]
  5. Salahudeen, N.; Rasheed, A.A.; Babalola, A.; Moses, A.U. Review on Technologies for Conversion of Natural Gas to Methanol. J. Nat. Gas Sci. Eng. 2022, 108, 104845. [Google Scholar] [CrossRef]
  6. Wan, Y.; Fang, F.; Sun, R.; Zhang, J.; Chang, K. Metal Oxide Semiconductors for Photothermal Catalytic CO2 Hydrogenation Reactions: Recent Progress and Perspectives. Acta Phys.-Chim. Sin. 2023, 39, 2212042. [Google Scholar] [CrossRef]
  7. Pan, Z.; Han, E.; Zheng, J.; Lu, J.; Wang, X.; Yin, Y.; Waterhouse, G.I.N.; Wang, X.; Li, P. Highly Efficient Photoelectrocatalytic Reduction of CO2 to Methanol by a p–n Heterojunction CeO2/CuO/Cu Catalyst. Nano-Micro Lett. 2020, 12, 18. [Google Scholar] [CrossRef]
  8. Cheng, Y.; Jabeen, S.; Lei, S.; Liu, N.; Liu, Y.; Liu, Y.; Li, Y.; Wu, X.; Tong, Z.; Yu, J.; et al. N-doped carbon dots-modulated interfacial charge transfer and surface structure in FeNbO4 photocatalysts for enhanced CO2 conversion selectivity to CH4. Chem. Eng. J. 2024, 498, 155576. [Google Scholar] [CrossRef]
  9. Wang, Q.; Wei, H.; Liu, P.; Su, Z.; Gong, X.-Q. Recent advances in copper-based catalysts for electrocatalytic CO2 reduction toward multi-carbon products. Nano Res. Energy 2024, 3, e9120112. [Google Scholar] [CrossRef]
  10. Gaikwad, R.; Bansode, A.; Urakawa, A. High-Pressure Advantages in Stoichiometric Hydrogenation of Carbon Dioxide to Methanol. J. Catal. 2016, 343, 127–132. [Google Scholar] [CrossRef]
  11. Sha, F.; Han, Z.; Tang, S.; Wang, J.; Li, C. Hydrogenation of Carbon Dioxide to Methanol over Non−Cu-Based Heterogeneous Catalysts. ChemSusChem 2020, 13, 6160–6181. [Google Scholar] [CrossRef]
  12. Beck, A.; Newton, M.A.; van de Water, L.G.A.; van Bokhoven, J.A. The Enigma of Methanol Synthesis by Cu/ZnO/Al2O3-Based Catalysts. Chem. Rev. 2024, 124, 4543–4678. [Google Scholar] [CrossRef]
  13. Zhong, J.; Yang, X.; Wu, Z.; Liang, B.; Huang, Y.; Zhang, T. State of the Art and Perspectives in Heterogeneous Catalysis of CO2 Hydrogenation to Methanol. Chem. Soc. Rev. 2020, 49, 1385–1413. [Google Scholar] [CrossRef]
  14. Murthy, P.S.; Liang, W.; Jiang, Y.; Huang, J. Cu-Based Nanocatalysts for CO2 Hydrogenation to Methanol. Energy Fuels 2021, 35, 8558–8584. [Google Scholar] [CrossRef]
  15. Cored, J.; Lopes, C.W.; Liu, L.; Soriano, J.; Agostini, G.; Solsona, B.; Sánchez-Tovar, R.; Concepción, P. Cu-Ga3+-Doped Wurtzite ZnO Interface as Driving Force for Enhanced Methanol Production in Co-Precipitated Cu/ZnO/Ga2O3 Catalysts. J. Catal. 2022, 407, 149–161. [Google Scholar] [CrossRef]
  16. Kordus, D.; Timoshenko, J.; Divins, N.J.; Chee, S.W.; Ortega, E.; Lopez Luna, M.; Hejral, U.; Etxebarria, A.; Roldan Cuenya, B. Cu–Ga Interactions and Support Effects in CO2 Hydrogenation to Methanol Catalyzed by Size-Controlled CuGa Nanoparticles Deposited on SiO2 and ZnO. ACS Catal. 2025, 15, 17241–17254. [Google Scholar] [CrossRef]
  17. Sloczyński, J.; Grabowski, R.; Olszewski, P.; Kozlowska, A.; Stoch, J.; Lachowska, M.; Skrzypek, J. Effect of Metal Oxide Additives on the Activity and Stability of Cu/ZnO/ZrO2, Catalysts in the Synthesis of Methanol from CO2 and H2. Appl. Catal. A Gen. 2006, 310, 127–137. [Google Scholar] [CrossRef]
  18. Ma, L.; Tran, T.; Wainwright, M.S. Methanol Synthesis from CO2 Using Skeletal Copper Catalysts Containing Co-Precipitated Cr2O3 and ZnO. Top. Catal. 2003, 22, 295–304. [Google Scholar] [CrossRef]
  19. Calverley, E.M.; Smitht, K.J. The Effects of Carbon Dioxide, Methanol, and Alkali Promoter Concentration on the Higher Alcohol Synthesis over a Cu/ZnO/Cr2O3 Catalyst. J. Catal. 1991, 130, 616–626. [Google Scholar] [CrossRef]
  20. Santana, C.S.; Rasteiro, L.F.; Marcos, F.C.F.; Assaf, E.M.; Gomes, J.F.; Assaf, J.M. Influence of Al, Cr, Ga, or Zr as Promoters on the Performance of Cu/ZnO Catalyst for CO2 Hydrogenation to Methanol. Mol. Catal. 2022, 528, 112512. [Google Scholar] [CrossRef]
  21. Zhu, J.; Ciolca, D.; Liu, L.; Parastaev, A.; Kosinov, N.; Hensen, E.J.M. Flame Synthesis of Cu/ZnO-CeO2 Catalysts: Synergistic Metal-Support Interactions Promote CH3OH Selectivity in CO2 Hydrogenation. ACS Catal. 2021, 11, 4880–4892. [Google Scholar] [CrossRef]
  22. Sun, Y.; Ren, J.; Zhang, S. Breaking the H2 Pressure Dependence in Hydrogenation through Interfacial *H Reservoirs on Cu–WO3 Catalysts. ACS Catal. 2025, 15, 14331–14340. [Google Scholar] [CrossRef]
  23. Zhou, G.; He, Z.; Dong, X. Role of Metal Oxides in Cu-Based Catalysts with NaBH4 Reduction for the Synthesis of Methanol from CO2/H2. Catal. Lett. 2021, 151, 1091–1101. [Google Scholar] [CrossRef]
  24. Wang, G.; Mao, D.; Guo, X.; Yu, J. Enhanced Performance of the CuO-ZnO-ZrO2 Catalyst for CO2 Hydrogenation to Methanol by WO3 Modification. Appl. Surf. Sci. 2018, 456, 403–409. [Google Scholar] [CrossRef]
  25. Wang, G.; Mao, D.; Guo, X.; Yu, J. Methanol Synthesis from CO2 Hydrogenation over CuO-ZnO-ZrO2-MxOy Catalysts (M = Cr, Mo and W). Int. J. Hydrogen Energy 2019, 44, 4197–4207. [Google Scholar] [CrossRef]
  26. Sung Lee, J.; Ik Moon, K.; Hoon Lee, S.; Young Lee, S.; Gul Kim, Y. Modified Cu/ZnO/Al2O3 Catalysts for Methanol Synthesis from CO2/H2 and CO/H2. Catal. Lett. 1995, 34, 93–99. [Google Scholar] [CrossRef]
  27. Saito, M.; Fujitani, T.; Watanabe, T.; Takeuchi, M.; Kanai, Y.; Moriya, K.; Kakumoto, T. Development of Cu/ZnO-Based High Performance Catalysts for Methanol Synthesis by CO2 Hydrogenation. Energy Convers. Manag. 1995, 36, 577–580. [Google Scholar] [CrossRef]
  28. Han, J.; Wang, L.; Yu, J.; Fan, M.; Mao, D. CO2 Hydrogenation to Methanol over Cu-CeO2-ZrO2 Catalysts: The Significant Effect of Metal-Support Interaction. Fuel 2025, 381, 133262. [Google Scholar] [CrossRef]
  29. Fritsch, C.; Dornseiffer, J.; Blankenstein, J.; Noyong, M.; Groteklaes, C.; Simon, U. CO2-Hydrogenation to Methanol over CuO/ZnO Based Infiltration Composite Catalyst Spheres. ChemCatChem 2024, 16, e202400731. [Google Scholar] [CrossRef]
  30. Chang, S.; Na, W.; Zhang, J.; Lin, L.; Gao, W. Effect of the Zn/Ce Ratio in Cu/ZnO-CeO2 Catalysts on CO2 Hydrogenation for Methanol Synthesis. New J. Chem. 2021, 45, 22814–22823. [Google Scholar] [CrossRef]
  31. Gómez, D.; Vergara, T.; Ortega, M.; Diaconescu, V.M.; Simonelli, L.; Concepción, P.; Jiménez, R.; Karelovic, A. Interdependence Between the Extent of Ga Promotion, the Nature of Active Sites, and the Reaction Mechanism Over Cu Catalysts for CO2 Hydrogenation to Methanol. ACS Catal. 2024, 14, 15265–15278. [Google Scholar] [CrossRef]
  32. Gómez, D.; Candia, C.; Jiménez, R.; Karelovic, A. Isotopic Transient Kinetic Analysis of CO2 Hydrogenation to Methanol on Cu/SiO2 Promoted by Ga and Zn. J. Catal. 2022, 406, 96–106. [Google Scholar] [CrossRef]
  33. Vergara, T.; Gómez, D.; Lacerda de Oliveira Campos, B.; Herrera Delgado, K.; Concepción, P.; Jiménez, R.; Karelovic, A. Combined Role of Ce Promotion and TiO2 Support Improves CO2 Hydrogenation to Methanol on Cu Catalysts: Interplay between Structure and Kinetics. J. Catal. 2023, 426, 200–213. [Google Scholar] [CrossRef]
  34. Ma, L.; Yan, L.; Lu, A.-H.; Ding, Y. Effect of Re promoter on the structure and catalytic performance of Ni–Re/Al2O3 catalysts for the reductive amination of monoethanolamine. RSC Adv. 2018, 8, 8152–8163. [Google Scholar] [CrossRef]
  35. Tong, Q.; Zong, A.; Gong, W.; Yu, L.; Fan, Y. Rhenium-promoted Pt/WO3/ZrO2: An efficient catalyst for aqueous glycerol hydrogenolysis under reduced H2 pressure. RSC Adv. 2016, 6, 86663–86672. [Google Scholar] [CrossRef]
  36. Waller, D.; Stirling, D.; Stone, F.S.; Spencer, M.S. Copper-zinc oxide catalysts. Activity in relation to precursor structure and morphology. Faraday Discuss. Chem. Soc. 1989, 87, 107–120. [Google Scholar] [CrossRef]
  37. Li, J.; Inui, T. Characterization of precursors of methanol synthesis catalysts, copper/zinc/aluminum oxides, precipitated at different pHs and temperatures. Appl. Catal. A Gen. 1996, 137, 105–117. [Google Scholar] [CrossRef]
  38. Behrens, M.; Brennecke, D.; Girgsdies, F.; Kißner, S.; Trunschke, A.; Nasrudin, N.; Zakaria, S.; Idris, N.F.; Hamid, S.B.A.; Kniep, B.; et al. Understanding the complexity of a catalyst synthesis: Co-precipitation of mixed Cu,Zn,Al hydroxycarbonate precursors for Cu/ZnO/Al2O3 catalysts investigated by titration experiments. Appl. Catal. A Gen. 2011, 392, 93–102. [Google Scholar] [CrossRef]
  39. Lunkenbein, T.; Schumann, J.; Behrens, M.; Schlögl, R.; Willinger, M.G. Formation of a ZnO Overlayer in Industrial Cu/ZnO/Al2O3 Catalysts Induced by Strong Metal–Support Interactions. Angew. Chem. Int. Ed. 2015, 127, 4627–4631. [Google Scholar] [CrossRef]
  40. Kuld, S.; Conradsen, C.; Moses, P.G.; Chorkendorff, I.; Sehested, J. Quantification of Zinc Atoms in a Surface Alloy on Copper in an Industrial-Type Methanol Synthesis Catalyst. Angew. Chem. Int. Ed. 2014, 53, 5941–5945. [Google Scholar] [CrossRef]
  41. Ullah Awan, S.; Hasanain, S.K.; Bertino, M.F.; Jaffari, G.H. Ferromagnetism in Li Doped ZnO Nanoparticles: The Role of Interstitial Li. J. Appl. Phys. 2012, 112, 103924. [Google Scholar] [CrossRef]
  42. Baltrusaitis, J.; Mendoza-Sanchez, B.; Fernandez, V.; Veenstra, R.; Dukstiene, N.; Roberts, A.; Fairley, N. Generalized Molybdenum Oxide Surface Chemical State XPS Determination via Informed Amorphous Sample Model. Appl. Surf. Sci. 2015, 326, 151–161. [Google Scholar] [CrossRef]
  43. Murugappan, K.; Anderson, E.M.; Teschner, D.; Jones, T.E.; Skorupska, K.; Román-Leshkov, Y. Operando NAP-XPS Unveils Differences in MoO3 and Mo2C during Hydrodeoxygenation. Nat. Catal. 2018, 1, 960–967. [Google Scholar] [CrossRef]
  44. Nag, N.K. A Comparative Study on the Dispersion and Carrier-Catalyst Interaction of Molybdenum Oxides Supported on Various Oxides by Electron Spectroscopy for Chemical Analysis. J. Phys. Chem. 1987, 91, 2324–2327. [Google Scholar] [CrossRef]
  45. Zheng, M.; Zhou, F.; Ma, H.; Songa, X.; Wu, G. Hydroxyapatite supported molybdenum oxide catalyst for selective dehydrogenation of cyclohexane to cyclohexene: Studies of dispersibility and chemical environment. RSC Adv. 2024, 14, 36461–36470. [Google Scholar] [CrossRef]
  46. Reddy, B.M.; Chowdhury, B.; Reddy, E.P.; Fernández, A. An XPS study of dispersion and chemical state of MoO3 on Al2O3-TiO2 binary oxide support. Appl. Catal. A Gen. 2001, 213, 279–288. [Google Scholar] [CrossRef]
  47. Morales-Mendoza, J.E.; Herrera-Pérez, G.; Fuentes-Cobas, L.; Hermida-Montero, L.A.; Pariona, N.; Paraguay-Delgado, F. Synthesis, Structural and Optical Properties of Cu Doped ZnO and CuO–ZnO Composite Nanoparticles. Nano-Struct. Nano-Objects 2023, 34, 100967. [Google Scholar] [CrossRef]
  48. Yu, T.; Zhao, X.; Shen, Z.X.; Wu, Y.H.; Su, W.H. Investigation of Individual CuO Nanorods by Polarized Micro-Raman Scattering. J. Cryst. Growth 2004, 268, 590–595. [Google Scholar] [CrossRef]
  49. Niaura, G. Surface-Enhanced Raman Spectroscopic Observation of Two Kinds of Adsorbed OH−Ions at Copper Electrode. Electrochim. Acta 2000, 45, 3507–3519. [Google Scholar] [CrossRef]
  50. Bodappa, N.; Su, M.; Zhao, Y.; Le, J.B.; Yang, W.M.; Radjenovic, P.; Dong, J.C.; Cheng, J.; Tian, Z.Q.; Li, J.F. Early Stages of Electrochemical Oxidation of Cu(111) and Polycrystalline Cu Surfaces Revealed by in Situ Raman Spectroscopy. J. Am. Chem. Soc. 2019, 141, 12192–12196. [Google Scholar] [CrossRef]
  51. Steimecke, M.; Araújo-Cordero, A.M.; Dieterich, E.; Bron, M. Probing Individual Cuprous Oxide Microcrystals towards Carbon Dioxide Reduction by Using In Situ Raman-Coupled Scanning Electrochemical Microscopy. ChemElectroChem 2022, 9, e202101221. [Google Scholar] [CrossRef]
  52. Mestl, G.; Srinivasan, T.K.K. Raman Spectroscopy of Monolayer-Type Catalysts: Supported Molybdenum Oxides. Catal. Rev. Sci. Eng. 1998, 40, 451–570. [Google Scholar] [CrossRef]
  53. Seguin, L.; Figlarz, M.; Cavagnat, R.; Lassègues, J.-C. Infrared and Raman Spectra of MoO3, Molybdenum Trioxides and MoO3, ·XH2O Molybdenum Trioxide Hydrates. Spectrochim. Acta Part A 1995, 51, 1323–1344. [Google Scholar] [CrossRef]
  54. Purans, J.; Kuzmin, A.; Cazzanelli, E.; Mariotto, G. Disorder-Induced Raman Scattering in Rhenium Trioxide (ReO3). J. Phys. Condens. Matter 2007, 19, 226206. [Google Scholar] [CrossRef]
  55. Castriota, M.; Cazzanelli, E.; Das, G.; Kalendarev, R.; Kuzmin, A.; Marino, S.; Mariotto, G.; Purans, J.; Scaramuzza, N. Proton Presence and Motion in Rhenium-Oxide Films and Their Application to Liquid-Crystalline Cells. Mol. Cryst. Liq. Cryst. 2007, 474, 1–15. [Google Scholar] [CrossRef]
  56. Stencel, J.M.; Makovsky, L.E.; Sarkus, T.A.; De Vries, J.; Thomas, R.; Moulijn, J.A. Raman Spectroscopic Investigation of the Effect of H2O on the Molybdenum Surface Species in MoO3/Al2O3 Catalysts. J. Catal. 1984, 90, 314–322. [Google Scholar] [CrossRef]
  57. Dieterle, M.; Weinberg, G.; Mestl, G. Raman Spectroscopy of Molybdenum Oxides—Part I. Structural Characterization of Oxygen Defects in MoO3-x by DR UV/VIS, Raman Spectroscopy and X-Ray Diffraction. Phys. Chem. Chem. Phys. 2002, 4, 812–821. [Google Scholar] [CrossRef]
  58. Mestl, G. In Situ Raman Spectroscopy—A Valuable Tool to Understand Operating Catalysts. J. Mol. Catal. A Chem. 2000, 158, 45–65. [Google Scholar] [CrossRef]
  59. Payen, E.; Kasztelan, S.; Grimblot, J.; Bonnelle, J.P. Surface Chemistry of MoO3/γ-Al2O3, Catalysts Studied by Laser Raman Spectroscopy: Hydration and Dehydration Reactions and Generalization to Other Supported Systems. J. Raman Spectrosc. 1986, 17, 233–241. [Google Scholar] [CrossRef]
  60. Dong, X.; Li, F.; Zhao, N.; Xiao, F.; Wang, J.; Tan, Y. CO2 Hydrogenation to Methanol over Cu/ZnO/ZrO2 Catalysts Prepared by Precipitation-Reduction Method. Appl. Catal. B Environ. 2016, 191, 8–17. [Google Scholar] [CrossRef]
  61. Chen, S.; Zhang, J.; Wang, P.; Wang, X.; Song, F.; Bai, Y.; Zhang, M.; Wu, Y.; Xie, H.; Tan, Y. Effect of Vapor-Phase-Treatment to CuZnZr Catalyst on the Reaction Behaviors in CO2 Hydrogenation into Methanol. ChemCatChem 2019, 11, 1448–1457. [Google Scholar] [CrossRef]
  62. Gao, P.; Li, F.; Zhan, H.; Zhao, N.; Xiao, F.; Wei, W.; Zhong, L.; Wang, H.; Sun, Y. Influence of Zr on the Performance of Cu/Zn/Al/Zr Catalysts via Hydrotalcite-like Precursors for CO2 Hydrogenation to Methanol. J. Catal. 2013, 298, 51–60. [Google Scholar] [CrossRef]
  63. Choi, Y.; Dong Sim, G.; Jung, U.; Park, Y.; Youn, M.H.; Chun, D.H.; Rhim, G.B.; Kim, K.Y.; Koo, K.Y. Copper catalysts for CO2 hydrogenation to CO through reverse water–gas shift reaction for e-fuel production: Fundamentals, recent advances, and prospects. Chem. Eng. J. 2024, 492, 152283. [Google Scholar] [CrossRef]
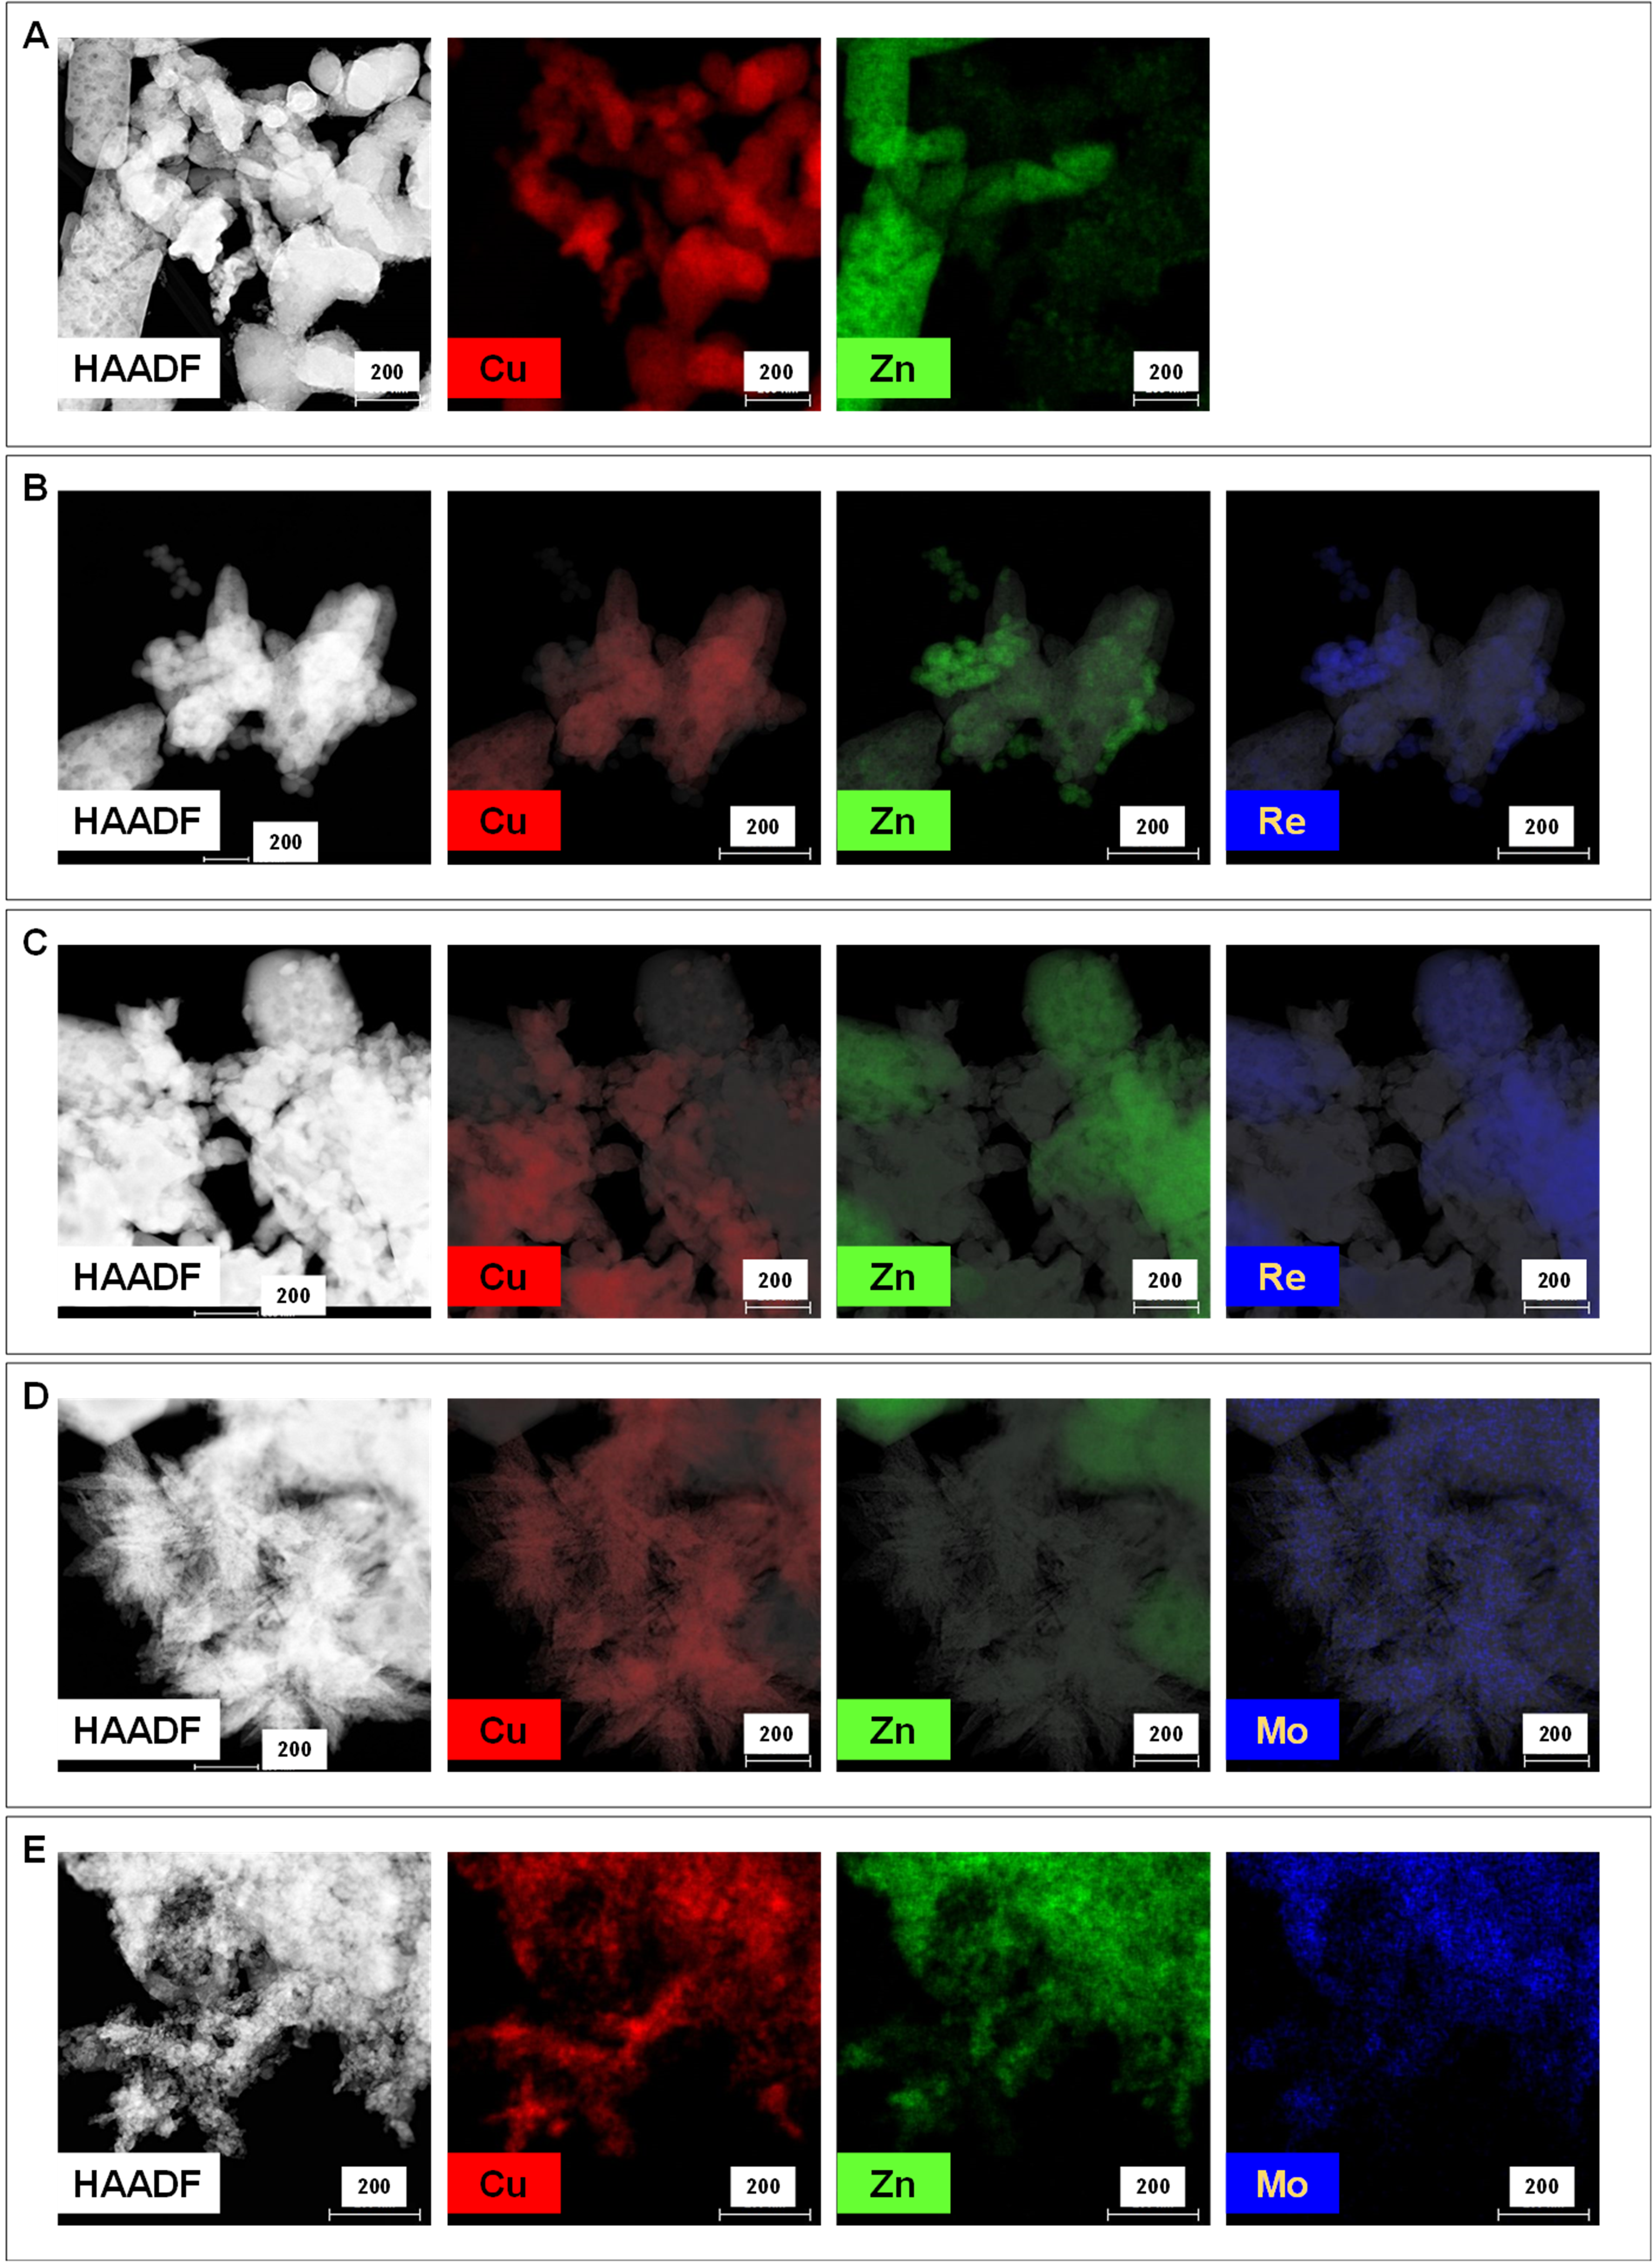
Figure 1. STEM-EDX microscopy studies on reduced CuZnMe-X catalysts: (A) CuZn; (B) CuZnRe-0.5; (C) CuZnRe-3.5; (D) CuZnMo-0.44; and (E) CuZnMo-3.5.
Nanomaterials 15 01730 g001
Figure 2. Temperature-programmed reduction (H2-TPR) studies in 10% H2/Ar flow on CuZnMe-X catalyst: (a) CuZn; (b) CuZnRe-0.06; (c) CuZnRe-0.50; (d) CuZnRe-3.50; (e) CuZnMo-0.06; (f) CuZnMo-0.44; and (g) CuZnMo-3.50.
Nanomaterials 15 01730 g002
Figure 3. In situ Raman spectroscopic studies on CuZnMe-X catalysts (recorded with 785 nm diode laser): (A,C) Raman spectra of rhenium-promoted samples and (B,D) Raman spectra of molybdenum-promoted samples. (A,B) Spectra of calcined samples, in air at 360 °C (above); (C,D) spectra of samples after in situ reduction in H2 at 200 °C (below). Catalysts: (-1-) CuZnRe-0.06; (-2-) CuZnRe-0.50; (-3-) CuZnRe-3.50; (-4-) CuZnMo-0.06; (-5-) CuZnMo-0.44; and (-6-) CuZnMo-3.50.
Nanomaterials 15 01730 g003
Figure 4. Initial reaction rate of (A) methanol and (B) CO formation expressed per surface area as a function of Re and Mo molar loading on CuZnRe-X and CuZnMo-X catalysts, respectively, at 240 °C. Reaction conditions: H2/CO2 = 3, 20 bar and a WHSV of 30000–3333 mL/h gcat. The black dots represent the un-promoted CuZn sample.
Nanomaterials 15 01730 g004
Figure 5. Methanol selectivity as a function of CO2 conversion for (A) CuZnRe-X and (B) CuZnMo-X catalysts in the CO2 hydrogenation reaction at 20 bar. Reaction conditions: H2/CO2 = 3, 240 °C, WHSV = 30000–3333 mL/h gcat.
Nanomaterials 15 01730 g005
Figure 6. Catalytic performance of CuZnMe-X-based catalysts in the CO2 hydrogenation at 20 bar and 240 °C: (A) evolution of conversion of CO2 with time on stream; and (B) evolution of methanol productivity, space time yield (in gCH3OH/h m2), with time on stream.
Nanomaterials 15 01730 g006
Table 1. Physico-chemical properties of un-promoted and Me-promoted CuZnMe-X (Me = Mo, Re) catalysts.
CatalystRatio
Cu/Me a
BET Surface Area
(m2/g) b
Crystallite Size, nm cH2-TPRN2O-TPR eXPS f
(2 0 0)
Facet of Cu0
(1 1 0)
Facet of ZnO
Maximum Temperature (°C) dµmol CuS/gcatµmol CuS/m2Cu/Zn RatioCu/Me RatioCu+/Cu0 Ratio f1
CuZn --10.123.143.8210.4100699.60.87--0.149
CuZnRe-0.0632819.217.040.1220.21730189.10.90--0.237
CuZnRe-0.504098.416.438.7238.62560303.90.6732.80.210
CuZnRe-3.50578.616.440.8202.31168135.80.9629.60.590
CuZnMo-0.06169013.713.741.0219.11668122.10.782.070.385
CuZnMo-0.4423928.48.348.8287.7166658.61.035.020.163
CuZnMo-3.502925.08.418.6350.8181572.50.770.800.157
a Cu/Me molar ratio in at% (Me = Re or Mo). b Samples calcined in air at 360 °C. c Samples reduced in H2 at 200 °C. d Temperature peak at higher signal intensity. e Cu atoms at the particle surface (CuS) determined from N2O chemisorption data. f Surface Cu/Zn and Cu/Me atomic ratio determined by XPS, and f1 the Cu+/Cu0 ratio was determined from the deconvolution of the Cu LMM Auger peak.
Table 2. Long-term deactivation constants (K) and crystallite size of CuZnMe-X-based catalysts.
Catalyst aK b
20 h
Ratio (KCuZn/KCuZnM-X) 20 h% c
20 h
K
80 h
Ratio (KCuZn/KCuZnM-X) 80 h% c
80 h
Crystallite Size, nm dCrystallite Size, nm a
(2 0 0)
Facet of Cu0
(1 1 0)
Facet of ZnO
(2 0 0)
Facet of Cu0
(1 1 0)
Facet of ZnO
CuZn0.164 1.0--0.1681.0--23.143.842.846.3
CuZnRe0.500.0871.947.00.0921.845.216.438.727.944.9
CuZnMo0.060.0662.559.80.1001.740.513.741.033.147.3
CuZnMo0.440.0305.581.70.0443.873.88.348.813.550.1
CuZnMo3.500.01610.390.30.0305.682.18.418.610.616.7
a Samples after reaction in CO2/H2 at 240 °C and 80 h. b Deactivation constants have been calculated by a polynomial fit of order 1 with respect to Ln (X-CO2(t=0)/X-CO2(t=x)) versus time. c Percentage of deactivation relative to the unpromoted CuZn catalyst. d Samples reduced in H2 at 200 °C.
Disclaimer/Publisher’s Note: The statements, opinions and data contained in all publications are solely those of the individual author(s) and contributor(s) and not of MDPI and/or the editor(s). MDPI and/or the editor(s) disclaim responsibility for any injury to people or property resulting from any ideas, methods, instructions or products referred to in the content.