Article

An Approach to the Optimization of Ba-Mn-Cu Perovskites as Catalysts for CO Oxidation: The Role of Cerium

by
Álvaro Díaz-Verde
and
María José Illán-Gómez
*
MCMA Group, Inorganic Chemistry Department, Materials Institute of the University of Alicante (IUMA), Faculty of Sciences, University of Alicante, 03690 Alicante, Spain
*
Author to whom correspondence should be addressed.
Nanomaterials 2025, 15(19), 1467; https://doi.org/10.3390/nano15191467
Submission received: 2 July 2025 / Revised: 16 September 2025 / Accepted: 22 September 2025 / Published: 25 September 2025
(This article belongs to the Section Energy and Catalysis)

Abstract

Two copper-containing perovskites Ba0.8Mn0.7Cu0.3O3 and Cu(4 wt%)/Ba0.7MnO3 (selected from previous studies) were tested as catalysts for the CO oxidation reaction under conditions similar to the found in the exhaust of last-generation automotive internal combustion engines. The Cu(4 wt%)/Ba0.7MnO3 sample has been selected due to its higher tolerance to CO2. In order to optimize the performance of this sample for the reaction under study, a Cu(2 wt%)Ce(2 wt%)/Ba0.7MnO3 formulation was synthesized, characterized and tested. The excellent catalytic performance of the bimetallic formulation, in terms of CO conversion at low temperatures and tolerance to CO2, is because cerium improves the redox properties and increases the proportion of reduced copper species on the surface compared to the Cu(4 wt%)/Ba0.7MnO3 sample.

Graphical Abstract

1. Introduction

Nowadays climate change, caused by the emission of greenhouse gases (GHGs) such as carbon dioxide (CO2), carbon monoxide (CO), nitrogen oxides (NOx) and methane (CH4) [1,2], is considered one of the most challenging global issues. Some of these GHGs are released by the internal combustion engines (ICEs) used for mobile applications, particularly in the automotive sector [3,4,5]. Thus, to reduce the environmental impact of emissions from this sector, several emerging decarbonization technologies are intended to be applied alongside the use of electric and hybrid engines and alternative fuels, such as, among others, the optimization of the combustion process (through, for example, the implementation of the oxy-fuel combustion technology) [6,7,8]. Despite these advances, ICEs based on fossil fuels will remain predominant in the automotive sector because the alternative technologies remain being very expensive and do not offer the maturity required for a widespread use [9,10,11].
An important tool to control the emission of pollutants from ICEs exhaust is based on the use of catalysts able to promote the conversion of CO, hydrocarbons (HCs), NOx and particulate matter into less harmful substances [12,13,14]. Focusing the attention on CO, which is a poisonous gas that causes high mortality rates [15,16], its removal is mainly based on the catalytic oxidation to CO2, being the most active catalytic formulations based on noble metals, such as Pt [17,18,19]. However, their high cost and tendency to sinter or to become poisoned are relevant drawbacks to overcome [20,21]. As an alternative, great efforts are being developed to obtain other catalytic formulations based on transition metal oxides, such as Mn, Co or Ni, that are more affordable and also catalytically efficient for the CO oxidation reaction [22,23,24].
In this context, perovskite-type oxides (ABO3) have been widely proposed as catalysts for the CO oxidation, as they are highly versatile solids due to their tunable properties that can be modified to promote changes in the redox properties, in the population of oxygen defects and in the oxygen mobility [25,26,27,28,29,30,31] by either adjusting the stoichiometry in the A-site (as La0.8MnO3, Sr0.9TiO3 or Sr0.7NbO3) and/or doping the B-site (such as LaCo1-xCuxO3), or by being used as supports of other active phases (MnOx/LaMnO3, NiO/CaZrO3 and NiO/LaFeO3. Considering the previous research developed by the authors, the induced Ba-deficiency in the BaMnO3 formulation improved the catalytic performance for the CO oxidation reaction [32]. In fact, Ba0.7MnO3 perovskite presented the best performance, as the generation of oxygen vacancies and the increase of the Mn (IV) fraction allowed improving the activation of CO and O2 [32]. Moreover, the role of Cu as promoter of Ba-Mn perovskites has also been proven [33,34]. Considering this background, two copper-containing perovskites (Ba0.8Mn0.7Cu0.3O3 and Cu(4 wt%)/Ba0.7MnO3) selected from previous studies of the authors [33,34] were tested as catalysts for the CO oxidation reaction under conditions closer to those found in the exhaust of last-generation automotive internal combustion engines. Subsequently, in order to further optimize the best formulation (Cu(4 wt%)/Ba0.7MnO3), the Cu(2 wt%)Ce(2 wt%)/Ba0.7MnO3 sample was synthesized, characterized and tested for the CO oxidation, in which the formation of the bimetallic Cu-Ce system is expected to improve the catalytic properties of the monometallic Cu-containing sample, due to the excellent properties of CeO2 such as its reducibility, its oxygen mobility and its strong interaction with Cu [35,36,37,38].

2. Materials and Methods

2.1. Synthesis and Characterization

The synthesis of the Ba0.7MnO3 (B0.7M-E), and Ba0.8Mn0.7Cu0.3O3 (B0.8MC) samples was performed via the sol-gel method adapted to aqueous medium [39,40], being the Cu4/B0.7M-E and Cu12/B0.7M-E samples obtained by the incipient wetness impregnation method [41,42]. The details of these synthesis procedures can be found in previous publications of the authors [32,33,34]. Briefly, the sol-gel procedure involves the formation of a gel from an aqueous solution containing the metal precursors (as nitrates), citric acid and EDTA (although the latter one is not employed for the synthesis of B0.8MC) as gelling and chelating agents, respectively. Subsequently, the gel is dried and calcined in order to obtain the powdered samples. The synthesis of the Cu(2 wt%), Ce(2 wt%)/Ba0.7MnO3 (Cu2Ce2/B0.7M-E) sample was carried out also by the incipient wetness impregnation method of the B0.7M-E support. For that, copper (II) nitrate trihydrate (Cu(NO3)2·3 H2O, Panreac, 99.0 wt%) and cerium (III) nitrate hexahydrate (Ce(NO3)3·6 H2O, Sigma-Aldrich, St. Louis, MO, USA, 99.0 wt%) were used as precursors. During the process, the support was impregnated with the appropriate volume of solution containing both precursors simultaneously. The wet perovskite was stirred for 24 h and at room temperature, dried at 90 °C for 24 h, and finally calcined at 600 °C for 3 h.
To determine the actual copper and cerium contents, the Inductively Coupled Plasma Optical Emission Spectroscopy (ICP-OES) technique was employed, using a Perkin-Elmer device model Optimal 4300 DV. The extraction of the metals consisted of a mineralization using a diluted aqua regia solution and stirring at 60 °C for 1 h until the dissolution of the samples was achieved.
For the identification of the crystalline structure of the samples, the X-Ray Diffraction (XRD) technique was used. The XRD patterns were recorded between 20° and 80° 2θ values with a step rate of 0.4°·min−1 and employing a Cu Kα (0.15418 nm) radiation in a Bruker D8-Advance device. The average crystal size and lattice strain values of the perovskite phases were determined by the Williamson-Hall method [43,44], calculating the Y-intercept and the slope of the regression line, respectively, according to the Equation (1).
B cos θ = ε(4 sin θ) + K λ D−1
where B corresponds to the full width at half maximum of the XRD peaks, ε is the lattice strain, K is the shape factor (set to 0.9), λ is the Cu Kα wavelength, and D is the average crystal size. Furthermore, the cell parameters of the perovskite phase were calculated according to the equation for the hexagonal system (Equation (2)) and using the (110) and (101) planes.
dhkl−2 = (4(h2 + hk + k2) (3a2)−1) + (l2 c−2)
being dhkl the interplanar spacing, hkl the Miller indexes, and a and c the cell parameters.
The morphology of the samples and the distribution of the chemical species was analyzed by electronic microscopy, using a ZEISS Merlin VP Compact for Field Emission Scanning Electron Microscopy (FE-SEM) combined with Energy Dispersive X-ray spectroscopy (EDX). For obtaining the FE-SEM images, a voltage of 2 kV (resolution of 1.5 nm) is applied, meanwhile, for those obtained by applying EDX, a voltage of 15 kV (resolution of 0.8 nm) is used.
The surface characterization of the samples was conducted by X-ray Photoelectron Spectroscopy (XPS), using a K-Alpha Photoelectron Spectrometer by Thermo-Scientific, with an Al Kα (1486.7 eV) radiation source. During the analyses, the pressure of the analysis chamber was maintained at 5·10−10 mbar. The binding energy and kinetic energy scales were calibrated by setting the C 1s transition at 284.6 eV, and the deconvolution of the resulting XPS profiles was performed with the Thermo Avantage software (v5.9929). During the experiments, the Ba 3d5/2, Mn 2p3/2, Mn 2p1/2 (data in Table S1 and Figure S1 of the Supplementary Information File) Mn 3p, O 1s, Cu 2p3/2, Cu L3M4.5M4.5 Auger signal, and Ce 3d transitions were analyzed. For the determination of the contribution of the different surface Cu species, the deconvolutions of the Cu L3M4.5M4.5 Auger signals for Cu, Cu2O and CuO references (Table S2 and Figure S2 of the Supplementary Information File), proposed by R. Peter and M. Petravic [45], have been used. After, they were adjusted according to the Auger signals registered for our samples.
The reducibility of the samples was explored with the Temperature-Programmed Reduction with H2 (H2-TPR) technique, which was carried out in a ChemBET Pulsar TPR/TPD device from Quantachrome Instruments (Anton Paar Austria GmbH, Graz, Austria), equipped with a Thermal Conductivity Detector (TCD). During the experiments, 30 mg of sample where heated at 10 °C·min−1 from 25 to 1000 °C under a 5% H2/Ar atmosphere (40 mL·min−1). The amount of H2 consumed was quantified by using a copper (II) oxide (CuO, Sigma-Aldrich, 99.9 wt%) reference sample, which is reduced according to Reaction (3) [46].
CuO + H2 → Cu + H2O
O2 Temperature-Programmed Desorption (O2-TPD) tests were conducted in a Thermo Gravimetric Mass Spectrometer (TG-MS) system (Q-600-TA and Thermostar from Balzers Instruments (Pfeiffer Vacuum GmbH, Asslar, Germany), respectively). For the experiments, 16 mg of sample were heated at 10 °C·min−1 from room temperature to 950 °C under a 100 mL·min−1 of He. Prior to the experiments, each sample underwent a pretreatment at 150 °C for 1 h to remove the moisture. To follow the O2 evolved during the experiments, the 32 m/z signal was monitored. The quantification of the amount of oxygen evolved was performed by using a CuO reference sample, which decomposes into Cu2O (under in the experimental conditions used), according to Reaction (4) [47].
4 CuO → 2 Cu2O + O2

2.2. Activity Tests

To determine the catalytic activity for the CO oxidation, Temperature-Programmed Reaction with CO (CO-TPRe) experiments were conducted using a gas mixture composed of 1% CO and 1% O2 in He, as an approximation to the CO partial pressure under the actual Three-Way Catalysts (TWCs) working conditions [48]. For the experiments, 50 mg of sample and 100 mg of SiC were loaded into a U-shaped quartz reactor, which was subjected to a heating rate of 10 °C·min−1 until 500 °C under a 100 mL·min−1 flow (Gas Hourly Space Velocity (GHSV) of 4967 h−1) of the gas mixture. Prior to the CO-TPRe tests, the sample-SiC mixture was pretreated for 1 h at 600 °C under a 5% O2/He gas mixture to clean the surface of the samples. The commercial 1% Pt/Al2O3 sample (Sigma-Aldrich), used as a reference, was not subjected to the pretreatment in order to minimize the Pt sintering [49]. On the other hand, some selected samples were subjected to stability tests consisting of one or two reaction cycles at 250 and 300 °C (for 5 h). Finally, to test the selected samples under conditions even closer to that of TWCs, CO2 (15%) was included in the reactant mixture and long-term cycles of 5 h and 20 h were performed. Before each cycle, the sample was subjected to the preheating treatment previously described. For the determination of the gaseous stream composition, an Agilent 8860 Gas Chromatograph, equipped with a TCD and two packed columns (Porapak-Q and MolSieve-13X from Agilent Technologies Spain, Madrid, Spain), was used. The percentage of CO conversion (CCO) was calculated by the Equation (5):
CCO (%) = (COinCOout) (COin)−1 · 100
being COin and COout the inlet and outlet molar flow rates, respectively. Additionally, the change of the CO conversion (ΔCCO) and the CO specific activity (aCO) values during the stability tests were calculated by using the Equations (6) and (7):
ΔCCO (%) = CCO,fCCO,i
aCO = (COinCOout) (nCu)−1
where CCO,f and CCO,i are the final and initial CO conversions during the isothermal test, respectively; and nCu the number of moles of Cu in the sample. The CO signals recorded by the gas chromatograph were calibrated by using a calibration gas mixture composed by 5083 ± 102 ppm Ar, 5.491 ± 0.055% CO in He (expanded error with a coverage factor (k) of 2).

3. Results and Discussion

3.1. Selection of the Perovskites

Previous studies focused on the catalyzed CO oxidation reaction developed by the authors [33,34] revealed that:
*
From a Cu/Ba0.7MnO3 series of samples, with nominal Cu contents of 4, 8 and 12 wt% (denoted as Cux/B0.7M-E, x = 4, 8 and 12), the Cu4/B0.7M-E and Cu12/B0.7M-E formulations feature the best catalytic performance as they present a high proportion of Cu species with a strong interaction with the perovskite support [34].
*
From the BaxMn0.7Cu0.3O3 series of samples (with x = 1, 0.9, 0.8 and 0.7), the Ba0.8Mn0.7Cu0.3O3 composition (denoted as B0.8MC) shows the best catalytic behavior due to its high amount of Mn (IV) ions, oxygen vacancies and reduced copper species (Cu (I)), that are more active than oxidized Cu species (Cu (II)) [33].
Considering these findings, in this paper we compare the B0.8MC perovskite with Cu4/B0.7M-E and Cu12/B0.7M-E samples, in order to determine a potential effect of the Cu loading method on the catalytic performance for the CO oxidation reaction. The most relevant characterization and activity data for these three samples are summarized in Table 1 and Figure 1.
Both Cu-impregnated samples exhibit a higher CO specific activity than B0.8MC under the conditions tested, suggesting that the impregnation method is the most effective for achieving a high activity and stability. According to the characterization data, the two samples obtained by impregnation present a higher fraction of Mn (IV) on the surface than the B0.8MC perovskite [50], showing Cu12/B0.7M-E also a higher amount of surface copper species, as indicates the Cu/(Ba+Mn+Cu) ratio (which provides information about the distribution of the Cu species on the samples [51]). This is because the XPS ratio is higher than the nominal one for the Cu12/B0.7M-E sample, meanwhile the opposite is found for the B0.8MC perovskite. Additionally, in order to select one of the two perovskites obtained by impregantion, it was considered that the fraction of copper with a strong interaction with the perovskite is a key factor for achieving a high CO conversion [32,33,34]. Thus, as the Cusi/Cuwi ratio (being Cusi and Cuwi the contributions of the Cu species with strong and weak interactions with the support, respectively) is higher for the Cu4/B0.7M-E sample than for Cu12/B0.7M-E and, as both samples feature a similar reducibility (see the H2-TPR data in Table 1), Cu4/B0.7M-E has been finally selected to be compared with B0.8MC for the CO oxidation reaction under more demanding conditions than those used in the previous publications [33,34]. To achieve this purpose, the following CO oxidation tests have been developed:
(i)
for testing the stability of the samples at a temperature lower than 300 °C, two reaction cycles at 250 °C under the 1% CO, 1% O2 in He reactant mixture.
(ii)
in order to determine the tolerance of the catalysts to CO2 [25], a CO oxidation reaction at 300 °C using the 1% CO, 1% O2 in He reactant mixture, in which a 15% of CO2 was added to simulate the average composition typically found in the actual gasoline exhaust.

3.2. Effect of the Reaction Temperature for the CO Oxidation

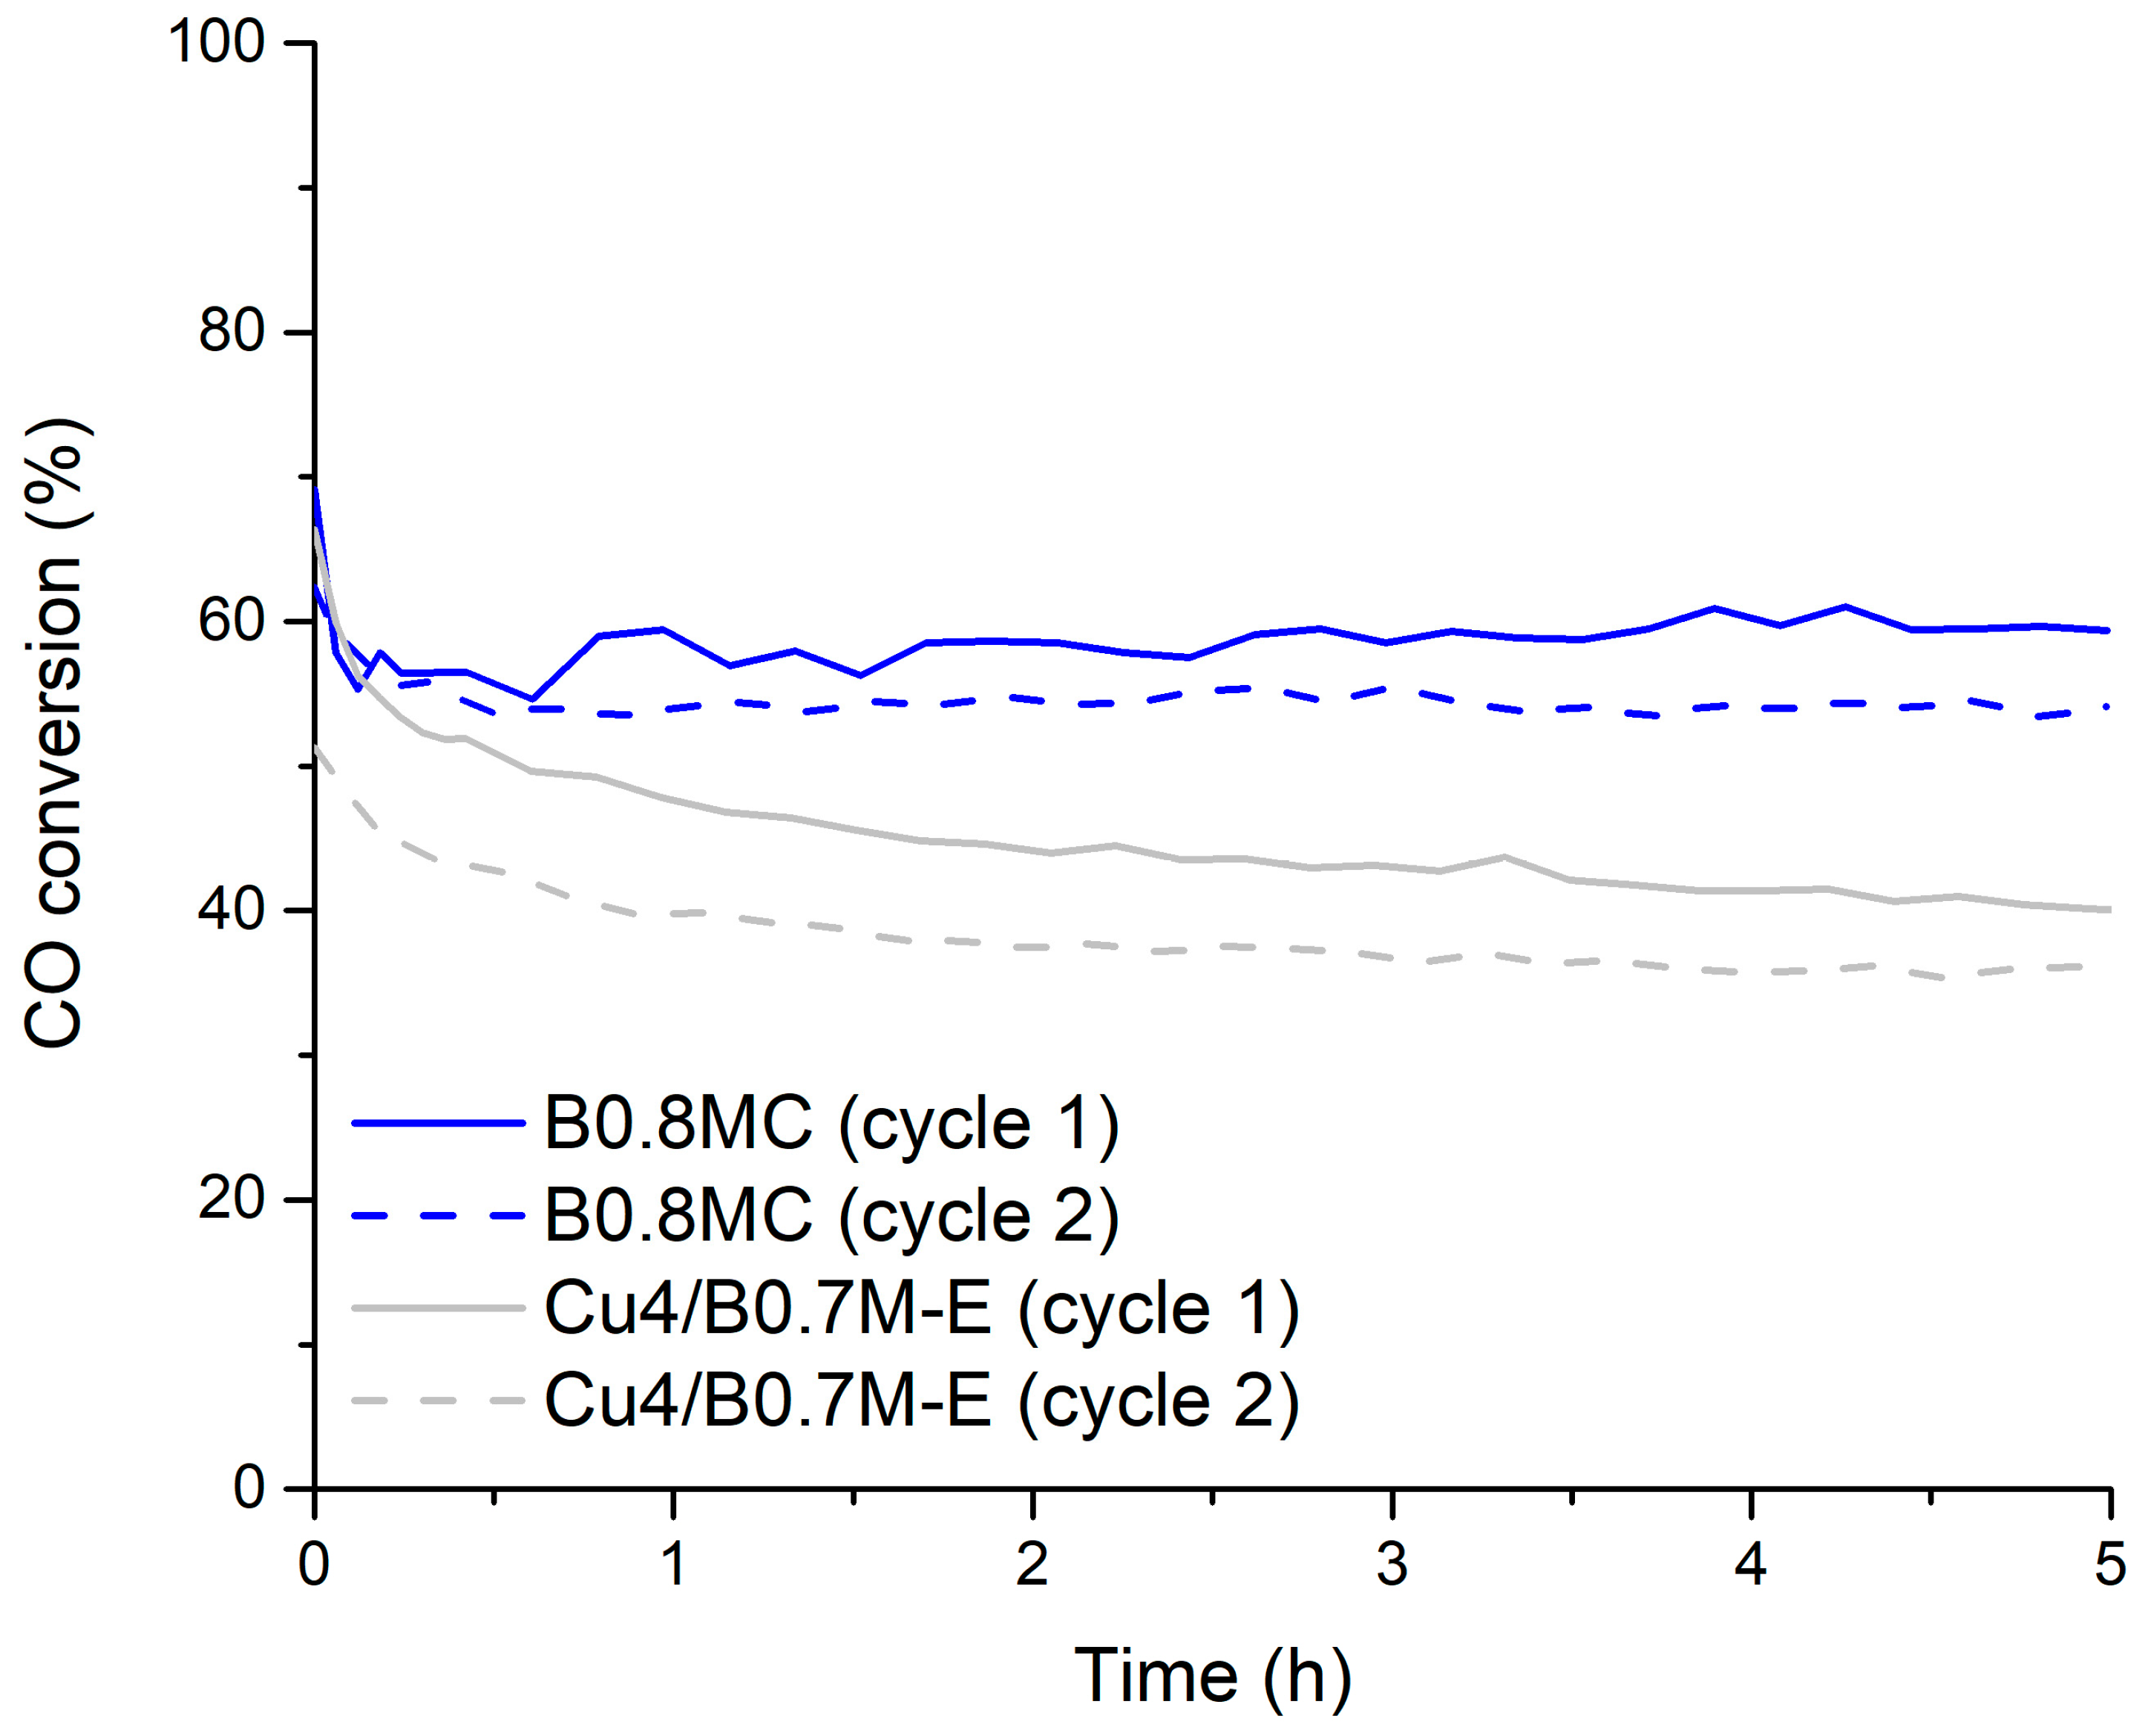
Figure 2 shows the CO conversion profiles at 250 °C, under the 1% CO, 1% O2 in He reactant mixture, being the related data displayed in Table 2. During the two reaction cycles at 250 °C, B0.8MC features higher CO conversions than Cu4/B0.7M-E, but the CO specific activity is lower for the former due its higher Cu percentage (8.845 wt% versus 3.946 wt% for B0.8MC and Cu4/B0.7M-E, respectively). Note that, for both samples, the CO conversion is slightly lower in the second cycle and, even though both samples present a good stability versus time, Cu4/B0.7M-E exhibits a slightly more pronounced deactivation with time than B0.8MC.
The CO conversion at 250 °C of B0.8MC is lower than the published by Y. Yang [52] for a LaCo0.9Ni0.1O3 perovskite tested at 270 °C under a 1% CO, 2% O2 in He reactant atmosphere (approximately 90% after 5 h of reaction), which should be consequence of the higher reaction temperature (270 °C versus 250 °C) and of the excess of O2 (2% versus 1%). However, the catalytic performance of B0.8MC is better than the registered for a series of LaNiO3 perovskites calcined at different temperatures (600–800 °C) at 200 °C and under a similar reactant atmosphere [53], probably due to the higher reaction temperature used (250 °C versus 200 °C)
In order to understand the trend in the catalytic performances shown by the two samples, a deep characterization of the samples used in the two reaction cycles (denoted as used samples) has been carried out.
The XPS data of the fresh and used samples are collected in Table 3 for a direct comparison. The lower values of the Mn(IV)/Mn(III) and of the OL/(Ba+Mn(+Cu)) ratios for both used samples indicate that, during the reaction at 250 °C, a decrease in the proportion of surface Mn (IV) and an increase in the amount of surface oxygen defects/vacancies takes place. The Cu/(Ba+Mn+Cu) ratios of the fresh and used samples are similar, suggesting that the distribution of the copper species is not significantly modified during the reaction. Finally, the lower value of the BaCO3/BaL ratio (which informs about the presence of carbonate groups on the surface) reveals that the Cu4/B0.7M-E sample presents a lower degree of carbonation after the reaction. Thus, as for both samples the amount of surface oxygen vacancies (which act as active sites for oxygen activation) increases, but the Mn (IV) surface proportion decreases (more significantly for Cu4/B0.7M-E than for B0.8MC), it seems that the latter factor is more relevant for determining the catalytic performance than the former.
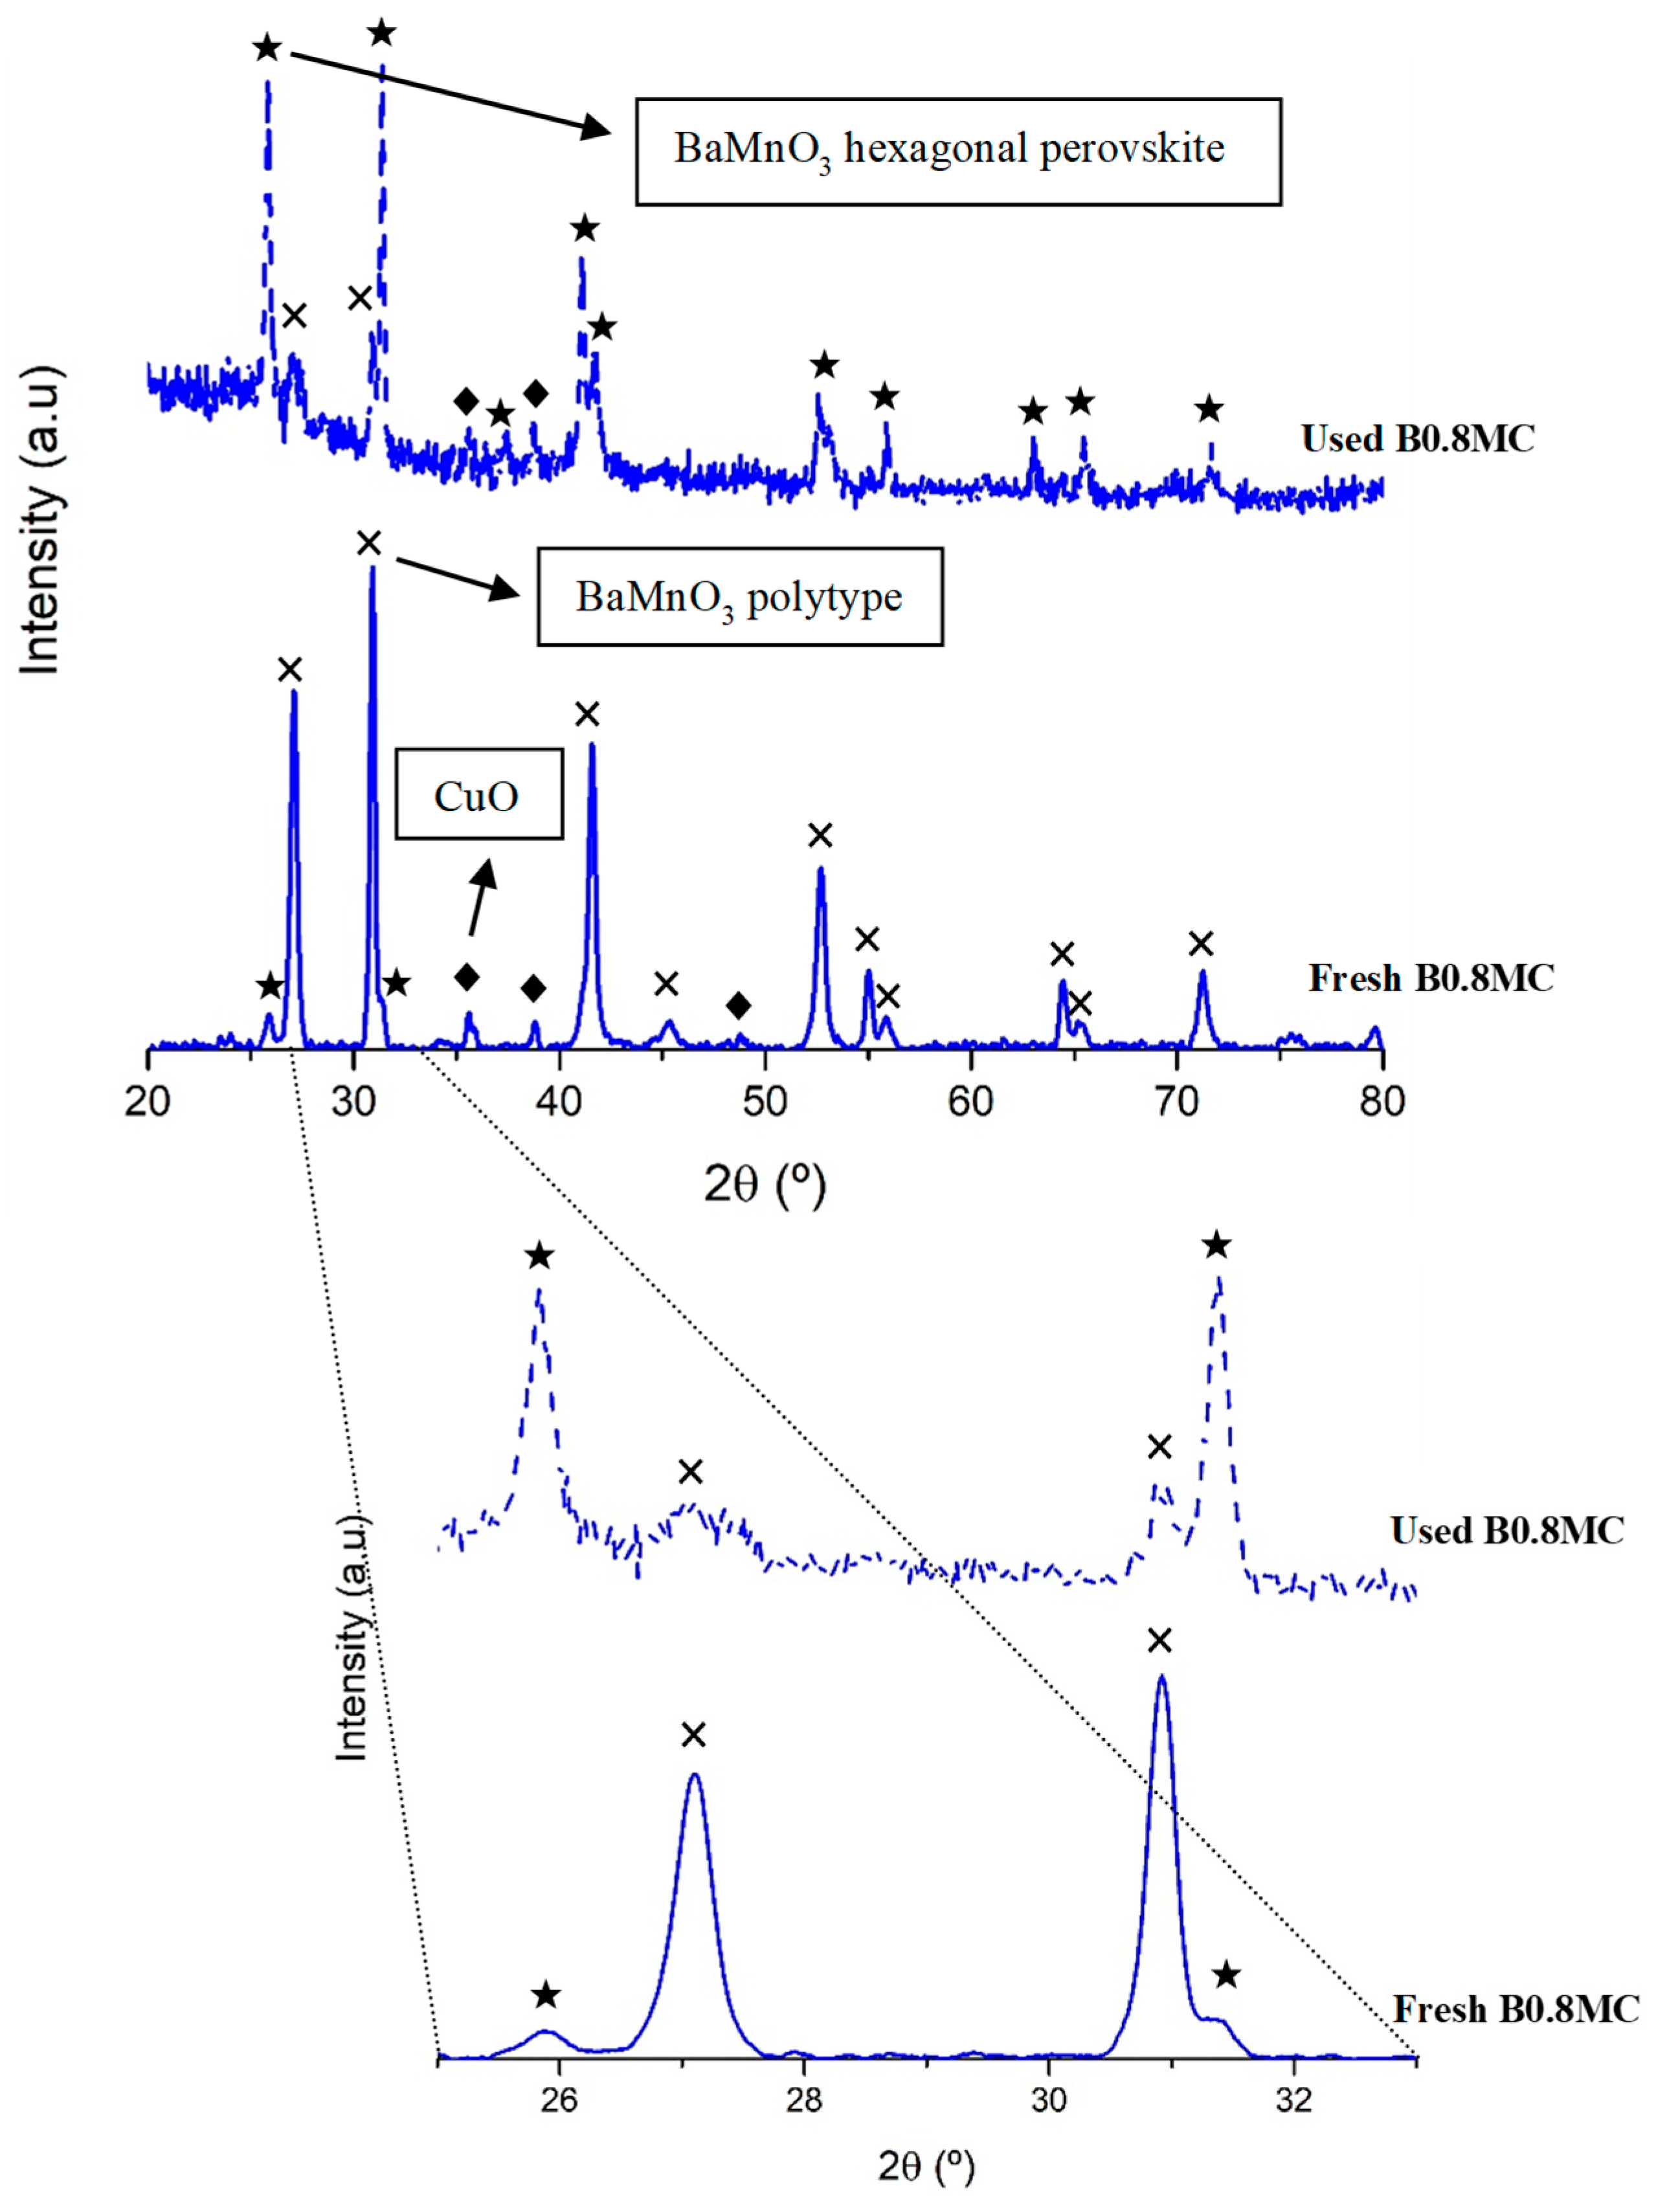
To deeper explore the changes of the surface Cu species during the reaction at 250 °C, the Cu L3M4.5M4.5 Auger signal of the used samples has been analyzed [54,55]. As the data in Table 3 reveal, the higher stability shown by the B0.8MC sample seems being due to the presence of Cu (I) species along the reaction time [56] as the Auger signal appears at the same position for the fresh and used samples. Note that, for the B0.8MC sample, Cu (I) and Cu (II) species coexist on the surface since the characteristic satellite peaks of Cu (II) in the Cu 2p3/2 spectrum are detected [57,58]. Additionally, by comparing the XRD patterns of the fresh and used B0.8MC formulation (Figure 3), it seems that an exsolution of the Cu species to the surface is taking place during the reaction, as a transition of the main crystalline phase from the polytype perovskite (which is a distortion of the corresponding hexagonal perovskite promoted by the insertion of Cu into the perovskite network [59]) to the BaMnO3 hexagonal perovskite structure is detected. This result aligns with the change in the percentages of the surface Cu species, estimated by using the Cu L3M4.5M4.5 Auger signal (Table 3), as a decrease of the proportion of Cu species with a strong interaction with the perovskite (as consequence of the observed exsolution) is detected. On the other hand, for the fresh Cu4/B0.7M-E formulation, the Auger signal could be assigned both to Cu (0) or Cu (II) [56], being the latter one the most probable considering the sample background [34]. However, for the used Cu4/B0.7M-E sample, the Auger signal is shifted suggesting the presence of Cu (I), which is confirmed by the evolution of the percentages obtained with the Auger signal. So, as Cu (I) is more effective than Cu (II) for the CO activation [60,61], a gradual increase of the CO conversion would be expected for the Cu4/B0.7M-E sample. However, the CO conversion follows just the opposite trend. Note that, a decrease of the CO conversion would be expected if a higher proportion of Cu is present on the surface of the impregnated sample, as larger Cu particles (so, more agglomerated) should be formed. However, the Cu/(Ba+Mn+Cu) ratio of the used Cu4/B0.7M-E does not support this hypothesis.
In summary, the decrease of the proportion of Mn (IV) on the surface of the Cu4/B0.7M-E sample seems to cause the slight loss of CO conversion along the reaction time. Meanwhile, the presence of Cu (I) on the B0.8MC fresh and used samples seems justifying its better catalytic performance.

3.3. Tolerance to CO2

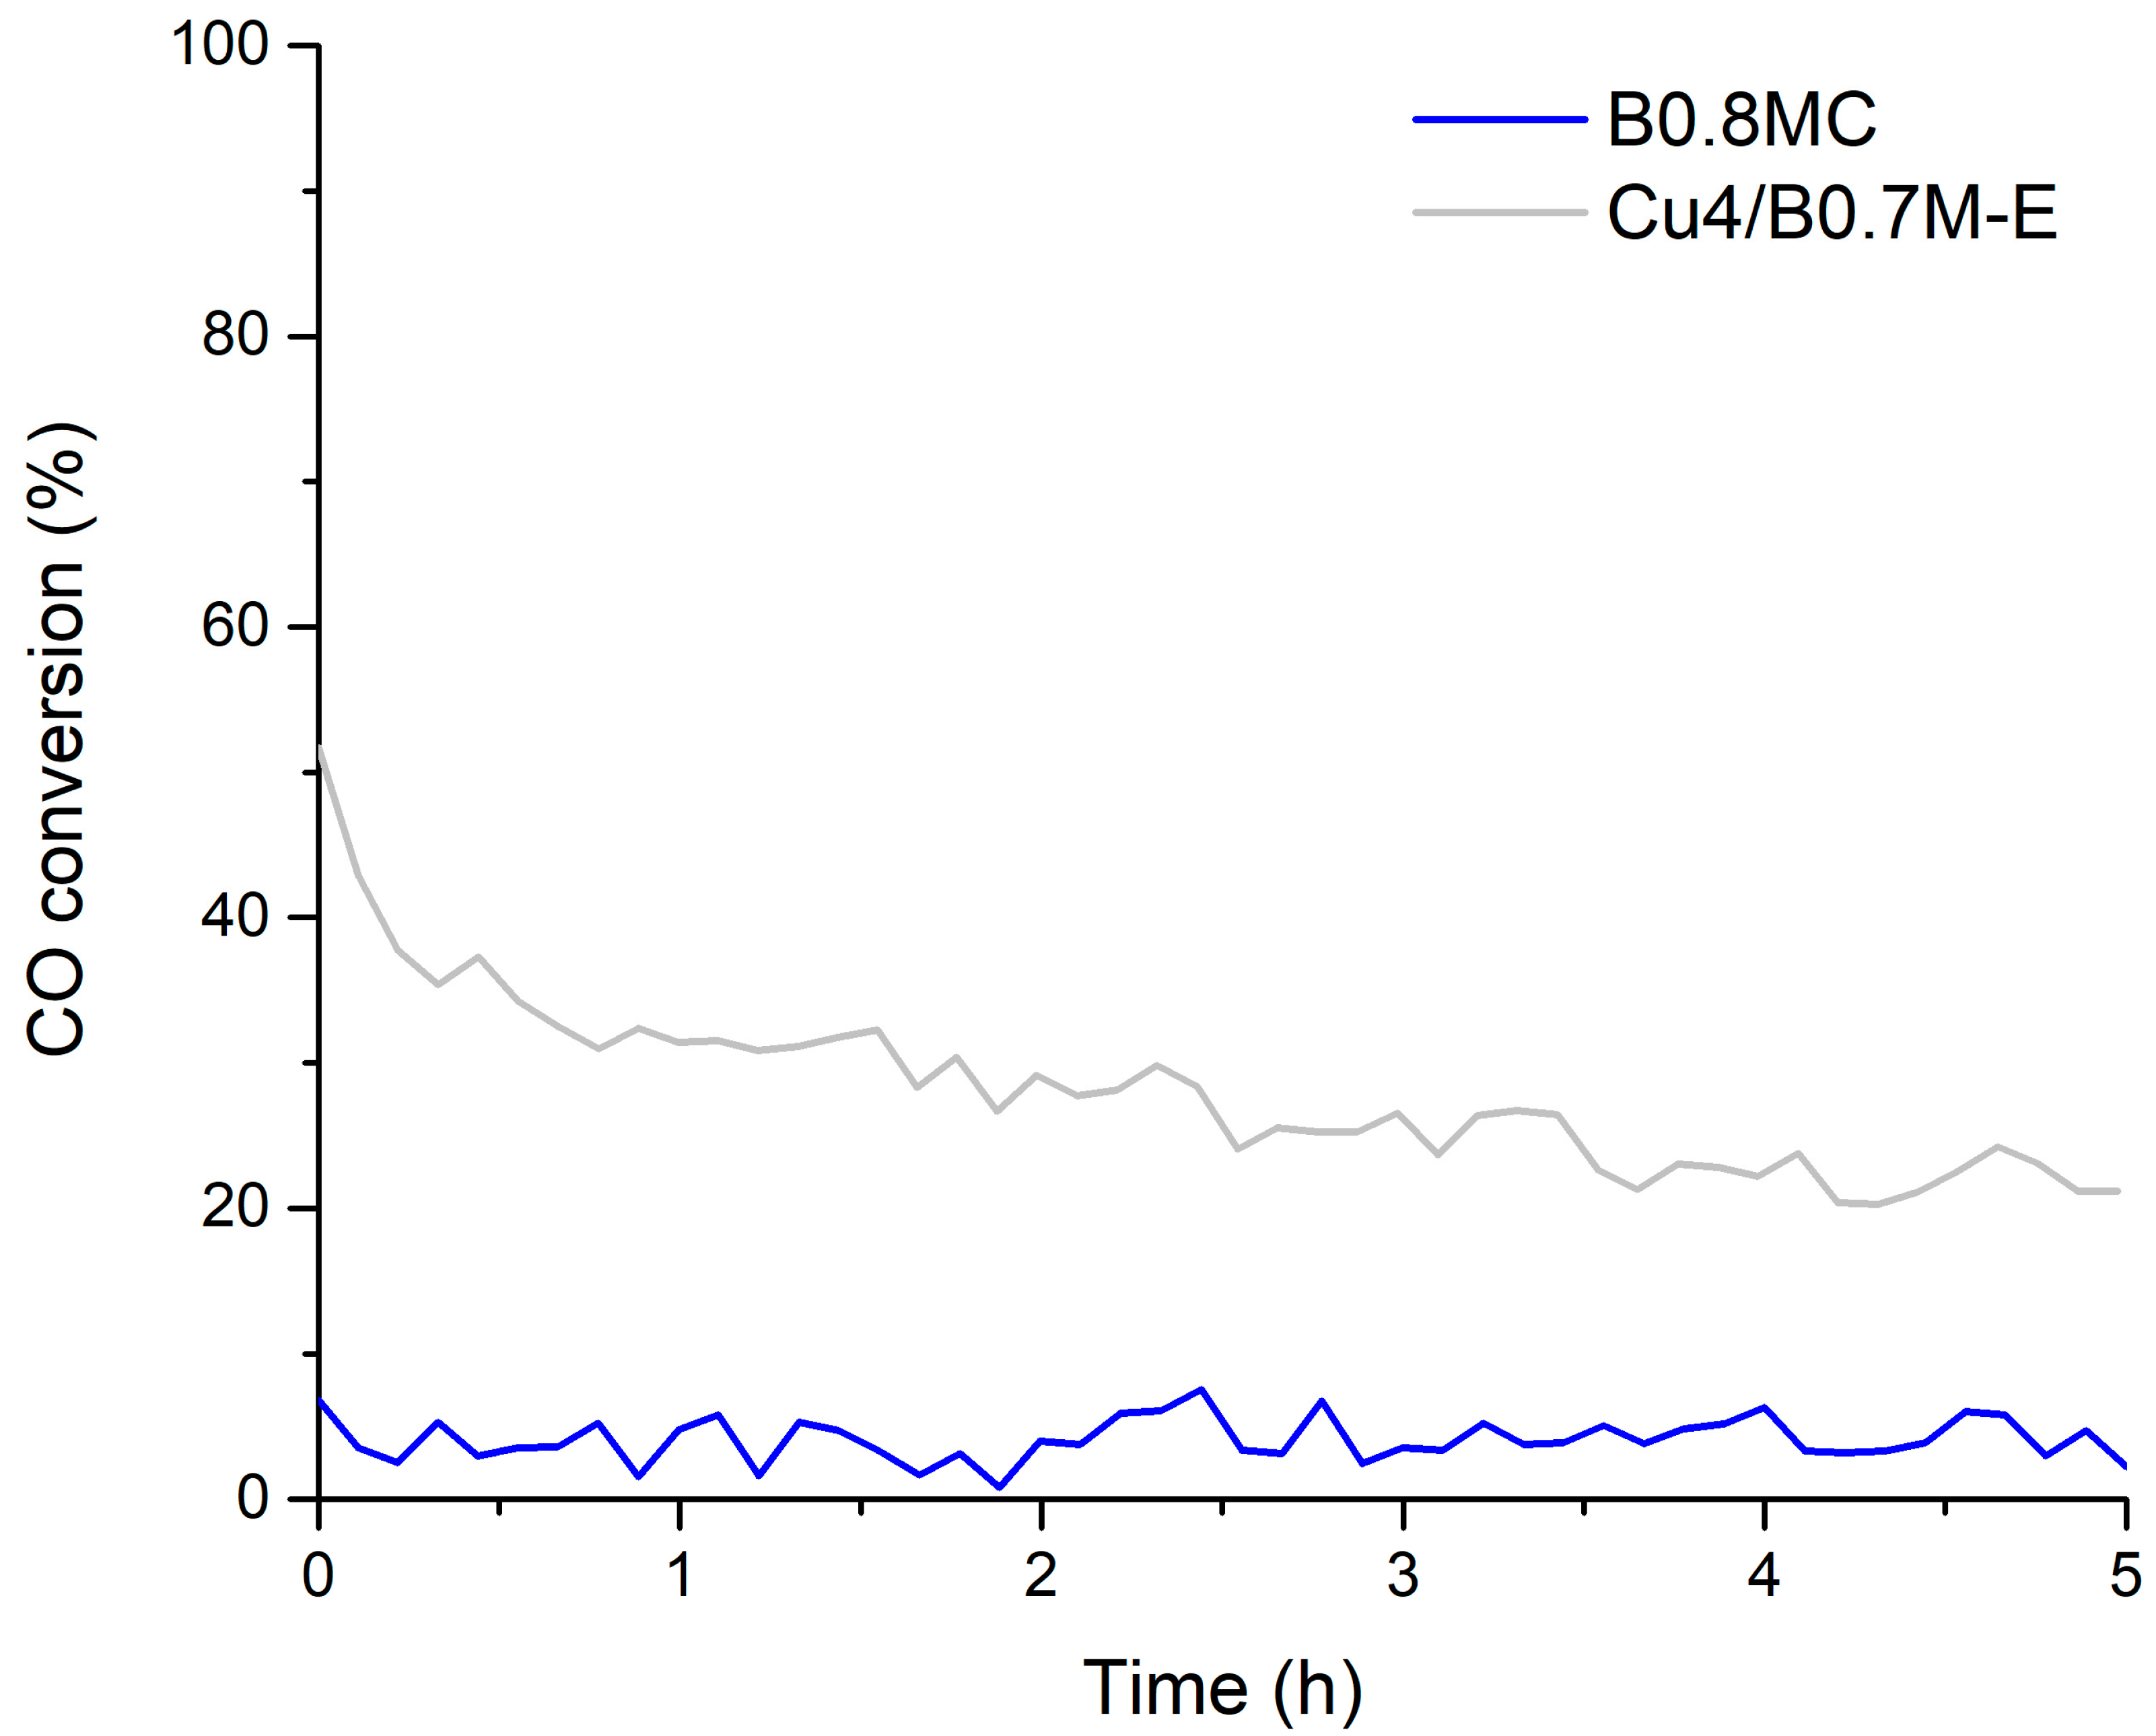
Figure 4 and Table 4 display the data obtained for the CO oxidation at 300 °C in the presence of CO2. Both samples undergo a clear deactivation as the CO conversions and the CO specific activities are significantly lower than in the absence of CO2 (see Figure 1 and Table 1). Similar results are published in the literature for perovskite and spinel-type samples, being the inhibition of CO2 assigned to the competition of CO and CO2 by the same adsorption sites, and to the formation of carbonate groups after CO2 adsorption [62,63,64]. However, the tolerance to CO2 of the Cu4/B0.7M-E sample is higher than that of the B0.8MC one, which becomes to be completely inactive at the end of the reaction time.
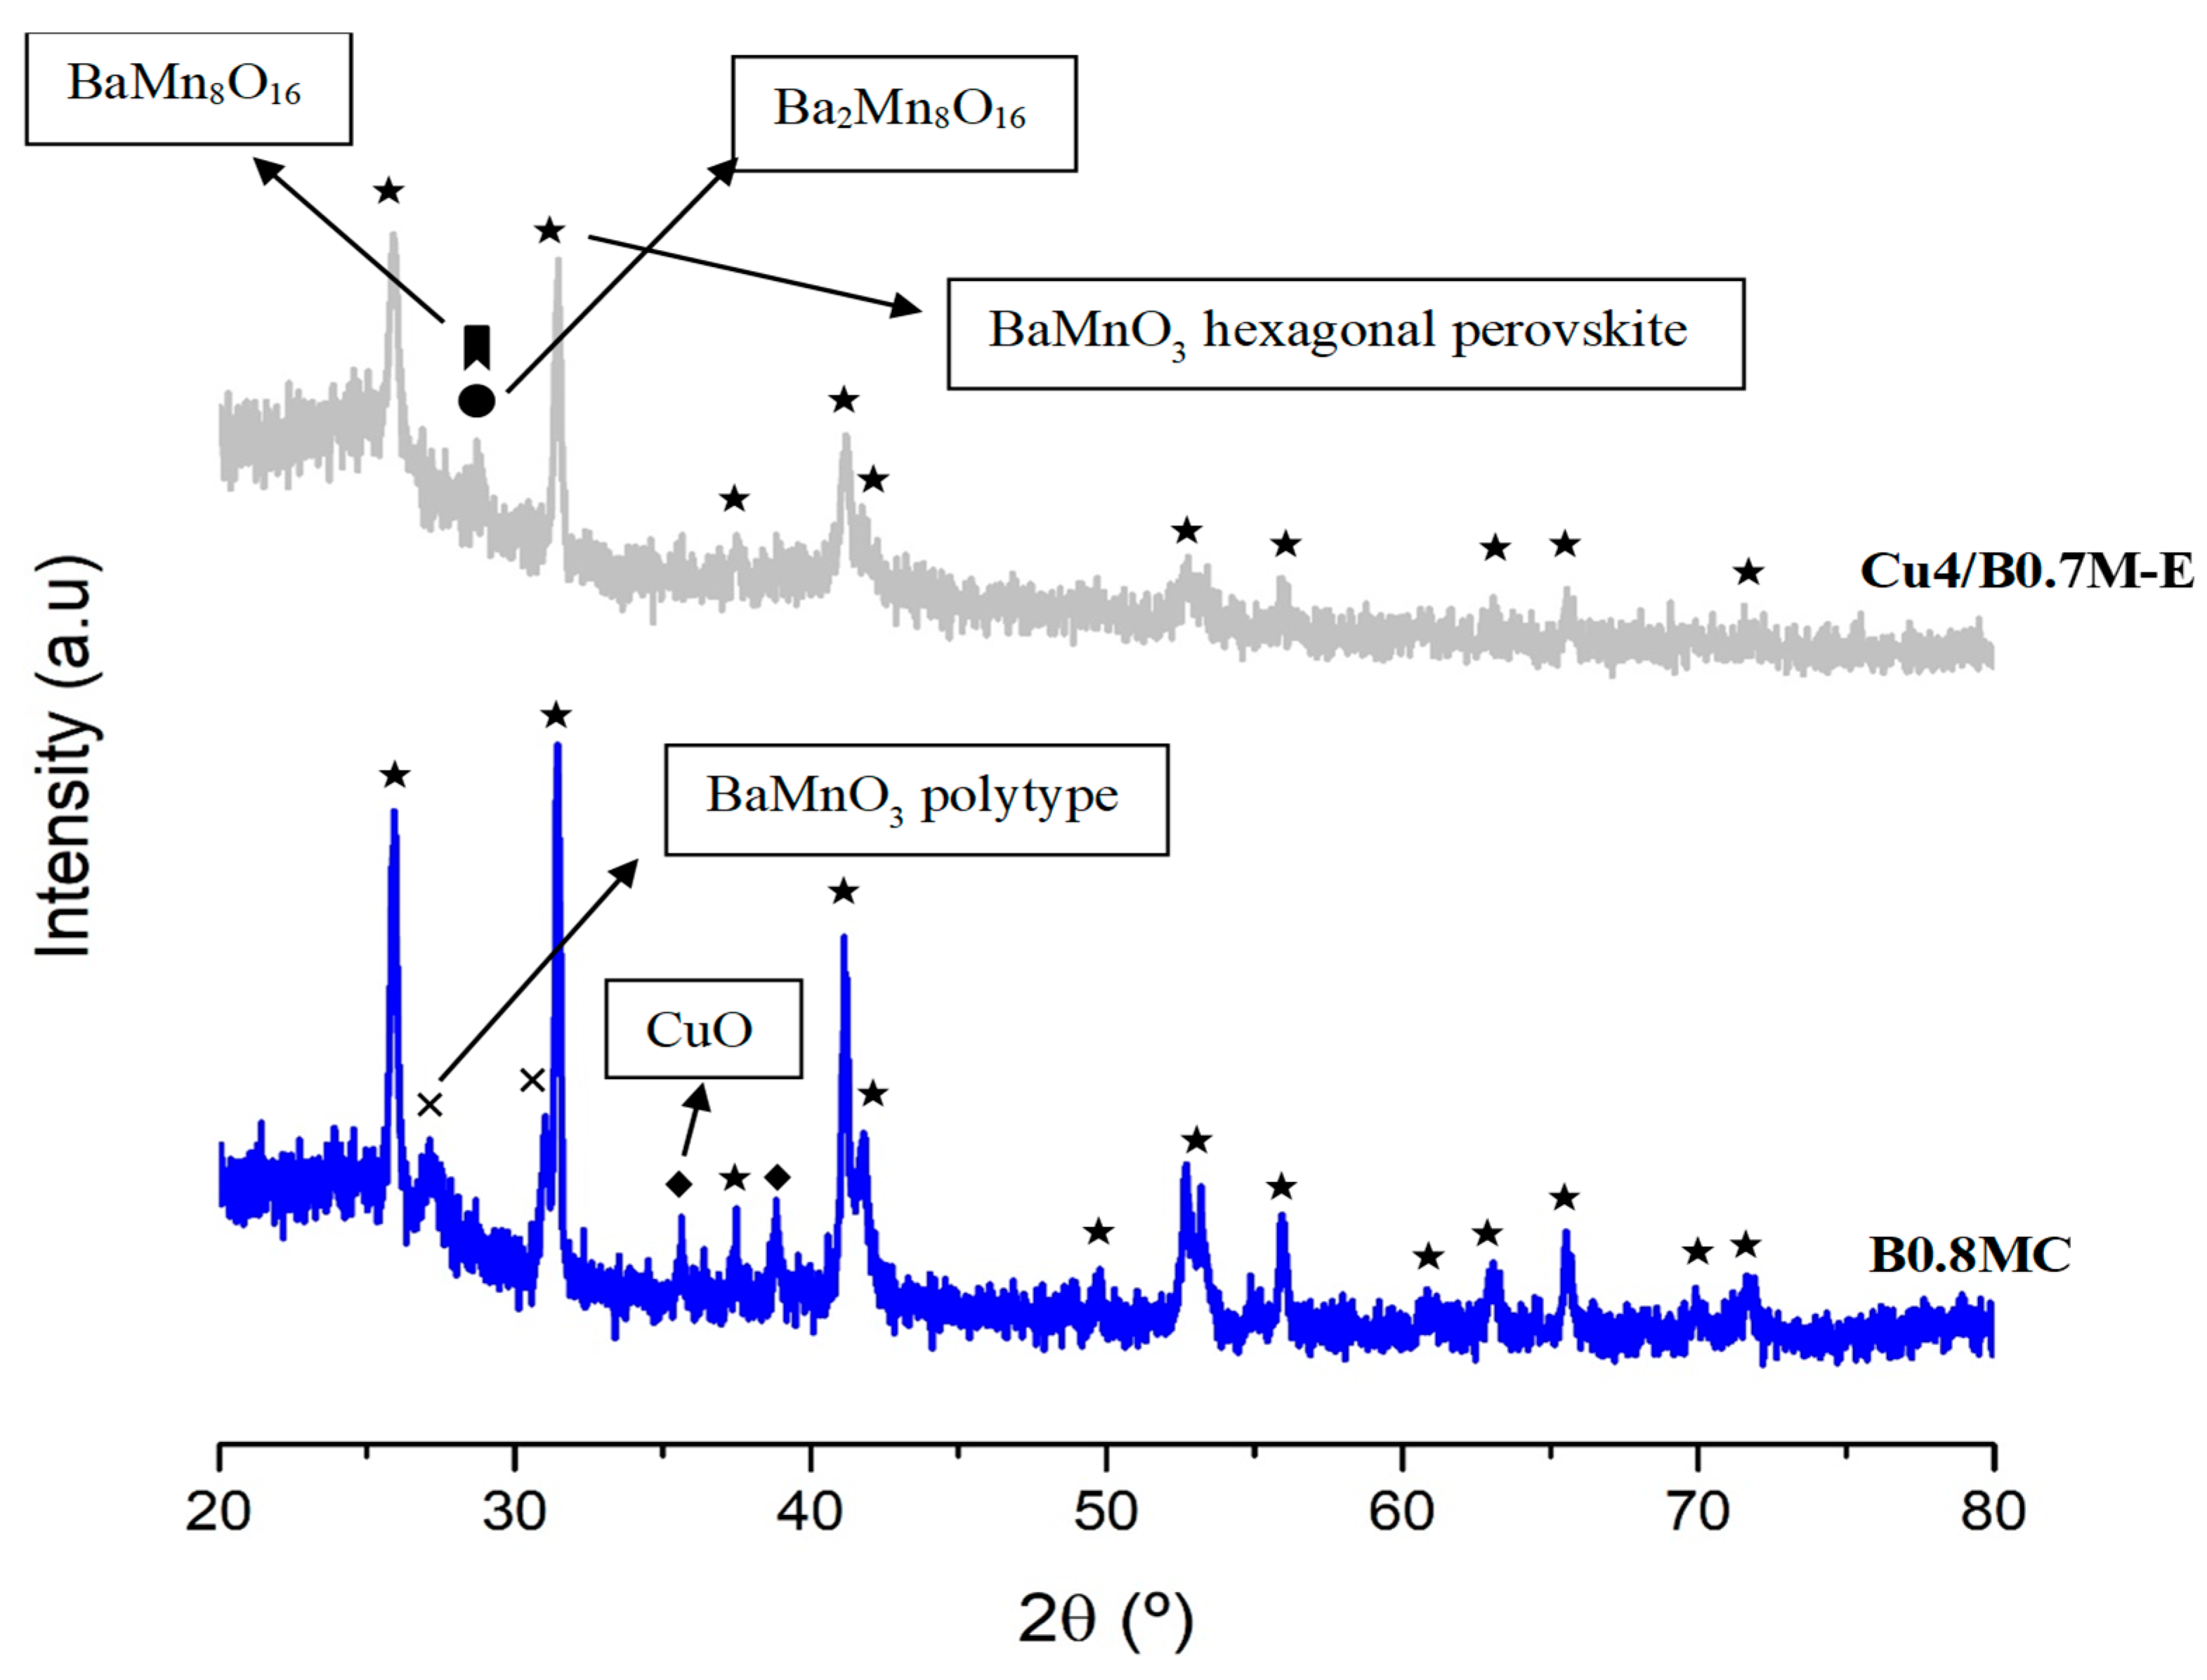
The used samples have been characterized by XRD and XPS to determine the potential structural and/or surface modifications occurred during the reaction, being the results shown in Table 5 and Figure 5.
The analysis of the Ba 3d5/2 transition reveals an increase in the amount of carbonate groups on the surface of the used Cu4/B0.7M-E sample. However, as this BaCO3 phase is not detected by XRD (Figure 5), it should be amorphous or, if it is crystalline, its amount should be below the detection limit of the XRD technique. Moreover, the XPS OL/(Ba+Mn(+Cu)) ratio for the used samples is lower than for the fresh formulations, showing the Cu4/B0.7M-E sample the most pronounced decrease. This fact suggests the formation of oxygen vacancies on the surface of the two perovskites during the reaction (as it was also detected after testing at 250 °C), which takes place along with a decrease of the amount of surface Mn (IV) species, as deduced from the change in the Mn(IV)/Mn(III) ratio. Note that these two modifications are more relevant for the impregnated sample. Additionally, the decrease of the Cu/(Ba+Mn+Cu) ratios for the two used samples suggests that copper species seem being partially inserted into the inner structure of the perovskite during reaction. However, the XRD profile of the used B0.8MC sample shows a transition from the BaMnO3 polytype structure to the hexagonal structure suggesting just the opposite, that is, the exsolution of the Cu species (since it is the Cu insertion which causes the formation of the polytype structure). On the contrary, regarding the used Cu4/B0.7M-E formulation, the support still presents the hexagonal perovskite structure, like in the fresh sample [32]. Therefore, considering the decrease of the Cu/(Ba+Mn+Cu) ratio observed for the two used samples, it seems that the higher amount of oxygen vacancies generated during the reaction on both samples avoids the distortion of the perovskite structure due to the insertion of copper into the lattice [65]. Indeed, as observed after reaction at 250 °C, the Auger Cu L3M4.5M4.5 signals (see Table 5) reveal the preservation of the copper species with a strong interaction with the perovskite (including also those with an oxidation state a lower than Cu (II)) during the reaction on the surface of the B0.8MC and Cu4/B0.7M-E samples, which is confirmed by the percentages of the Cusi species on the surface. Consequently, it seems that, for B0.8MC, the partial insertion of the copper species into the bulk during the reaction hindered their interaction with the reactants, causing the decrease of the CO conversion in the presence of CO2. For the Cu4/B0.7M-E sample, the increase of the proportion of carbonate groups during the reaction should cause the gradual deactivation featured in Figure 4.
Summarizing, the characterization of the used samples allows concluding that the decrease of the proportion of surface Mn (IV) species, the insertion of the copper species into the bulk for both samples, and the increase of the amount of surface carbonate groups, seem causing the worse catalytic performance in the presence of CO2. Thus, as the tolerance to CO2 featured by Cu4/B0.7M-E sample is better than the shown by B0.8MC, the former formulation has been selected to be optimized in order to achieve a higher CO conversion and an improved tolerance to CO2.

3.4. Optimization of the Cu4/B0.7M-E Formulation

Based on the redox equilibrium shown in Reaction 8 and, to try to increase the fraction of Cu (I) species on the surface of the Cu4/B0.7M-E sample, the catalytic activity for the CO oxidation reaction of a series of Cu-Ce bimetallic samples supported on the B0.7M-E perovskite were explored during the development of an academic research work supervised by the authors.
Cu2+ + Ce3+ ⇆ Cu+ + Ce4+
Thus, a series of bimetallic samples with different Cu and Ce contents (4-0, 3-1, 2-2, 1-3 and 0-4, as wt% Cu–wt% Ce) were synthetized, characterized and tested under the 1% CO, 1% O2 in He reactant atmosphere, showing the 2-2 sample the best results as it overcomes the catalytic performance featured by the Cu4/B0.7M-E formulation under temperature-programmed CO oxidation reaction conditions. Considering this conclusion, the 2-2 sample (denoted as Cu2Ce2/B0.7M-E) was prepared, characterized and tested for the CO oxidation reaction under the most realistic conditions used in this paper.

3.4.1. Chemical, Morphological and Structural Characterization

The actual Ce and Cu weight percentages of the Cu2Ce2/B0.7M-E formulation have been determined by ICP-OES, being 0.948 ± 0.073 wt% for Ce and 1.796 ± 0.003 wt%, for Cu.
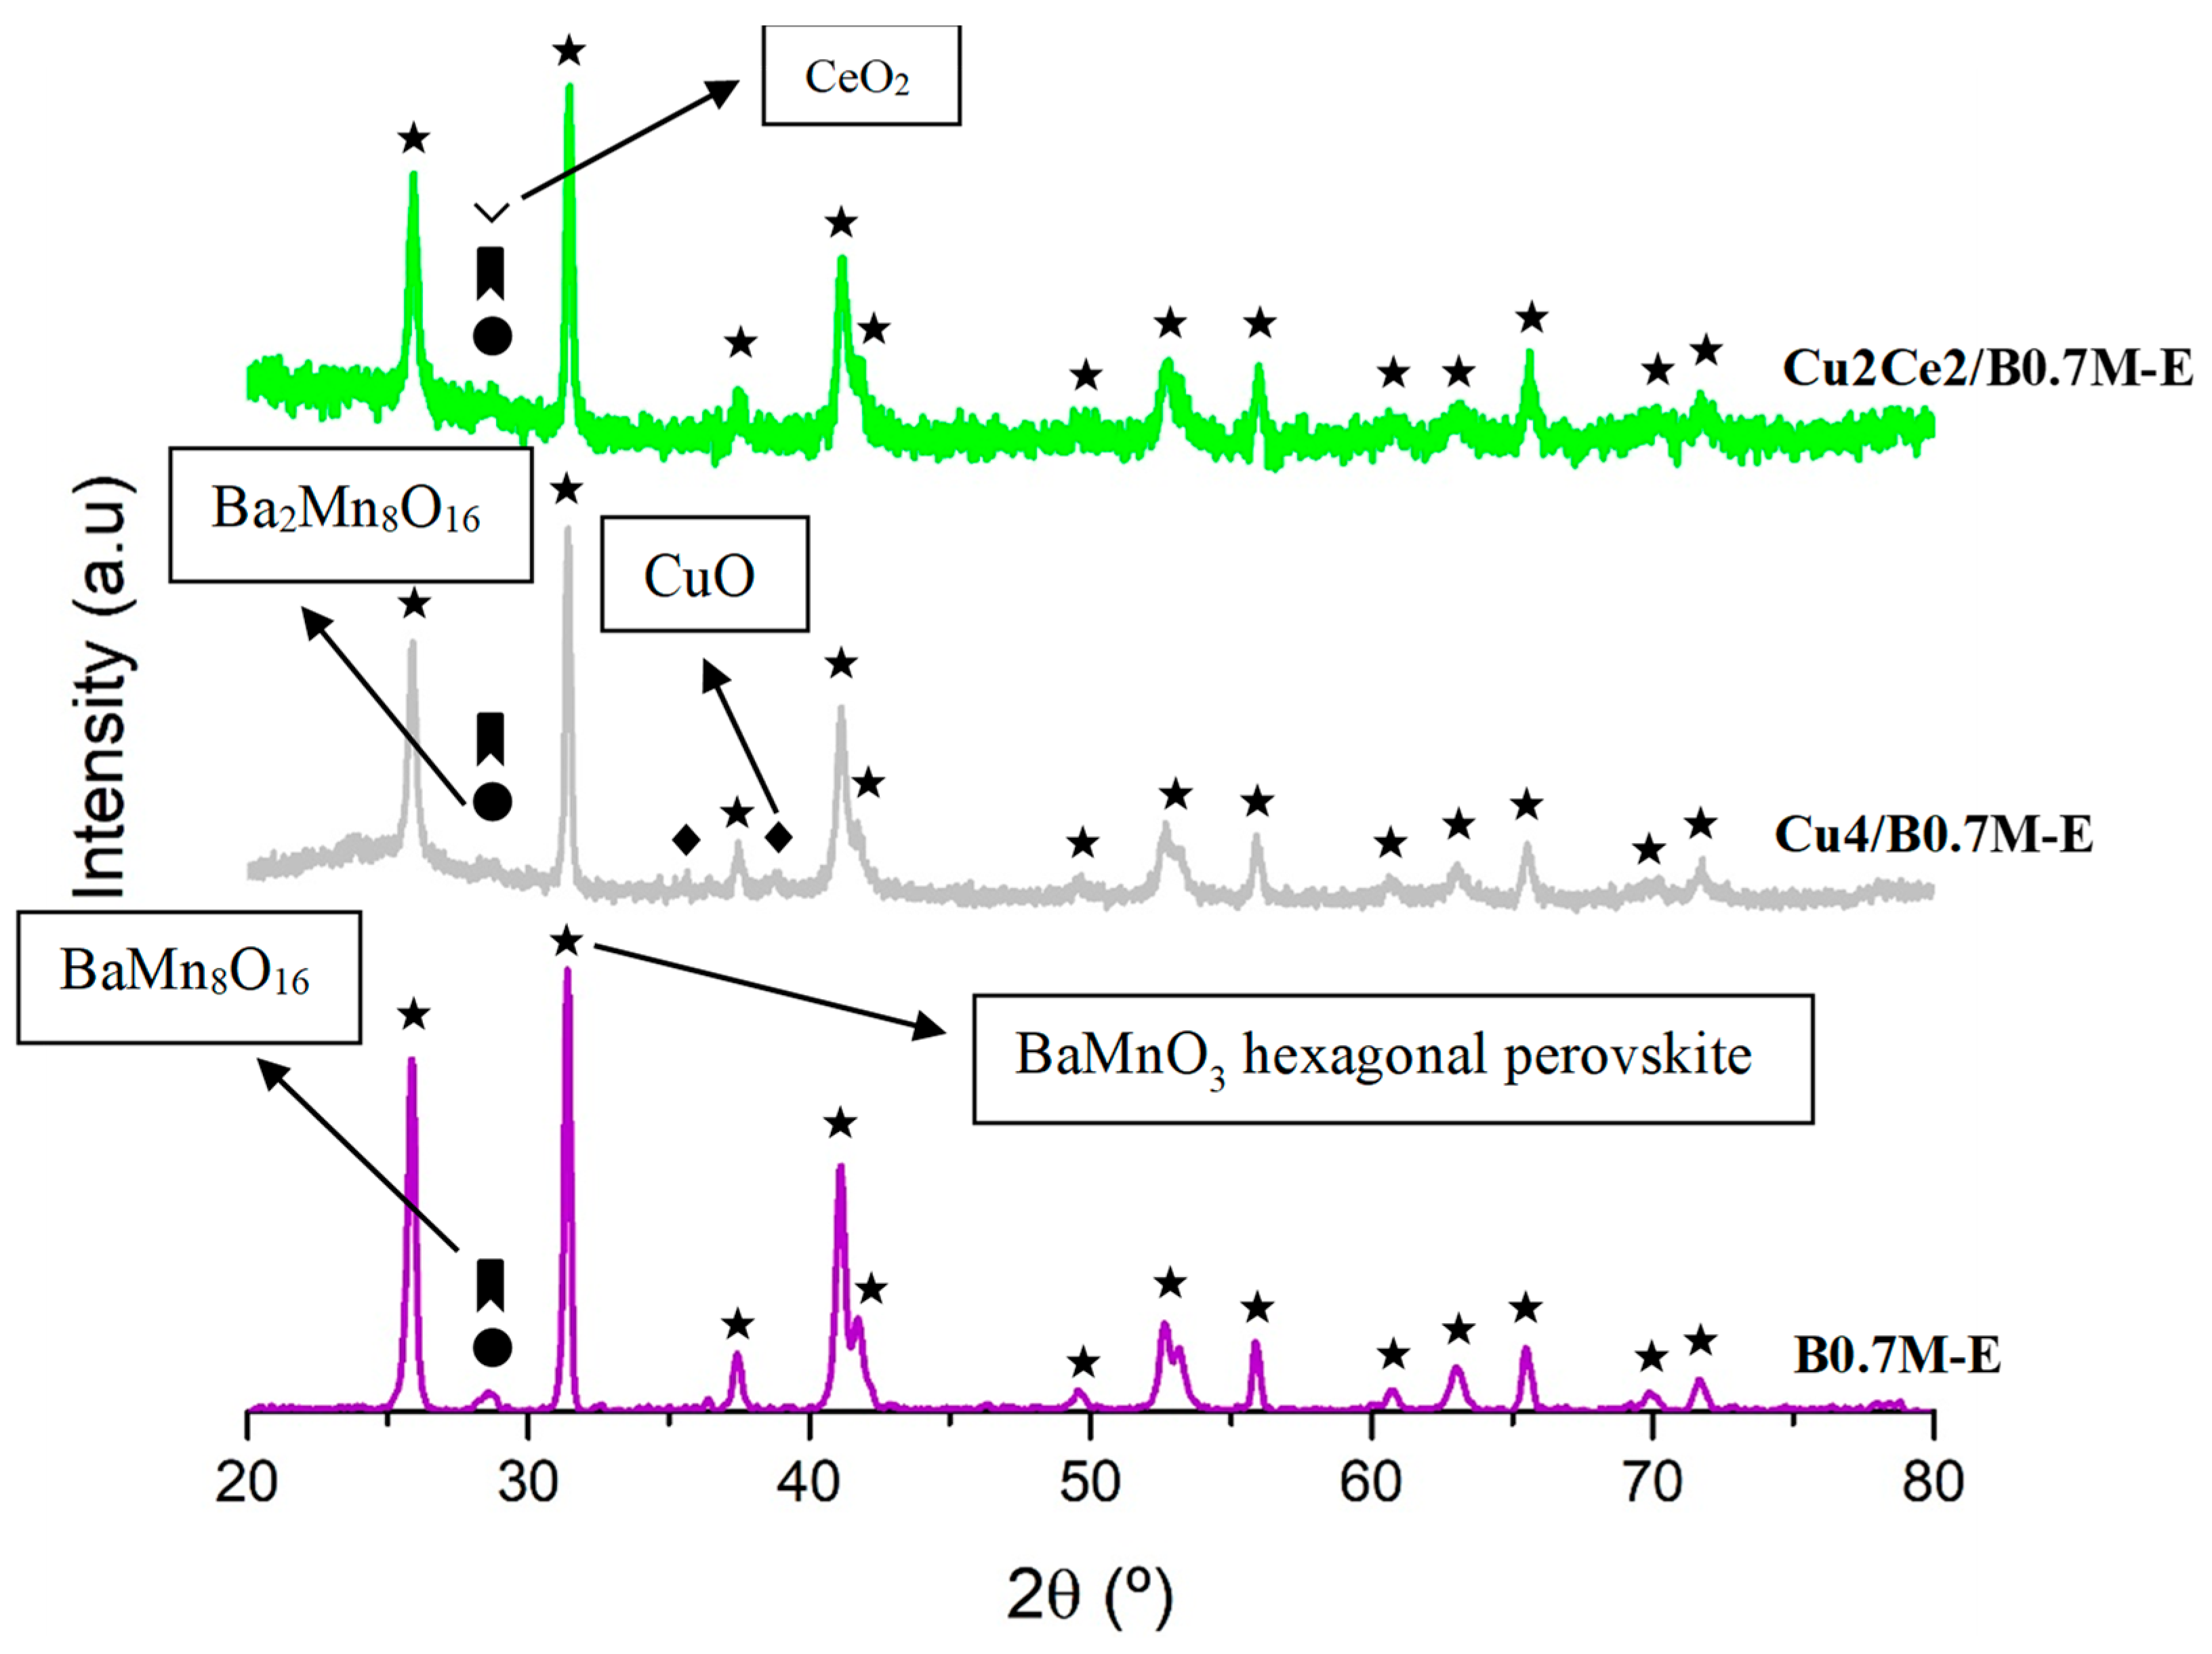
Figure 6 and Table 6 present the XRD data of the Cu2Ce2/B0.7M-E formulation, as well as the data of the support (B0.7M-E) and of the monometallic sample (Cu4/B0.7M-E) for comparative purposes. As expected, relevant structural modifications respect to the B0.7M-E support are not detected after the impregnation with Cu and Ce. Note that the CuO peaks (JCPDS-ICDD 80-0076) are not clearly distinguishable in the XRD pattern of the bimetallic sample due to the low percentage of Cu [34]. For the bimetallic sample, the main peak of CeO2 (JCPDS-ICDD 34-0394) overlaps with those corresponding to the BaMn8O16 (JCPDS-ICDD 29-188) and Ba2Mn8O16 (JCPDS-ICDD 78-962) minority phases of the support. The cell parameters included in Table 6 confirm that the incorporation of both metals does not significantly distort the perovskite structure [66], but an increase of the lattice strain values is found. According to the literature, the increase of the lattice strain in supported samples can be caused by the formation of oxygen vacancies on the support, and by the presence of an interface that separates two crystalline structures with different atomic coordination [67,68]. Moreover, the addition of Cu and Ce results in an increase of the perovskite crystal size, which was also referred by other authors for cerium-containing oxides [69].
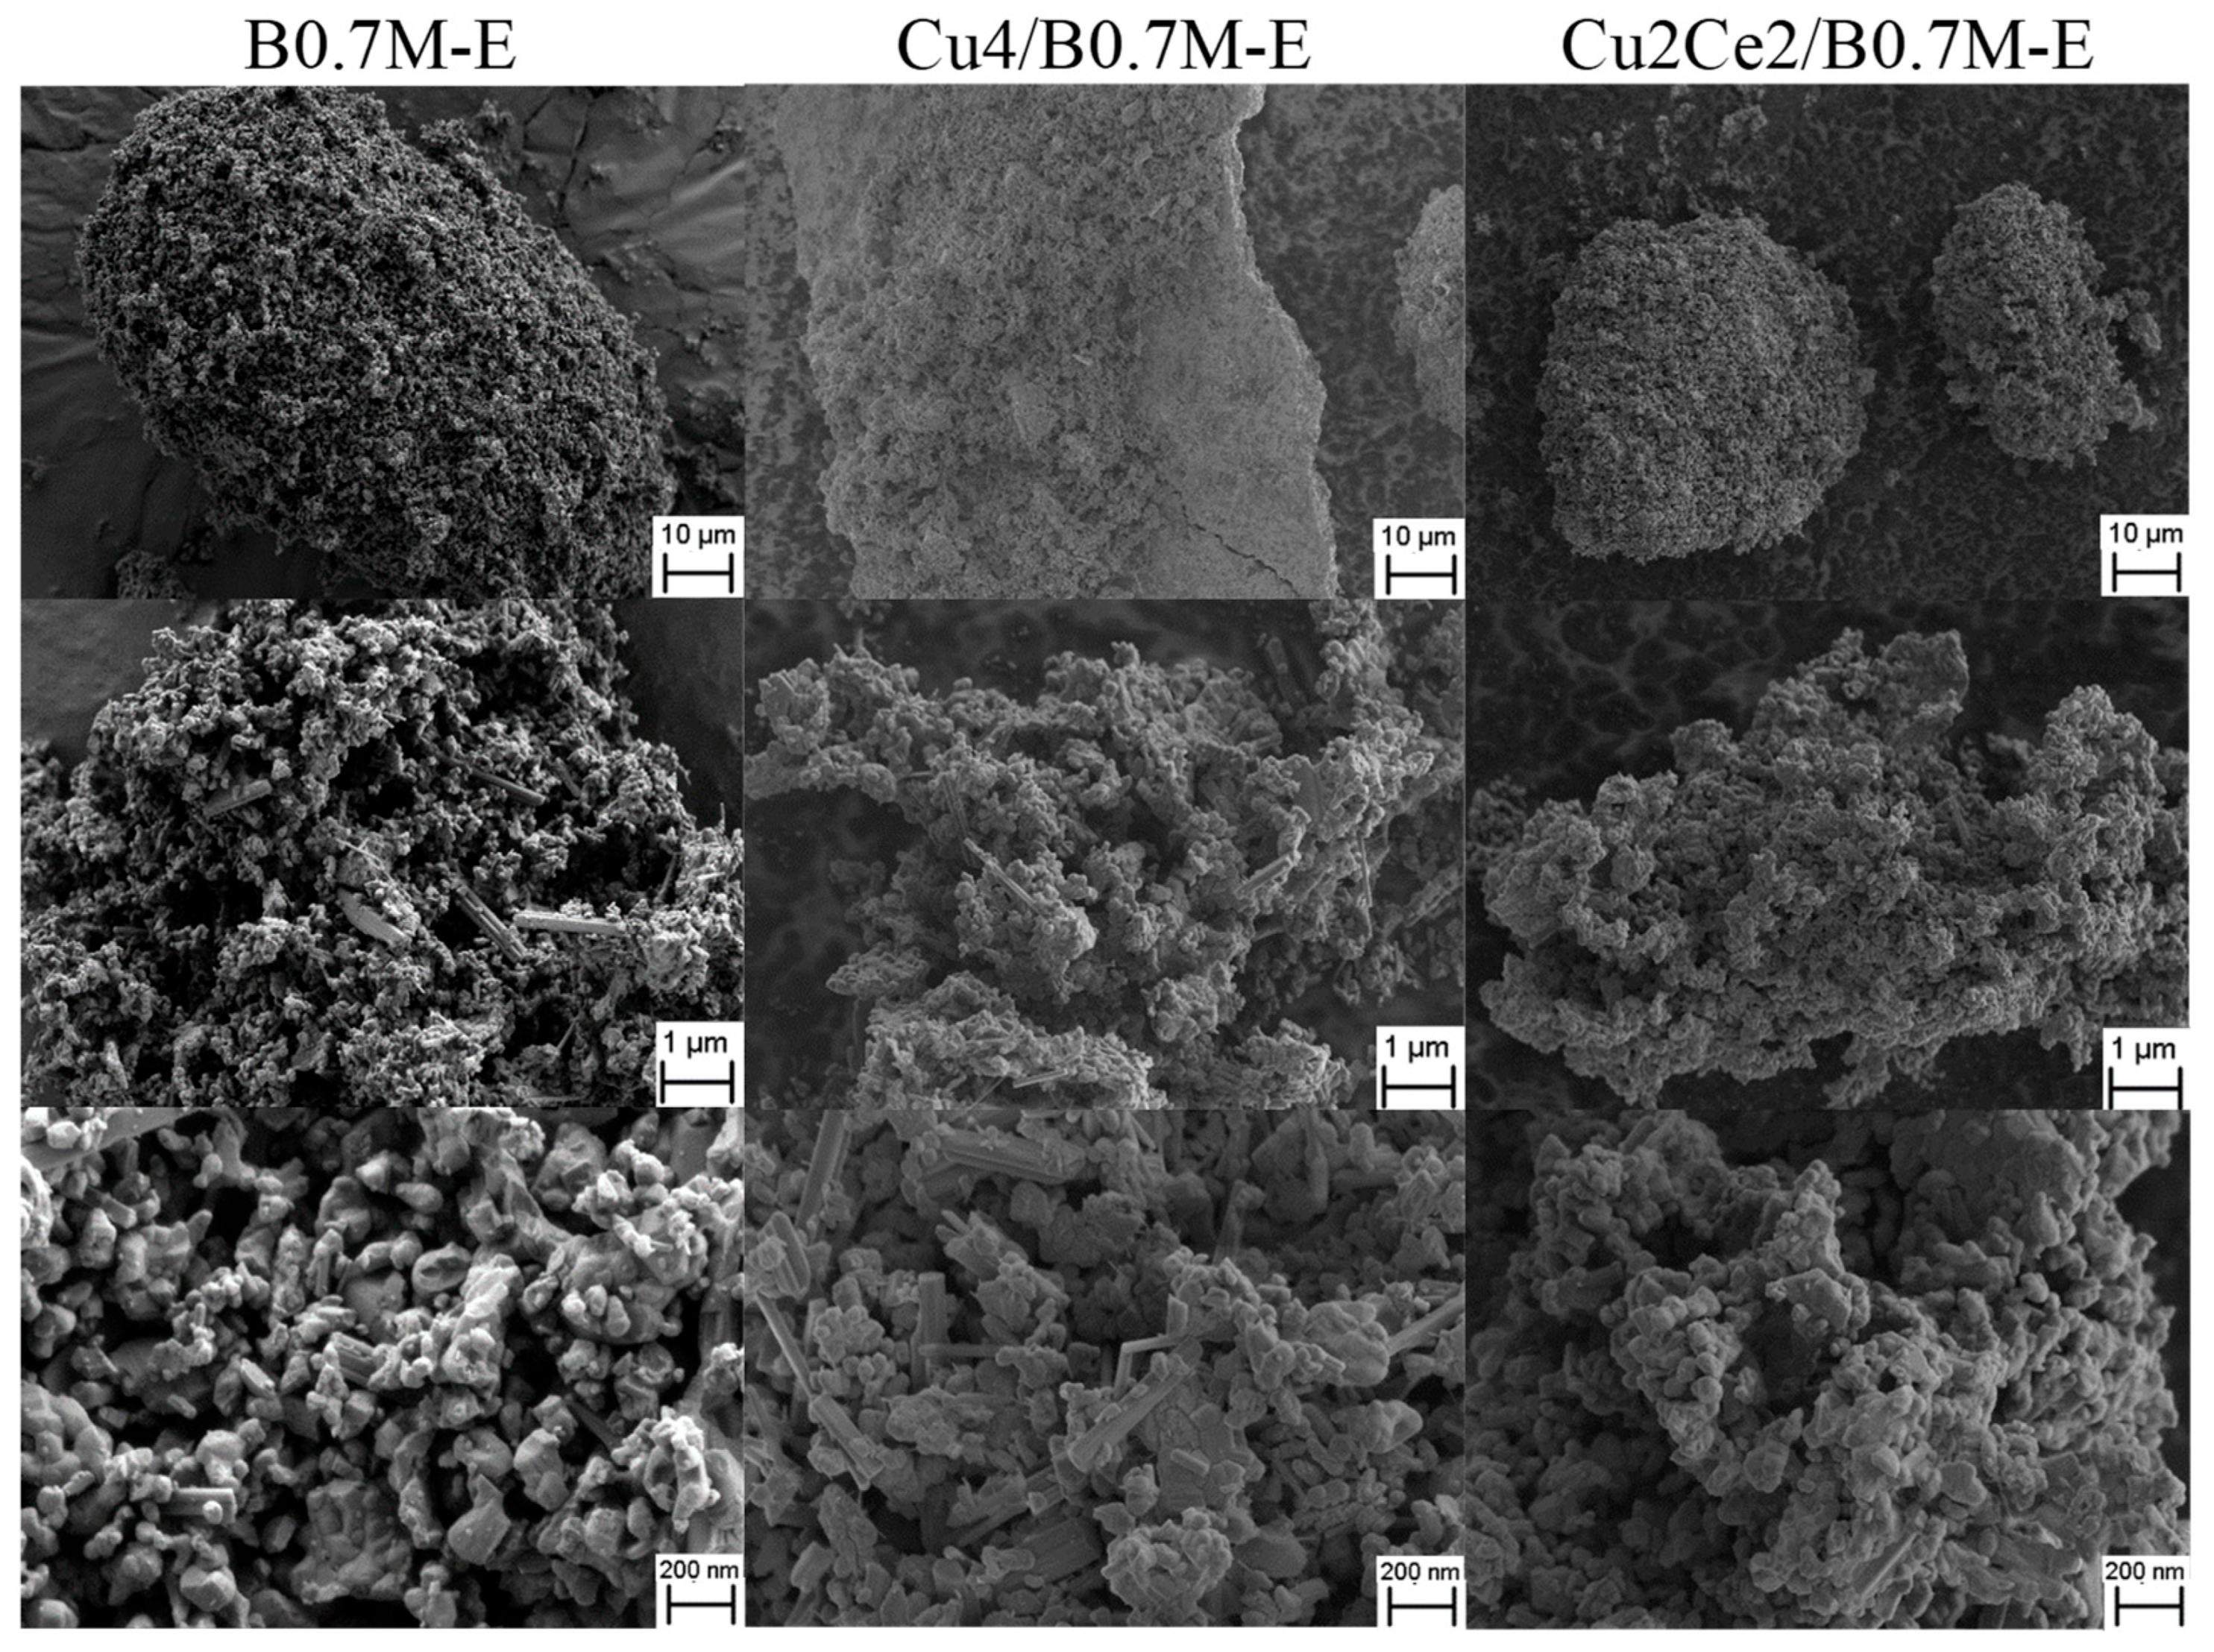
Regarding the morphological characterization of the samples, Figure 7 shows a selection of FE-SEM images at different magnifications for the three samples. As observed, significant morphological differences are not observed between the raw B0.7M-E support and the impregnated samples, since for all of them amorphous particles with different sizes are identified. Furthermore, FE-SEM-EDX data (see Figures S3 and S4 in the Supplementary Information file) give information about the Ba, Mn, Cu and Ce distribution in the Cu4/B0.7M-E and Cu2Ce2/B0.7M-E samples. Focusing the attention on the Cu and Ce species, the CuO phase seems to be well distributed on the B0.7M-E support, showing few aggregates in certain regions of the surface, meanwhile, the Ce species seem to be very well dispersed on the surface of Cu2Ce2/B0.7M-E.

3.4.2. Surface Properties

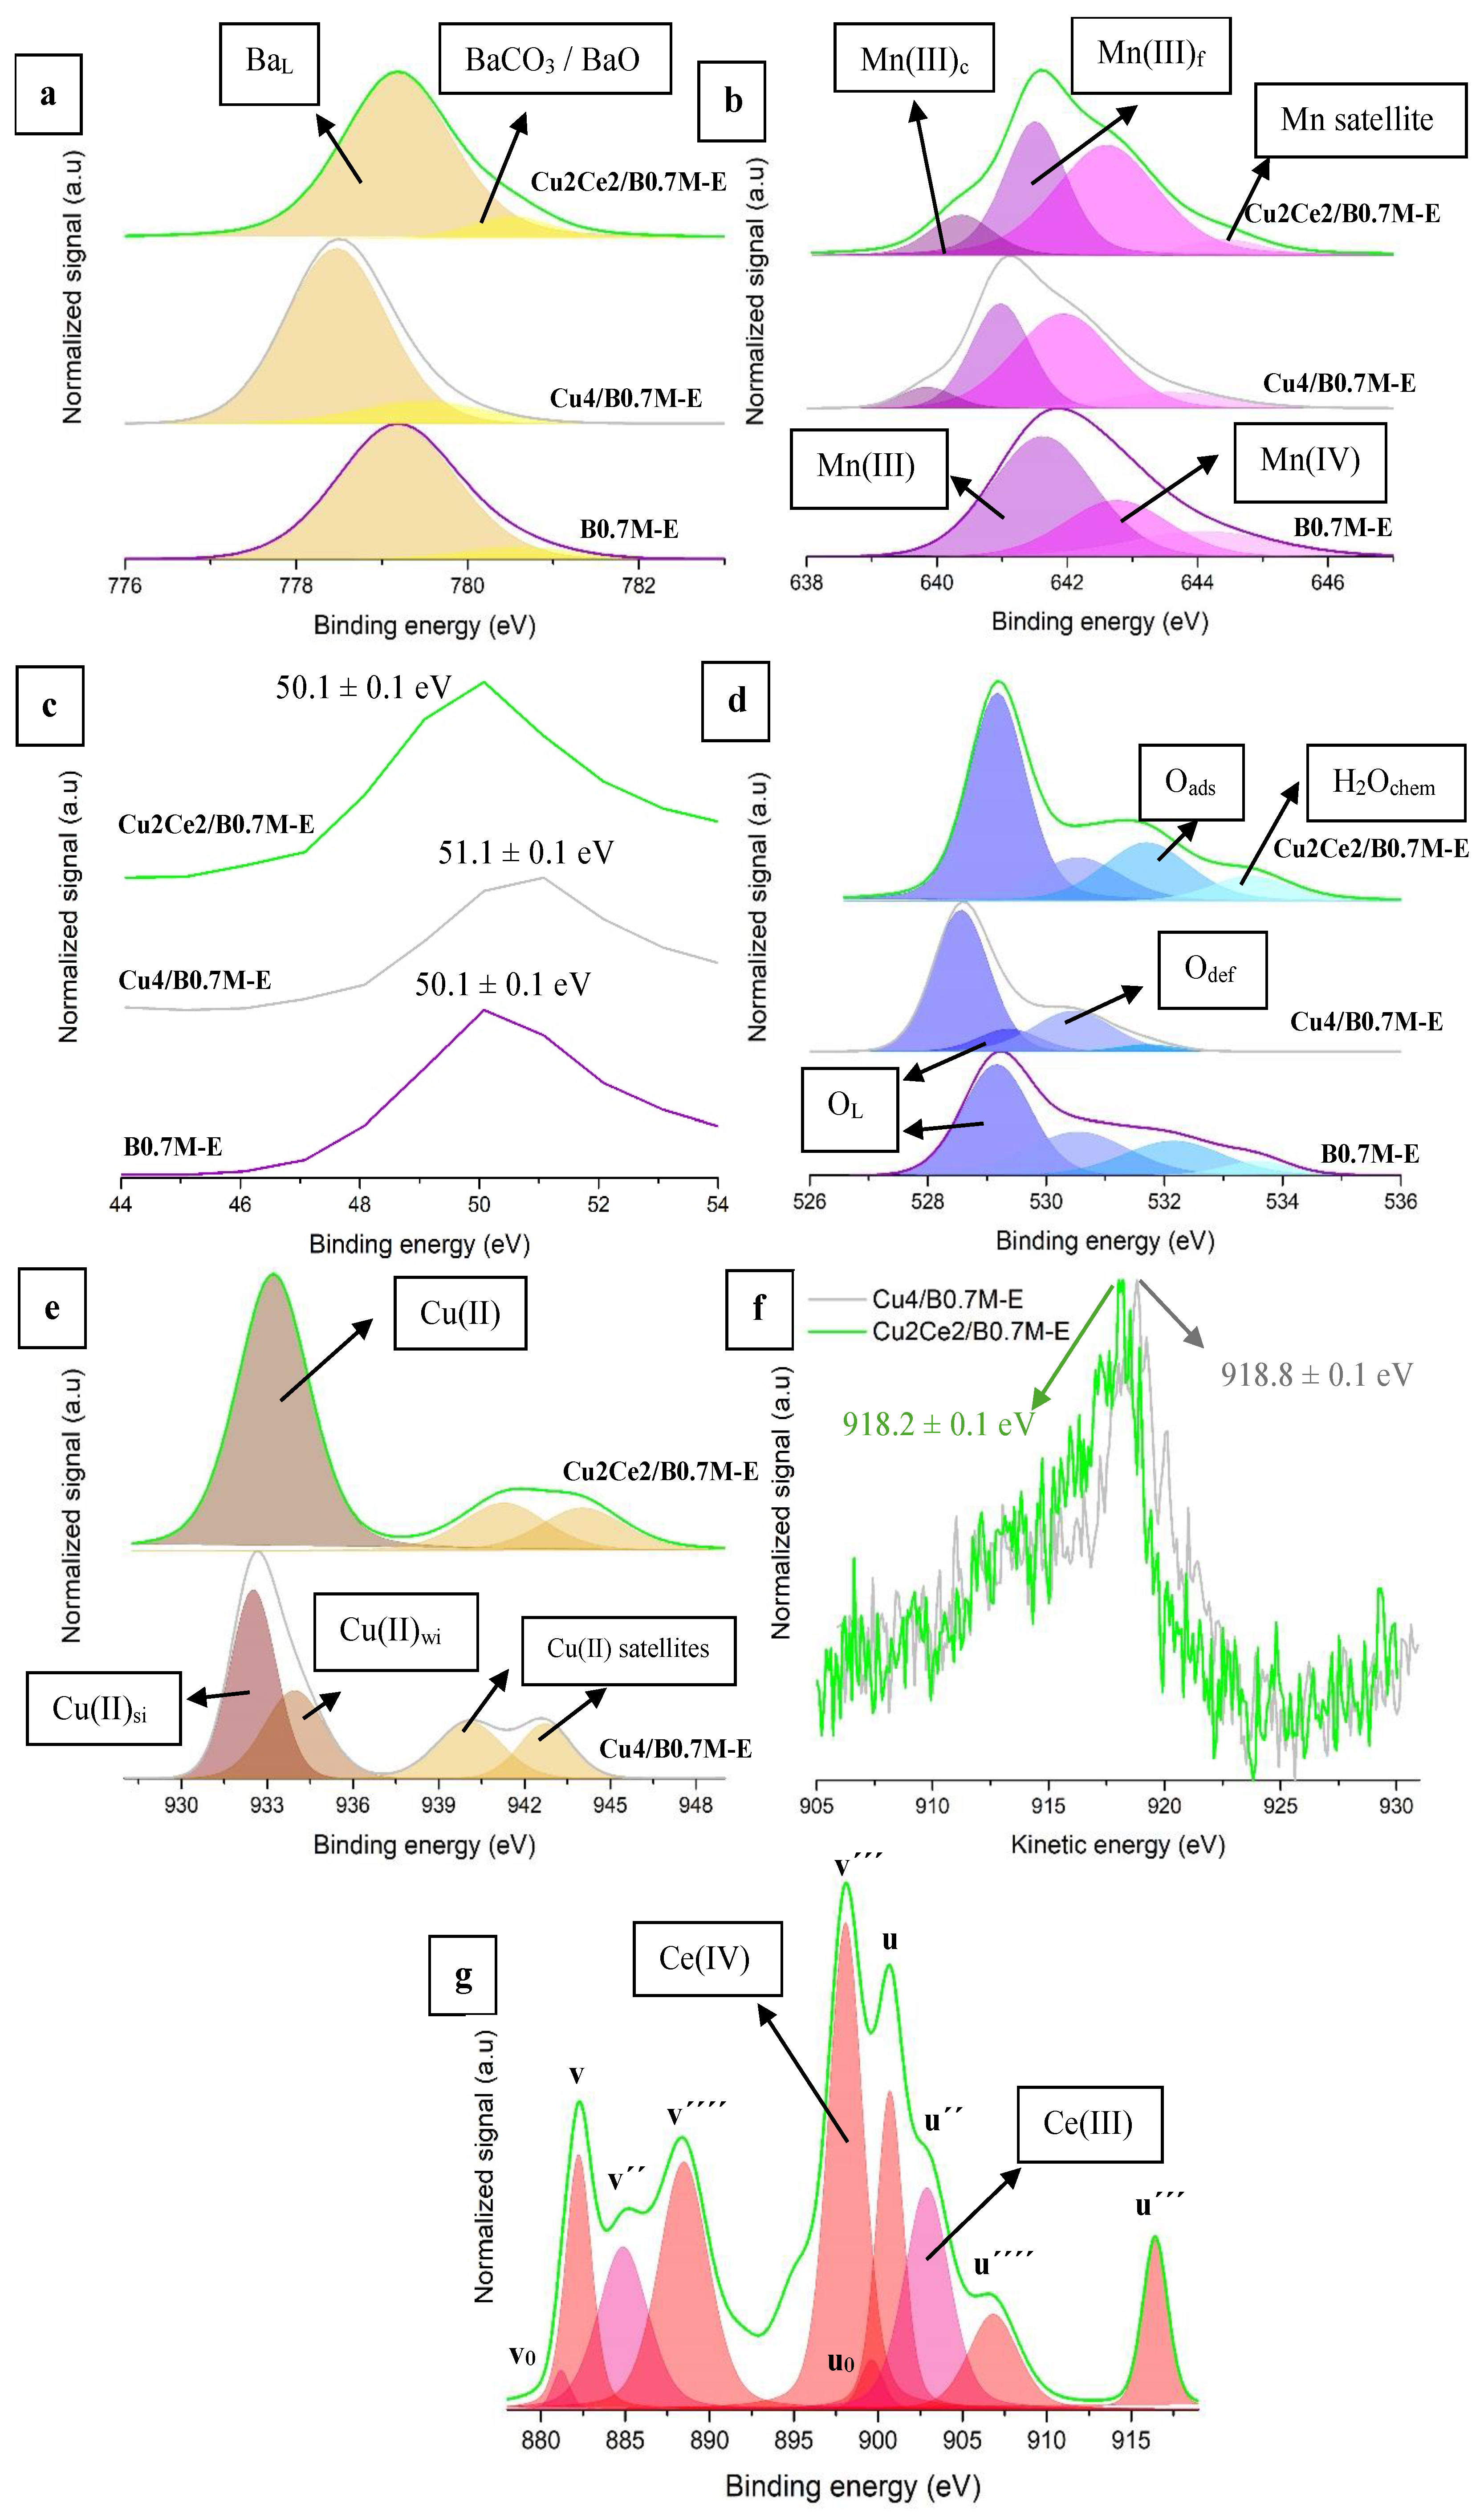
Figure 8 and Table 7 feature the main XPS data of the bimetallic and monometallic formulations and of the perovskite used as support.
The Ba 3d5/2 spectra (Figure 8a) show the two expected contributions for the Ba-based perovskites [70,71]: (i) lattice Ba (BaL) at lower binding energies, and (ii) barium carbonate (formed due to the air exposition of the samples [72,73]) and barium oxide at higher binding energies. In the spectra, a chemical shift of the Ba 3d5/2 signal towards lower binding energies is observed, as the presence of Cu species on the surface increases the electronic density of Ba [74]. Note that, after the incorporation of Ce, the position of the Ba 3d5/2 signal comes back to the initial binding energy determined for the support. This fact suggests that the interaction between Cu and the perovskite support is weakened, probably as a result of the stronger interaction between Cu and Ce species. J. Jiang et al. proposed that the strong interaction between Cu and Ce is due to the formation of a solid solution [75], which probably exists on the surface of the Cu2Ce2/B0.7M-E sample. Finally, the degree of carbonation of the Ce-containing sample, as deduced from the BaCO3/BaL ratio, is similar to the detected for the raw support, so, Cu4/B0.7M-E seems being the sample most susceptible to be carbonated.
Regarding the Mn 2p3/2 signal (Figure 8b), the presence of Mn (III) (at lower binding energies) and Mn (IV) (at higher binding energies) is observed for the bimetallic sample [76,77], in which a satellite peak between 644 and 645 eV is also found [78,79]. According to the XPS Mn(IV)/Mn(III) ratio (Table 7), the fraction of Mn (IV) decreases after the addition of Ce. In fact, the Mn 3p signal (used to determine the predominant oxidation state of Mn [80], and displayed in Figure 8c) appears at the same binding energy than for the B0.7M-E, confirming the presence of a lower fraction of Mn (IV). Additionally, for both impregnated samples, a splitting of the Mn (III) signal in two deconvolutions is observed, that corresponds to Mn (III) ions close to the Cu and Ce species (Mn (III)c) and those far from them (Mn (III)f). The values of the Mn(III)c/Mn(III)f ratio in Table 7 reveal a higher proportion of the Mn (III)c species on the bimetallic sample respect to the monometallic one, which should be due to the interaction of Ce with the Mn species.
The O 1s spectra (Figure 8d) displays the four contributions expected for perovskite-type oxides [81,82]: (i) lattice oxygen (OL) around 529 eV, (ii) oxygen species with low oxygen coordination, that correspond to oxygen vacancies formed on the surface (Odef), at approximately 531 eV, (iii) adsorbed oxygen, hydroxyl and carbonate groups (Oads) on the surface at around 532 eV, and (iv) chemisorbed water (H2Ochem) at approximately 533 eV. As observed in previous studies [34], the additional thermal step included in the impregnation method removes the chemisorbed water molecules from the surface of the Cu4/B0.7M-E, but not for the Cu2Ce2/B0.7M-E sample [83]. As in previous sections, the OL/(Ba+Mn) ratios have been calculated to obtain information about the presence of oxygen defects. Thus, as the XPS OL/(Ba+Mn) ratios are lower than the nominal one, the samples present oxygen defects on the surface, being the proportion much higher for the bimetallic formulation as they are generated to balance the positive and negative charges on the surface after the Ce addition. In fact, H. Gao and colleagues proposed that the interaction between the Ce species and the MnO6 octahedra leads to coulombic repulsions that provoke the Jahn-Teller effect and favoring the formation of oxygen defects [84,85].
The analysis of the Cu 2p3/2 (Figure 8e) and of the Auger Cu L3M4.5M4.5 signals (Figure 8f) allows the identification of the copper species present on the surface. Thus, the band at around 933 eV, and of the satellites at higher binding energies in the Cu 2p3/2 profiles, reveals that Cu (II) species exist on the surface [86,87]. Additionally, the deconvolution of the main Cu 2p3/2 band of the Cu4/B0.7M-E sample indicates the presence of two Cu (II) species with different interactions with the support, that are those with a strong interaction with the support (Cu (II)si), and the others with a weak interaction with it (Cu (II)wi). However, for the Cu2Ce2/B0.7M-E sample, the Cu 2p3/2 band presents a symmetric shape, so, the two Cu (II) species with different interactions with the support do not seem to be present. This finding is consistent with the weaker interaction of the supported phases with the perovskite proposed to justify the binding energy change of the Ba 3d5/2 signal. Furthermore, the Auger Cu L3M4.5M4.5 signal of the bimetallic sample appears at 918.2 eV, likely due to the presence of reduced copper species, being this fact confirmed by the lower percentage of Cu (II) for the bimetallic sample [56,88].
The Ce 3d transition shown in Figure 8g includes the Ce 3d5/2 and Ce 3d3/2 contributions, being the former extended from 878 to 898 eV approximately, and the latter located between 898 and 918 eV [89,90]. In the Ce 3d5/2 contribution, the v and v‴ deconvolutions correspond to Ce (IV), the v0 and v″ to Ce (III), and v⁗ to a satellite peak that confirms the presence of Ce (IV). On the other hand, Ce 3d3/2 presents u and u‴ as deconvolutions of Ce (IV), u0 and u″ due to the presence of Ce (III), and u⁗ corresponding to the Ce (IV) satellite [89,90]. The Ce(IV)/Ce(III) ratio (Table 7) reveals that Ce (IV) species are predominant on the surface, which supports the increase in the amount of reduced copper species (Cu(0) and/or Cu(I)) formed by the redox reaction between Cu (II) and Ce (III) species (Reaction (8)).
Finally, the nominal and experimental Cu/(Ba+Mn+Cu+Ce) and Ce/(Ba+Mn+Cu+Ce) ratios of the bimetallic sample suggest an accumulation of both metallic species on the surface.

3.4.3. Redox Properties

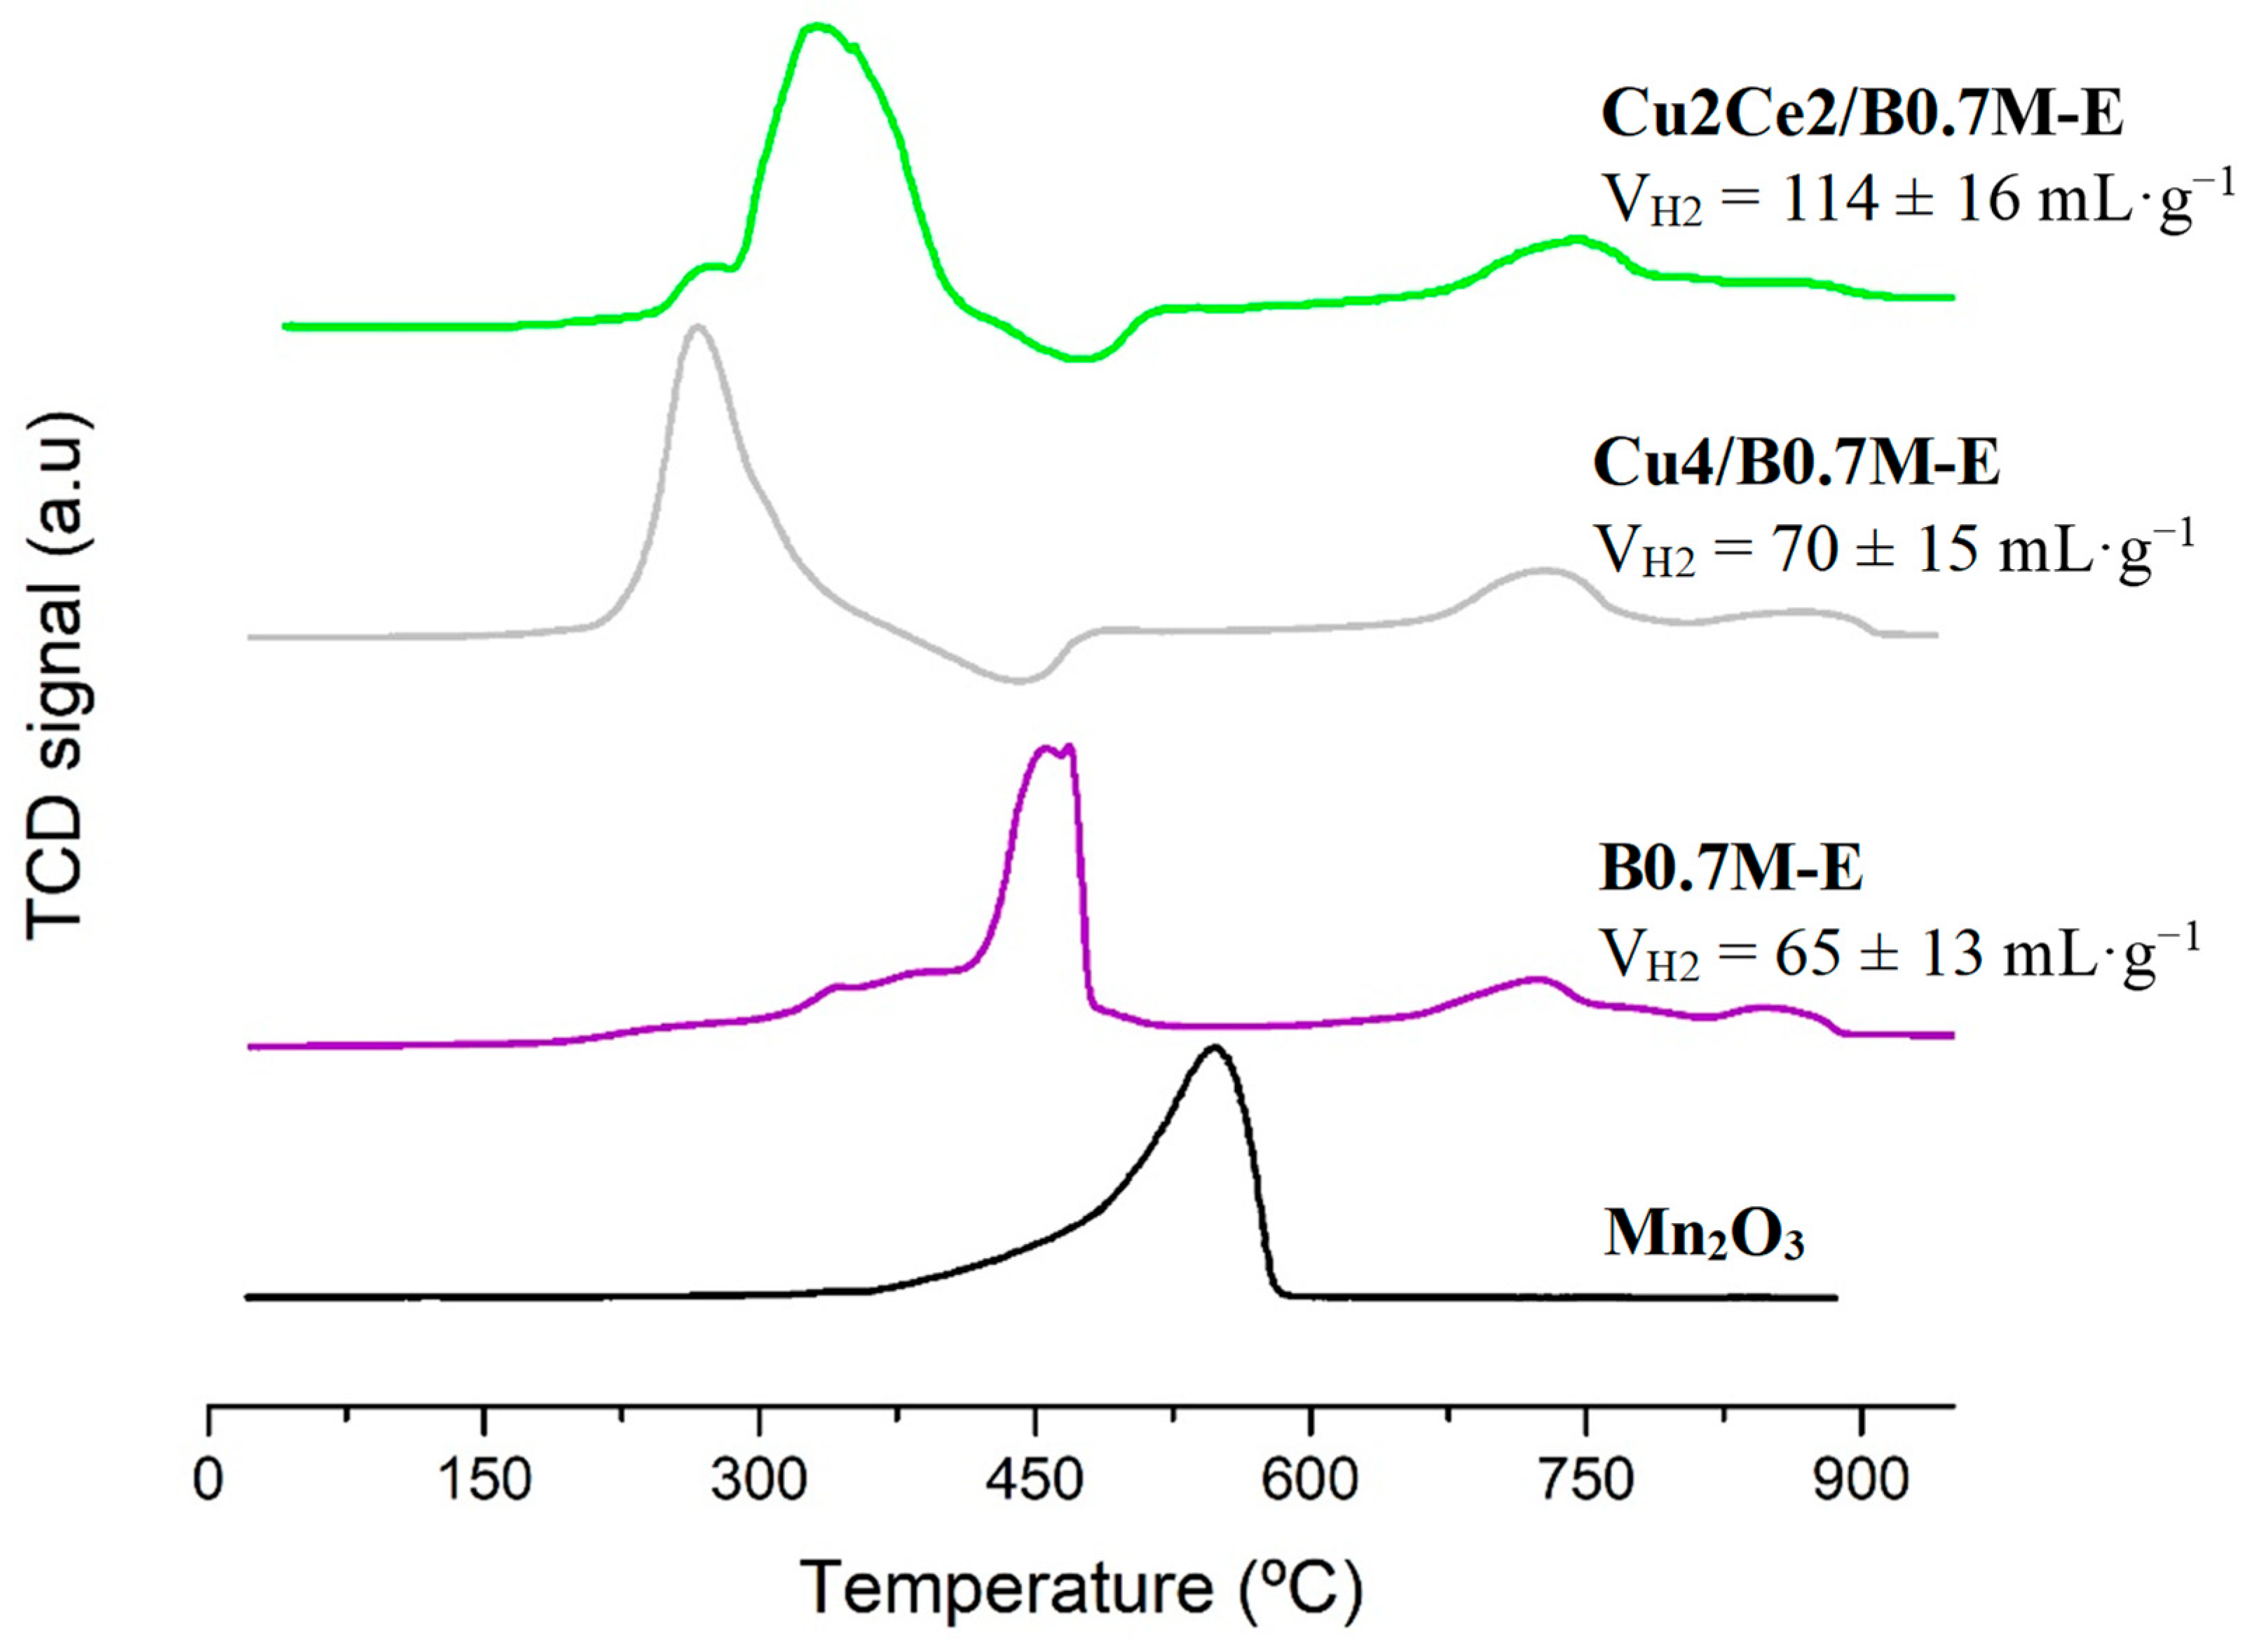
In the H2-TPR profiles of the Cu2Ce2/B0.7M-E, B0.7M-E and Cu4/B0.7M-E samples, featured in Figure 9, the peaks expected for Mn-containing perovskites [91,92] are detected: (i) from Mn (IV) and Mn (III) to Mn (II) between 400 and 500 °C, (ii) those involving oxygen species, between 700 and 800 °C, and (iii) from bulk Mn (III) to Mn (II) at around 900 °C. Additionally, at a lower temperature than that corresponding to the maximum of the main reduction peak, a shoulder due to the reduction of Mn (IV) to Mn (III) is found. On the other hand, the peak assigned to the reduction of the CuO, between 200 and 400 °C [93,94], should be present, as well as the signals due to the Ce reduction [95,96] (at 570 °C approximately for the surface Ce (IV) species, and around 750 °C for the bulk Ce (IV)). In the profiles of both impregnated samples, the maximum of the most intense reduction peak is shifted towards lower temperatures compared to the B0.7M-E perovskite, because it includes the reduction of the Cu (II) species. Focusing now on Cu2Ce2/B0.7M-E sample, it is evident that the reduction of the Mn species is facilitated by the presence of copper and cerium due to the Cu-Mn-Ce synergistic effect [97,98], being the reduction of the three metals included in the main reduction peak. However, the shift of this main reduction peak for the bimetallic sample is not as significant as in Cu4/B0.7M-E, probably due to the weaker interaction between the metallic phases and the perovskite support, above suggested. Finally, note that, for all the samples, the main reduction signals are shifted towards lower temperatures respect to the Mn2O3 used as reference (included in Figure 8). This shift should be mainly due to the different environment of the Mn ions in the perovskites, that includes also the presence of oxygen vacancies [99,100].
On the other hand, the Cu2Ce2/B0.7M-E sample presents the highest H2 consumption, surpassing even the theorical value [32,34] calculated assuming that only Mn (IV), Cu (II) and Ce (IV) are present (74 mL·g−1), or that only Mn (III), Cu (II) and Ce (IV) exist in the formulation (39 mL·g−1). This result reveals that the assumptions used in the theorical calculations should be incorrect for Cu2Ce2/B0.7M-E. Thus, a high H2 consumption could be observed if a H2 spillover phenomenon would take place. In fact, the spillover phenomenon, which involves the dissociative adsorption of the H2 molecules and the storage of the resulting H atoms as hydroxyl groups [101,102], has been proposed in the literature for copper-cerium-based formulations. Consequently, it seems that the high H2 consumption detected for the bimetallic sample is related to a spillover phenomenon.
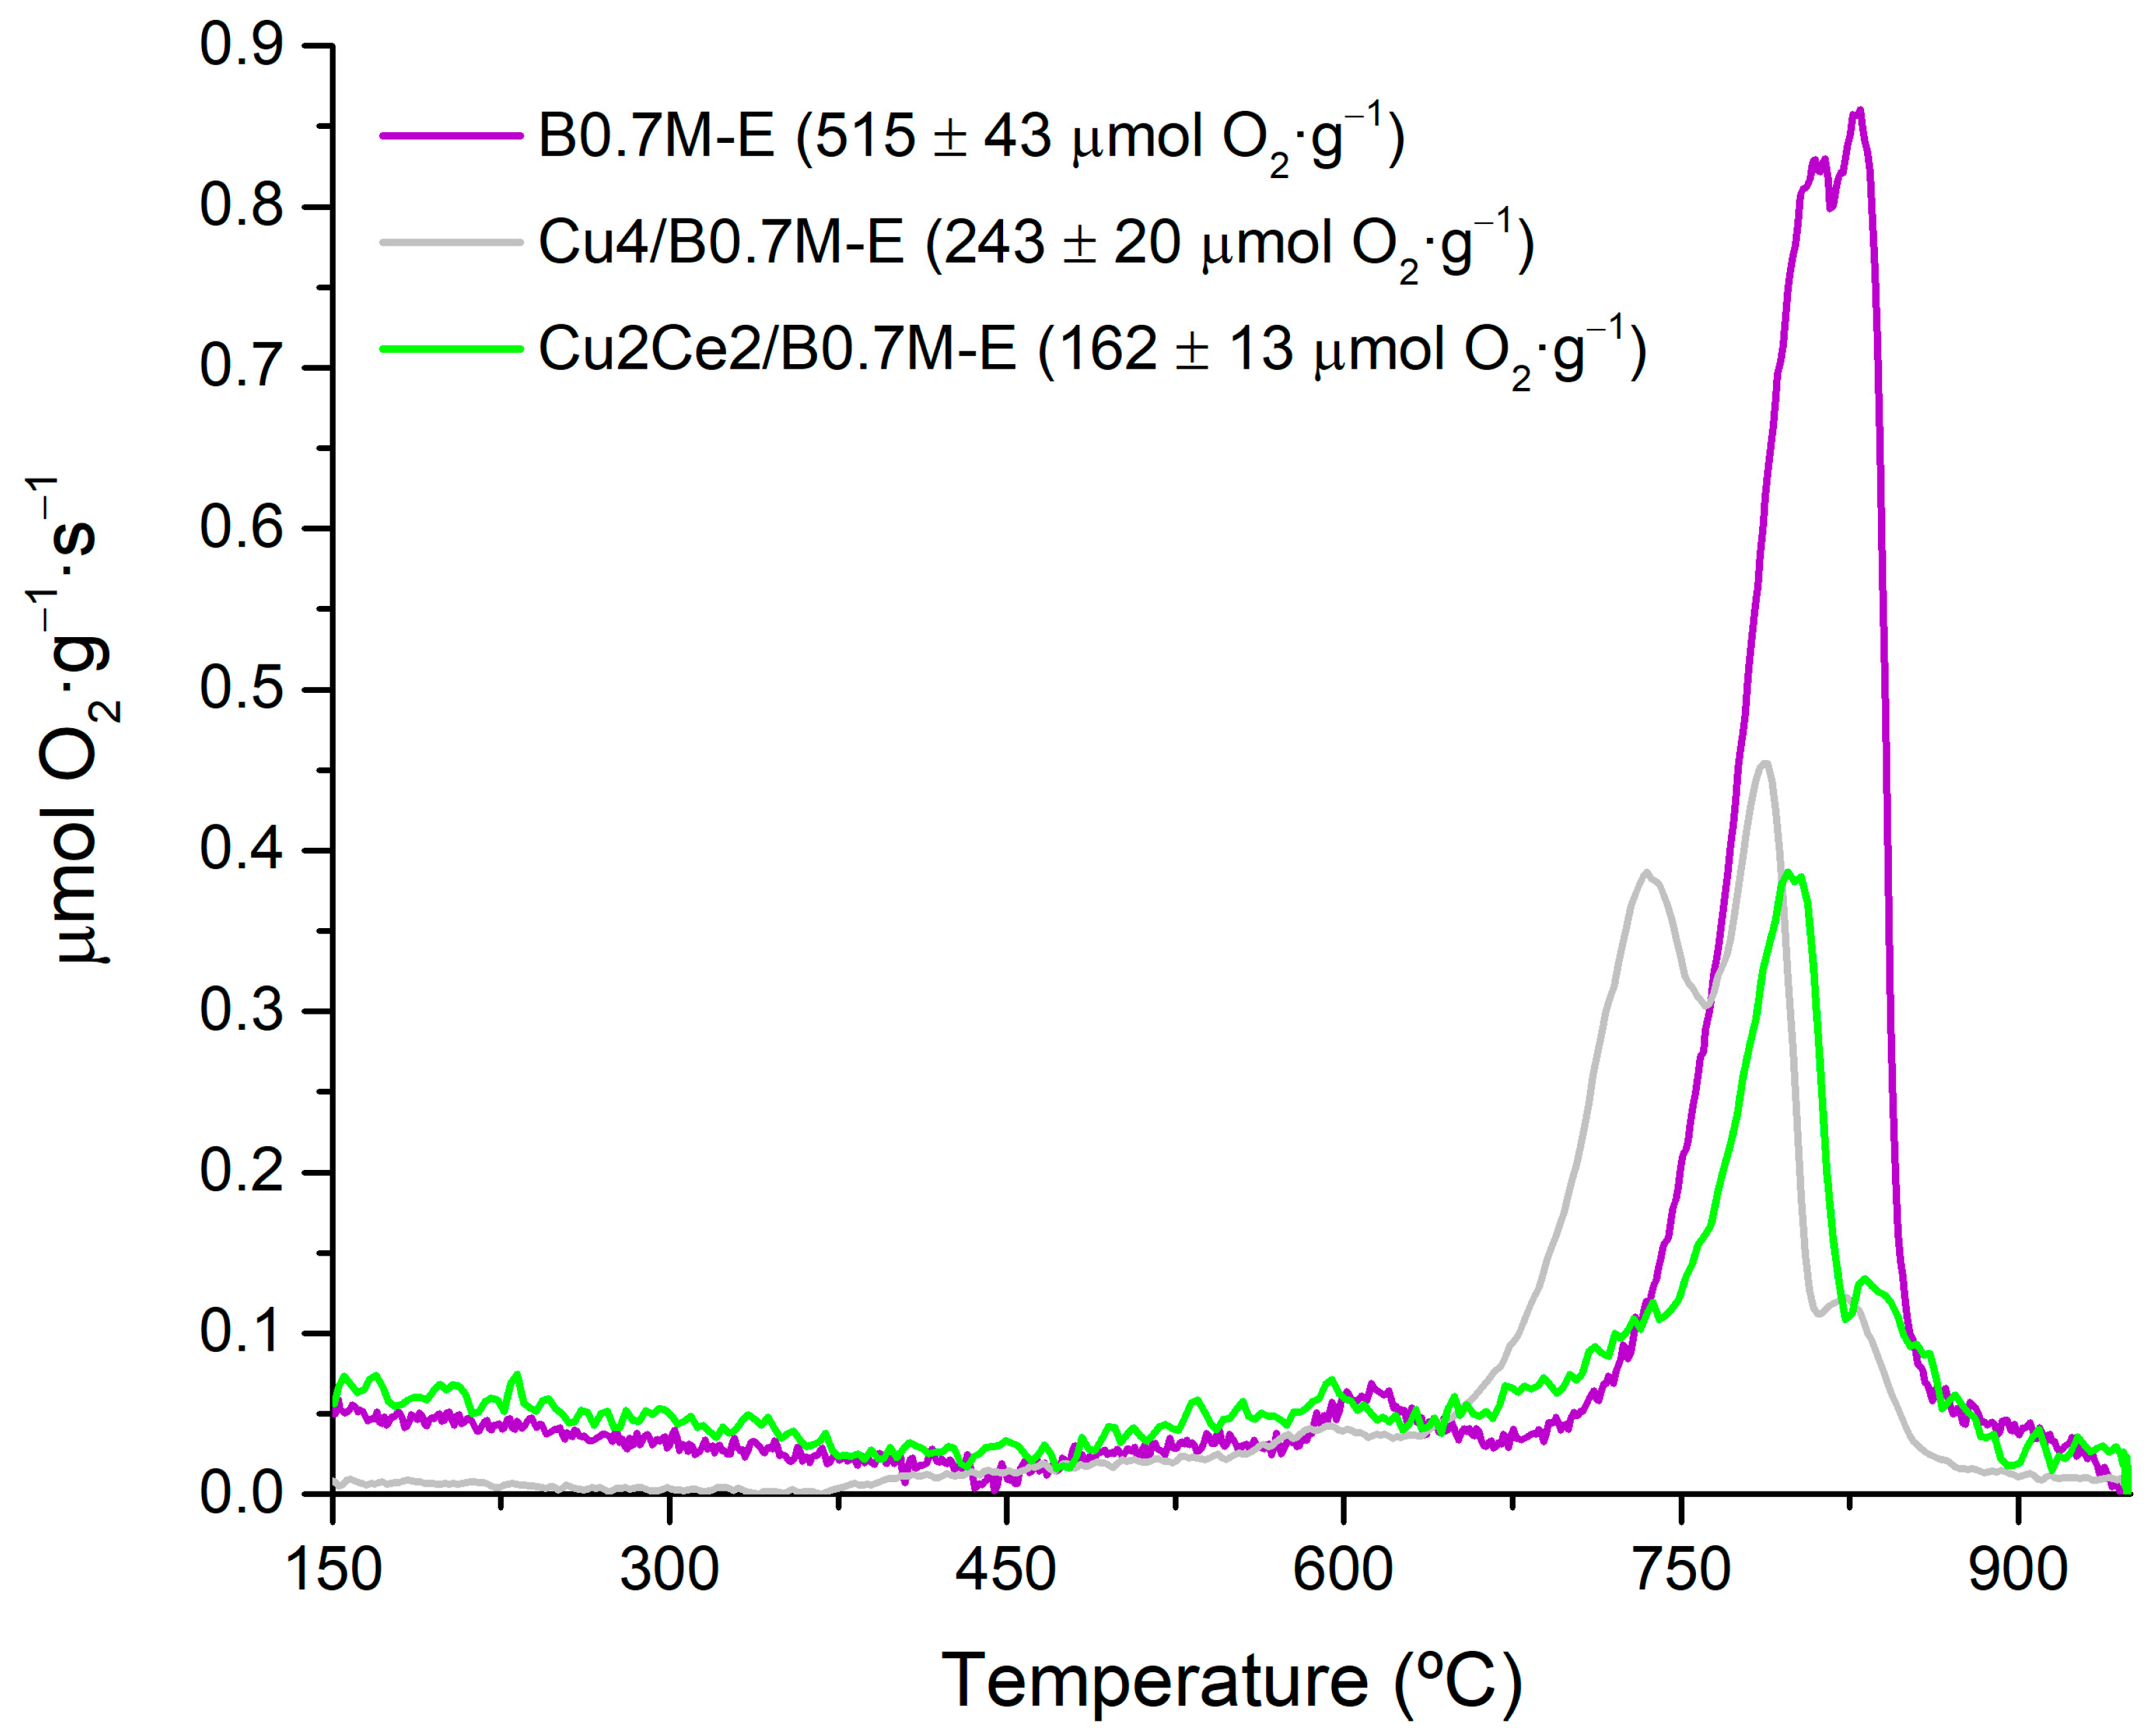
Figure 10 displays the O2 emission profiles during the O2-TPD experiments for the three samples under comparison. For perovskites, these profiles typically include the following signals: (i) between 150 and 350 °C, a peak that corresponds to the release of oxygen adsorbed on the surface defects (called α-O2); (ii) between 350 and 700 °C, the peak due to the desorption of oxygen from the lattice defects (α’-O2); and (iii) above 700 °C, the peak corresponding to the release of lattice oxygen (β-O2), which is linked with the reduction of Mn (IV) and Cu (II) according to the Reactions (9) and (10) [47,103,104]. Note that, as the CeO2 phase does not release oxygen under the tested conditions, the contribution due to the Ce(IV)/Ce(III) redox pair should not be observed [105].
2 Mn(IV) + O* ⇆ 2 Mn(III) + VO + 1/2 O2
2 Cu(II) + O* ⇆ 2 Cu(I) + VO + 1/2 O2
In reactions (9) and (10), O* represents an oxygen atom located in an oxygen site, and VO means an oxygen vacancy. Considering this information, the lower amount of oxygen detected for Cu2Ce2/B0.7M-E could be due not only to the coverage of the active sites by the impregnated phases, but also to the presence of a lower proportion of Mn (IV) in the bulk of the perovskite, as deduced for the surface from the XPS data. Additionally, note that the oxygen emission that comes from the CuO phase at around 700 °C [34] is not detected in the presence of cerium, which will also contribute to the decrease of the total oxygen emission. On the other hand, according to the proposal of X. Tan and coworkers [106], the formation of oxygen defects in the Cu-Ce solid solution promotes an oxygen emission at temperatures below 150 °C. For the Cu2Ce2/B0.7M-E sample this emission is not detected, as these oxygen species should be released during the pretreatment of the sample and, consequently, they have not been registered during the O2-TPD.

3.4.4. Catalytic Activity

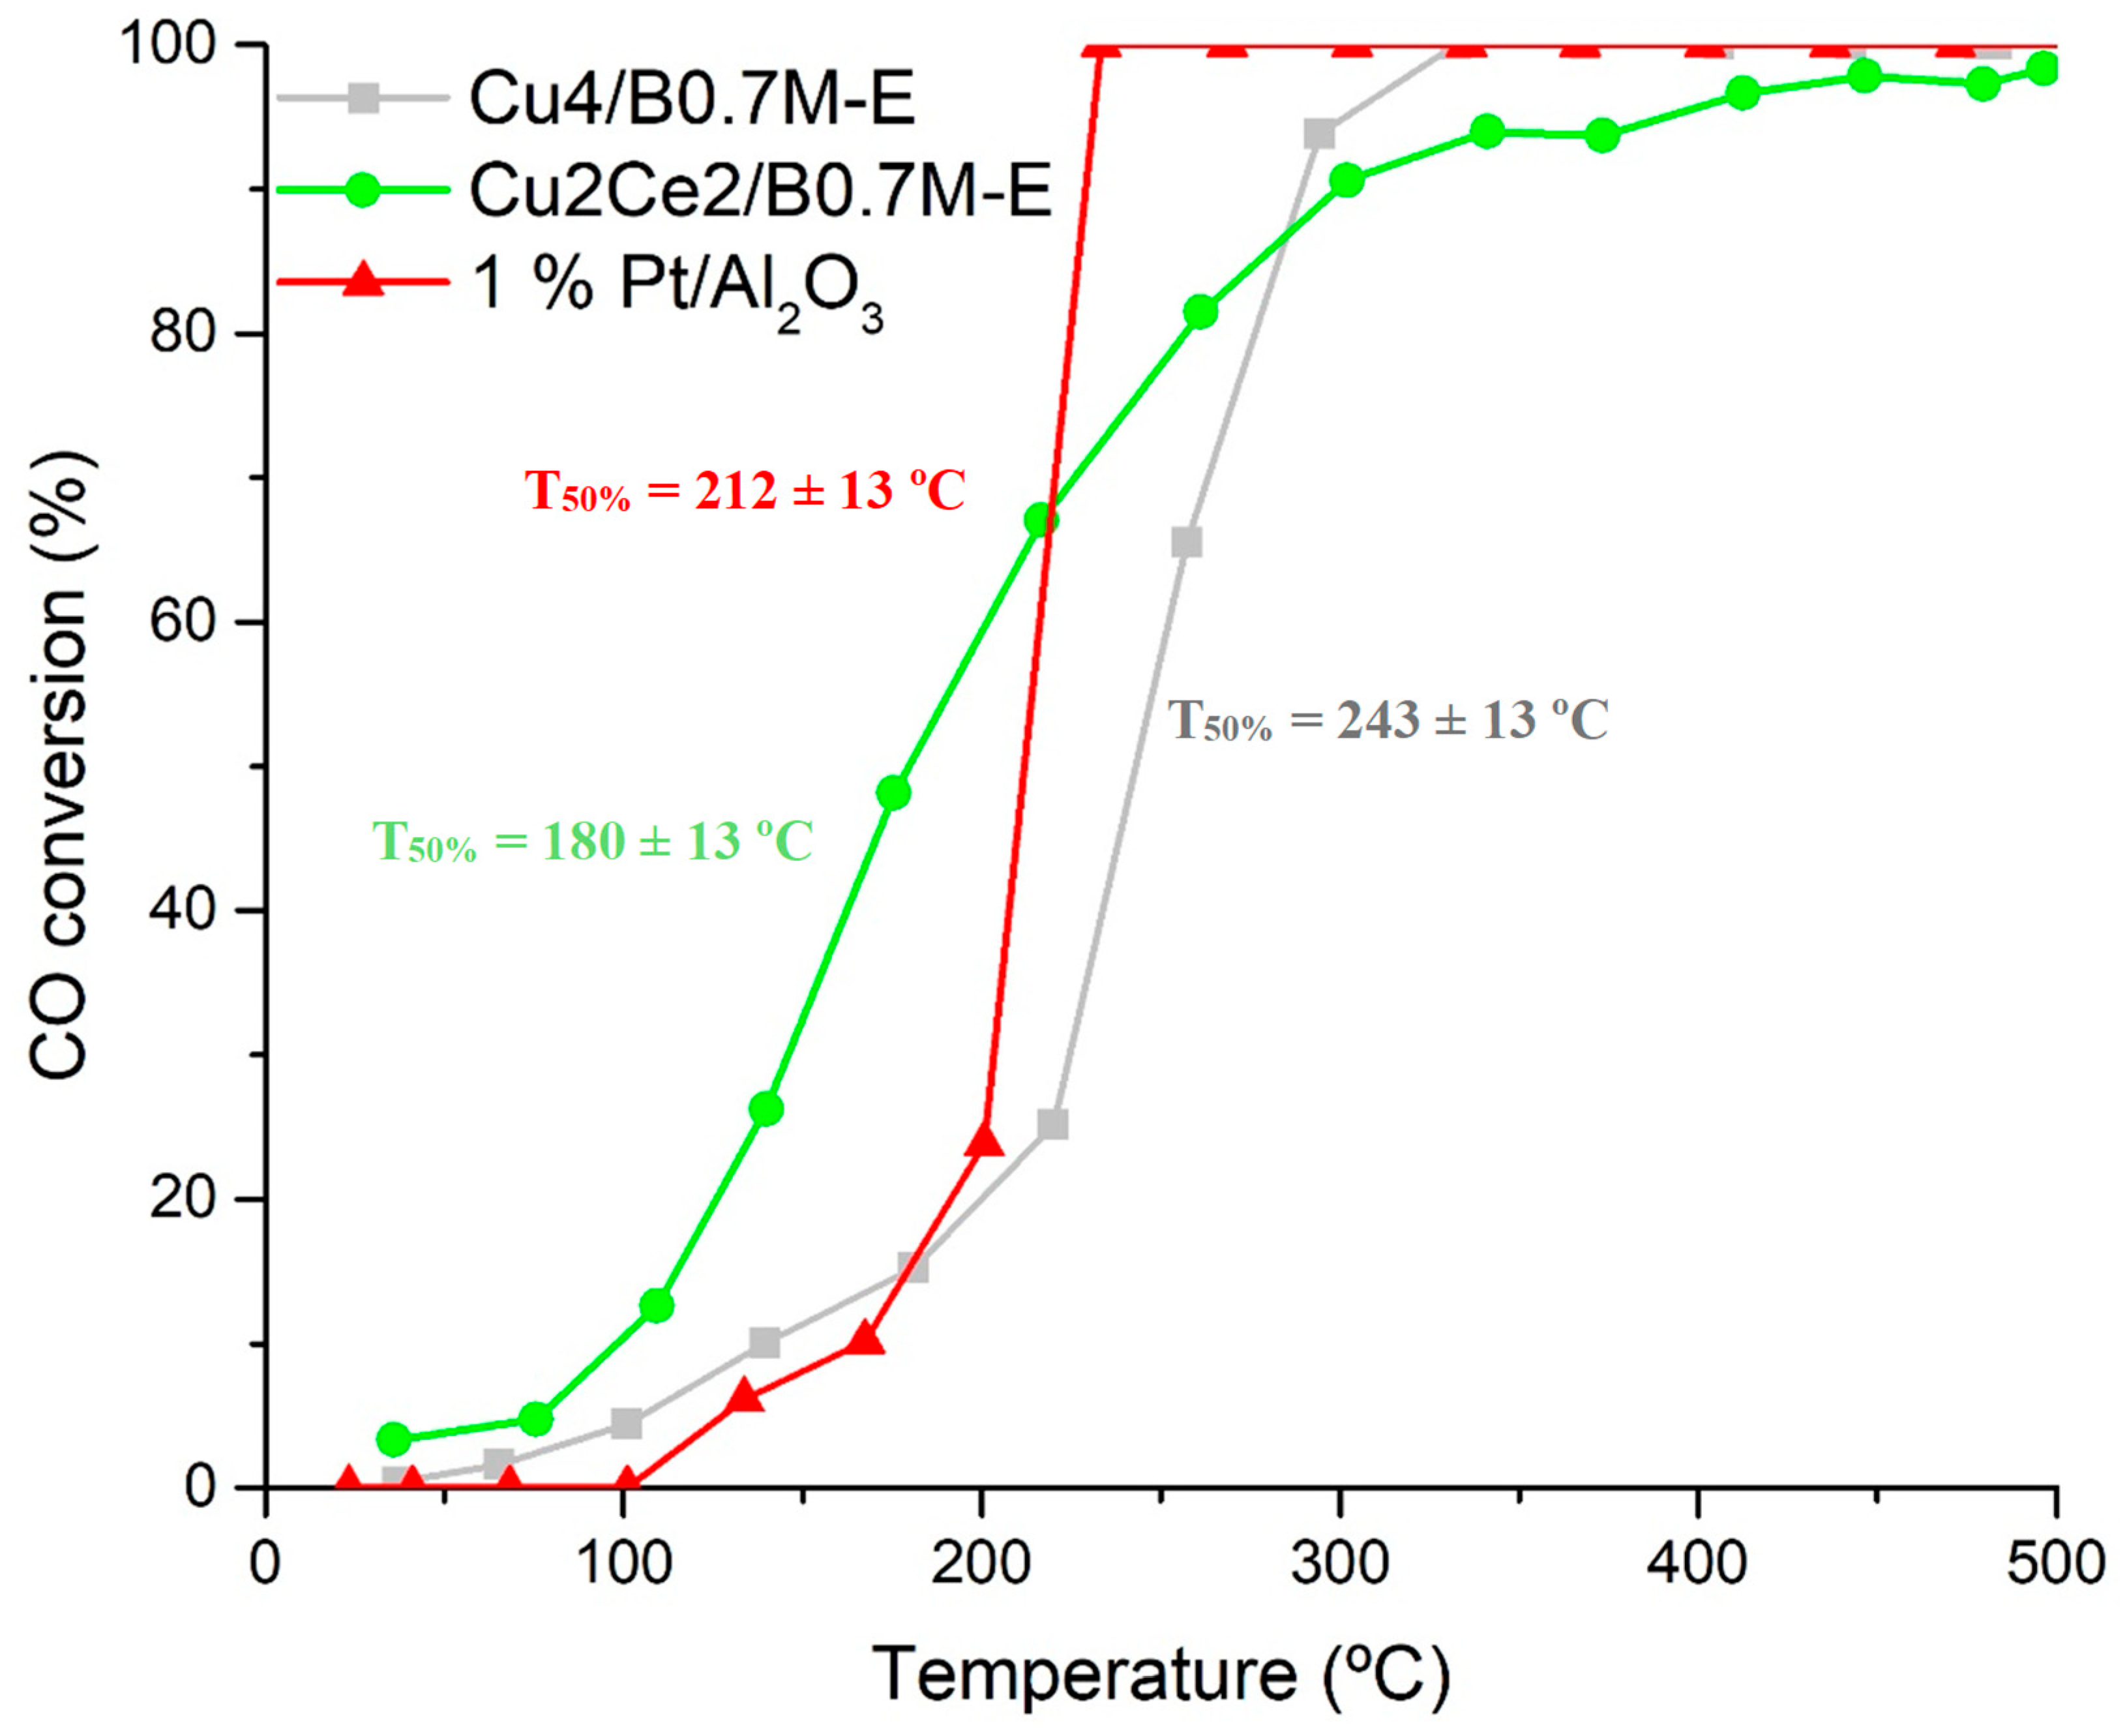
The Cu2Ce2/B0.7M-E sample was tested for the CO oxidation reaction under CO-TPRe conditions, being the CO conversion profiles under the 1% CO, 1% O2 in He reactant atmosphere compared with those of Cu4/B0.7M-E and of 1% Pt/Al2O3 (used as reference) samples in Figure 11. The bimetallic sample exhibits a higher CO conversion than the monometallic one at temperatures between 100 and 200 °C, being also higher than the shown by the Pt-based sample, being consistent with published data for copper-ceria formulations [107,108].
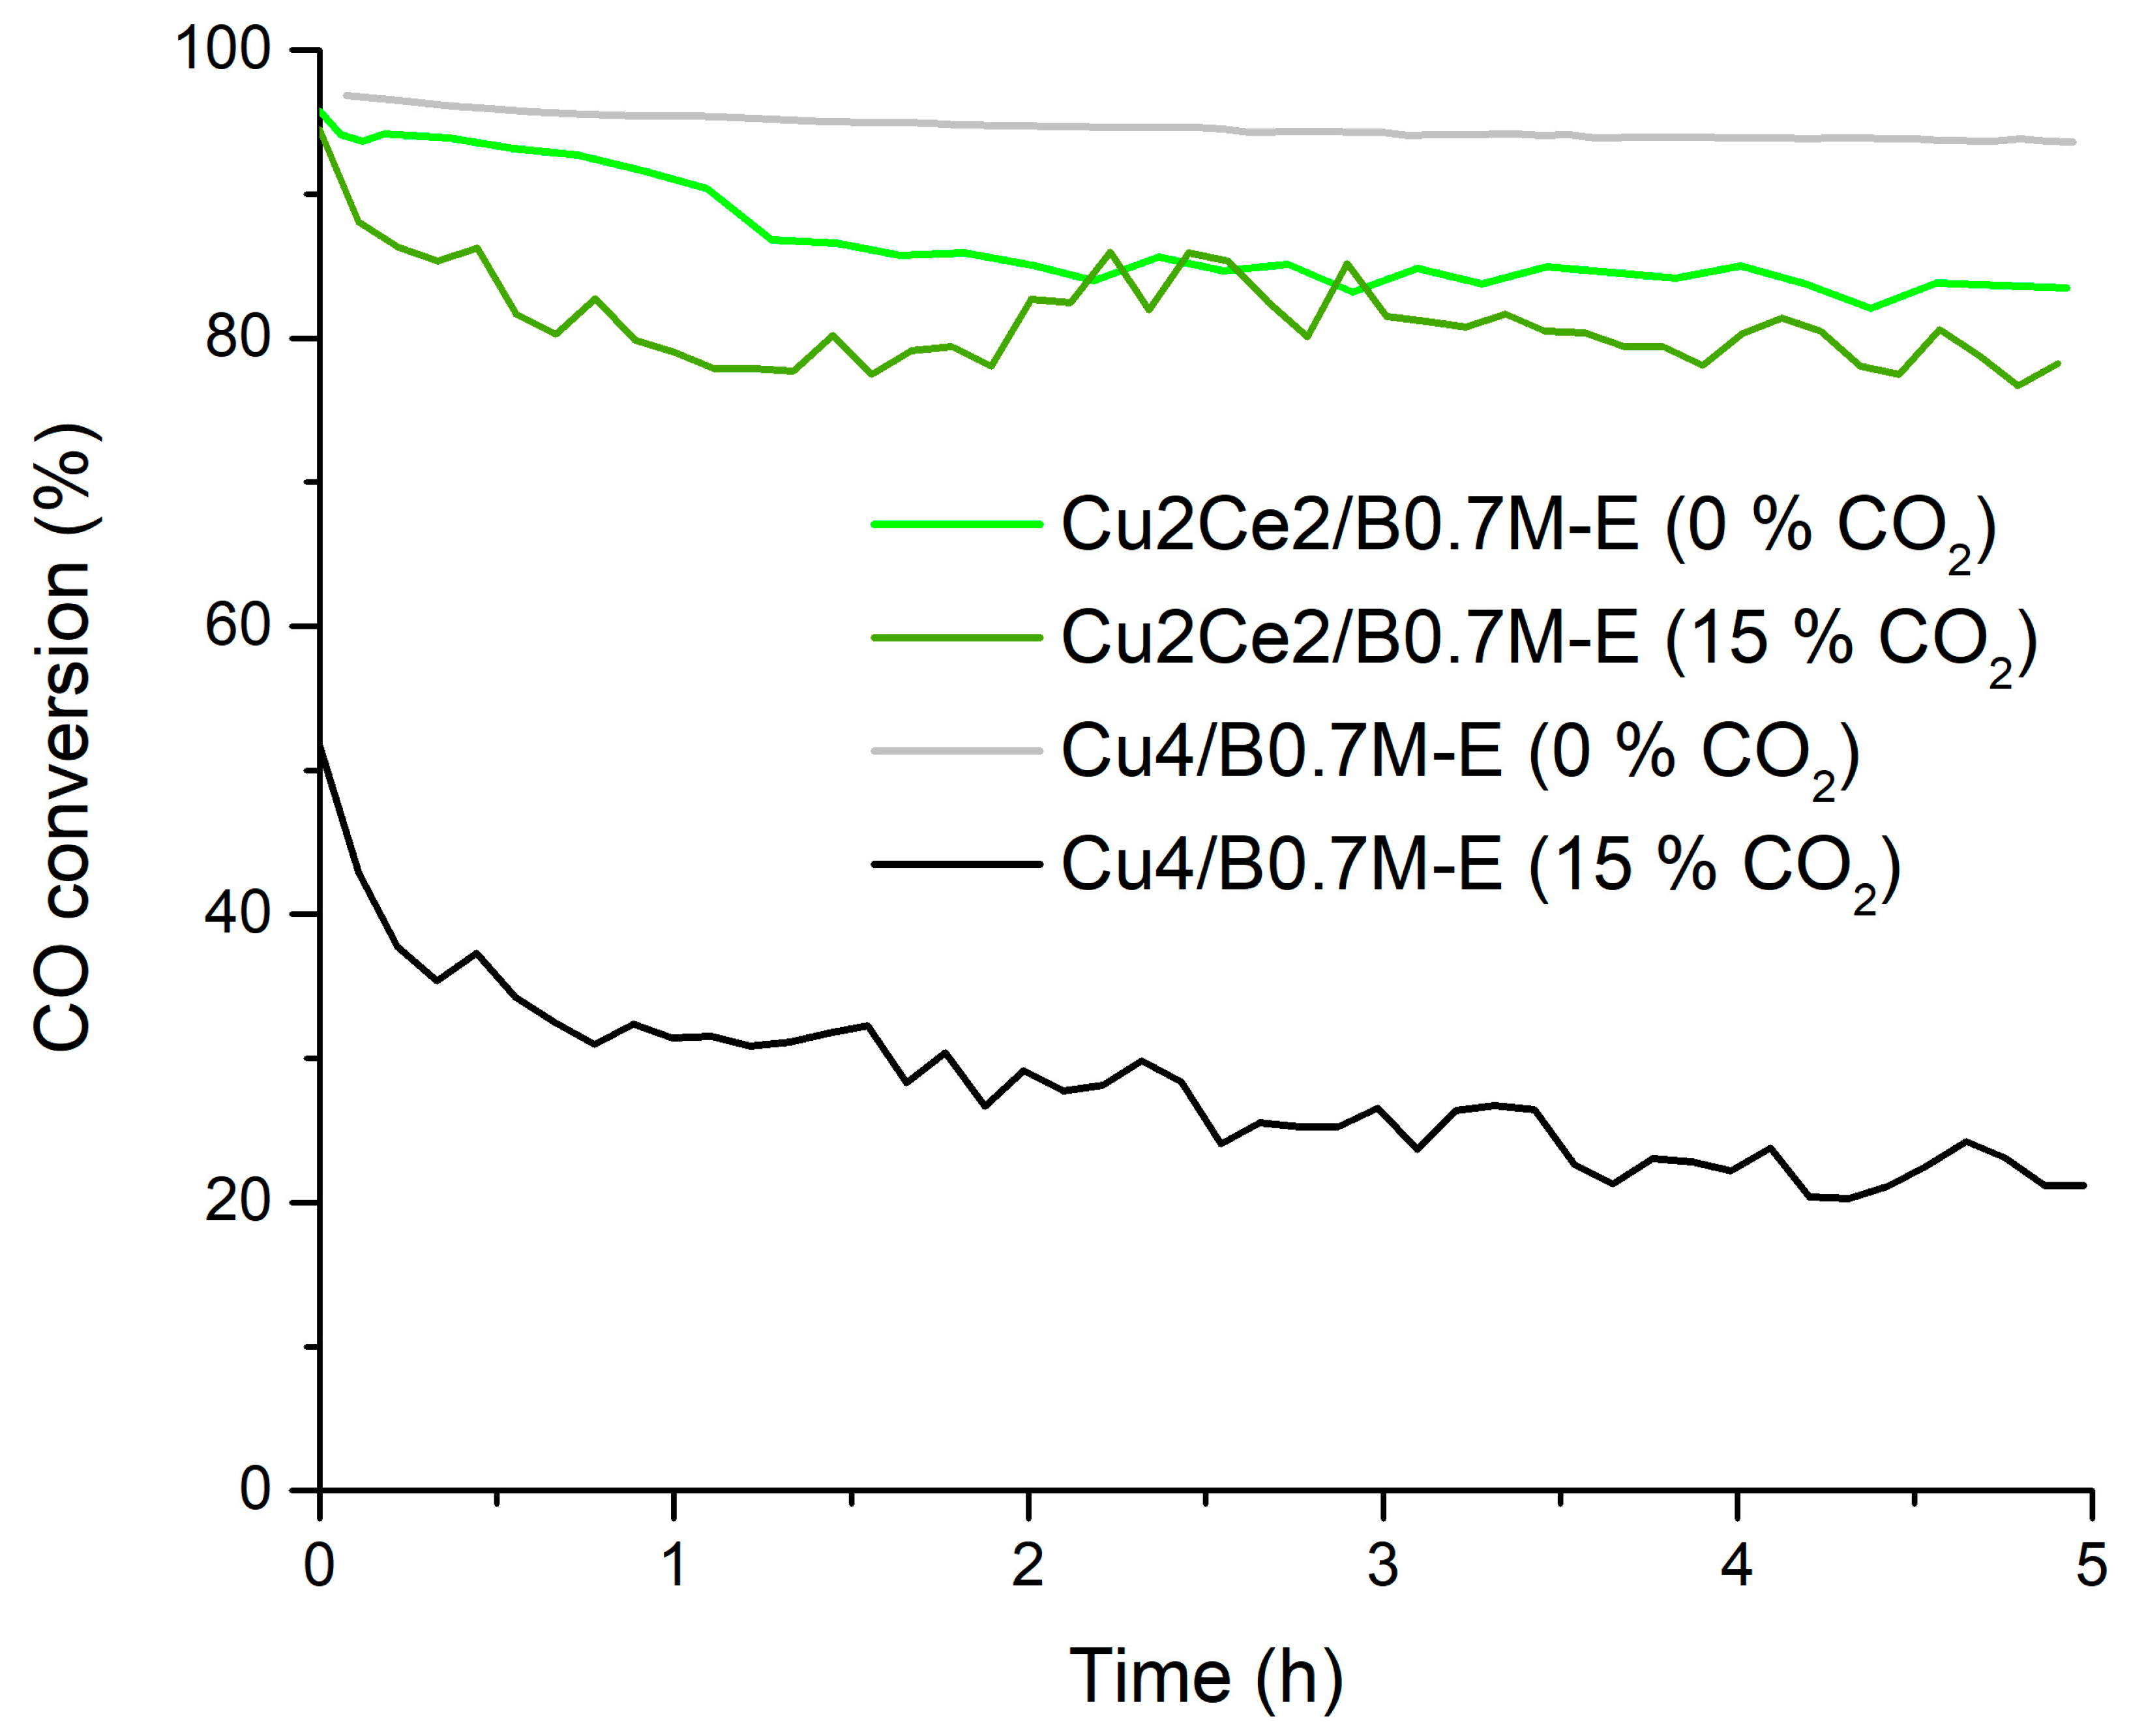
The Cu2Ce2/B0.7M-E formulation was also tested at 300 °C under the 1% CO, 1% O2 in He reactant atmosphere, both, in the absence and in the presence of 15% CO2. According to the results presented in Figure 12 and in Table 8, the bimetallic sample shows an interesting performance under the two reactant atmospheres, as it displays a notably higher CO specific activity and a significantly lower deactivation by CO2 than the Cu4/B0.7M-E sample. Thus, the carbonation degree of the active sites should be lower in the presence of Ce, as the CeO2 phase should cover the Ba sites susceptible to be carbonated, and, condequently, more active sites exist on the Cu-Ce sample. Other authors also proposed that the improvement of the performance for CO oxidation in the presence of CO2 of a Cu-Ce system, despite being the CeO2 phase susceptible to carbonation (due to its high basicity [109,110]), is due to the interaction between CeO2 and CuO that allows overcoming this drawback [111,112].
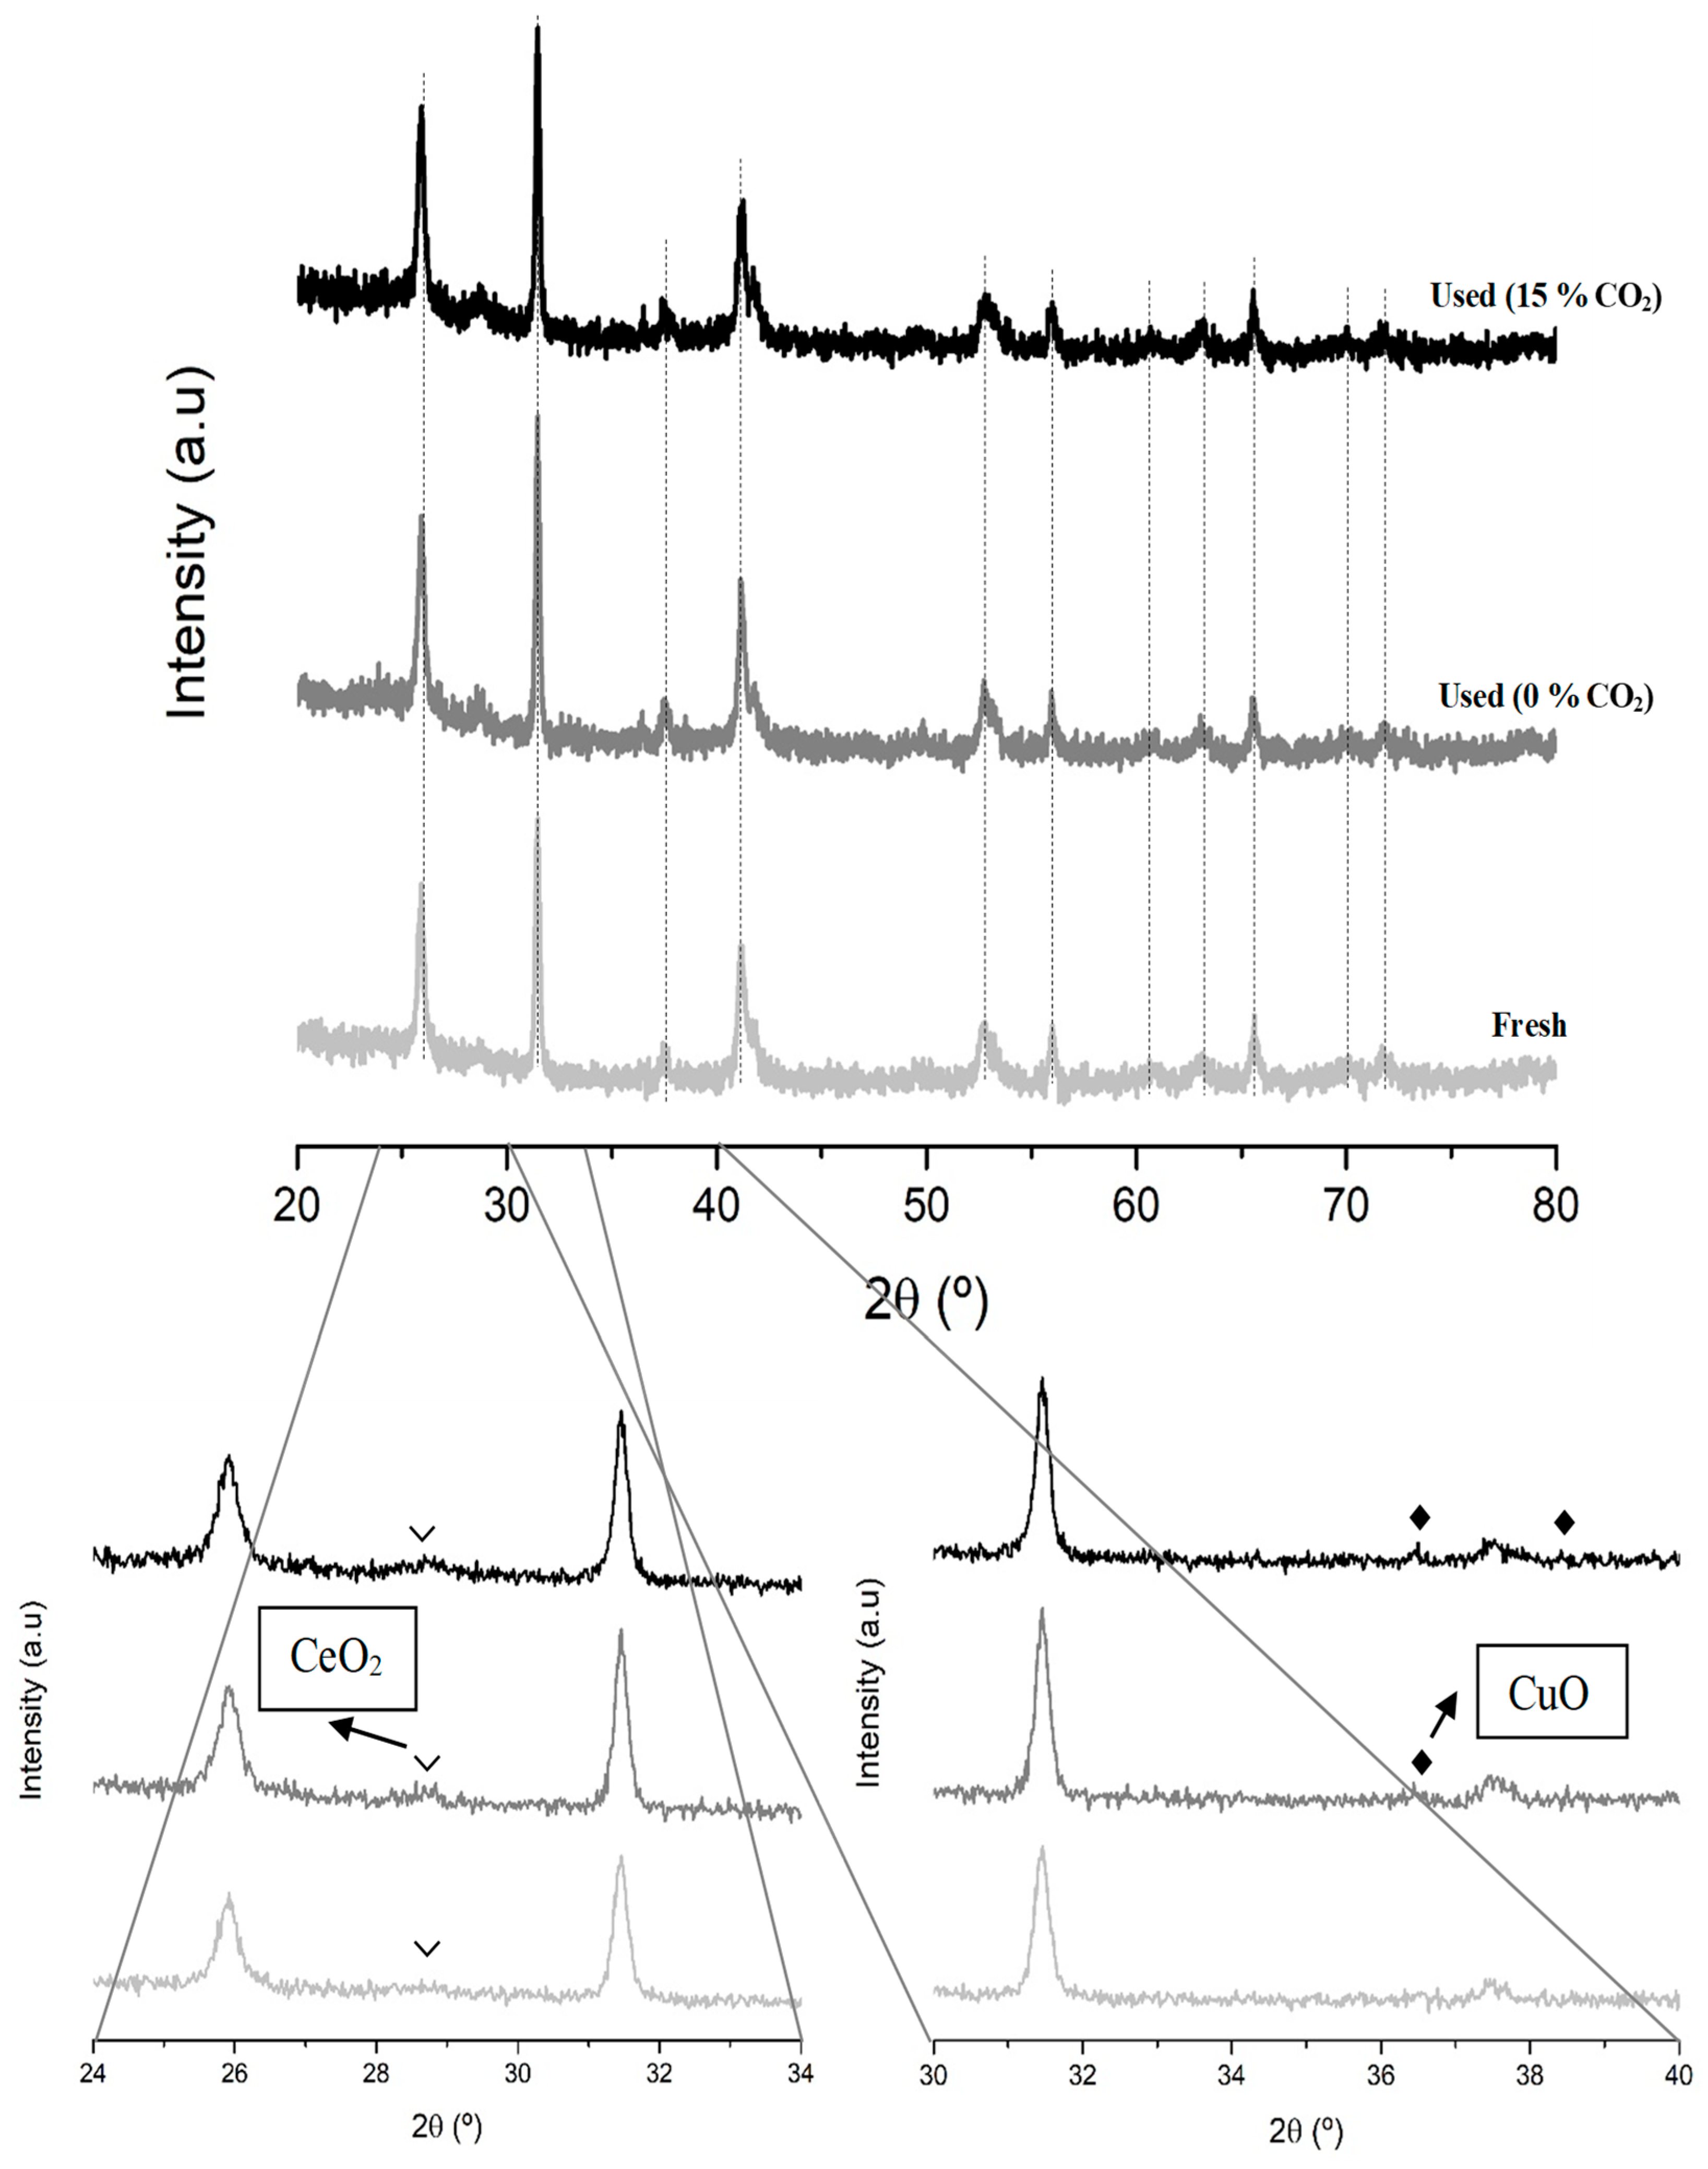
The XRD and XPS data of the Cu2Ce2/B0.7M-E sample used in the CO oxidation tests under both reactant atmosphere (Figure 13 and Table 9, respectively) provide interesting insights. The characterization data for the Cu4/B0.7M-E used sample have already been presented and discussed in the first section of this paper. Firstly, the XRD profiles indicate that the perovskite structure is not modified during the reaction, as it is also identified for the used sample. However, the XRD signals corresponding to the CuO and CeO2 phases are more intense in the used samples than in the fresh ones. On the other hand, the lower Mn(IV)/Mn(III) ratios of the used samples reveal a decrease of the Mn (IV) amount, and the significant decrease of the Ce/(Ba+Mn+Cu+Ce) ratio suggests that the amount of Ce species on the surface is lower after the reaction under the CO2-containing atmosphere. These two pieces of data seem to explain the decrease of the CO conversion over time. On the contrary, the amount of oxygen defects and of carbonate groups remained unchanged, indicating the high tolerance of the Cu2Ce2/B0.7M-E formulation to CO2. The analysis of Auger Cu L3M4.5M4.5 signal for the used samples reveals a clear shift towards lower kinetic energies. However, the similar percentages of the different Cu species on the surface reveals the high stability of Cu2Ce2/B0.7M-E under both conditions.
Finally, in order to test the stability of the Cu2Ce2/B0.7M-E sample at a longer reaction time, a stability test at 300 °C during 20 h and under the CO2-containing atmosphere was developed. As a low decrease of the CO conversion is registered (see Figure S5 in the Supplementary Information File) along the reaction time (ΔCCO = −5%), it seems that the effect of cerium would be maintained during long periods of time.

4. Conclusions

In this paper, the Ba0.8Mn0.7Cu0.3O3 (B0.8MC) and the Cu(4 wt%)/Ba0.7MnO3 (Cu4/B0.7M-E) samples, selected from previous studies developed by the authors [33,34], were subjected to CO oxidation catalytic tests under more realistic conditions, i.e., in the presence of CO2 in the reactant atmosphere. Additionally, in order to improve the performance of the Cu4/B0.7M-E sample, the Cu(2 wt%)Ce(2 wt%)/Ba0.7MnO3 (Cu2Ce2/B0.7M-E) bimetallic formulation was synthesized, characterized and tested. According to the results presented and discussed, the following conclusions can be drawn:
(i)
The B0.8MC sample showed the best catalytic performance during an isothermal reaction at 250 °C, but it featured a lower tolerance to CO2 than the Cu4/B0.7M-E sample, which was selected to be optimized by the addition of cerium.
(ii)
The impregnation of the B0.7M-E support with cerium and copper did not cause significant structural changes in the perovskite structure.
(iii)
The presence of cerium increased the fraction of the reduced copper species on the surface, improving the redox properties of the raw B0.7M-E support due to Mn-Ce synergistic effect.
(iv)
The Cu2Ce2/B0.7M-E bimetallic formulation exhibits a better catalytic performance for the CO oxidation reaction than the monometallic one, including a notably higher tolerance to CO2.

Supplementary Materials

The following supporting information can be downloaded at: https://www.mdpi.com/article/10.3390/nano15191467/s1, Table S1: Mn(IV)/Mn(III) ratios obtained by using the Mn 2p3/2 and Mn 2p1/2 transitions; Table S2: Data for the deconvolution of Cu, Cu2O and CuO references; Figure S1 (part 1): Deconvoluted Mn 2p1/2 profiles; Figure S1 (part 2): Deconvoluted Mn 2p1/2 profiles; Figure S2 (part 1): Deconvoluted Cu L3M4.5M4.5 profiles; Figure S2 (part 2): Deconvoluted Cu L3M4.5M4.5 profiles; Figure S3: EDX mapping analysis (Ba, Mn and Cu) of the Cu4/B0.7M-E and Cu2Ce2/B0.7M-E samples; Figure S4: EDX mapping analysis (Ce) of the Cu2Ce2/B0.7M-E sample; Figure S5: CO conversion profile at 300ºC of the Cu2Ce2/B0.7M-E sample in the presence of 15% CO2 during 20 h.

Author Contributions

The individual contributions of each author are as follows: Á.D.-V.: investigation, resources, data curation, and writing—original draft preparation; M.J.I.-G.: conceptualization, methodology, writing—review and editing, visualization, supervision, project administration, and funding acquisition. All authors have read and agreed to the published version of the manuscript.

Funding

This study was funded by the Generalitat Valenciana (CIPROM/2021-070 project).

Data Availability Statement

Data will be made available on request.

Acknowledgments

A. Díaz-Verde thanks the University of Alicante for his predoctoral contract.

Conflicts of Interest

The authors declare no conflicts of interest.

Abbreviations

The following abbreviations are used in this manuscript:
GHGsGreenhouse Gases
ICEsInternal Combustion Engines
HCsHydrocarbons
ICP-OESInductively Coupled Plasma Optical Emission Spectroscopy
XPSX-ray Photoelectron Spectroscopy
H2-TPRTemperature-Programmed Reduction with H2
XRDX-Ray Diffraction
JCPDSJoint Committee on Powder Diffraction Standards
ICDDInternational Centre for Diffraction Data
KEKinetic Energy
O2-TPDTemperature-Programmed Desorption of O2
TPReTemperature-Programmed Reaction
TCDThermal Conductivity Detector
TG-MSThermo Gravimetric Mass Spectrometer
TWCsThree-Way Catalysts
GHSVGas Hourly Space Velocity
FE-SEMField Emission Scanning Electron Microscopy
EDXEnergy Dispersive X-ray spectroscopy

References

  1. Sokal, K.; Kachel, M. Impact of agriculture on greenhouse gas emissions—A review. Energies 2025, 18, 2272. [Google Scholar] [CrossRef]
  2. Yao, S.; Wang, G.; Batista, E.R.; Yang, P. Defect-promoted catalytic conversion of carbon monoxide to methanol on ThO2 surfaces. ACS Appl. Mater. Interfaces 2025, 17, 28864–28872. [Google Scholar] [CrossRef]
  3. Rakha, H.A.; Farag, M.; Foroutan, H. Electric versus gasoline vehicle particulate matter and greenhouse gas emissions: Large-scale analysis. Transp. Res. D Transp. Environ. 2025, 140, 104622. [Google Scholar] [CrossRef]
  4. Folęga, P.; Burchart, D. Study of the greenhouse gas emissions from electric buses powered by renewable energy sources in Poland. Energies 2025, 18, 1807. [Google Scholar] [CrossRef]
  5. Filho, G.C.K.; Silva, F.M.F.; Fagundez, J.L.S.; da Silva, C.D.R.; Lanzanova, T.D.M.; Martins, M.E.S. Design and validation of a combustión chamber for internal combustion engines operated with methane based fuels. Appl. Therm. Eng. 2025, 271, 126007. [Google Scholar] [CrossRef]
  6. Towoju, O.A.; Ishola, F.A. A case for the internal combustion engine powered vehicle. Energy Rep. 2020, 6, 315–321. [Google Scholar] [CrossRef]
  7. Martins, J.; Brito, F.P. Alternative fuels for internal combustion engines. Energies 2020, 13, 4086. [Google Scholar] [CrossRef]
  8. Díaz-Verde, A.; Sanchis, E.J.; Martínez-Munuera, J.C.; García-García, A.; Piqueras, P. Exploring the potential of copper-based catalysts for use in CO oxidation reactions in oxy-fuel combustion engines. Fuel 2025, 391, 134807. [Google Scholar] [CrossRef]
  9. Johnsson, F.; Kjärstad, J.; Rootzén, J. The threat to climate change mitigation posed by the abundance of fossil fuels. Clim. Policy 2019, 19, 258–274. [Google Scholar] [CrossRef]
  10. Ajanovic, A. The future of electric vehicles: Prospects and impediments. WIREs Energy Environ. 2015, 4, 521–536. [Google Scholar] [CrossRef]
  11. Arif, S.M.; Lie, T.T.; Seet, B.C.; Ayyadi, S.; Jensen, K. Review of electric vehicle technologies, charging methods, standards and optimization techniques. Electronics 2021, 10, 1910. [Google Scholar] [CrossRef]
  12. Farrauto, R.J.; Deeba, M.; Alerasool, S. Gasoline automobile catalysis and its historical journey to cleaner air. Nat. Catal. 2019, 2, 603–613. [Google Scholar] [CrossRef]
  13. Resitoglu, I.A.; Ozarslan, H.; Sugozu, B.; Kaya, H.S. The structural properties of an aged catalytic converter and determining the effects on engine characteristics. Int. J. Automot. Technol. 2025, 1–10. [Google Scholar] [CrossRef]
  14. Zhang, Y.; Du, J.; Shan, Y.; Wang, F.; Liu, J.; Wang, M.; Liu, Z.; Yan, Y.; Xu, G.; He, G.; et al. Toward synergetic reduction of pollutant and greenhouse gas emissions from vehicles: A catalysis perspective. Chem. Soc. Rev. 2025, 54, 1151–1215. [Google Scholar] [CrossRef]
  15. Afzal, M.; Agarwal, S.; Elshaikh, R.H.; Babker, A.M.A.; Choudhary, R.K.; Prabhakar, P.K.; Zahir, F.; Sah, A.K. Carbon monoxide poisoning: Diagnosis, prognostic factors, treatment strategies, and future perspectives. Diagnostics 2025, 15, 581. [Google Scholar] [CrossRef]
  16. Ahn, G.J.; Lee, S.; Lee, S.J.; Cha, Y.S. Internal malignancy risk after carbon monoxide poisoning: A nationwide population-based cohort study. J. Clin. Med. 2025, 14, 937. [Google Scholar] [CrossRef] [PubMed]
  17. Li, X.; Zou, Y.; Zhao, Y.; Liu, X.; Zhu, T. Density functional theory studies of Pt-based catalysts for CO oxidation. Sci. China Technol. Sci. 2025, 68, 1310501. [Google Scholar] [CrossRef]
  18. Xu, L.; Zheng, P.; Tian, J.; Zhang, T.; Jiang, R.; Gao, J.; Zhang, L.; Xu, G.; Zhong, Z.; Su, F. Understanding the synergistic catalytic functions of Cu-Pt active sites in the bimetallic CuPt/ZrO2 catalyst in CO oxidation. J. Catal. 2025, 444, 115995. [Google Scholar] [CrossRef]
  19. Ghafoor, A.; Lotfi, M.; Gomaa, A.A.; Goldbach, A.; Shen, W. CO oxidation over nanostructured Pt/ZnO catalysts. ACS Appl. Nano Mater. 2025, 8, 3887–3898. [Google Scholar] [CrossRef]
  20. Xu, J.; Zhang, J.; Xu, L.; Wang, S.; Yao, S. Revealing the positive and negative effects of strong metal support interactions on CO oxidation for Pt-supported different crystals (β- and γ-) MnO2 catalysts: Pt oxides and carbonate species. Appl. Catal. A Gen. 2025, 691, 120075. [Google Scholar] [CrossRef]
  21. Kautsar, D.B.; Le, P.H.; Ando, A.; Tanabe, E.; Cao, K.L.A.; Septiani, E.L.; Hirano, T.; Ogi, T. Enhancing CO oxidation performance by controlling the interconnected pore structure in porous three-way catalyst particles. Nanoscale 2025, 17, 2841–2851. [Google Scholar] [CrossRef] [PubMed]
  22. Zhang, Z.; Zhang, D.; Li, D.; He, L.; Guo, Z.; Yeli, G.; Zhang, X.; Liu, B.; Tan, H.; Zhang, F.; et al. Oxygen vacancies promote the activation of O2 in transition metal oxide doped ε-MnO2 for low-temperature CO oxidation. Sep. Purif. Technol. 2025, 352, 128109. [Google Scholar] [CrossRef]
  23. Hu, Z.; Zhou, X.; Zhang, T.; Wu, Z.; Li, J.; Wang, W.; Gao, E.; Zhu, J.; Yao, S. In-situ synthesized Co3O4/Mn3O4 on monolithic nickel foam: Enhanced CO oxidation via MOF-74 derivation. Fuel 2025, 388, 134504. [Google Scholar] [CrossRef]
  24. Zhou, X.; Fang, S.; Zhang, T.; Wu, Z.; Li, J.; Wang, W.; Zhu, J.; Wu, J.; Ye, D.; Han, R.; et al. Unveiling the mechanistic synergy in Mn-doped NiO catalysts with atomic-burry structure: Enhanced CO oxidation via Ni-OH and Mn bifunctionality. Sep. Purif. Technol. 2025, 354, 129330. [Google Scholar] [CrossRef]
  25. Glisenti, A.; Pacella, M.; Guiotto, M.; Natile, M.M.; Canu, P. Largely Cu-doped LaCo1-xCuxO3 perovskites for TWC: Toward new PGM-free catalysts. Appl. Catal. B Environ. 2016, 180, 94–105. [Google Scholar] [CrossRef]
  26. Gan, L.; Ye, P.; Tian, X.; Wu, Q.; Shi, H.; Xiong, S.; Chen, J.; Li, J. Mechanism of B-site modulation in LaBO3 perovskites (B=Fe, Co, Ni) promoting CO catalytic oxidation. Appl. Surf. Sci. 2025, 686, 162215. [Google Scholar] [CrossRef]
  27. Felli, A.; Toso, A.; Braga, A.; Colussi, S.; Boaro, M.; Llorca, J.; Truscott, B.; Artner-Wallner, C.; Trovarelli, A. Perovskite-derived MnOx/LaMnO3 nanocomposites to boost CO oxidation activity. Catal. Sci. Technol. 2025, 15, 1882–1893. [Google Scholar] [CrossRef]
  28. Rizzato, L.; Cavazzani, J.; Osti, A.; Scavini, M.; Glisenti, A. Cu-doped SrTiO3 nanostructured catalysts for CO2 conversion into solar fuels using localized surface plasmon resonance. Catalysts 2023, 13, 1377. [Google Scholar] [CrossRef]
  29. Senoner, B.; Osti, A.; Glisenti, A. Enhancing coking resistance of nickel-based catalysts for dry reforming of methane via nitric oxide abatement: A support study. Catal. Sci. Technol. 2024, 14, 6678–6691. [Google Scholar] [CrossRef]
  30. Osti, A.; Rizzato, L.; Cavazzani, J.; Glisenti, A. Optimizing citrate combustion synthesis of A-site-deficient La,Mn-based perovskites: Application for catalytic CH4 combustion in stoichiometric conditions. Catalysts 2023, 13, 1177. [Google Scholar] [CrossRef]
  31. Ofoegbuna, T.; Darapaneni, P.; Sahu, S.; Plaisance, C.; Dorman, J.A. Stabilizing the B-site oxidation state in ABO3 perovskite nanoparticles. Nanoscale 2019, 11, 14303–14311. [Google Scholar] [CrossRef] [PubMed]
  32. Díaz-Verde, Á.; Illán-Gómez, M.J. Enhancing the performance of BaxMnO3 (x = 1, 0.9, 0.8 and 0.7) perovskites as catalysts for CO oxidation by decreasing the Ba content. Nanomaterials 2024, 14, 1334. [Google Scholar] [CrossRef]
  33. Díaz-Verde, A.; Torregrosa-Rivero, V.; Illán-Gómez, M.J. Copper catalysts supported on barium deficient perovskites for CO oxidation reaction. Top. Catal. 2023, 66, 695–907. [Google Scholar] [CrossRef]
  34. Díaz-Verde, Á.; dos Santos Veiga, E.L.; Beltrán-Mir, H.; Illán-Gómez, M.J.; Cordoncillo-Cordoncillo, E. Non-stoichiometric BaxMn0.7Cu0.3O3 perovskites as catalysts for CO oxidation: Optimizing the Ba content. Nanomaterials 2025, 15, 103. [Google Scholar] [CrossRef]
  35. Yin, C.; Lei, Y.; Wu, H.; Xu, Y.; Luo, H.; Wang, H. Synergistic effect of Cu and Ag on porous (Cu, Ag) co-doped CeO2 nanosheets for low-temperature CO oxidation. Inorg. Chem. Commun. 2025, 172, 113729. [Google Scholar] [CrossRef]
  36. Martínez-Munuera, J.C.; Serrano-Martínez, V.M.; Giménez-Mañogil, J.; Yeste, M.P.; García-García, A. Unraveling the nature of active sites onto copper/ceria-zirconia catalysts for low temperature CO oxidation. Catal. Today 2022, 384–386, 246–256. [Google Scholar] [CrossRef]
  37. Martínez-Munuera, J.C.; Yeste, M.P.; García-García, A. CO oxidation under lean and stoichiometric conditions over ceria-zirconia with very low metal contents (Cu, Co, Ag and Pt). J. Rare Earths 2024, 42, 1669–1681. [Google Scholar] [CrossRef]
  38. Pakharukova, V.P.; Kriventsov, V.V.; Ishchenko, A.V.; Potemkin, D.I.; Snytnikov, P.V. Structural studies of copper species in supported CuO/CeO2 catalyst by X-ray absorption spectroscopy coupled with pair distribution function analysis. J. Clust. Sci. 2025, 36, 18. [Google Scholar] [CrossRef]
  39. Gu, X.; Zhu, S.; Liu, S.; Chong, C.H. Preparation of perovskite catalysts and their mechanism of catalytic degradation and regeneration of waste polyisocyanurate. Polym. Degrad. Stab. 2025, 232, 111138. [Google Scholar] [CrossRef]
  40. Liu, H.; Li, Y.; Wei, J. High performance Mn/Mg co-modified calcium-based material via EDTA chelating agent for effective solar energy storage. Chem. Eng. J. 2024, 480, 147892. [Google Scholar] [CrossRef]
  41. Oliveira, G.V.; de Macedo, V.; Urquieta-González, E.A.; Magriotis, Z.M.; Pereira, C.A. Fe2O3/γ-Al2O3 and NiO/γ-Al2O3 catalysts for the selective catalytic oxidation of ammonia. Catal. Today 2025, 444, 114991. [Google Scholar] [CrossRef]
  42. Megía, P.J.; García-Moreno, L.; Vizcaíno, A.J.; Calles, J.A.; Carrero, A. Bioethanol steam reforming for hydrogen production over Ni-Cr/SBA 15: Influence of metal loading and Ni/Cr ratio. Molecules 2025, 30, 1206. [Google Scholar] [CrossRef]
  43. Alam, M.A.; Ahmed, S.; Bishwas, R.K.; Mostofa, S.; Jahan, S.A. X-ray crystallographic diffraction study by whole powder pattern fitting (WPPF) method: Refinement of crystalline nanostructure polymorphs TiO2. S. Afr. J. Chem. Eng. 2025, 51, 68–77. [Google Scholar] [CrossRef]
  44. Coskuner, A.B.; Erdil, T.; Ozgur, C.; Geyikci, U.; Toparli, C. Tuning the lattice strain through manipulating crystal structure of high entropy oxides enhances electrocatalytic performance. Mater. Res. Bull. 2025, 186, 113333. [Google Scholar] [CrossRef]
  45. Peter, R.; Petravic, M. Initial stages of oxide formation on copper surfaces during oxygen bombardment at room temperature. J. Phys. Chem. C 2021, 125, 25290–25297. [Google Scholar] [CrossRef]
  46. Fandré, J.P.; Pennell, S.; Ramesh, S.L.; Lopez, J.; Spolenak, R.; Dunand, D.C. Hierarchically porous SnO2/Cu composites via freeze casting and selective Cu reduction. Adv. Eng. Mater. 2025, 27, 2402635. [Google Scholar] [CrossRef]
  47. Duell, B.A.; Ramazani, A.; Natesakhawat, S.; Popczun, E.J.; Lekse, J.W.; Duan, Y. Targeted chemical looping materials discovery by an inverse design. Adv. Intell. Syst. 2025, 7, 2401118. [Google Scholar] [CrossRef]
  48. Guiotto, M.; Pacella, M.; Perin, G.; Iovino, A.; Michelon, N.; Natile, M.M.; Glisenti, A.; Canu, P. Washcoating vs. direct synthesis of LaCoO3 on monoliths for environmental applications. Appl. Catal. A Gen. 2015, 499, 146–157. [Google Scholar] [CrossRef]
  49. Park, D.C.; Moon, S.; Song, J.H.; Kim, H.; Lee, E.; Lim, Y.H.; Kim, D.H. Widening the operating window of Pt/ZSM-5 catalysts for efficient NOx removal in H2-SCR: Insights from thermal aging. Catal. Today 2024, 425, 114318. [Google Scholar] [CrossRef]
  50. Wang, F.; Da, B.; Jin, Y.; Sanwal, P.; Cui, L.; Chen, S.; Xu, J.; Xue, B.; Li, G. Insight into the effect of manganese oxidation state on the synthesis of ethylene urea from CO2 and ethylenediamine. J. Environ. Sci. 2025, 155, 37–47. [Google Scholar] [CrossRef] [PubMed]
  51. Raciulete, M.; Anastasescu, C.; Papa, F.; Atkinson, I.; Bradu, C.; Negrila, C.; Eftemie, D.I.; Culita, D.C.; Miyazaki, A.; Bratan, V.; et al. Band-gap engineering of layered perovskites by Cu spacer insertion as photocatalysts for depollution reaction. Catalysts 2022, 12, 1529. [Google Scholar] [CrossRef]
  52. Yang, Y.; Yan, X.; Liu, J.; Liu, F.; Li, Y. Reaction mechanism and microkinetics of CO catalytic combustion over Ni-doped LaCoO3 perovskite. Proc. Combust. Inst. 2023, 39, 5621–5635. [Google Scholar] [CrossRef]
  53. González-Varela, D.; Araiza, D.G.; Díaz, G.; Pfeiffer, H. LaNiO3 perovskite synthesis through the EDTA-citrate complexing method and its application to CO oxidation. Catalysts 2022, 12, 57. [Google Scholar] [CrossRef]
  54. Popa, I.M.; Pischetola, C.; Krumeich, F.; van Bokhoven, J.A.; Carja, G.; Artiglia, L. Exploiting the LDH memory effect in the carbon dioxide to methanol conversion. Adv. Funct. Mater. 2025, 35, 2502812. [Google Scholar] [CrossRef]
  55. Belda-Marco, S.; Lillo-Ródenas, M.A.; Román-Martínez, M.C. Optimization of active sites in TiO2-Cu photocatalysts for H2 generation via cellulose photo-reforming. ChemCatChem 2025, 17, e202500250. [Google Scholar] [CrossRef]
  56. LaSurface Database. Available online: http://www.lasurface.com/accueil/ (accessed on 15 May 2025).
  57. Chitchak, K.; Jaisabuy, K.; Vanalabhpatana, P. Metal salen electrocatalysts for electro-reduction of carbon dioxide. Catal. Lett. 2025, 155, 173. [Google Scholar] [CrossRef]
  58. Zhang, E.; Song, X.; Chen, J.; Zhang, B.; Wang, G. Hydrothermal synthesis of magnetic cube-like copper ferrite nanocrystallines for reduction 4-nitrophenol. Part. Part. Syst. Charact. 2025, 42, 2400218. [Google Scholar] [CrossRef]
  59. Ulyanov, A.N.; Yu, S.C.; Yang, D.S. Mn-site-substituted lanthanum manganites: Destruction of electron pathway and local structure effects on Curie temperature. J. Magn. Magn. Mater. 2004, 282, 303–306. [Google Scholar] [CrossRef]
  60. Yang, Z.; Sun, Y.; Li, P.; Zhang, S.; Sun, X.; Cheng, S.; Jiang, Y. High-performance MnOx-CuO catalysts for low-temperature CO oxidation: Metal interaction and reaction mechanism. Mol. Catal. 2025, 576, 114945. [Google Scholar] [CrossRef]
  61. Song, Y.; Liu, Y.; Liu, W.; Zhao, Z.; Liu, X.; Xu, Y.; Li, T. Enhancing the CO oxidation performance of copper by alloying with immiscible tantalum. ACS Appl. Mater. Interfaces 2025, 17, 6377–6384. [Google Scholar] [CrossRef]
  62. Thormählen, P.; Fridell, E.; Cruise, N.; Skoglundh, M.; Palmqvist, A. The influence of CO2, C3H6, NO, H2, H2O or SO2 on the low-temperature oxidation of CO on a cobalt-aluminate spinel catalyst (Co1.66Al1.34O4). Appl. Catal. B Environ. 2001, 31, 1–12. [Google Scholar] [CrossRef]
  63. Deng, Y.; Wang, T.; Zhu, L.; Jia, A.P.; Lu, J.Q.; Luo, M.F. Enhanced performance of CO oxidation over Pt/CuCrOx catalyst in the presence of CO2 and H2O. Appl. Surf. Sci. 2018, 442, 613–621. [Google Scholar] [CrossRef]
  64. Royer, S.; Duprez, D. Catalytic oxidation of carbon monoxide over transition metal oxides. ChemCatChem 2010, 3, 24–65. [Google Scholar] [CrossRef]
  65. Maul, J.; dos Santos, I.M.G.; Sabrano, J.R.; Casassa, S.; Erba, A. A quantum-mechanical investigation of oxygen vacancies and copper doping in the orthorrombic CaSnO3 perovskite. Phys. Chem. Chem. Phys. 2018, 20, 20970–20980. [Google Scholar] [CrossRef]
  66. Liu, X.; Ren, X.; Shao, Y.; Dong, A.; Yang, C.; Li, K.; Zhou, B.; Wu, H.; Li, Z. Unveiling reduction of NH3 production in Pd-based Three-Way Catalyst modified by Ru. Catal. Lett. 2025, 155, 101. [Google Scholar] [CrossRef]
  67. Balzarotti, R.; Peressut, A.B.; Garbarino, G.; Spennati, E.; Basbus, J.F.; Carpanese, M.P.; Latorrata, S.; Cristiani, C.; Finocchio, E. A study of redox properties of ceria and Fe-ceria solid materials through small molecules catalytic oxidation. Materials 2025, 18, 806. [Google Scholar] [CrossRef] [PubMed]
  68. Prieur, D.; Bonani, W.; Popa, K.; Walter, O.; Kriegsman, K.W.; Engelhard, M.H.; Guo, X.; Eloirdi, R.; Gouder, T.; Beck, A.; et al. Size dependence of lattice parameter and electronic structure in CeO2 nanoparticles. Inorg. Chem. 2020, 59, 5760–5767. [Google Scholar] [CrossRef] [PubMed]
  69. Bueno-Ferrer, C.; Parres-Esclapez, S.; Lozano-Castelló, D.; Bueno-López, A. Relationship between surface area and crystal size of pure and doped cerium oxides. J. Rare Earths 2010, 28, 647–653. [Google Scholar] [CrossRef]
  70. Alshaikh, H.; Mohamed, R.M. Synthesis of barium titanate nanocrystals decorated with PtO for enhanced photooxidative desulfurization of thiophene. Mater. Sci. Eng. B 2025, 314, 118028. [Google Scholar] [CrossRef]
  71. Zeng, Z.; Wu, J.; Xia, C.; Yuan, S.; Ren, X.; Zhao, L.; Zhuang, L.; He, Y. Boosting photocatalytic efficiency with ohmic contact: A novel Bi/BaTiO3 composite for nitrogen fixation and RhB degradation. J. Alloys Compd. 2025, 1010, 178312. [Google Scholar] [CrossRef]
  72. Padalia, D.; Kumar, U.; Bhandari, P.; Dalal, J.; Ranakoti, L.; Singh, T. Tuning the structural, optical, and dielectric properties of europium-doped barium titanate ceramics. J. Mater. Sci. Mater. Electron. 2024, 35, 1375. [Google Scholar] [CrossRef]
  73. Garbujo, A.; Pacella, M.; Natile, M.M.; Guiotto, M.; Fabro, J.; Canu, P.; Glisenti, A. On A-doping strategy for tuning the TWC catalytic performance of perovskite based catalysts. Appl. Catal. A Gen. 2017, 544, 94–107. [Google Scholar] [CrossRef]
  74. Taucher, T.C.; Hehn, I.; Hofmann, O.T.; Zharnikov, M.; Zojer, E. Understanding chemical versus electrostatic shifts in x-ray photoelectron spectra of organic self-assembled monolayers. J. Phys. Chem. C 2016, 120, 3428–3437. [Google Scholar] [CrossRef]
  75. Jiang, J.; Yang, H.; Jiang, H.; Hu, Y.; Li, C. Boosting catalytic activity of Cu-Ce solid solution catalysts by flame spray pyrolysis with high Cu+ concentration and oxygen vacancies. Chem. Eng. J. 2023, 471, 144439. [Google Scholar] [CrossRef]
  76. Sajeev, S.; Vincent, M.; Garbacz, P.; Strawski, M.; Zhu, C.; Aoki, Y.; Kowalski, D. The role of Ni substitution in manganite perovskite Li-O2 battery. RSC Appl. Interfaces 2025, 2, 1051–1058. [Google Scholar] [CrossRef]
  77. Feng, M.; Tang, Y.; Li, Z.; Zhang, Z.; Li, C.; Bao, R.; Yi, J.; Chen, J.; Wang, J. Differentiated modulating the electronic structure of NiFe@Ni/Fe-MnOx via phase transformation engineering to synergy promote bifunctional water splitting reactions. Small 2025, 21, 2410752. [Google Scholar] [CrossRef]
  78. Liu, G.; Li, J.; Yang, K.; Tang, W.; Liu, H.; Yang, J.; Yue, R.; Chen, Y. Effects of cerium incorporation on the catalytic oxidation of benzene over flame-made perovskite La1-xCexMnO3 catalysts. Particuology 2015, 19, 60–68. [Google Scholar] [CrossRef]
  79. Jiang, X.; Xu, W.; Lai, S.; Chen, X. Integral structured Co-Mn composite oxides grown on interconnected Ni foam for catalytic toluene oxidation. RSC Adv. 2019, 9, 6533–6541. [Google Scholar] [CrossRef] [PubMed]
  80. Heo, J.; Jung, H. Tailoring oxidation state of manganese enables the direct formation of todorokite. ACS Nano 2025, 19, 12910–12919. [Google Scholar] [CrossRef]
  81. Zhou, J.; Ouyang, R.; Zhong, X.; Guo, L.; Yu, X.; Xu, J.; Fang, X.; Shen, J.; Wang, X. BaBO3 (B = Ti, Sn, Zr) perovskites for oxidative coupling of methane: Elucidating the effects of intrinsic oxygen vacancies, high-temperature crystal phase transition on reaction performance. Phys. Chem. Chem. Phys. 2025, 27, 8887–8897. [Google Scholar] [CrossRef] [PubMed]
  82. Islam, Z.U.; Want, B. Structural, optical, and dielectric properties of double perovskite NdBaFeTiO6. Ceram. Int. 2025, 51, 1585–1594. [Google Scholar] [CrossRef]
  83. Liu, Z.; Liang, X.; Ye, J.; Liu, L. Achieving highly moisture-tolerant ozone decomposition over Pd/MnO2-HAC monolith catalyst. ACS Appl. Eng. Mater. 2025, 3, 968–977. [Google Scholar] [CrossRef]
  84. Gao, H.; Song, Z.; Mao, Y.; Fan, Y.; Li, R.; Chen, X.; Liu, W.; Zhang, J.; Huang, Z.; Zhang, X. Tight coupling of oxygen vacancies and acidity on α-MnO2 through cerium doping engineering for efficient removal of multi-component VOCs. Appl. Catal. B Environ. Energy 2025, 362, 124745. [Google Scholar] [CrossRef]
  85. Zhang, Q.; Zhang, L.; Liu, L.; Li, W.; Zhu, C.; Liu, W. Zr-doped CoZrOx solid solution catalysts with enhanced oxygen vacancy for trace ethylene removal under humid conditions. Appl. Surf. Sci. 2025, 689, 162449. [Google Scholar] [CrossRef]
  86. Paul, M.J.; Suresh, R.; Gayathri, P.; Balasubramani, V.; Al-Anazi, K.M.; Farah, M.A. CuO-La2O3 composite-enabled MIS Schottky barrier diodes: A novel approach to optoelectronic device diversification. J. Inorg. Organomet. Polym. 2025, 35, 396–408. [Google Scholar] [CrossRef]
  87. Ren, Y.; Chen, G.; Lu, Y.; Li, K.; Li, Z.; Zhu, Y. One-step synthesis, characterization and ammonia-selective catalytic reduction performance of Cu-SAPO-34 catalyst. Eur. J. Inorg. Chem. 2025, 28, e202400576. [Google Scholar] [CrossRef]
  88. NIST X-Ray Photoelectron Spectroscopy Database, NIST Standard Reference Database Number 20, National Institute of Standards and Technology, Gaithersburg MD, 2000; 20899. Available online: https://dx.doi.org/10.18434/T4T88K (accessed on 20 May 2025).
  89. Beche, E.; Peraudeau, G.; Flaud, V.; Perarnau, D. An XPS investigation of (La2O3)1-x (CeO2)2x (ZrO2)2 compounds. Surf. Interface Anal. 2012, 44, 1045–1050. [Google Scholar] [CrossRef]
  90. Larachi, F.; Pierre, J.; Adnot, A.; Bernis, A. Ce 3d XPS study of composite CexMn1-xO2-y wet oxidation catalysts. Appl. Surf. Sci. 2002, 195, 236–250. [Google Scholar] [CrossRef]
  91. Chen, S.; Li, H.; Hao, Y.; Chen, R.; Chen, T. Porous Mn-based oxides for complete ethanol and toluene catalytic oxidation: The relationship between structure and performance. Catal. Sci. Technol. 2020, 10, 1941–1951. [Google Scholar] [CrossRef]
  92. Kobayashi, M.; Naniwa, S.; Goto, K.; Matsuo, H.; Iguchi, S.; Tanaka, T.; Teramura, K. Promoting effect of Pd nanoparticles on SrTi0.8Mn0.2O3 in the Reverse Water-Gas Shift reaction via the Mars-van Krevelen mechanism. ChemCatChem 2024, 16, e202400871. [Google Scholar] [CrossRef]
  93. Santamaria, A.; Méndez, A.C.; Gallego, J. LaMn1−xCoxO3 perovskite-like doped and impregnated with Cu for the enhancement of toluene total oxidation. Appl. Surf. Sci. 2024, 669, 160587. [Google Scholar] [CrossRef]
  94. Tada, S.; Kondo, M.; Joutsuka, T. Oxide solid-solution catalysts with good redox properties for liquid-phase aerobic additive-free oxidation: A review. ChemCatChem 2024, 16, e202301367. [Google Scholar] [CrossRef]
  95. Xue, Y.; Wang, P.; Yang, C.; Zhang, T.; Zhang, X.; Xiong, J.; Sun, X.; Wei, Y.; Li, Z. Alkaline earth metal enhancement of cerium-manganese-based three-dimensional ordered microporous catalysts for NO oxidation. ChemCatChem 2025, 17, e202401984. [Google Scholar] [CrossRef]
  96. Lee, J.; Christopher, P. Does H2 Temperature-Programmed Reduction always probe solid-state redox chemistry? The case of Pt/CeO2. Angew. Chem. Ind. Ed. 2024, 64, e202414388. [Google Scholar] [CrossRef] [PubMed]
  97. Liang, C.; Sun, Y.; Li, P.; Jiang, Y.; Sun, X.; Yang, Z. Effect of Mn/Cu molar ratios on CO oxidation activity of Mn-Cu bimetallic catalysts. Catalysts 2025, 15, 353. [Google Scholar] [CrossRef]
  98. Martín-Martín, J.A.; González-Marcos, M.P.; Aranzabal, A.; González-Velasco, J.R.; Finocchio, E. Promotion of different active phases in MnOx-CeO2 catalysts for simulataneous NO reduction and o-DCB oxidation. Top. Catal. 2025, 68, 13–32. [Google Scholar] [CrossRef]
  99. Li, H.X.; Jin, L.Y.; Zhang, A.C.; Sun, Z.J.; Zhang, X.M.; Zhu, Q.F.; Yang, C.Z.; Zhang, S.B. Investigation of Co-doped Mn oxide catalyst for NH3-SCR activity and SO2/H2O resistance. J. Fuel Chem. Technol. 2022, 50, 1404–1416. [Google Scholar] [CrossRef]
  100. Kim, M.H.; Cho, K.H.; Shin, C.H.; Kang, S.E.; Ham, S.W. Total oxidation of propane over Cu-Mn mixed oxide catalysts prepared by co-precipitation method. Korean J. Chem. Eng. 2011, 28, 1139–1143. [Google Scholar] [CrossRef]
  101. Zhu, L.; Liu, Y.; Gao, Y.; Ding, N.; Wang, D.; Long, L.; Wang, B.; Lang, J.; Vovk, E.I.; Yang, Y. Mechanistic understanding of dissociated hydrogen in Cu/CeO2-catalyzed methanol synthesis. ACS Appl. Mater. Interfaces 2025, 17, 7151–7163. [Google Scholar] [CrossRef]
  102. Fulham, G.J.; Wu, X.; Liu, W.; Marek, E.J. Mechanistic insights into the role of zinc oxide, zirconia and ceria supports in Cu-based catalysts for CO2 hydrogenation to methanol. Chem. Eng. J. 2024, 480, 147732. [Google Scholar] [CrossRef]
  103. Kumar, S.; Teraoka, Y.; Joshi, A.G.; Rayalu, S.; Labhsetwar, N. Ag promoted La0.8Ba0.2MnO3 type perovskite catalyst for N2O decomposition in the presence of O2, NO and H2O. J. Mol. Catal. A Chem. 2011, 348, 42–54. [Google Scholar] [CrossRef]
  104. Moradkhani, F.; Kootenaei, A.S.; Maghsoodi, S.; Mirzaei, M.; Azimi, A. A double perovskite oxide with A-site deficiency: A facile way to yield a boosted propane combustion catalyst. Pet. Chem. 2023, 63, 1322–1334. [Google Scholar] [CrossRef]
  105. Harada, K.; Oishi, T.; Hamamoto, S.; Ishihara, T. Lattice oxygen activity in Pr- and La-doped CeO2 for low-temperature soot oxidation. J. Phys. Chem. C 2014, 118, 559–568. [Google Scholar] [CrossRef]
  106. Tan, X.; Lan, H.; Xie, H.; Zhou, G.; Jiang, Y. Role of surface oxygen species of mesoporous CeCu oxide catalyst in OVOCs catalytic combustion. J. Environ. Chem. Eng. 2017, 5, 2068–2076. [Google Scholar] [CrossRef]
  107. Papadopoulos, C.; Kappis, K.; Papavasiliou, J.; Vakros, J.; Kuśmierz, M.; Gac, W.; Georgiou, Y.; Deligiannakis, Y.; Avgouropoulos, G. Copper-promoted ceria catalysts for CO oxidation reaction. Catal. Today 2020, 355, 647–653. [Google Scholar] [CrossRef]
  108. Liu, Y.; Hou, K.; Guo, Z.; Guo, Y.; Jiang, Y.; Wu, X.; Fu, Z.; Zhang, H.; Li, P.; Zeng, S. Abundant surface adsorbed oxygen species originated from defect/vacancy sites during preferential CO oxidation. Chem. Eng. J. 2025, 504, 158672. [Google Scholar] [CrossRef]
  109. Liao, Y.; Liu, Z.; Li, Z.; Gao, G.; Ji, L.; Xu, H.; Huang, W.; Qu, Z.; Yan, N. The unique CO activation effects for boosting NH3 selective catalytic oxidation over CuOx-CeO2. Environ. Sci. Technol. 2022, 56, 10402–10411. [Google Scholar] [CrossRef]
  110. Porta, A.; Visconti, C.G.; Castoldi, L.; Matarrese, R.; Jeong-Potter, C.; Farrauto, R.; Lietti, L. Ru-Ba synergistic effect in dual functioning materials for cyclic CO2 capture and methanation. Appl. Catal. B Environ. 2021, 283, 119654. [Google Scholar] [CrossRef]
  111. Avgouropoulos, G.; Papavasiliou, J.; Tabakova, T.; Idakiev, V.; Ioannides, T. A comparative study of ceria-supported gold and copper oxide catalysts for preferential CO oxidation reaction. Chem. Eng. J. 2006, 124, 41–45. [Google Scholar] [CrossRef]
  112. Landi, G.; Benedetto, A.D.; Colussi, S.; Barbato, P.S.; Lisi, L. Effect of carbon dioxide and water on the performances of an iron-promoted copper/ceria catalyst for CO preferential oxidation in H2-rich streams. Int. J. Hydrogen Energy 2016, 41, 7332–7341. [Google Scholar] [CrossRef]
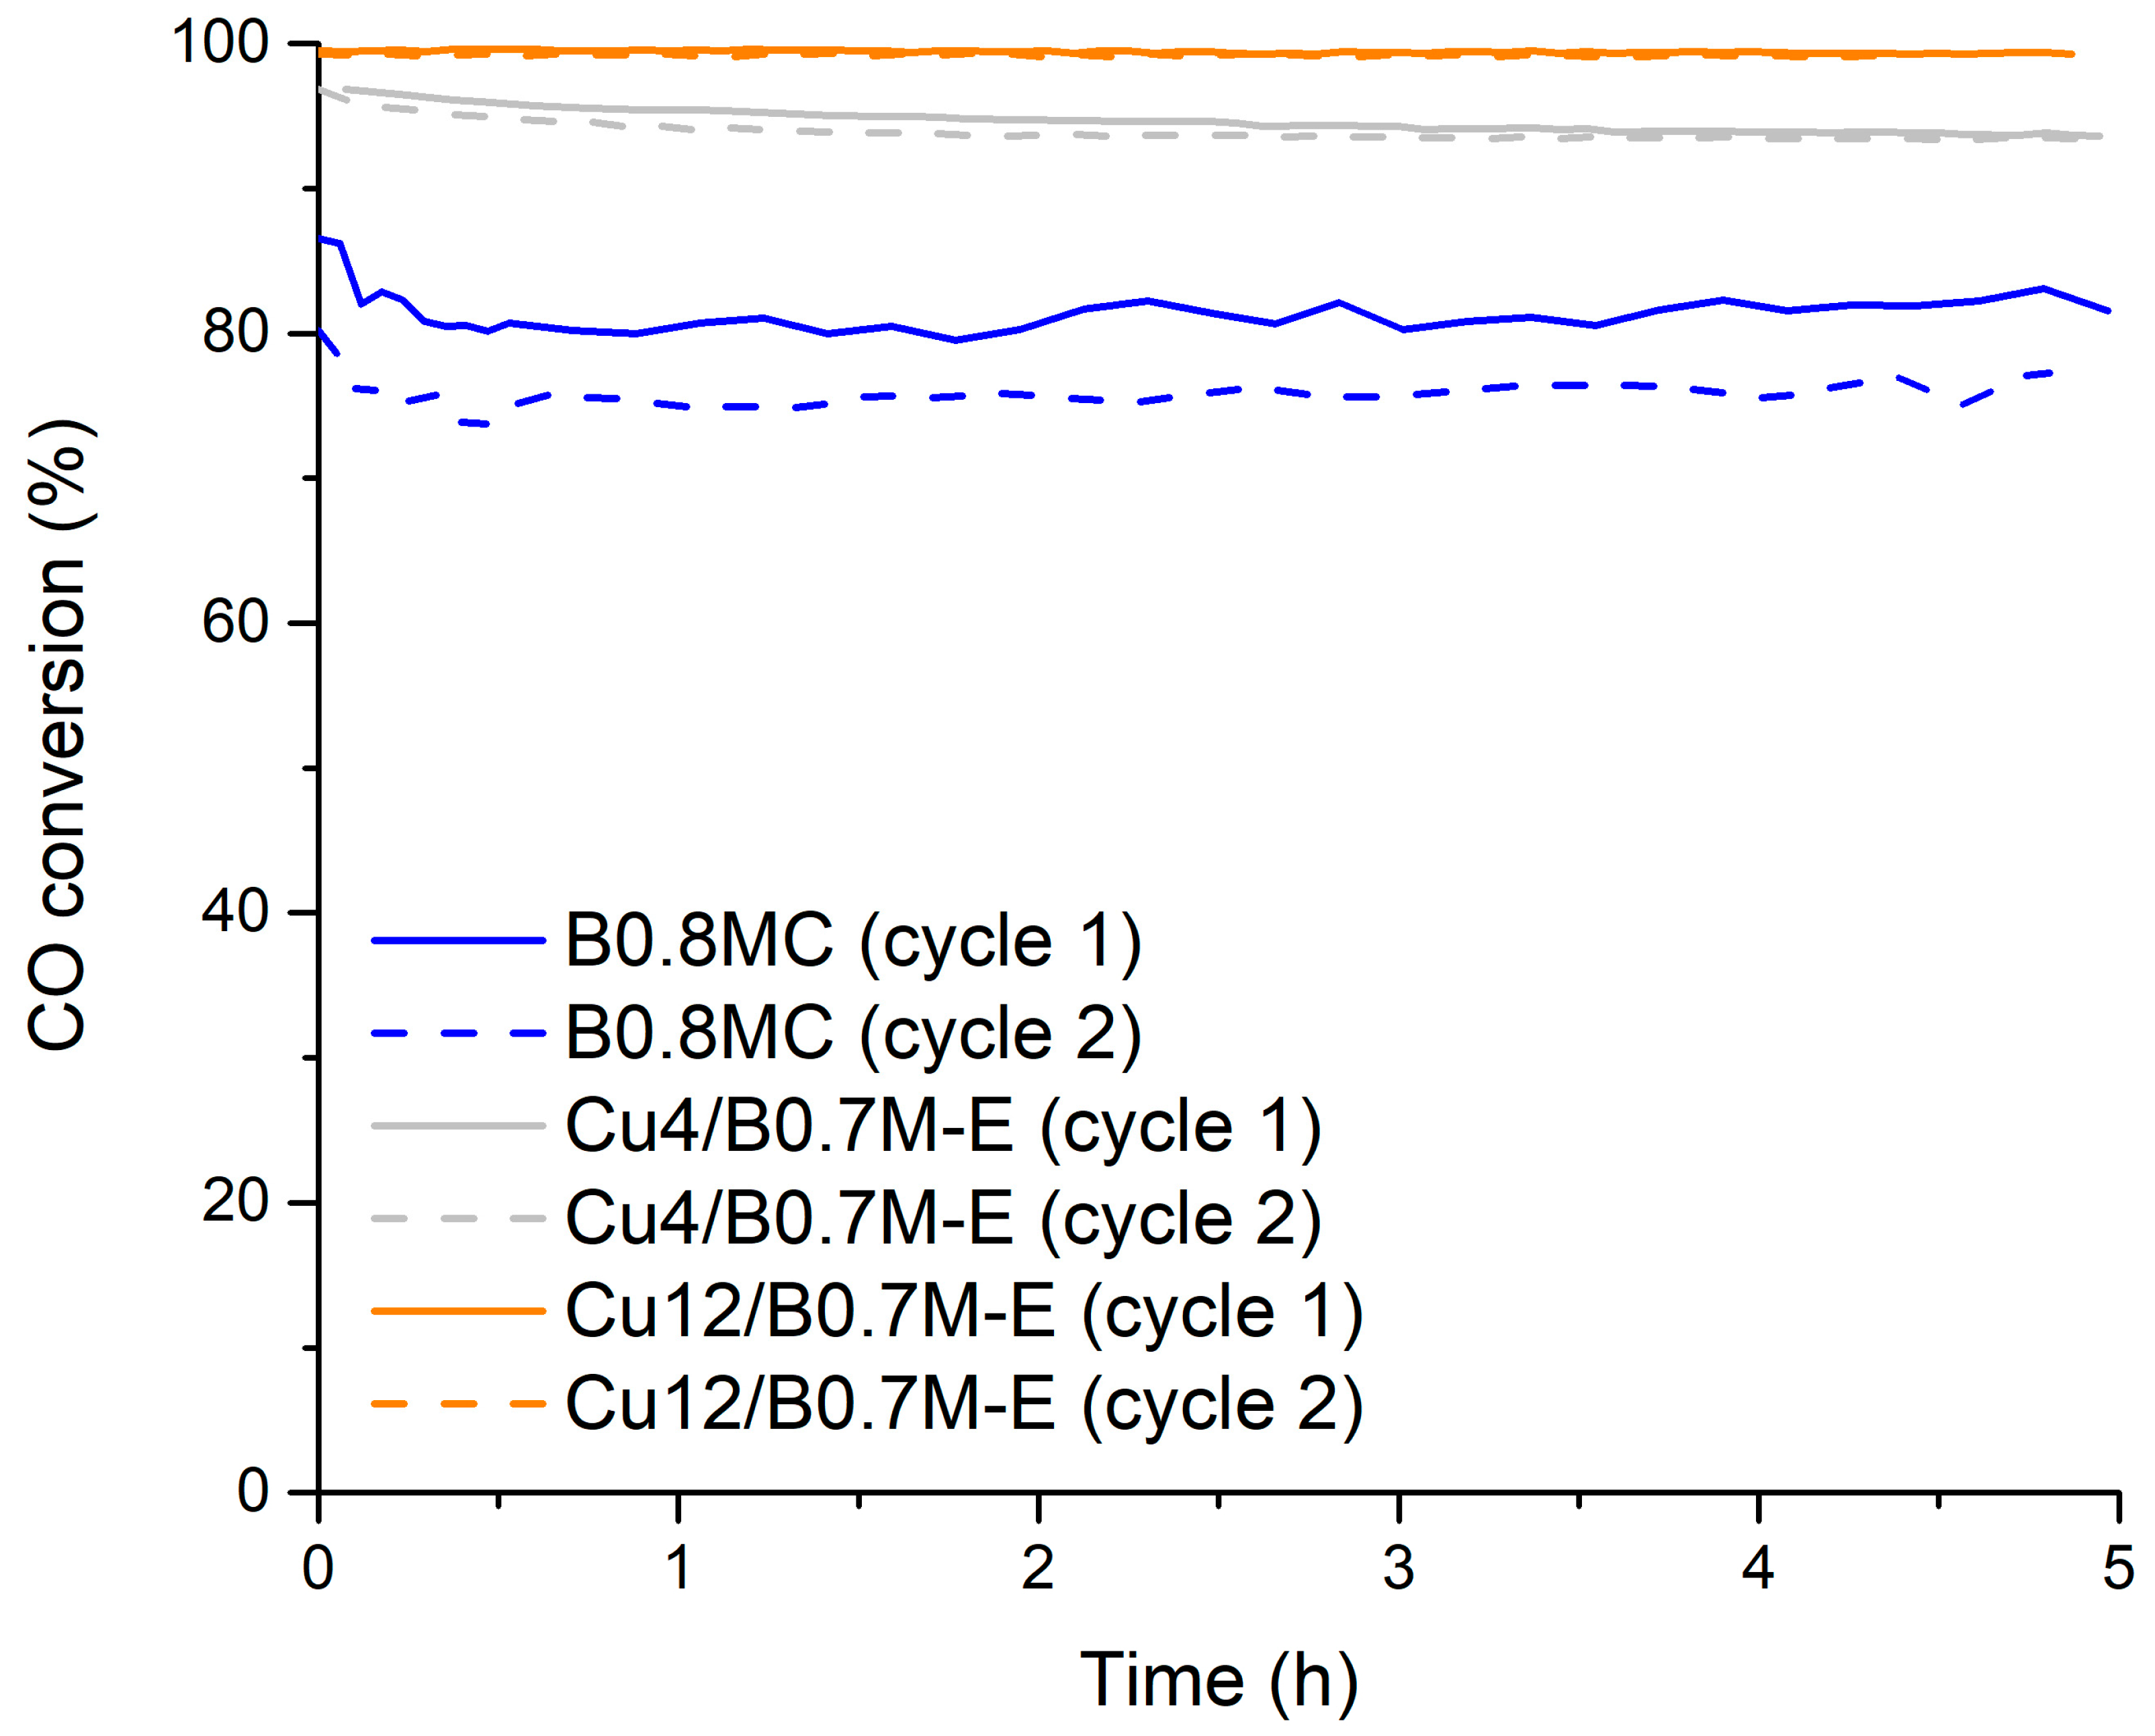
Figure 1. CO conversion profiles of the B0.8MC, Cu4/B0.7M-E and Cu12/B0.7M-E samples at 300 °C, under a 1% CO, 1% O2 in He reactant mixture.
Nanomaterials 15 01467 g001
Figure 2. CO conversion profiles of the B0.8MC and Cu4/B0.7M-E samples at 250 °C and under a 1% CO, 1% O2 in He reactant mixture.
Nanomaterials 15 01467 g002
Figure 3. XRD patterns of the fresh and B0.8MC sample used in the CO oxidation reaction at 250 °C.
Nanomaterials 15 01467 g003
Figure 4. CO conversion profiles of the B0.8MC and Cu4/B0.7M-E samples at 300 °C (under a 1% CO, 1% O2 in He reactant atmosphere) in the presence of 15% CO2.
Nanomaterials 15 01467 g004
Figure 5. XRD patterns of the used B0.8MC and Cu4/B0.7M-E samples in the stability tests performed at 300 °C in the presence of 15% CO2.
Nanomaterials 15 01467 g005
Figure 6. XRD patterns of the fresh B0.7M-E, Cu4/B0.7M-E and Cu2Ce2/B0.7M-E samples.
Nanomaterials 15 01467 g006
Figure 7. FE-SEM images of B0.7M-E, Cu4/B0.7M-E and Cu2Ce2/B0.7M-E samples.
Nanomaterials 15 01467 g007
Figure 8. XPS spectra of the Ba 3d5/2 (a), Mn 2p3/2 (b), Mn 3p (c), O 1s (d), Cu 2p3/2 (e), Cu L3M4.5M4.5 Auger signal (f) and Ce 3d (g) transitions.
Nanomaterials 15 01467 g008
Figure 9. H2-TPR consumption profiles of the B0.7M-E, Cu4/B0.7M-E and Cu2Ce2/B0.7M-E samples, including Mn2O3 as reference. The total amount of H2 consumed has been included.
Nanomaterials 15 01467 g009
Figure 10. O2-TPD profiles of the B0.7M-E, Cu4/B0.7M-E and Cu2Ce2/B0.7M-E samples.
Nanomaterials 15 01467 g010
Figure 11. CO conversion profiles of the Cu4/B0.7M-E, Cu2Ce2/B0.7M-E and 1% Pt/Al2O3 samples under the 1% CO, 1% O2 in He reactant mixture.
Nanomaterials 15 01467 g011
Figure 12. CO conversion profiles at 300 °C of the Cu4/B0.7M-E and Cu2Ce2/B0.7M-E samples in the absence and in the presence of 15% CO2.
Nanomaterials 15 01467 g012
Figure 13. XRD profiles of the fresh and used Cu2Ce2/B0.7M-E sample in the CO oxidation tests, under the 1% CO, 1% O2 in He atmosphere, in the absence and in the presence of 15% CO2.
Nanomaterials 15 01467 g013
Table 1. Characterization and specific activity for CO oxidation (300 °C, under a 1% CO, 1% O2 in He reactant mixture) of the B0.8MC, Cu4/B0.7M-E and Cu12/B0.8M-E samples.
SampleXPS 1
Mn(IV)/Mn(III) 2Cu/(Ba+Mn+Cu)
(Nominal)
Cusi/CuwiOL/(Ba+Mn(+Cu))
(Nominal) 3
B0.8MC0.96 ± 0.100.08 ± 0.01 (0.17)1.40 ± 0.090.86 ± 0.03 (1.67)
Cu4/B0.7M-E1.28 ± 0.050.10 ± 0.01 (0.07)1.62 ± 0.071.41 ± 0.02 (1.76)
Cu12/B0.7M-E1.34 ± 0.100.18 ± 0.01 (0.15)1.30 ± 0.041.15 ± 0.03 (1.76)
SampleH2-TPRO2-TPDCO Specific Activity 4
mL H2 ·(g sample)−1μmol O2 ·(g sample)−1
B0.8MC60 ± 15367 ± 350.424 ± 0.048/0.401 ± 0.048
Cu4/B0.7M-E70 ± 15243 ± 201.233 ± 0.043/1.231 ± 0.043
Cu12/B0.7M-E90 ± 16100 ± 100.588 ± 0.042/0.588 ± 0.042
1 The experimental ratios obtained by XPS were calculated by using the area under the deconvoluted signals, while the nominal values (shown between parentheses) are determined using the molecular formula of the samples. 2 Obtained through the analysis of the Mn 2p3/2 transition. For those calculated by the Mn 2p1/2 transition, see Table S1 and Figure S1 (in Supplementary Information File). 3 The contribution of the Cu 2p signal to the ratio is only applied for the B0.8MC sample. 4 As mol of CO converted per mol of Cu and per minute (first cycle/second cycle).
Table 2. CO conversion (ΔCCO) and CO specific activity (aCO) during the CO oxidation reaction at 250 °C for the B0.8MC and Cu4/B0.7M-E samples.
SampleB0.8MCCu4/B0.7M-E
Cycle1212
ΔCCO (%) 1−10 ± 6−8 ± 6−26 ± 6−15 ± 6
aCO (5 h) 20.309 ± 0.0620.281 ± 0.0670.518 ± 0.0870.469 ± 0.094
1 Calculated as the difference between the final (5 h) and the initial CO conversions. 2 As mol of CO converted per mol of surface Cu and per minute.
Table 3. Ba, Mn, O and Cu XPS characterization data of the fresh and used B0.8MC and Cu4/B0.7M-E in the stability tests performed at 250 °C.
SampleMn(IV)/Mn(III) 1Cu/(Ba+Mn+Cu)OL/(Ba+Mn(+Cu)) 2BaCO3/BaL
Fresh B0.8MC0.96 ± 0.100.08 ± 0.010.86 ± 0.030.15 ± 0.01
Used B0.8MC0.58 ± 0.010.09 ± 0.010.18 ± 0.010.15 ± 0.01
Fresh Cu4/B0.7M-E1.28 ± 0.050.10 ± 0.011.41 ± 0.020.16 ± 0.01
Used Cu4/B0.7M-E0.79 ± 0.010.10 ± 0.010.22 ± 0.010.11 ± 0.01
SampleKE Cu L3M4.5M4.5 (eV) 3Cu (II) (%) 4Cusi (%) 4,5
Fresh B0.8MC917.5 ± 0.122 ± 1278 ± 18
Used B0.8MC917.2 ± 0.142 ± 258 ± 5
Fresh Cu4/B0.7M-E918.8 ± 0.155 ± 545 ± 14
Used Cu4/B0.7M-E917.5 ± 0.121 ± 4 79 ± 5
1 Obtained through the analysis of the Mn 2p3/2 transition. For those calculated by the Mn 2p1/2 transition, see Table S1 and Figure S1 (in Supplementary Information File). 2 The contribution of the Cu 2p signal to the ratio is only applied for the B0.8MC sample, since the lattice oxygen is mainly present in the perovskite support, and the CuO impregnated phase of Cu4/B0.7M-E is treated as an independent species. 3 KE = Kinetic energy. 4 Obtained by using the Cu L3M4.5M4.5 Auger signal. 5 Cu species with a higher interaction with the perovskite.
Table 4. Evolution of the CO conversion (ΔCCO) and CO specific activity (aCO) during the CO oxidation reaction at 300 °C (under a 1% CO, 1% O2 in He reactant atmosphere) in the presence of 15% CO2 for the B0.8MC and Cu4/B0.7M-E samples.
SampleB0.8MCCu4/B0.7M-E
ΔCCO (%) 1- 3−31 ± 6
aCO (5 h) 20.012 ± 0.0010.457 ± 0.030
1 Calculated as the difference between the final (5 h) and the initial CO conversions. 2 As mol of CO converted per mol of surface Cu and per minute. 3 Not applied for B0.8MC since it resulted to be inactive under the tested conditions.
Table 5. Ba, Mn, O and Cu XPS characterization data of the fresh and used B0.8MC and Cu4/B0.7M-E in the stability tests performed at 300 °C in the presence of 15% CO2.
SampleMn(IV)/Mn(III) 1Cu/(Ba+Mn+Cu)OL/(Ba+Mn(+Cu)) 2BaCO3/BaL
Fresh B0.8MC0.96 ± 0.010.08 ± 0.010.86 ± 0.030.15 ± 0.01
Used B0.8MC0.84 ± 0.030.04 ± 0.010.17 ± 0.010.06 ± 0.01
Fresh Cu4/B0.7M-E1.28 ± 0.050.10 ± 0.011.41 ± 0.020.16 ± 0.01
Used Cu4/B0.7M-E0.45 ± 0.020.05 ± 0.010.20 ± 0.010.41 ± 0.01
SampleKE Cu L3M4.5M4.5 (eV) 3Cu (II) (%) 4Cusi (%) 4,5
Fresh B0.8MC917.5 ± 0.122 ± 1278 ± 18
Used B0.8MC917.6 ± 0.137 ± 863 ± 16
Fresh Cu4/B0.7M-E918.8 ± 0.155 ± 545 ± 14
Used Cu4/B0.7M-E917.6 ± 0.161 ± 439 ± 19
1 Obtained through the analysis of the Mn 2p3/2 transition. See Table S1 and Figure S1 for those calculated by the Mn 2p1/2 transition. 2 The contribution of the Cu 2p signal to the ratio is only applied for the B0.8MC sample, since the lattice oxygen is mainly present in the perovskite support, and the CuO impregnated phase of Cu4/B0.7M-E is treated as an independent species. 3 KE = Kinetic energy. 4 Obtained by using the Cu L3M4.5M4.5 Auger signal. 5 Cu species with a higher interaction with the perovskite.
Table 6. XRD data of the fresh B0.7M-E, Cu4/B0.7M-E and Cu2Ce2/B0.7M-E samples.
SampleCell Parameters 1Perovskite Average Crystal Size (nm)Lattice Strain
a (Å)c (Å)
B0.7M-E5.68 ± 0.214.82 ± 0.3226.2 ± 2.10.0002 ± 2
Cu4/B0.7M-E5.69 ± 0.204.80 ± 0.2815.2 ± 2.30.0017 ± 0.0004
Cu2Ce2/B0.7M-E5.68 ± 0.204.79 ± 0.2732.3 ± 2.8 0.0030 ± 0.0003
1 As the relationship between the cell parameters in the hexagonal crystal system is a = b ≠ c, b parameter is not shown in the table. 2 6·10−5.
Table 7. Ba, Mn, O and Cu and Ce XPS characterization data of the fresh B0.7M-E, Cu4/B0.7M-E and Cu2Ce2/B0.7M-E samples.
SampleBaCO3/BaLMn(IV)/Mn(III) 1Mn(III)c/Mn(III)fOL/(Ba+Mn)
(Nominal = 1.76)
B0.7M-E0.08 ± 0.010.48 ± 0.01-1.06 ± 0.01
Cu4/B0.7M-E0.16 ± 0.011.28 ± 0.05 0.18 ± 0.031.41 ± 0.02
Cu2Ce2/B0.7M-E0.10 ± 0.011.05 ± 0.030.31 ± 0.020.29 ± 0.01
SampleCu/(Ba+Mn+Cu(+Ce))
(nominal)
Ce(IV)/Ce(III)Ce/(Ba+Mn+Cu+Ce)
(nominal)
B0.7M-E---
Cu4/B0.7M-E0.10 ± 0.01 (0.07)--
Cu2Ce2/B0.7M-E0.07 ± 0.01 (0.04)1.83 ± 0.060.47 ± 0.01 (0.02)
SampleCu (II) (%) 2Cured/Cusi (%) 2,3
B0.7M-E--
Cu4/B0.7M-E55 ± 545 ± 14
Cu2Ce2/B0.7M-E41 ± 559 ± 16
1 Obtained through the analysis of the Mn 2p3/2 transition. See Table S1 and Figure S1 for those calculated by the Mn 2p1/2 transition. 2 Obtained by using the Cu L3M4.5M4.5 Auger signal. 3 For Cu4/B0.7M-E, the Cusi parameter is still being used (see Table 3 and Table 5), meanwhile for Cu2Ce2/B0.7M-E, Cured parameter is referred to Cu species with an oxidation state lower than Cu (II).
Table 8. Evolution of the CO conversion (ΔCCO) and CO specific activity (aCO) during the CO oxidation reaction at 300 °C in the absence and in the presence of 15% CO2 for the B0.8MC and Cu4/B0.7M-E samples.
SampleCu2Ce2/B0.7M-ECu4/B0.7M-E
CO2 Content (%)015015
ΔCCO (%) 1−13 ± 6−20 ± 6−2 ± 6 3−31 ± 6
aCO (5 h) 22.274 ± 0.1081.620 ± 0.0971.231 ± 0.0430.457 ± 0.030
1 Calculated as the difference between the final (5 h) and the initial CO conversions. 2 As mol of CO converted per mol of surface Cu and per minute. 3 The high error is due to the association of an absolute error of the CO conversions of 3%, which was determined through a repeatability procedure. Despite this observation, the presented result is consistent with the previous study performed by the authors [34].
Table 9. Ba, Mn, O and Cu and Ce XPS characterization data of the fresh and used Cu2Ce2/B0.7M-E sample (CO oxidation tests, under the 1% CO, 1% O2 in He atmosphere, in the absence and in the presence of 15% CO2).
SampleBaCO3/BaLMn(IV)/Mn(III) 1Mn(III)c/Mn(III)fOL/(Ba+Mn)
(Nominal = 1.76)
Fresh0.10 ± 0.011.05 ± 0.030.31 ± 0.010.29 ± 0.01
Used (0% CO2)0.09 ± 0.010.75 ± 0.010.31 ± 0.010.29 ± 0.01
Used (15% CO2)0.08 ± 0.010.77 ± 0.020.35 ± 0.020.29 ± 0.01
SampleCu/(Ba+Mn+Cu+Ce)
(Nominal = 0.04)
KE Cu
L3M4.5M4.5 (eV) 2
Ce(IV)/Ce(III)Ce/(Ba+Mn+Cu+Ce)
(Nominal = 0.02)
Fresh0.07 ± 0.01918.2 ± 0.11.83 ± 0.060.47 ± 0.01
Used (0% CO2)0.07 ± 0.01917.9 ± 0.12.37 ± 0.040.46 ± 0.01
Used (15% CO2)0.06 ± 0.01917.4 ± 0.12.57 ± 0.060.44 ± 0.01
SampleCu (II) (%) 2Cured (%) 3,4
Fresh41 ± 559 ± 16
Used (0% CO2)42 ± 558 ± 14
Used (15% CO2)41 ± 659 ± 18
1 Obtained through the analysis of the Mn 2p3/2 transition. See Table S1 and Figure S1 for those calculated by the Mn 2p1/2 transition. 2 KE = Kinetic energy. 3 Obtained by using the Cu L3M4.5M4.5 Auger signal. 4 Referred to Cu species with a lower oxidation state than Cu (II).
Disclaimer/Publisher’s Note: The statements, opinions and data contained in all publications are solely those of the individual author(s) and contributor(s) and not of MDPI and/or the editor(s). MDPI and/or the editor(s) disclaim responsibility for any injury to people or property resulting from any ideas, methods, instructions or products referred to in the content.