3.1. Hysteresis Loops and Magnetic Energy Product
From the demagnetization curves, key physical parameters that characterize the magnetic performance of permanent magnets, including the coercivity HC, maximum energy product (BH)max, and remanence Mr, can be obtained. Before describing the nucleation field HN, pinning field HP, and coercivity HC, which can be obtained from the demagnetization curves, we first define these three physical quantities. In the hysteresis loop, the applied external magnetic field brings the magnet to a state of positive saturation, where all magnetic moments are aligned with the external field and the angle θ between them is 0°. As the external field decreases, the field value at which the first magnetic moments start to deviate corresponds to the nucleation field (HN = −H), marking the formation of magnetic domains and the onset of the reversible demagnetization process. With the further reduction in the external field, the angle θ between the magnetic moments and the applied field gradually increases. When the external field is reduced to the point where all magnetic moments are about to completely reverse, the corresponding negative field value is defined as the pinning field (HP = −H), after which the reversible demagnetization process ends. After pinning, θ reaches 180°, and all magnetic moments point downward along the negative z-axis, indicating that the magnet has reached negative saturation and all domains have disappeared. The coercivity HC is defined as the negative value of the external field at which the magnetization of the magnet becomes zero.
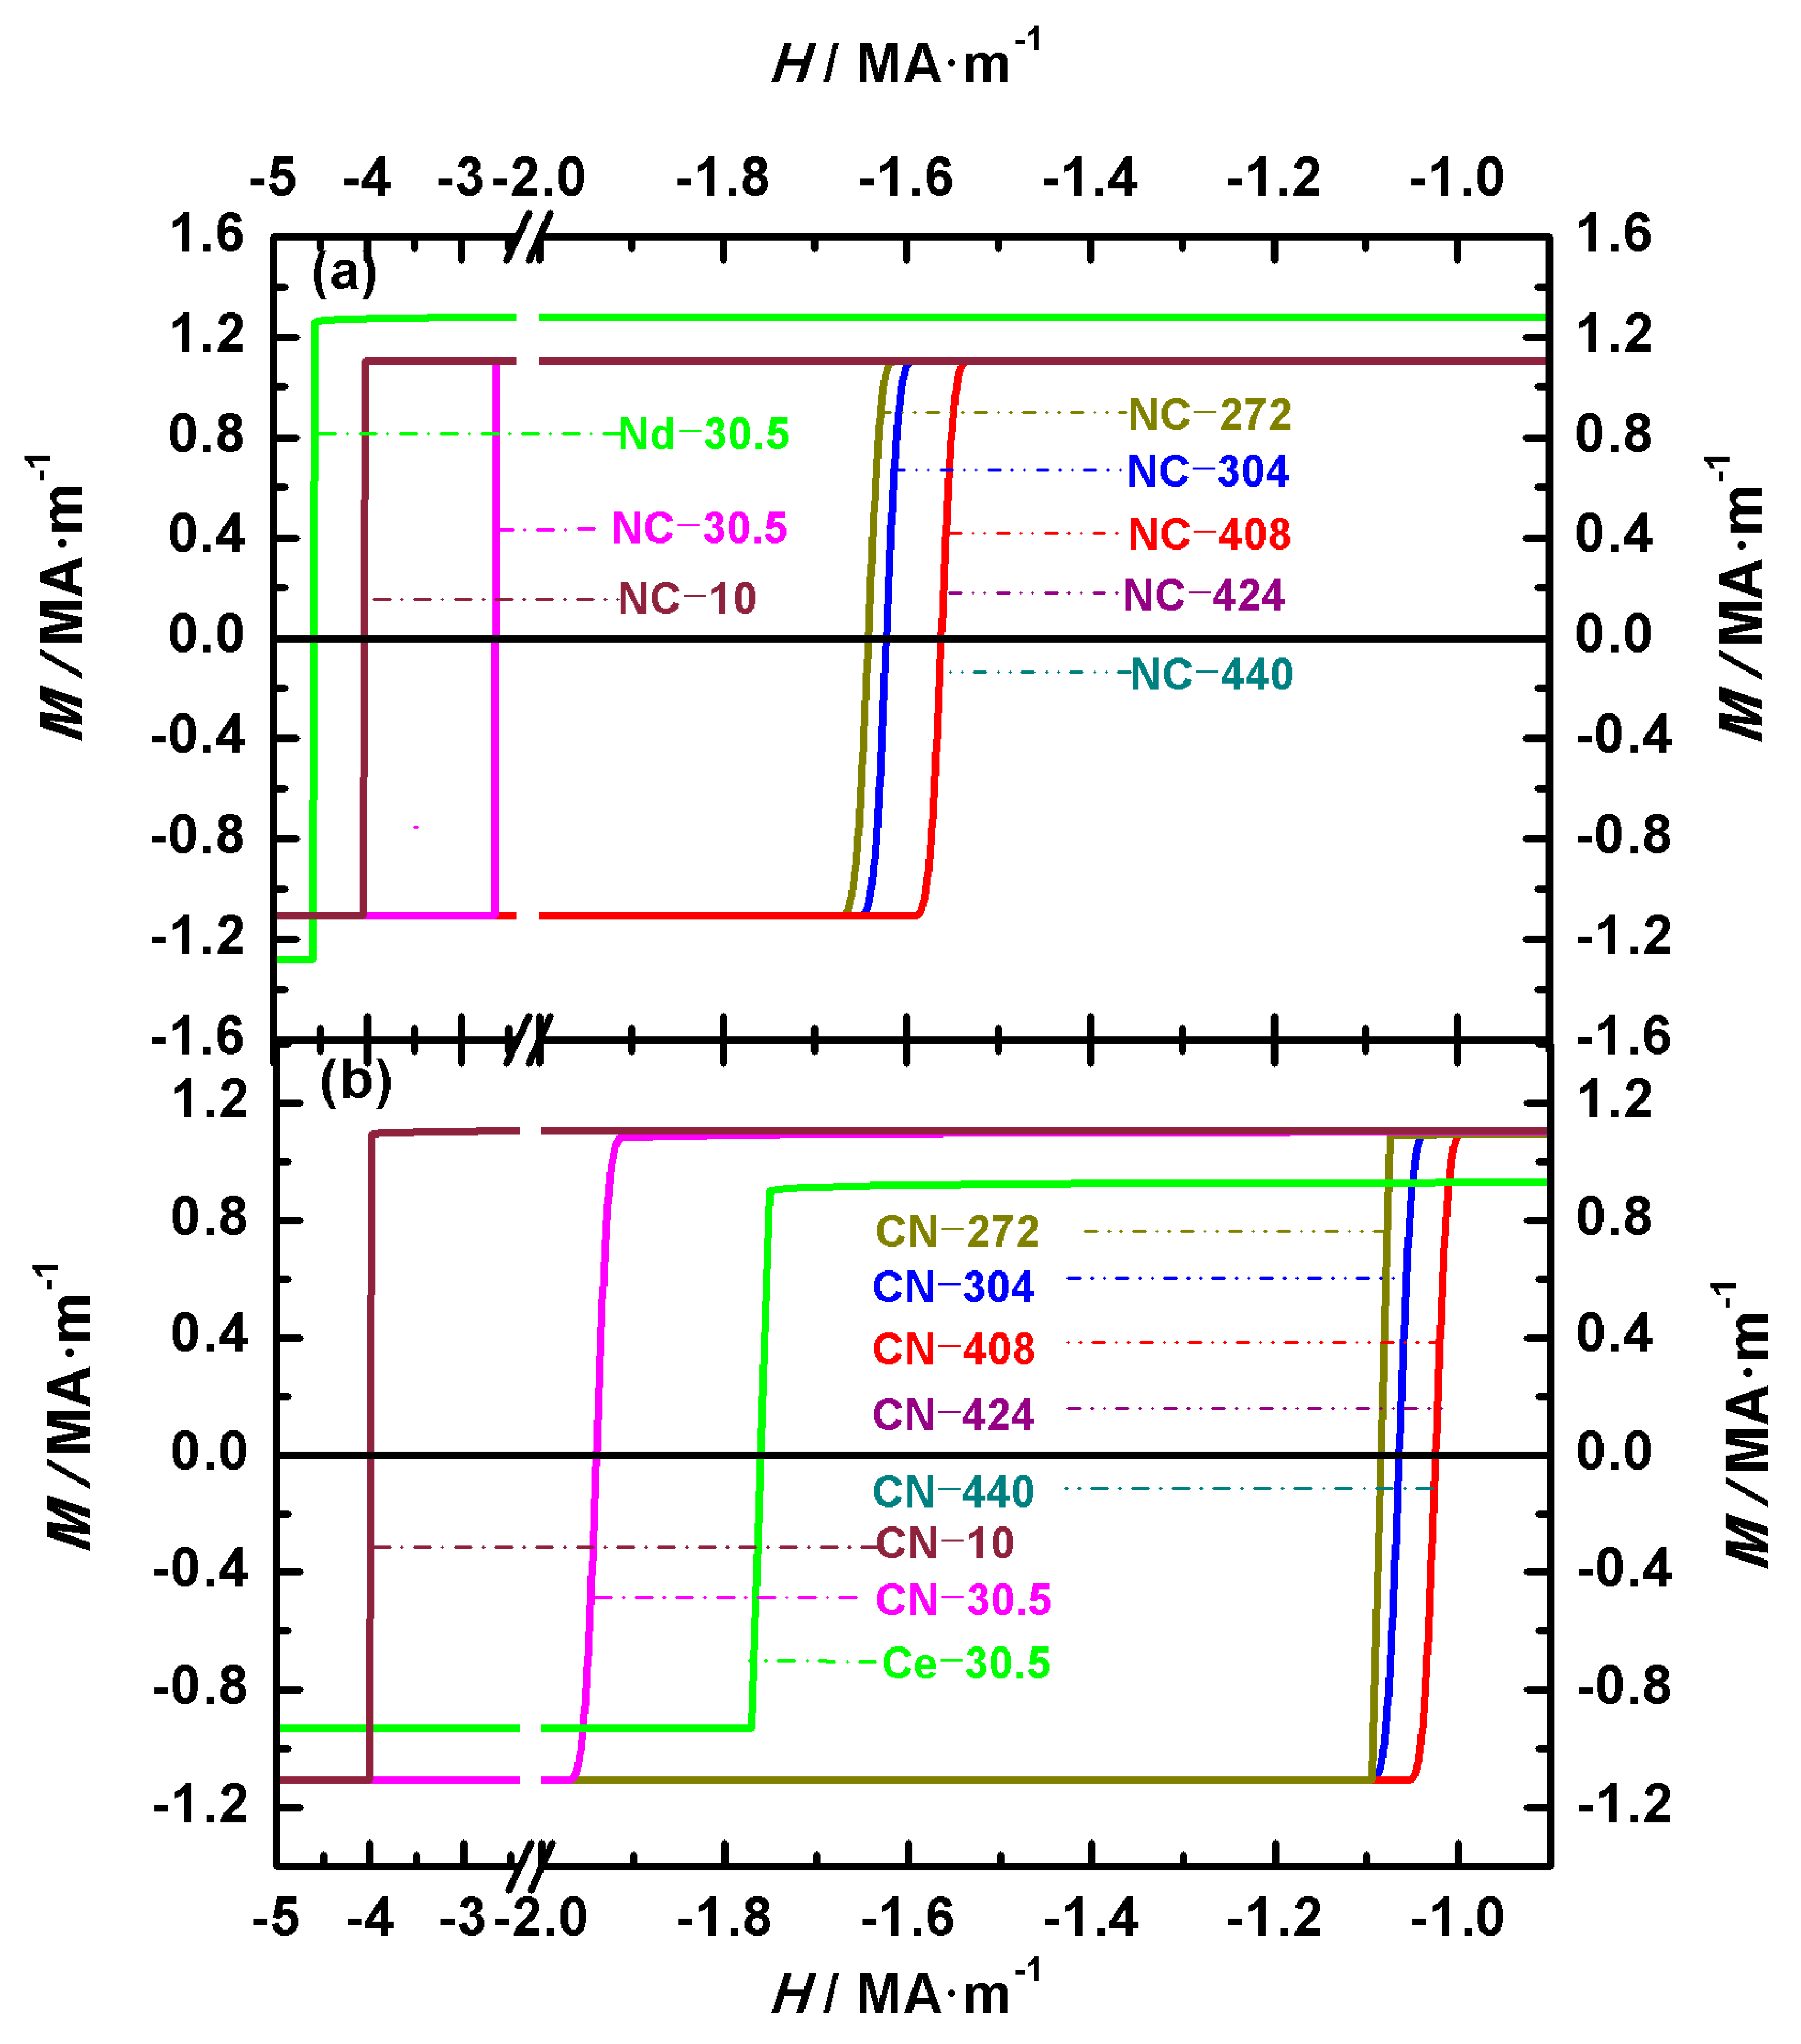
Figure 2 shows the hysteresis loops of Nd-Ce-Fe-B magnets, illustrating the effects of the volume and main phase distribution on their magnetic properties.
Figure 2a,b show the loops of Nd
2Fe
14B/Ce
2Fe
14B (NC) and Ce
2Fe
14B/Nd
2Fe
14B (CN) magnets, respectively. To compare the differences between biphasic Nd-Ce-Fe-B magnets and single-phase Nd
2Fe
14B or Ce
2Fe
14B magnets under identical volume and shape conditions, the hysteresis loops of two single-phase cubic magnets with an edge length of 30.5 nm are also shown in
Figure 2. These two single-phase magnets are denoted as Nd-30.5 and Ce-30.5, respectively. The two configurations, Nd
2Fe
14B/Ce
2Fe
14B (abbreviated NC) and Ce
2Fe
14B/Nd
2Fe
14B (abbreviated CN), have the volume ratio of the two main phases Nd
2Fe
14B and Ce
2Fe
14B as 1:1. The pinning field, coercivity, and remanence of the NC and CN magnets obtained from the demagnetization curves are summarized in
Table 3. In the cubic structure model established in this paper, the volume of the magnet differs based on the inner and outer cubic edge lengths. Thus, the difference in volume is reflected in the variation in the inner and outer cubic edge lengths of the structure in
Section 3. As indicated by the calculated magnet numbers in
Table 2, the magnets with inner and outer cubic edge lengths of 8 nm/10 nm, 24.5 nm/30.5 nm, 214 nm/272 nm, 240 nm/304 nm, 324 nm/408 nm, 336 nm/424 nm, and 350 nm/440 nm are numbered 10, 30.5, 272, 304, 408, 424, and 440, respectively. As shown in
Table 3, for magnets with the same volume and structure, the order of these magnetic properties from highest to lowest is Nd
2Fe
14B, Nd
2Fe
14B/Ce
2Fe
14B, Ce
2Fe
14B/Nd
2Fe
14B, and Ce
2Fe
14B. For the seven Nd
2Fe
14B/Ce
2Fe
14B magnets, the remanence values for NC-10, NC-30.5, and NC-272 are 1.10586 MA·m
−1, 1.10570 MA·m
−1, and 1.10564 MA·m
−1, respectively, while the remaining four magnets all exhibit a remanence of 1.10563 MA·m
−1. For the seven Ce
2Fe
14B/Nd
2Fe
14B magnets, the remanences of CN-10, CN-30.5, CN-272, CN-304, CN-408, CN-424, and CN-440 are 1.10542 MA·m
−1, 1.10412 MA·m
−1, 1.10294 MA·m
−1, 1.10294 MA·m
−1, 1.10293 MA·m
−1, 1.10293 MA·m
−1, and 1.10292 MA·m
−1, respectively. The remanence values of all magnets remain almost unchanged. This is because the magnetic moments deviate only slightly from the external field prior to complete magnetization reversal. This can also be observed from the hysteresis loops in
Figure 2. Comparing the remanence of Nd
2Fe
14B/Ce
2Fe
14B and Ce
2Fe
14B/Nd
2Fe
14B, magnets with the same volume but different main phase positions, shows that Nd
2Fe
14B/Ce
2Fe
14B has a larger remanence. Before the complete magnetization reversal, the moments in Ce
2Fe
14B/Nd
2Fe
14B are more easily influenced by the demagnetizing field than those in Nd
2Fe
14B/Ce
2Fe
14B, resulting in a greater deviation from the external field. This behavior, consistent with the subsequent angular distribution analysis, arises from the larger crystalline anisotropy constant (
K) of Nd
2Fe
14B compared to Ce
2Fe
14B.
The coercivity
HC and pinning field
HP data obtained from the demagnetization curves are summarized in
Table 3. Based on the definitions of the pinning field and coercivity given above, it can be seen from the hysteresis loops that the coercivity is equal to the pinning field. Since
HC is equal to
HP, we have placed these two physical quantities in the same column. The coercivity mechanism for all the magnets is pinning. For the Nd
2Fe
14B/Ce
2Fe
14B structural materials, the coercivity of NC-10, NC-30.5, NC-272, and NC-304 is 4.02 MA·m
−1, 2.67 MA·m
−1, 1.63 MA·m
−1, and 1.61 MA·m
−1, respectively, while the coercivity of the other three magnets, NC-408, NC-424, and NC-440, is 1.55 MA·m
−1. For the Ce
2Fe
14B/Nd
2Fe
14B structural materials, the coercivity of CN-10, CN-30.5, and CN-272, CN-304 is 3.98 MA·m
−1, 1.93 MA·m
−1, 1.07 MA·m
−1, and 1.05 MA·m
−1, while the coercivity of the other three magnets, CN-408, CN-424, and CN-440, is 1.02 MA·m
−1. When comparing materials with the same main phase volume but different structures, it is clear that the coercivity of the Nd
2Fe
14B/Ce
2Fe
14B structure is significantly higher than that of the Ce
2Fe
14B/Nd
2Fe
14B structure. This is because, from the analysis of the magnetic moment deviation, we found that for Nd-Ce-Fe-B magnets of either structure, the magnetic moments at the outer surface of the cube always start to deviate first. Since Nd
2Fe
14B has a larger crystalline anisotropy constant than Ce
2Fe
14B, the high-anisotropy moments of Nd
2Fe
14B initially resist the applied reverse field, effectively “pinning” the inner cube. As a result, the reversal of the entire magnet requires a larger field, leading to a higher coercivity for the Nd
2Fe
14B/Ce
2Fe
14B structure compared to the Ce
2Fe
14B/Nd
2Fe
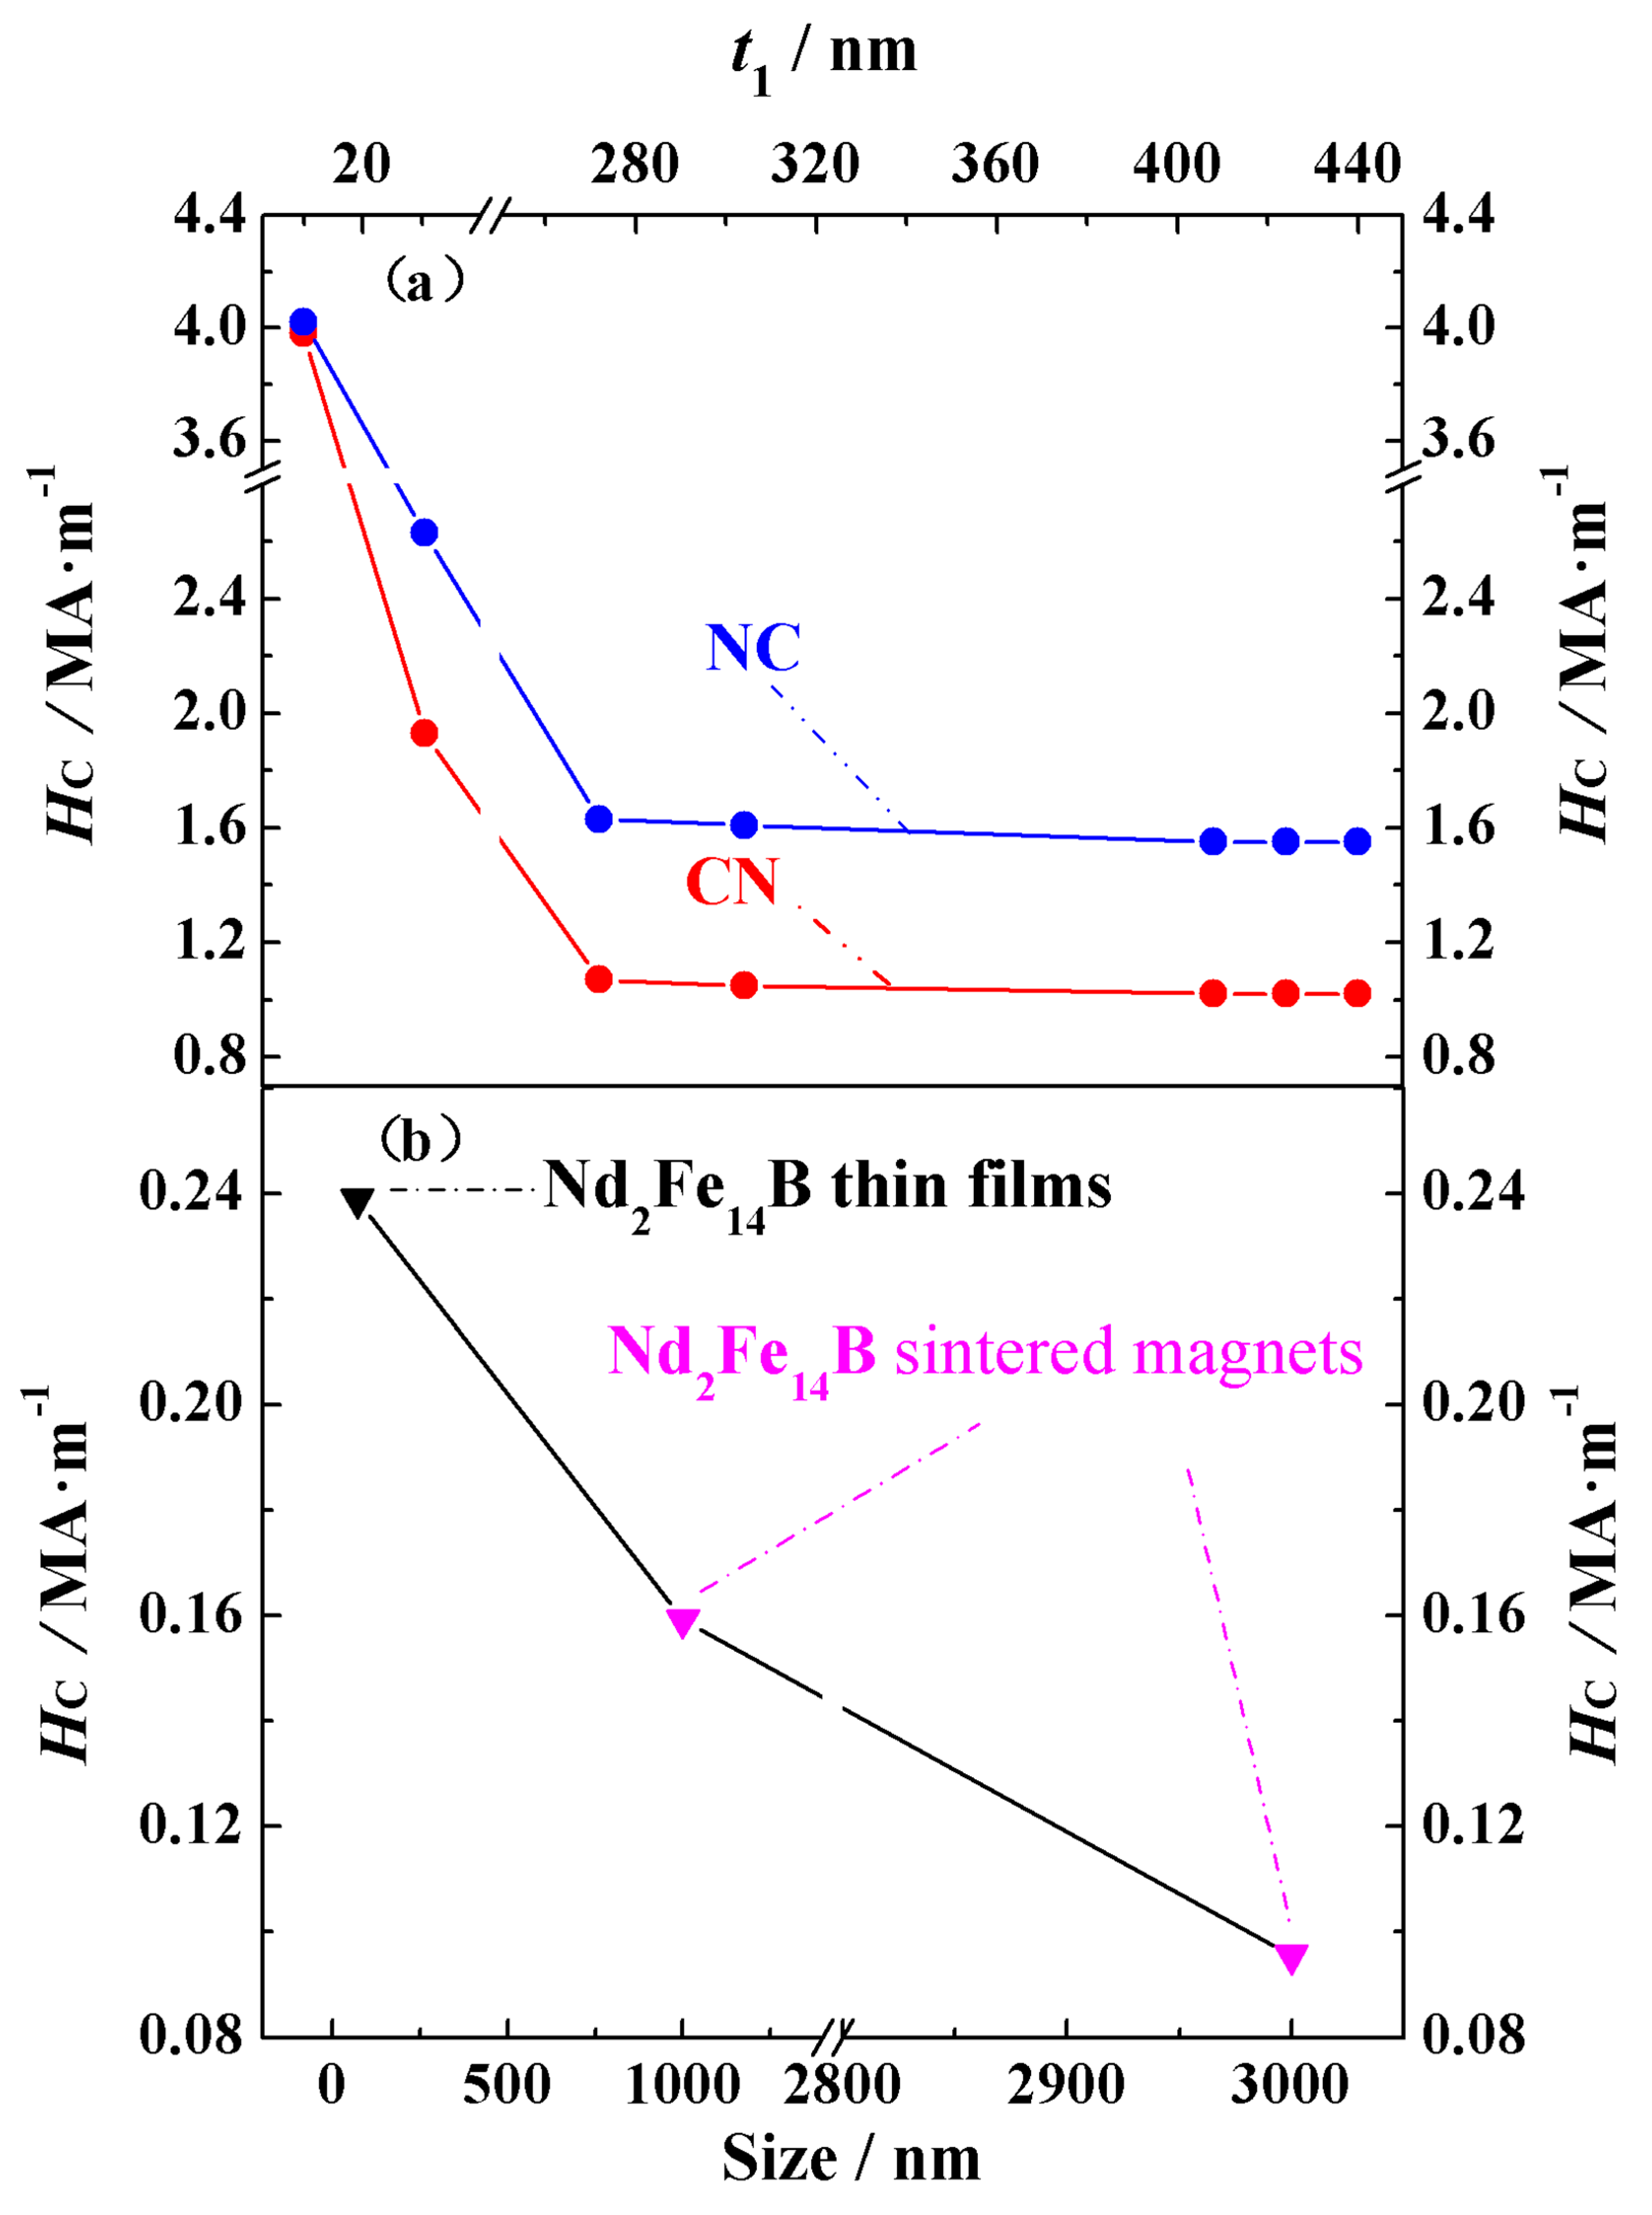
14B structure. To more clearly compare the changes in coercivity for the fourteen materials and the qualitative trend of the coercivity variation with the grain size observed in the theory and experiment,
Figure 3a,b show the theoretical and experimental coercivity data, respectively, as a function of the grain size. From
Figure 3a and
Table 3, it can be seen that as the material volume increases, the coercivity of both structural types first decreases and then stabilizes. For the two types of structures, the coercivity is almost identical at small volumes. This is because the exchange coupling at the phase interface is stronger in smaller volumes, which even prevents Ce
2Fe
14B, when located at the magnet’s surface, from being easily affected by the demagnetizing field despite its relatively small crystalline anisotropy constant. In the experimentally prepared permanent magnets, it has also been observed that coercivity decreases with increasing grain sizes within a certain range, as seen in Nd
2Fe
14B thin films with the c-axis perpendicular to the film plane and sintered magnets [
31], as well as in SmCo
5 nanocrystalline materials [
32]. As shown in
Figure 3b, experimental data indicate that the coercivity of Nd
2Fe
14B thin films with the c-axis perpendicular to the film plane and sintered magnets also decreases with increasing grain sizes. Similarly to the simulation results, coercivity decreases more rapidly in materials with smaller grains than in those with larger grains. The coercivity of Nd
2Fe
14B thin films with a grain size of 70 nm is 0.23885 MA·m
−1, while that of Nd
2Fe
14B sintered magnets with grain sizes of 1000 nm and 3000 nm is 0.15924 MA·m
−1 and 0.09554 MA·m
−1, respectively. This qualitative agreement between theoretical and experimental results confirms the reliability of our theoretical model and indicates that the theoretical calculations provide guidance for both experimental research and industrial production.
The energy product reflects the ability of a magnet to store and release magnetic energy and is an important parameter for evaluating the performance of permanent magnets. Based on the data obtained from the hysteresis loops in
Figure 2, the calculated maximum energy products for the Nd
2Fe
14B/Ce
2Fe
14B (NC) and Ce
2Fe
14B/Nd
2Fe
14B (CN) magnets are listed in
Table 3. The maximum energy products for NC-10, NC-30.5, NC-272, NC-304, NC-408, NC-424, and NC-440 are 383.95 kJ·m
−3, 383.80 kJ·m
−3, 383.72 kJ·m
−3, 383.71 kJ·m
−3, 383.69 kJ·m
−3, 383.70 kJ·m
−3, and 383.70 kJ·m
−3, respectively. For CN-10, CN-30.5, CN-272, CN-304, CN-408, CN-424, and CN-440 the maximum energy products are 383.57 kJ·m
−3, 382.06 kJ·m
−3, 380.08 kJ·m
−3, 380.08 kJ·m
−3, 380.05 kJ·m
−3, 380.04 kJ·m
−3, and 380.04 kJ·m
−3, respectively. The external magnetic field at which the maximum energy product occurs for all fourteen is the same, at -0.56 MA·m
−1. Furthermore, as explained earlier for the remanence changes in magnets with the same structure, the reason for the similar maximum energy products despite the trend of decreasing values with increasing magnet volumes is that, before the magnetic moments are fully reversed, the deviation of the magnetic moments from the external magnetic field is similar across these magnets. In cases where the main phase distribution is different but the volume is the same, the energy product of Nd
2Fe
14B/Ce
2Fe
14B magnets is higher than that of Ce
2Fe
14B/Nd
2Fe
14B magnets. This is because the magnetic moments of Nd
2Fe
14B/Ce
2Fe
14B magnets are less affected by the external magnetic field compared to Ce
2Fe
14B/Nd
2Fe
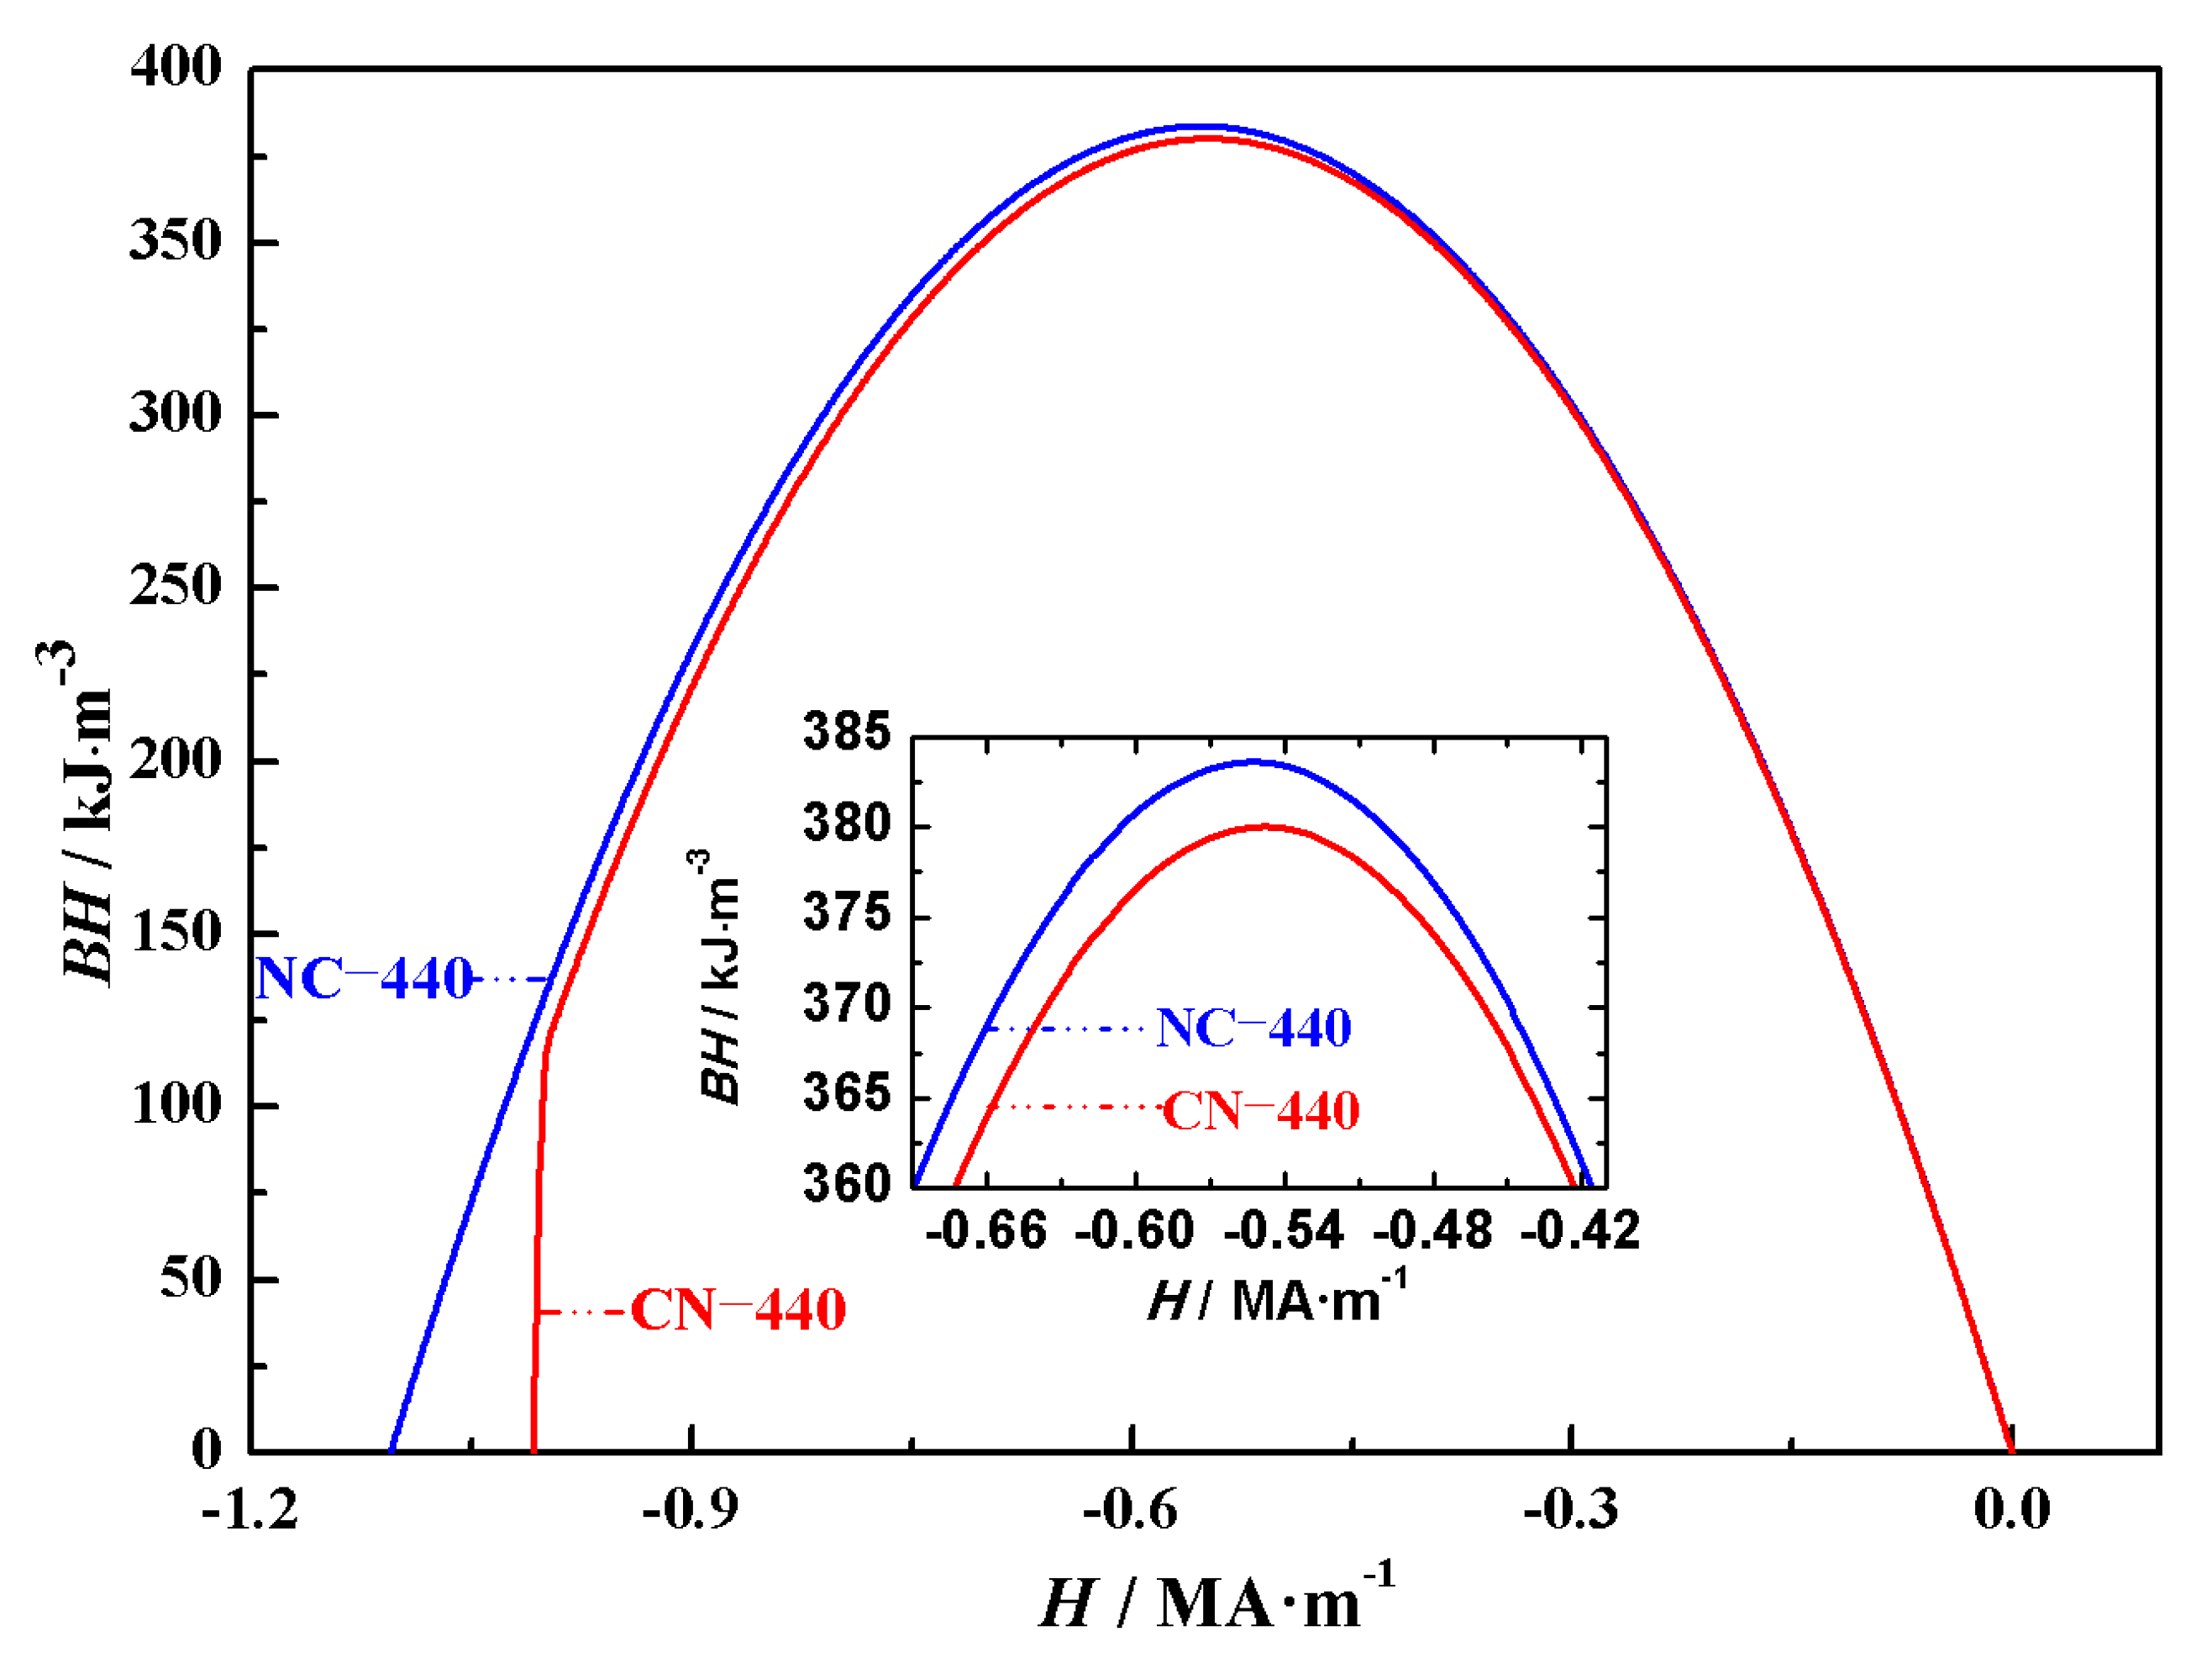
14B magnets, leading to higher magnetization in the former under the same magnetic field. Since the energy product of Nd-Ce-Fe-B magnets shows a similar trend with the external magnetic field, the impact of the main phase positioning on the energy product is analyzed using NC-440 and CN-440, which have inner and outer cubic edge lengths of 350 nm and 440 nm, respectively. As shown in
Figure 4, the inset is a magnified view of the energy product curve near its peak. From
Figure 4, it can be seen that when the overall volume is the same but the main phase distribution differs, the energy products of the two structures are generally similar, but the inset shows a clear difference in their maximum energy products.
3.2. Angular Distribution and In-Plane Magnetization
The angular distribution
θ(
z) clearly describes the deflection behavior of magnetic moments under an external magnetic field and reflects the generation, movement, and evolution of magnetic domains. By analyzing the domain behavior, the magnetic properties of the material can be further evaluated. The angular distribution
θ(
z) refers to the variation in the angle
θ between the magnetic moment and the applied field
H along the
z-axis direction.
θ(
z) represents the average angle of the magnetic moments within a mesh cell in the
x–
y plane at a specific
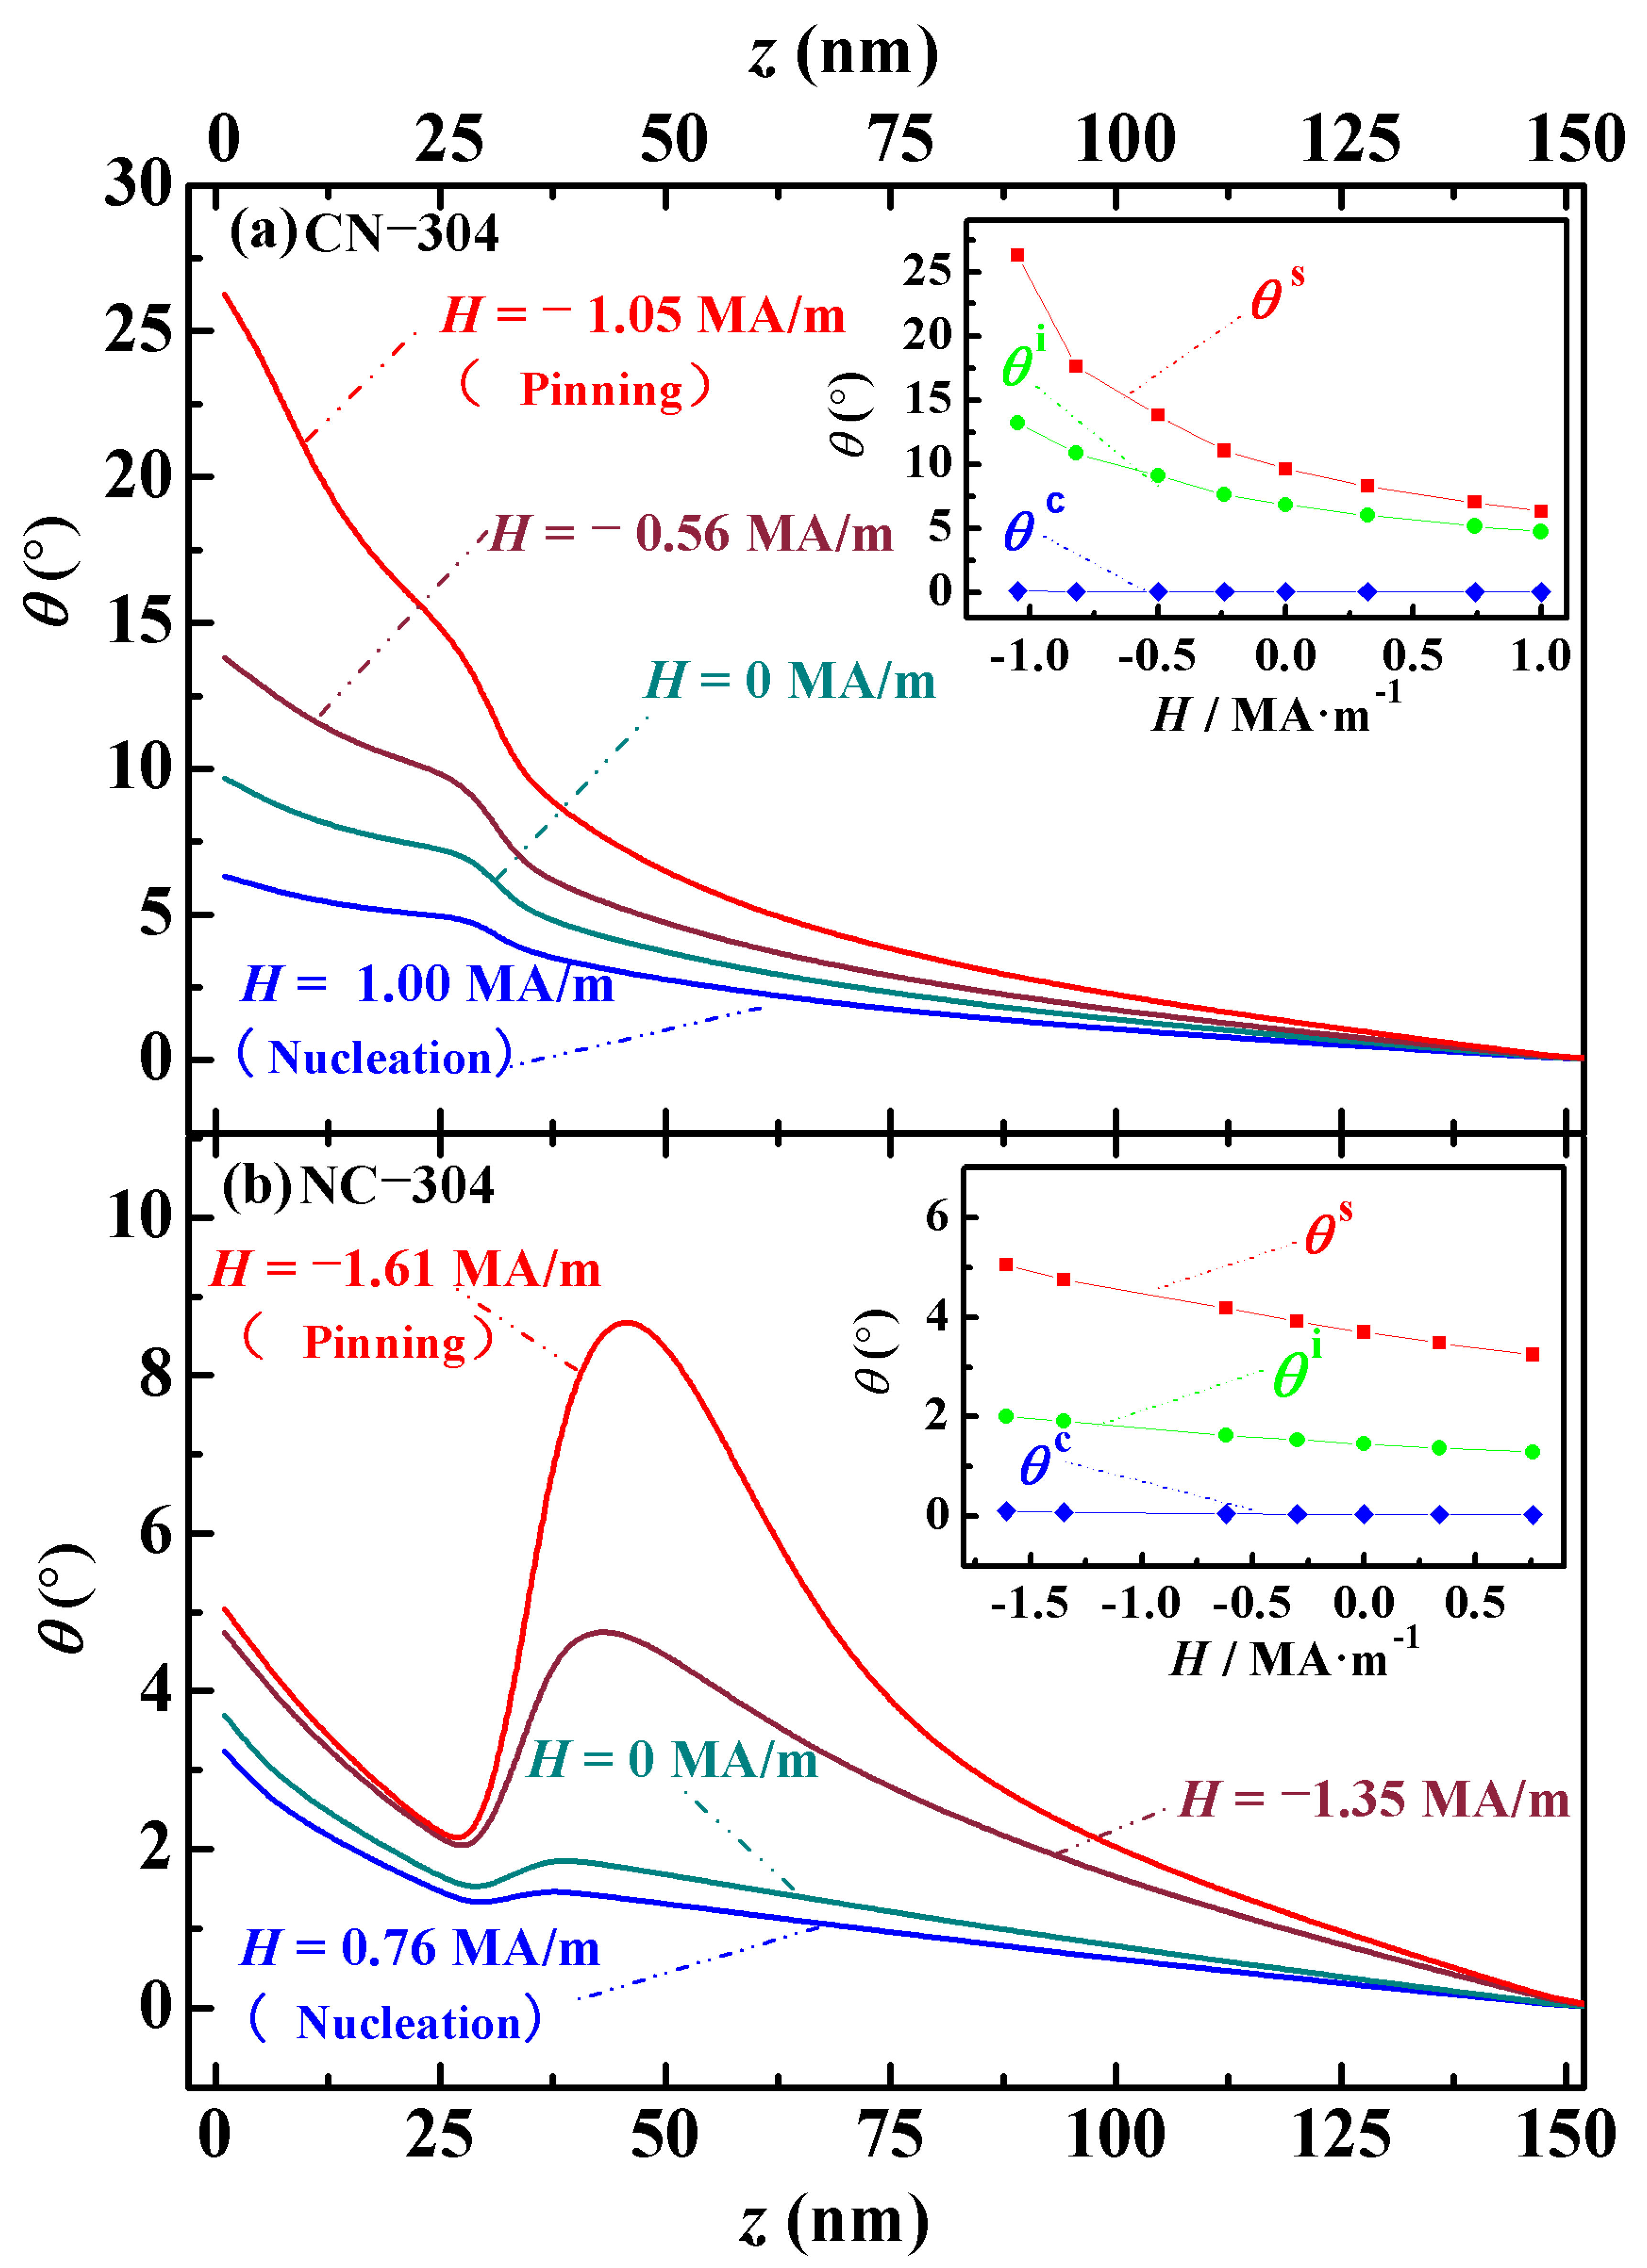
z-position. Since the angular distribution of the easy axis perpendicular Nd-Ce-Fe-B magnets exhibits similar trends when the main phase distribution is the same but the volume differs, this study selects two representative structures with inner and outer cubic edge lengths of 240 nm and 304 nm for analysis, as shown in
Figure 5. The inset in the upper right corner of
Figure 5 illustrates the evolution of three characteristic angles (
θs,
θi, and
θc) with applied magnetic fields. These angles correspond to
θ(
z) at the surface of the magnet, the interfaces between the main phases, and the center of the cube along the
z-direction, respectively. These characteristic
θ(
z) values form microscopic hysteresis loops as the external field changes, revealing the intrinsic reversible demagnetization behavior of the magnets. As shown in the model in
Figure 1, the magnet structures are designed with a body-centered symmetry, and the angular distributions of all magnets are symmetric around the center of the cube. For simplicity, the analysis of
θ(
z) employs only the symmetric lower half of the cube (specifically with
z ranging from 0 nm to 152 nm). In
Figure 5, the angular distribution of the Nd-Ce-Fe-B magnets from left to right corresponds to a bottom-to-top view in the model, shown in
Figure 1. In cases with the same total volume but different phase stacking, the Ce
2Fe
14B/Nd
2Fe
14B magnet undergoes the magnetic moment rotation earlier than the Nd
2Fe
14B/Ce
2Fe
14B magnet, indicating a lower nucleation field. From nucleation to pinning, the rotation angle
θ(
z) at the surface of the Ce
2Fe
14B/Nd
2Fe
14B magnet is larger than that of the other configuration. This is attributed to the higher crystalline anisotropy constant of Nd
2Fe
14B compared to Ce
2Fe
14B. During the nucleation-to-pinning process, the Ce
2Fe
14B/Nd
2Fe
14B and Nd
2Fe
14B/Ce
2Fe
14B magnets consistently maintain two and six domains, respectively. To further investigate, we also calculated the angular distributions of corresponding Fe/Nd
2Fe
14B magnets (replacing Ce
2Fe
14B with soft magnetic Fe). The analysis reveals that the domain numbers during nucleation and pinning in Fe/Nd
2Fe
14B magnets are identical to those in Ce
2Fe
14B/Nd
2Fe
14B magnets. As is well known, hard magnetic materials generally exhibit multi-domain states [
33]. Thus, based on the above results, although the crystalline anisotropy of Ce
2Fe
14B is higher than that of Fe but lower than that of Nd
2Fe
14B, the Nd
2Fe
14B/Ce
2Fe
14B magnets still exhibit characteristics of a hard magnet. In contrast, the Ce
2Fe
14B/Nd
2Fe
14B magnets with the same total volume do not show the same hard magnetic behavior. This conclusion provides theoretical guidance for the design of high-performance permanent magnet structures.
Taking magnets with inner and outer cubic edge lengths of 240 nm and 304 nm as examples, the domain evolution of both structures is analyzed.
Figure 5a shows the symmetric half of the Ce
2Fe
14B/Nd
2Fe
14B magnet (CN-304), consisting of Ce
2Fe
14B (152 nm) and Nd
2Fe
14B (120 nm). At the nucleation point (
H = −
HN = 1.00 MA/m), magnetic domains begin to form, with an initial domain size of 6.24°, defined as the angle difference between two adjacent turning points in the
θ-
H curve. As the reverse field increases, the domains continue to grow, reaching 9.60° at
H = 0 MA/m and further expanding to 13.71° at
H = −0.56 MA/m. When the reverse field reaches the pinning field (
H = −
HP = −1.05 MA/m), the domain size increases to 26.16°. After this point, with the continued increase in the reverse field, the magnetic moments flip completely, reaching an angle of 180° with the external field. At this stage, the magnet reaches negative saturation, and the domains vanish. As shown in
Figure 5b, the NC-304 magnet begins to nucleate at
HN = −0.76 MA/m. At this point, three domains form with initial sizes of 1.96°, 0.20°, and 1.44°, respectively. As the reverse field increases to
H = 0 MA/m, these domain sizes grow to 2.25°, 0.41°, and 1.83°. When the field increases to
H = −1.35 MA/m, the domain sizes become 2.83°, 2.86°, and 4.69°. Finally, at the pinning field (
H = −
HP = −1.61 MA/m), the domain sizes increase to 3.04°, 6.77°, and 8.67°, respectively. Beyond this point, the further increase in the reverse field causes the magnetic moments to flip fully to 180°, bringing the magnet to negative saturation and eliminating all magnetic domains. From the domain evolution in the NC-304 magnet shown in
Figure 5b, it can be seen that after nucleation, with the increasing reverse demagnetizing field, the three domains expand gradually. The central domain grows upward and downward into adjacent regions, increasing its spatial volume. As a result, the adjacent upper and lower domains shrink in spatial volume while still increasing in angular size. As shown in the microscopic hysteresis loop in the inset of
Figure 5, for both structures and at all thicknesses, the magnetic moments at the surface of the thin films show a lower resistance to the applied magnetic field. These surface moments influence the magnetic moments at the phase interfaces and inside the central cubic region through exchange interactions. The peaks observed in
Figure 5a,b are related to the fact that the magnetocrystalline anisotropy field of Ce
2Fe
14B is smaller than that of Nd
2Fe
14B. In other words, under the action of an applied reverse magnetic field, the magnetic moments within Ce
2Fe
14B are more easily deflected compared to those in Nd
2Fe
14B. However, due to the effect of interfacial exchange coupling, the peaks appear near the dual-phase interface (around 32 nm) and also within the primary Ce
2Fe
14B phase. That is, during the competition between the different anisotropy fields of the two main phases and the applied reverse field, the deflection of magnetic moments within the magnet gives rise to the peaks shown in the figure. By comparing the angular distributions, it is found that for magnets with the same structure, the deviation angle
θ of the magnetic moments from the external field is similar between the nucleation and pinning stages.
The number of magnetic domains is determined from the angular distribution. The angular distribution
θ(
z) refers to the variation in the angle
θ between the magnetic moment and the applied field
H along the z-axis. The horizontal axis represents the position within the magnet, denoted by the variable
z. Due to the structural symmetry, we only plotted the angular distribution for half of the model volume. Therefore, the number of domains inferred from
Figure 5 corresponds to half of the total number of domains in the entire magnet. For a cubic pair magnet with an outer edge length of 304 nm, the range from
z = 0 nm to 152 nm represents half of its length. The number of magnetic domains is counted by the inflection points in the
θ(
z) curve within this range: each inflection point corresponds to one domain. In
Figure 5a, no inflection points appear, corresponding to one domain in half of the magnet, so the total number of domains for the Ce
2Fe
14B/Nd
2Fe
14B structure is two. In
Figure 5b, two inflection points appear, corresponding to three domains in half of the magnet, so the total number of domains for the Nd
2Fe
14B/Ce
2Fe
14B structure is six.
The in-plane magnetization behavior under different external magnetic fields further reveals the magnetization reversal mechanism of permanent magnets.
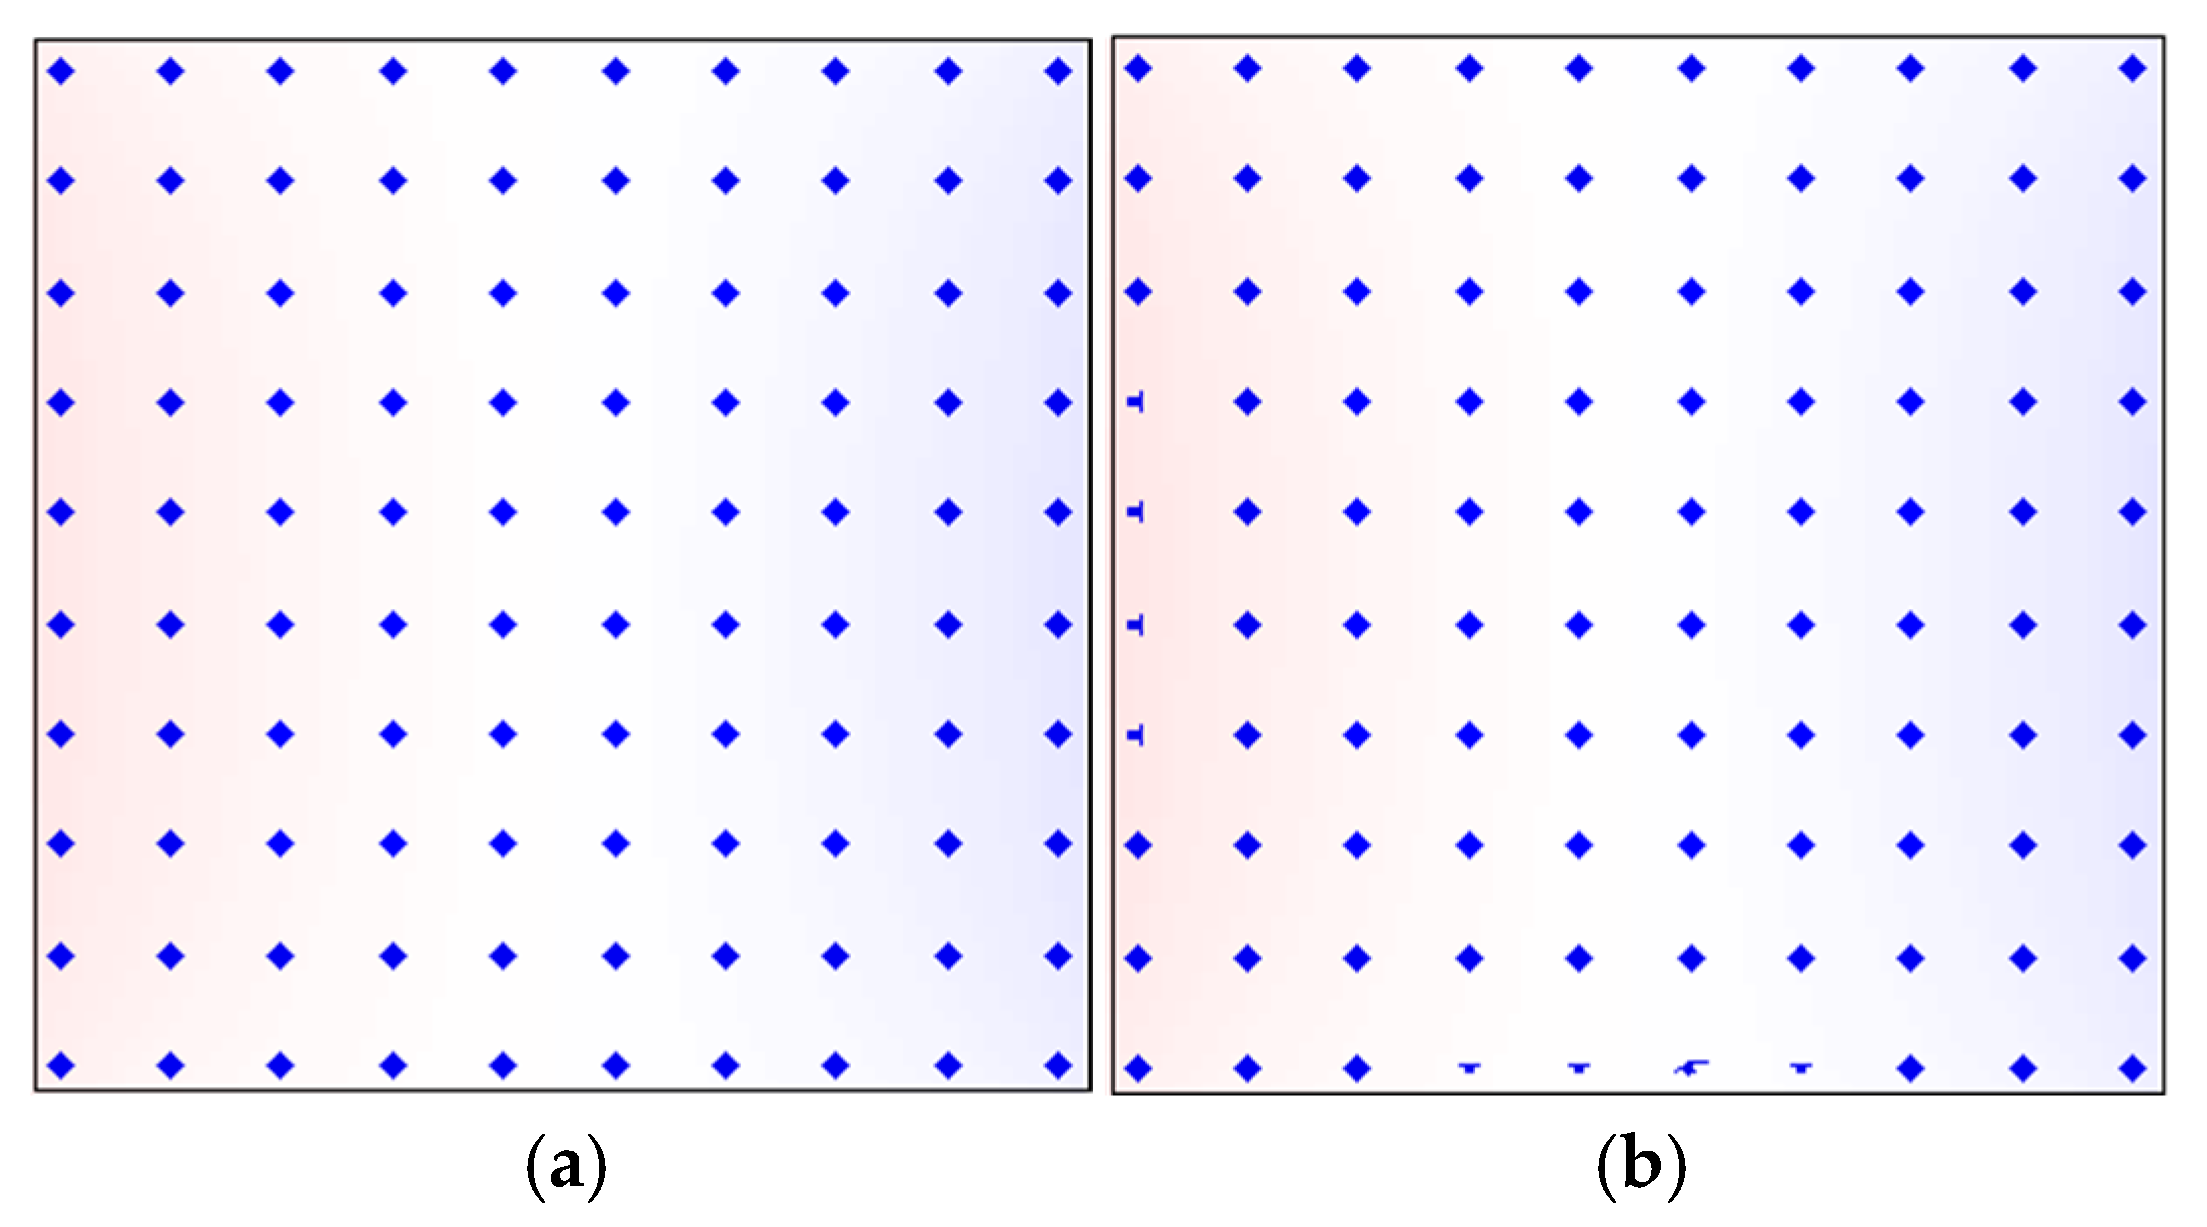
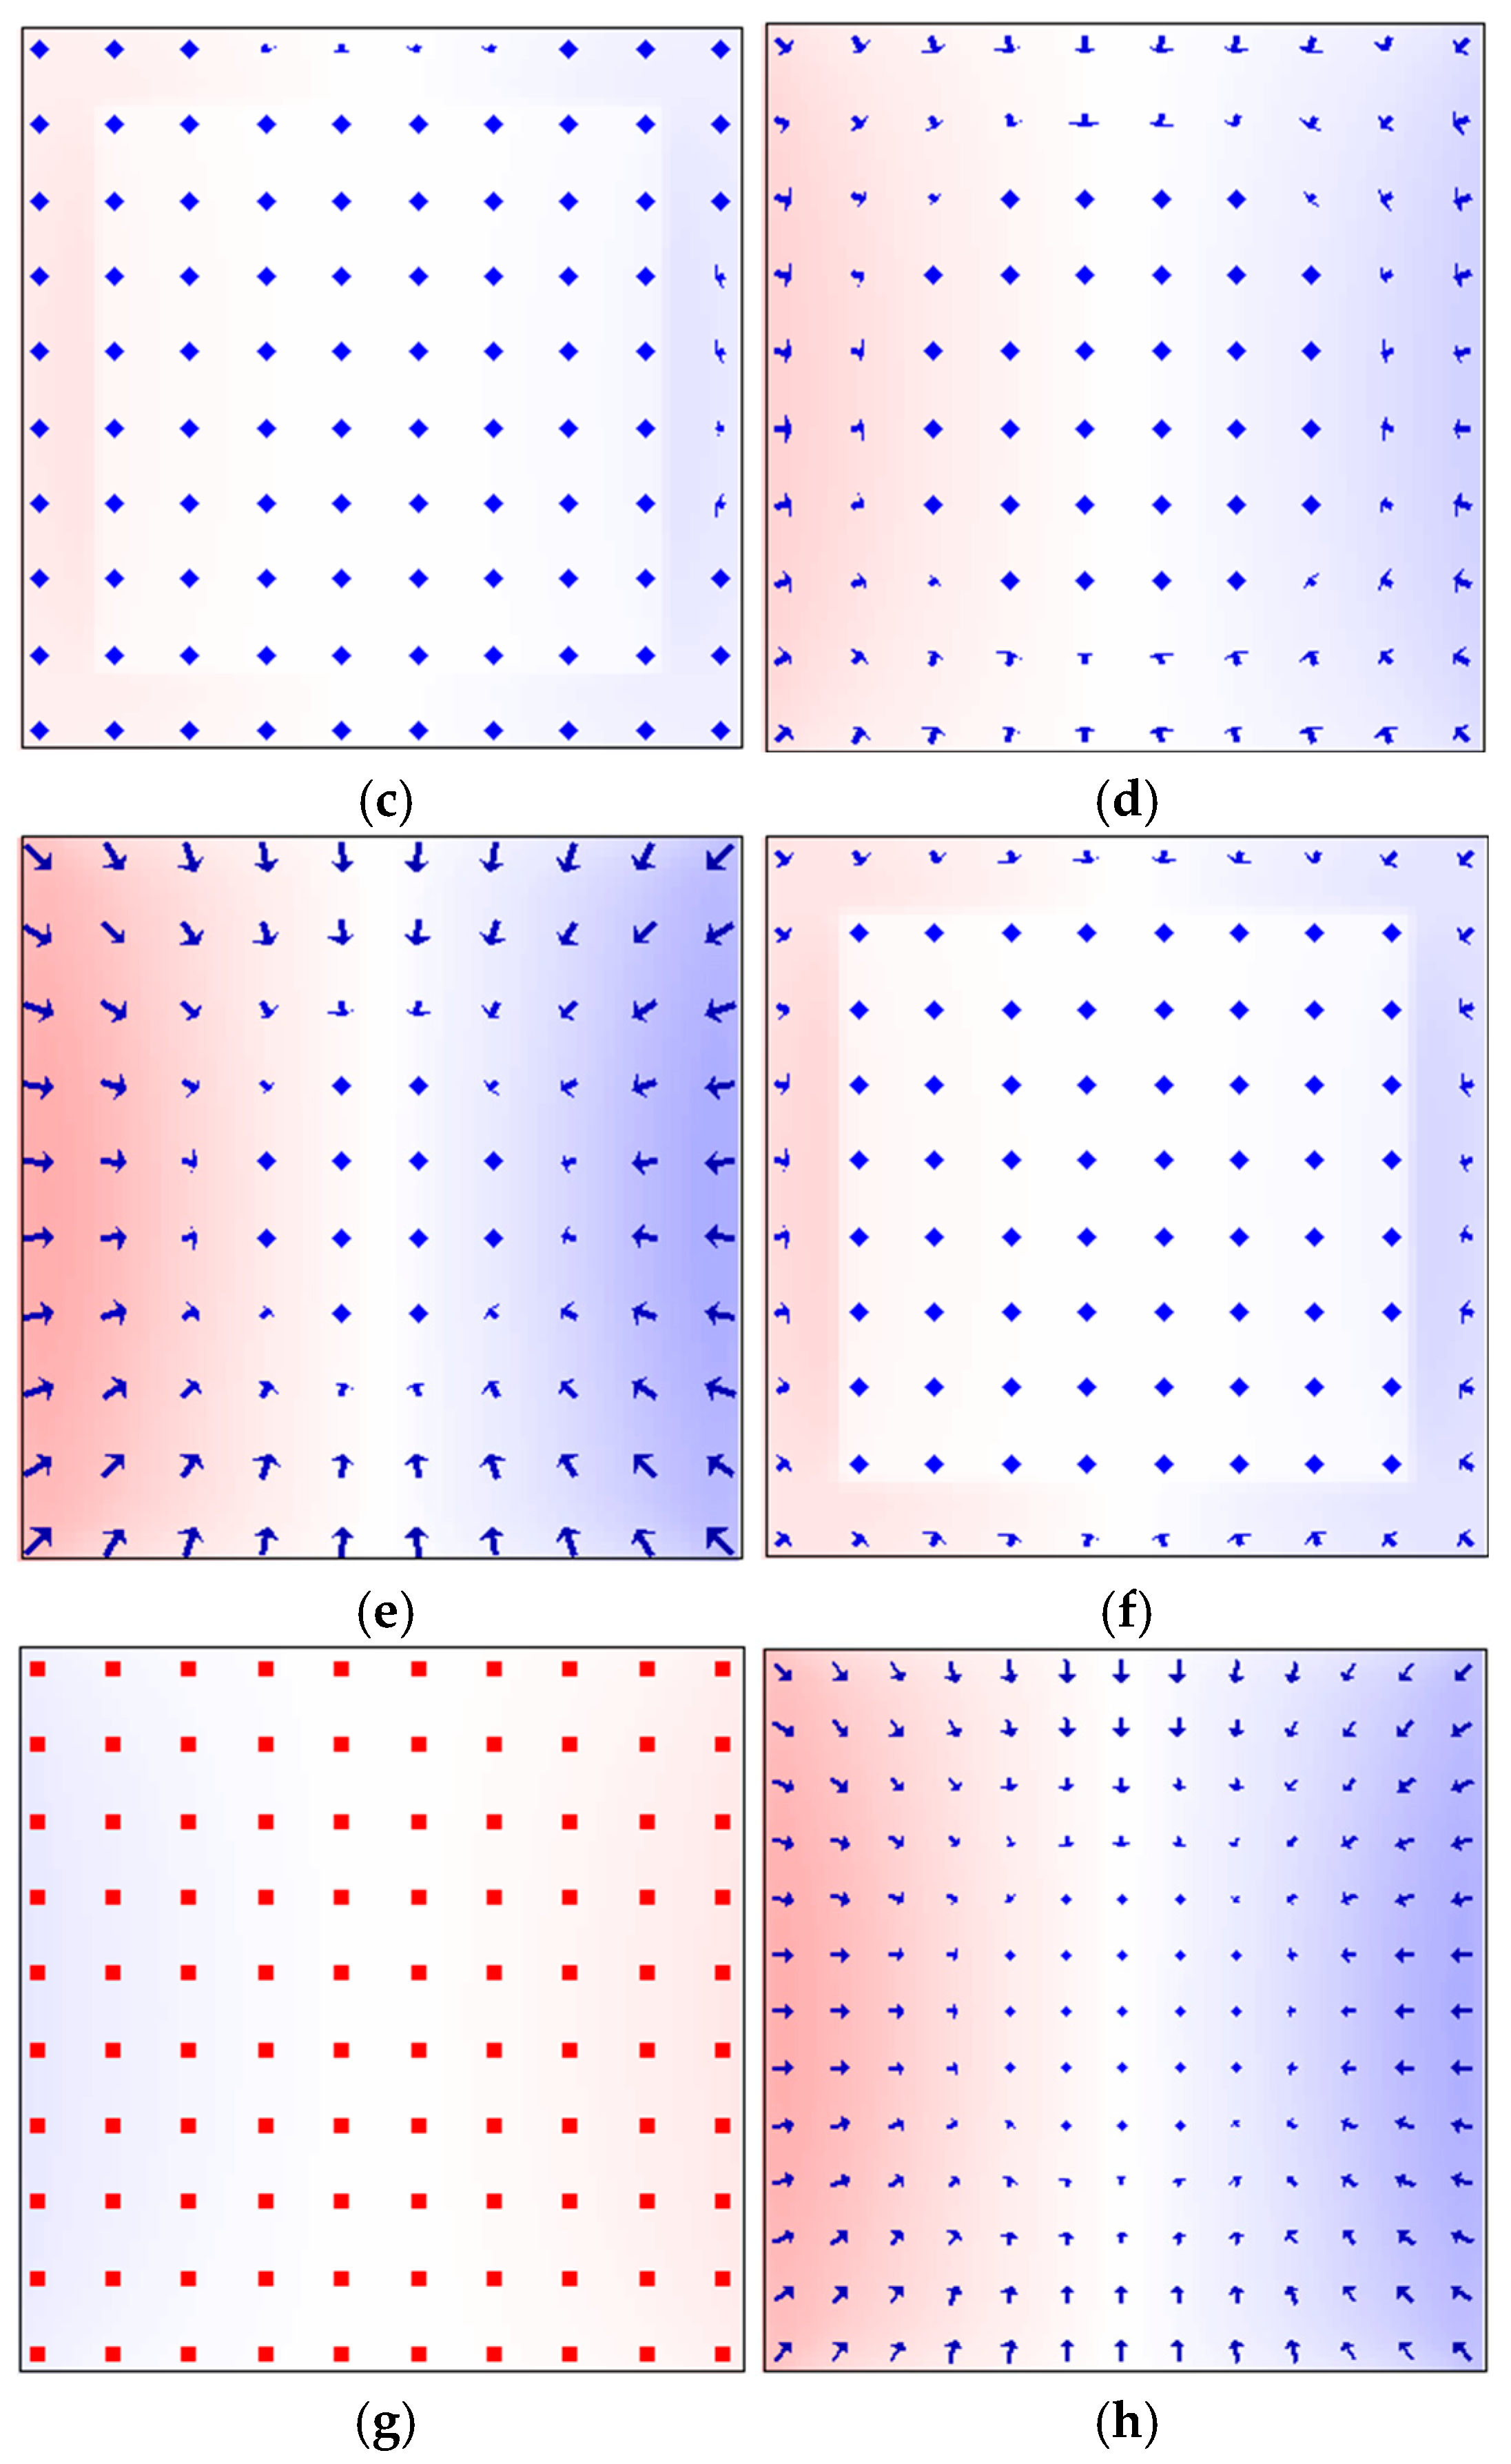
Figure 6 shows the evolution of in-plane magnetic moment distributions in the Ce
2Fe
14B (304 nm)/Nd
2Fe
14B (240 nm) magnet during the process from nucleation to pinning. All in-plane magnetization views in this study are observed from bottom to top.
Figure 6a presents the magnetic moments at the surface of the Ce
2Fe
14B (
z = 0 nm) before the nucleation under
H = 1.07 MA/m. At this point, the magnetic moments are fully aligned with the external field (
θ = 0°), along the
z-axis direction, and the magnet is in a positively saturated state. When the reverse field is reduced to
H = −
HN = 1.00 MA/m, magnetic moments at two adjacent edges of the Ce
2Fe
14B surface begin to deflect first, marking the initiation of magnetic domain formation. This occurs because the vector sum of the demagnetizing field and stray field is maximized at this surface. On the side surfaces of the thin film, no stray field exists due to the easy axis being parallel to those surfaces, so even at saturation, there is no demagnetizing field present. As the reverse field further increases, the surface magnetic moments of Ce
2Fe
14B drive the deflection of internal magnetic moments, leading to domain growth (
Figure 6b). When the field reaches
H = −0.42 MA/m, the magnetic moments at the interface layer within the Ce
2Fe
14B begin to deflect (
Figure 6c). In
Figure 6c, the colored area represents the Ce
2Fe
14B, while the blank region indicates the interface between Nd
2Fe
14B and Ce
2Fe
14B. At this point, the surface magnetic moments of Ce
2Fe
14B show significantly larger deflections compared to the nucleation stage (
Figure 6d). When the reverse field increases to the pinning field (
H = −
HP = −1.05 MA/m), the surface magnetic moments of Ce
2Fe
14B exhibit their maximum deflection (
Figure 6e), corresponding to the largest domain size. Although the surrounding magnetic moments influence the in-plane deflection, the central magnetic moment on the surface of Ce
2Fe
14B remains unrotated even at the pinning stage. At the interface, the Ce
2Fe
14B moments exhibit further deflection compared to the initial stage, but the Nd
2Fe
14B moments remain unchanged (
Figure 6f). With the further increase in the reverse field, the system undergoes an irreversible reversal. All magnetic moments are oriented at an angle of
θ = 180° relative to the external field, reaching the negatively saturated state, with moments pointing downward along the
z-axis (
Figure 6g). These observations confirm the earlier conclusions drawn from the microscopic hysteresis loop analysis: in the Ce
2Fe
14B (304 nm)/Nd
2Fe
14B (240 nm) magnet, the surface magnetic moments of Ce
2Fe
14B respond first to the external field then drive the deflection of interfacial moments through exchange coupling, which in turn induces the reversal of the Nd
2Fe
14B moments, completing the demagnetization process. Furthermore, under the same phase distribution, although the pinning field decreases with the increasing magnet volume, the deflection angles at the pinning stage remain nearly the same. This can be observed by comparing the surface magnetic moments of Ce
2Fe
14B in the larger-volume Ce
2Fe
14B (408 nm)/Nd
2Fe
14B (324 nm) magnet (
Figure 6h) with those in the Ce
2Fe
14B (304 nm)/Nd
2Fe
14B (240 nm) magnet (
Figure 6e).
3.3. Discussion
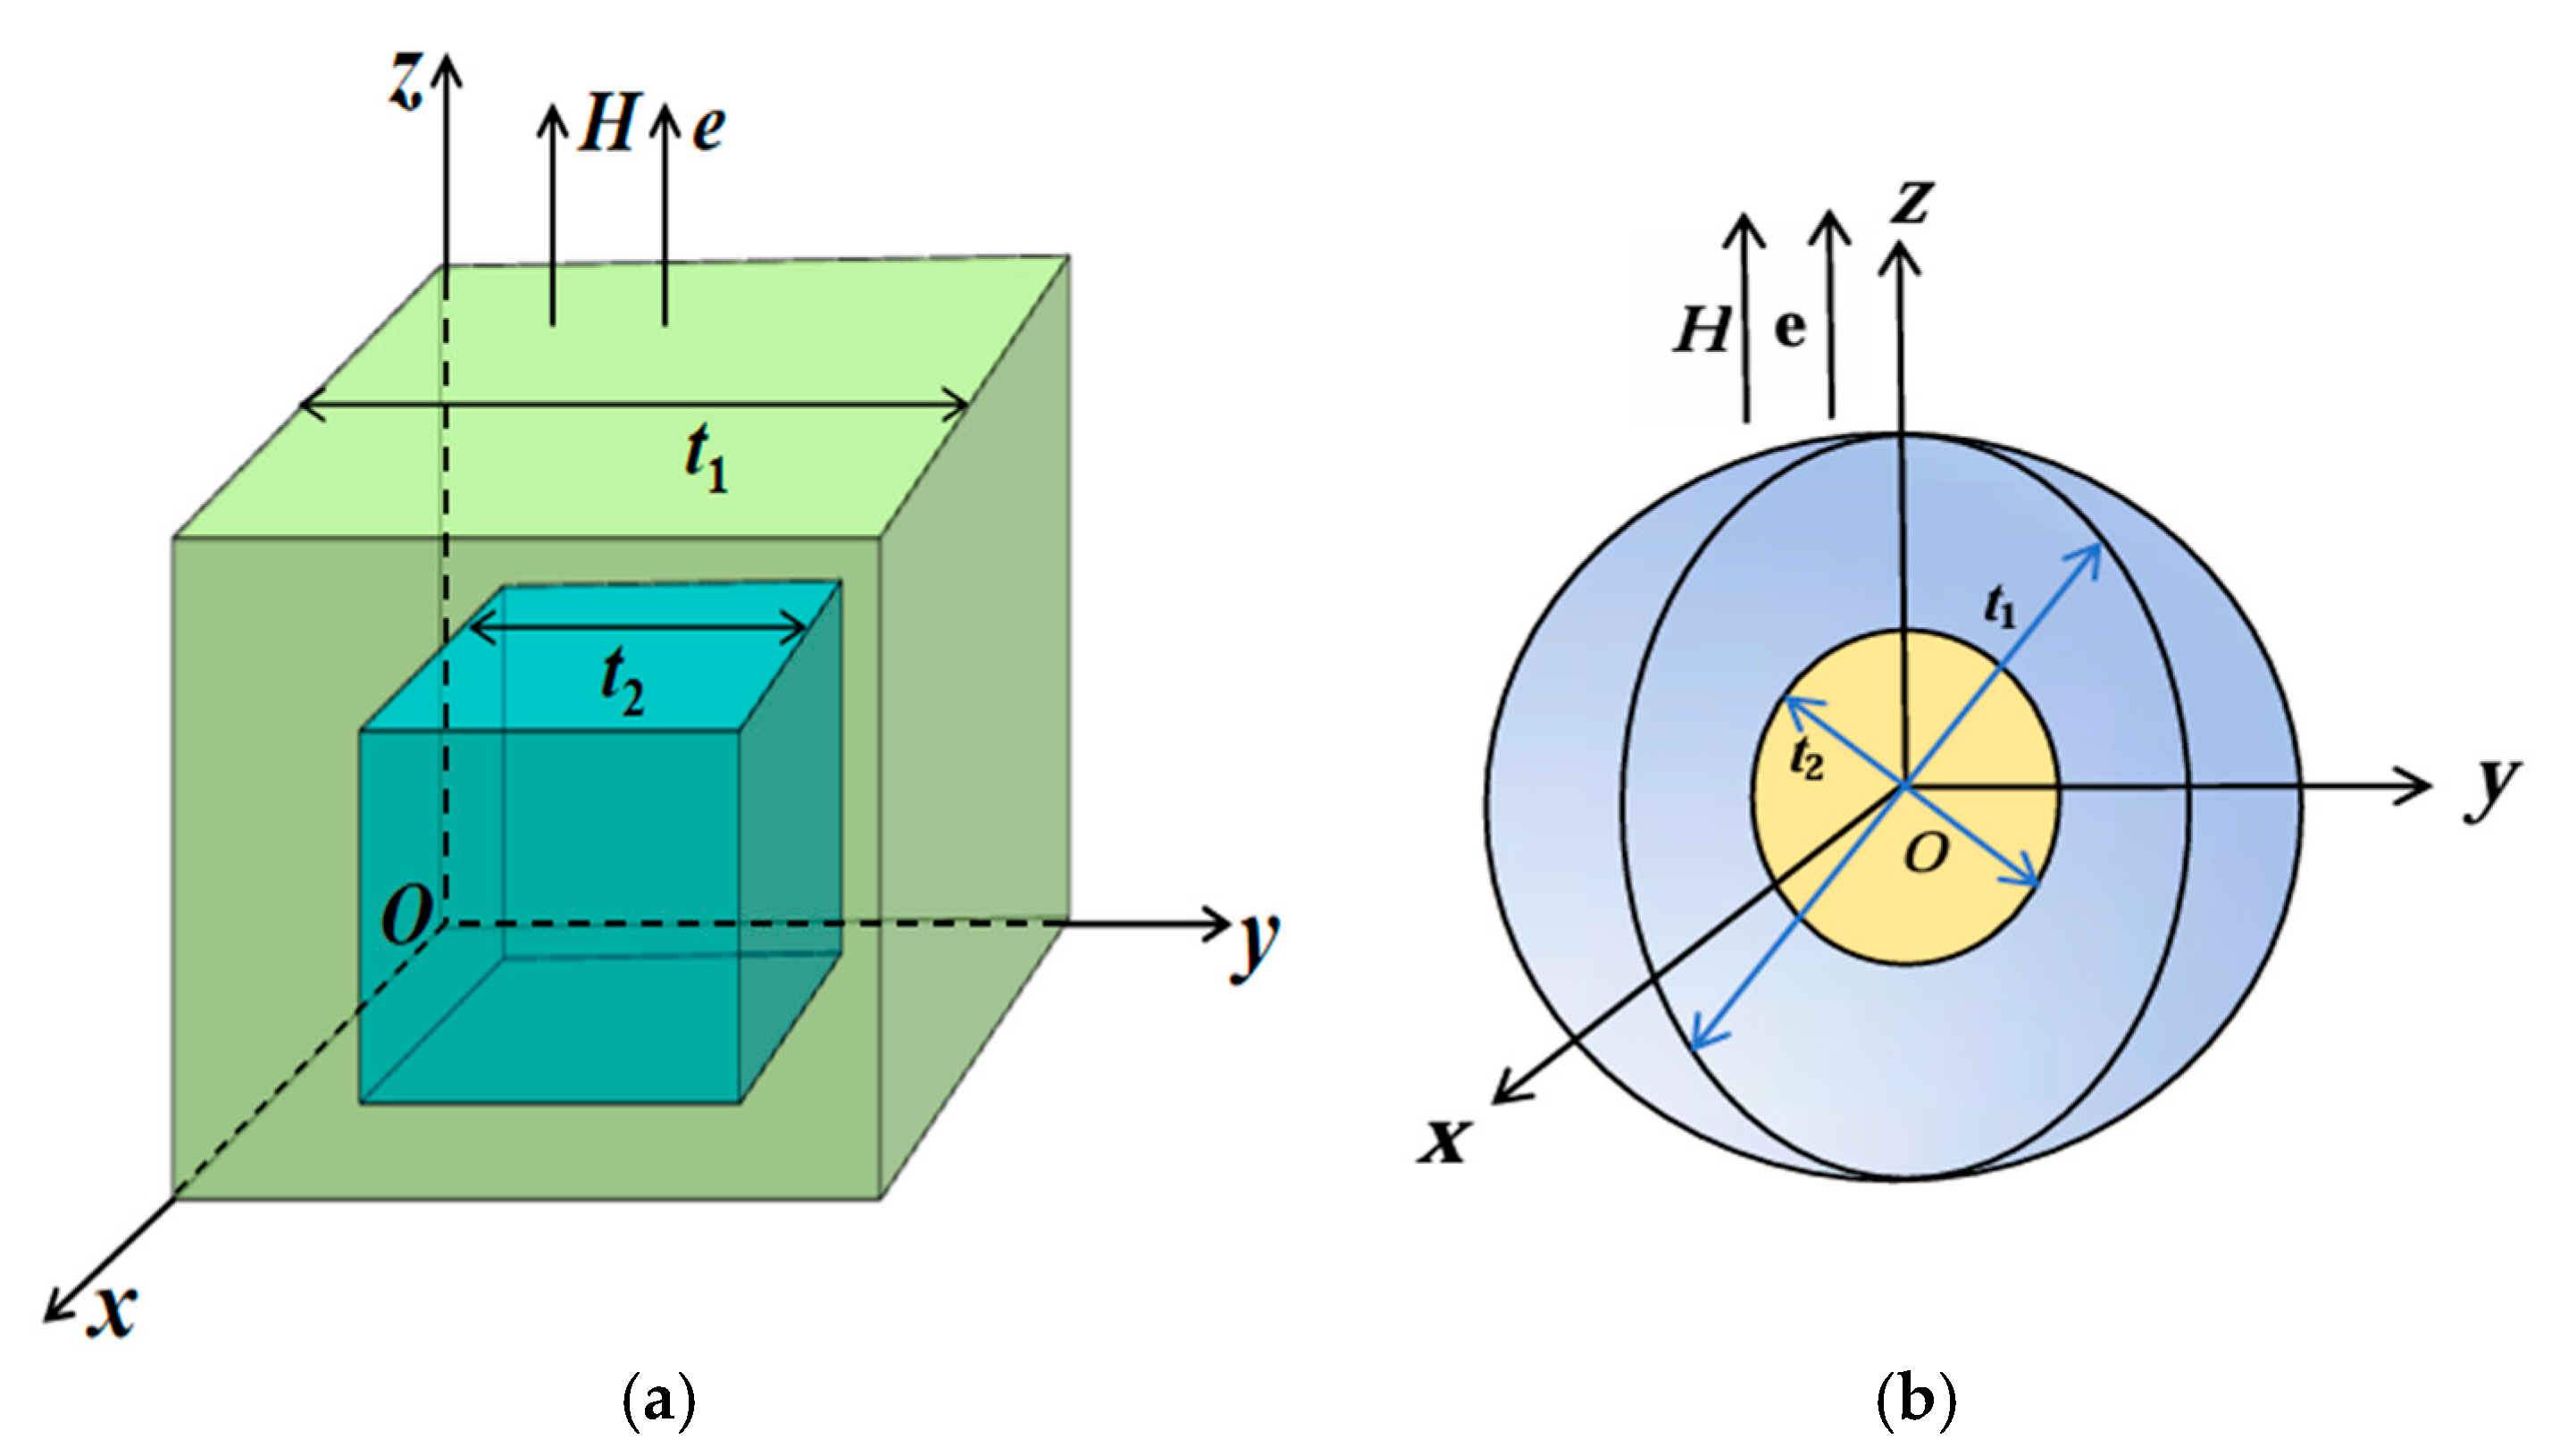
Considering that the grain morphology in both experiments and industrial production generally lies between cubic and spherical shapes, we further calculated spherical biphasic Nd-Ce-Fe-B magnets. In these models, the two main phases, Nd
2Fe
14B and Ce
2Fe
14B, have equal volume fractions and are arranged as nested inner and outer spheres, as illustrated in
Figure 1b. The configuration with Ce
2Fe
14B located in the inner or outer sphere is denoted as Nd
2Fe
14B/Ce
2Fe
14B (NC) or Ce
2Fe
14B/Nd
2Fe
14B (CN), respectively. The analysis of the cubic model Nd-Ce-Fe-B magnets shows that the coercivity varies significantly with the spatial position of the main phase, whereas the maximum energy product and other physical quantities change only slightly. Therefore, we focus solely on the trend of the coercivity variation with respect to the main phase volume and spatial position to examine whether it exhibits generality across main phase distributions and different magnet shapes. To ensure that the coercivity results obtained from the cubic model in
Figure 1a are also applicable to spherical biphasic models of different shapes and phases, as shown in
Figure 1b, we also constructed spherical biphasic Nd-Dy-Fe-B magnets composed of Nd
2Fe
14B and Dy
2Fe
14B, with phase distributions and volume fractions identical to those of the spherical Nd-Ce-Fe-B magnets; the calculation model is likewise shown in
Figure 1b. To facilitate the description of physical parameters for magnets of different sizes, the spherical magnets were labeled in the same manner as the cubic models in
Figure 1a and
Table 2, using the abbreviation of the rare earth element together with the outer sphere diameter. For example, a pure Dy
2Fe
14B magnet is denoted as “Dy” followed by the numerical value of the outer sphere diameter.
To analyze the differences in coercivity between biphasic Nd-Ce-Fe-B or Nd-Dy-Fe-B spherical magnets and the corresponding single-phase magnets (Nd
2Fe
14B, Ce
2Fe
14B, or Dy
2Fe
14B), the hysteresis loops of the single-phase systems are also plotted for comparison. The diameters of all three single-phase spheres are 15 nm.
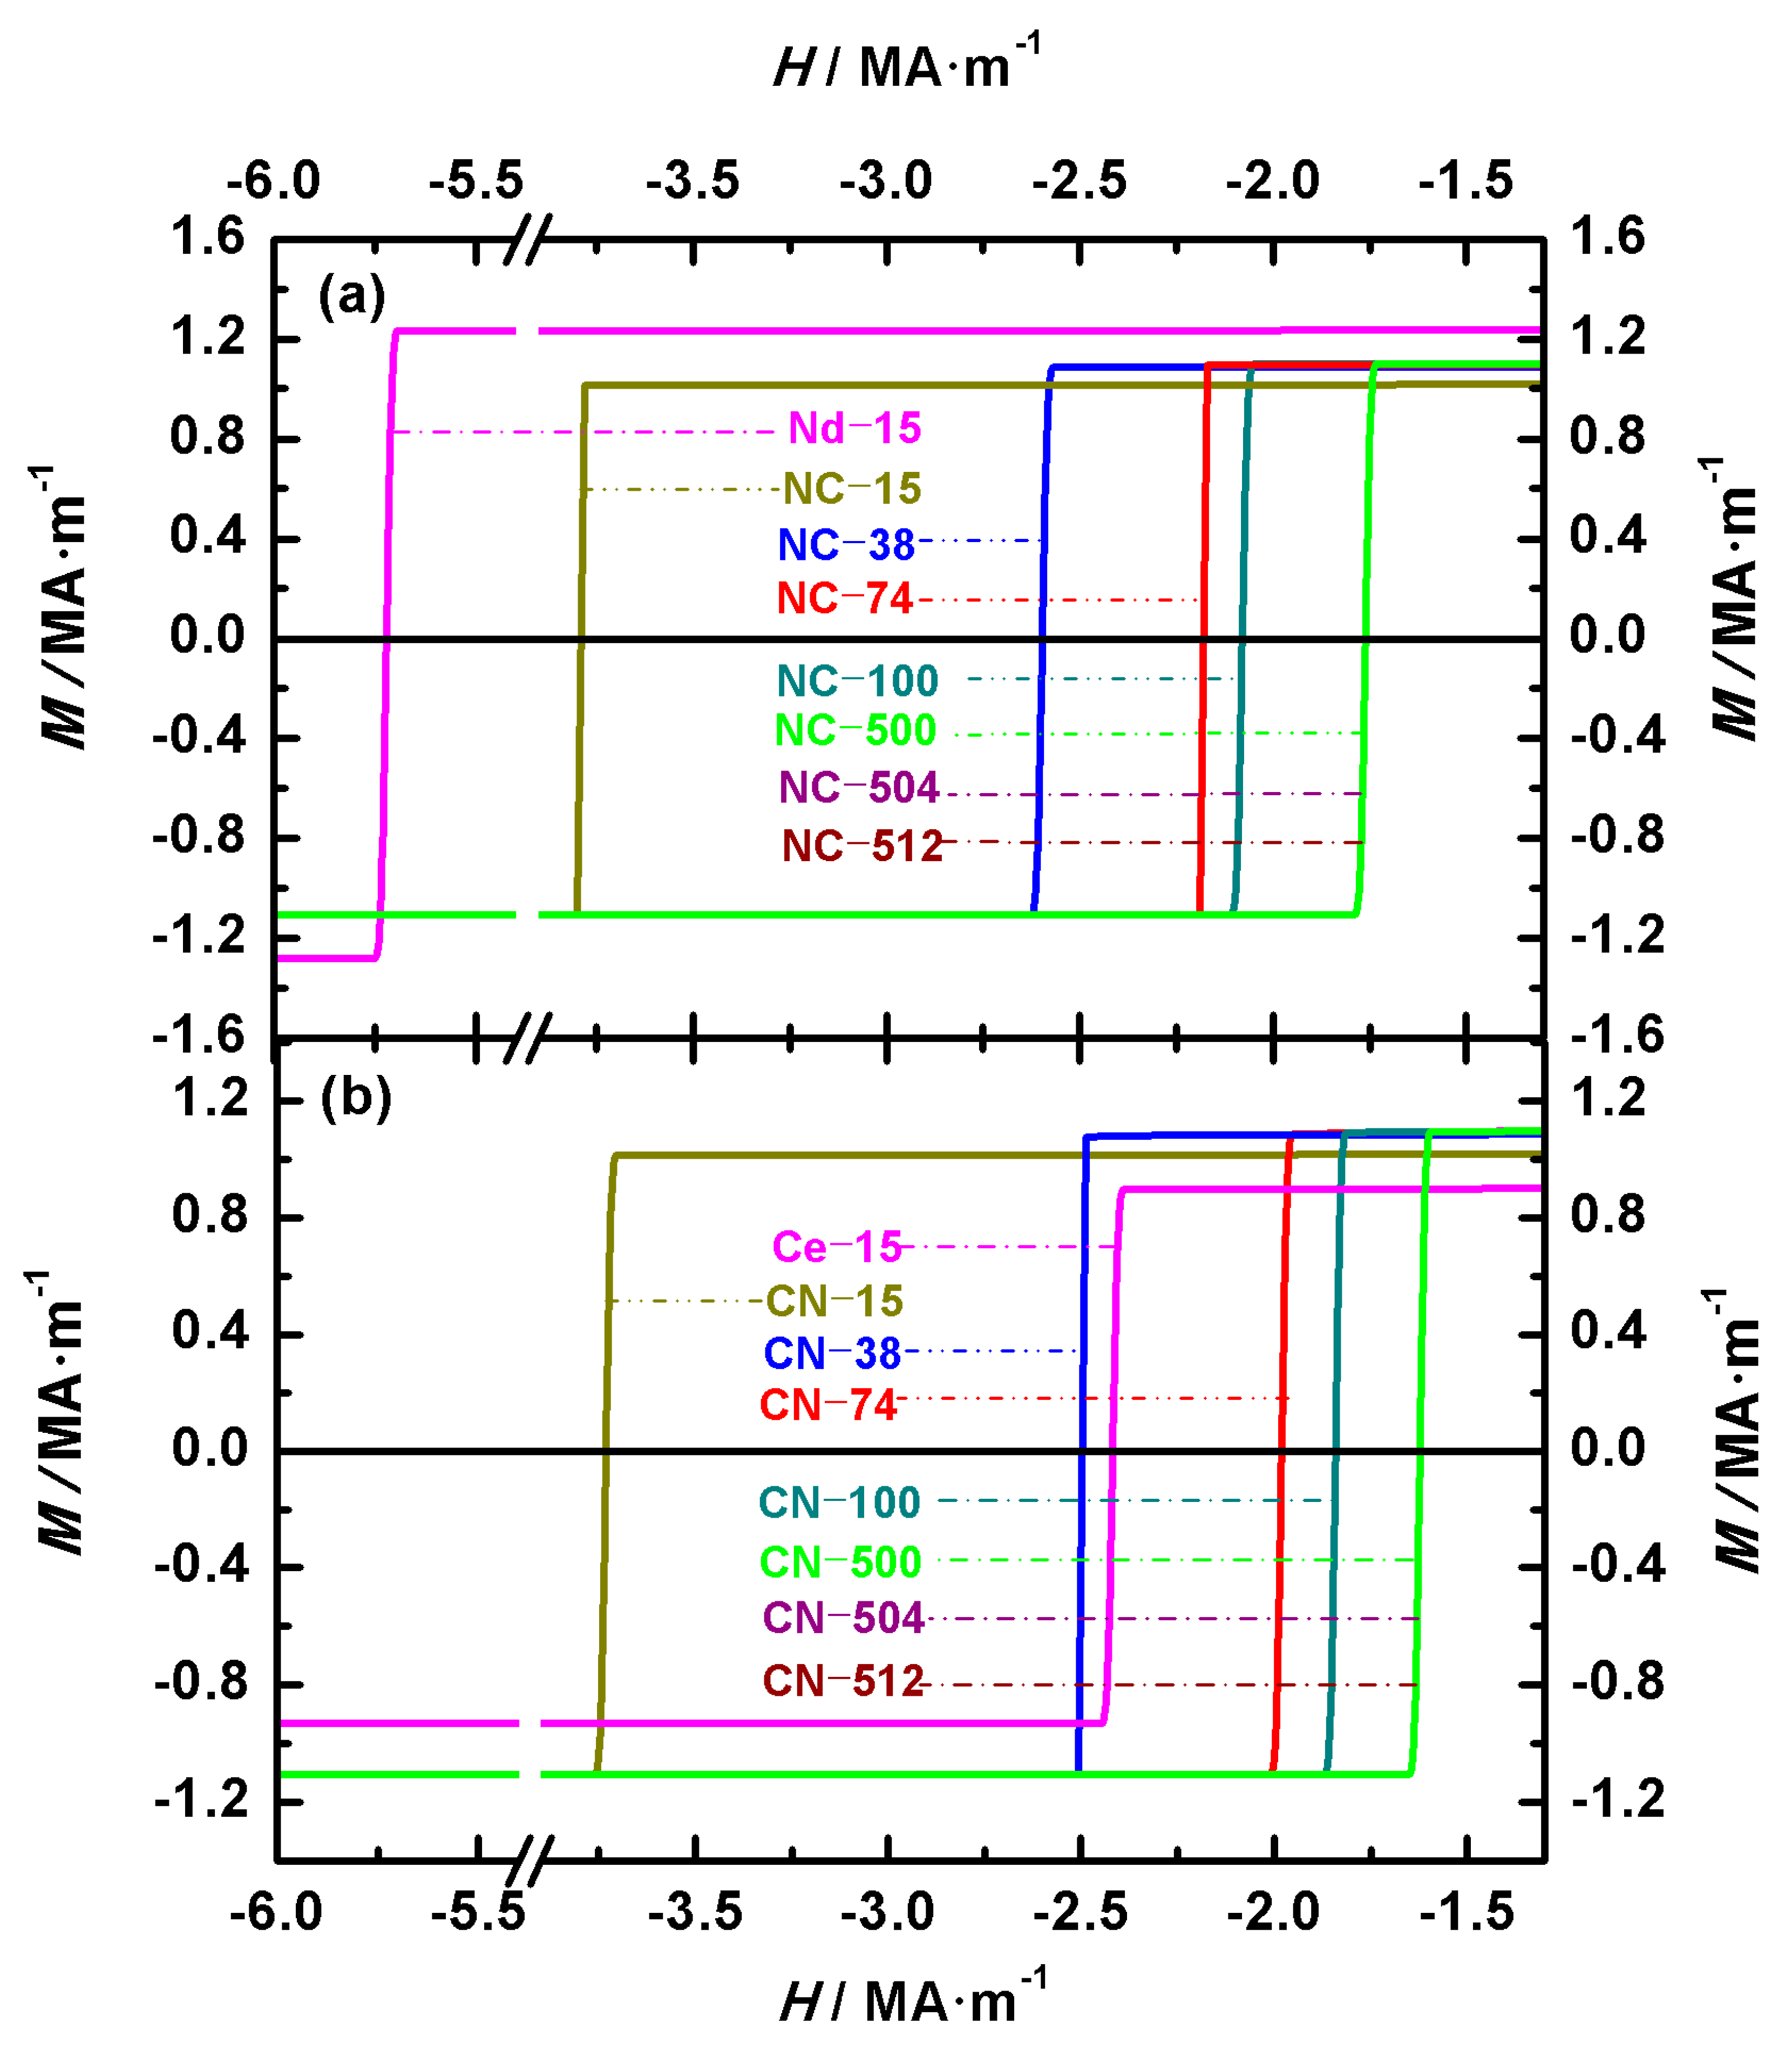
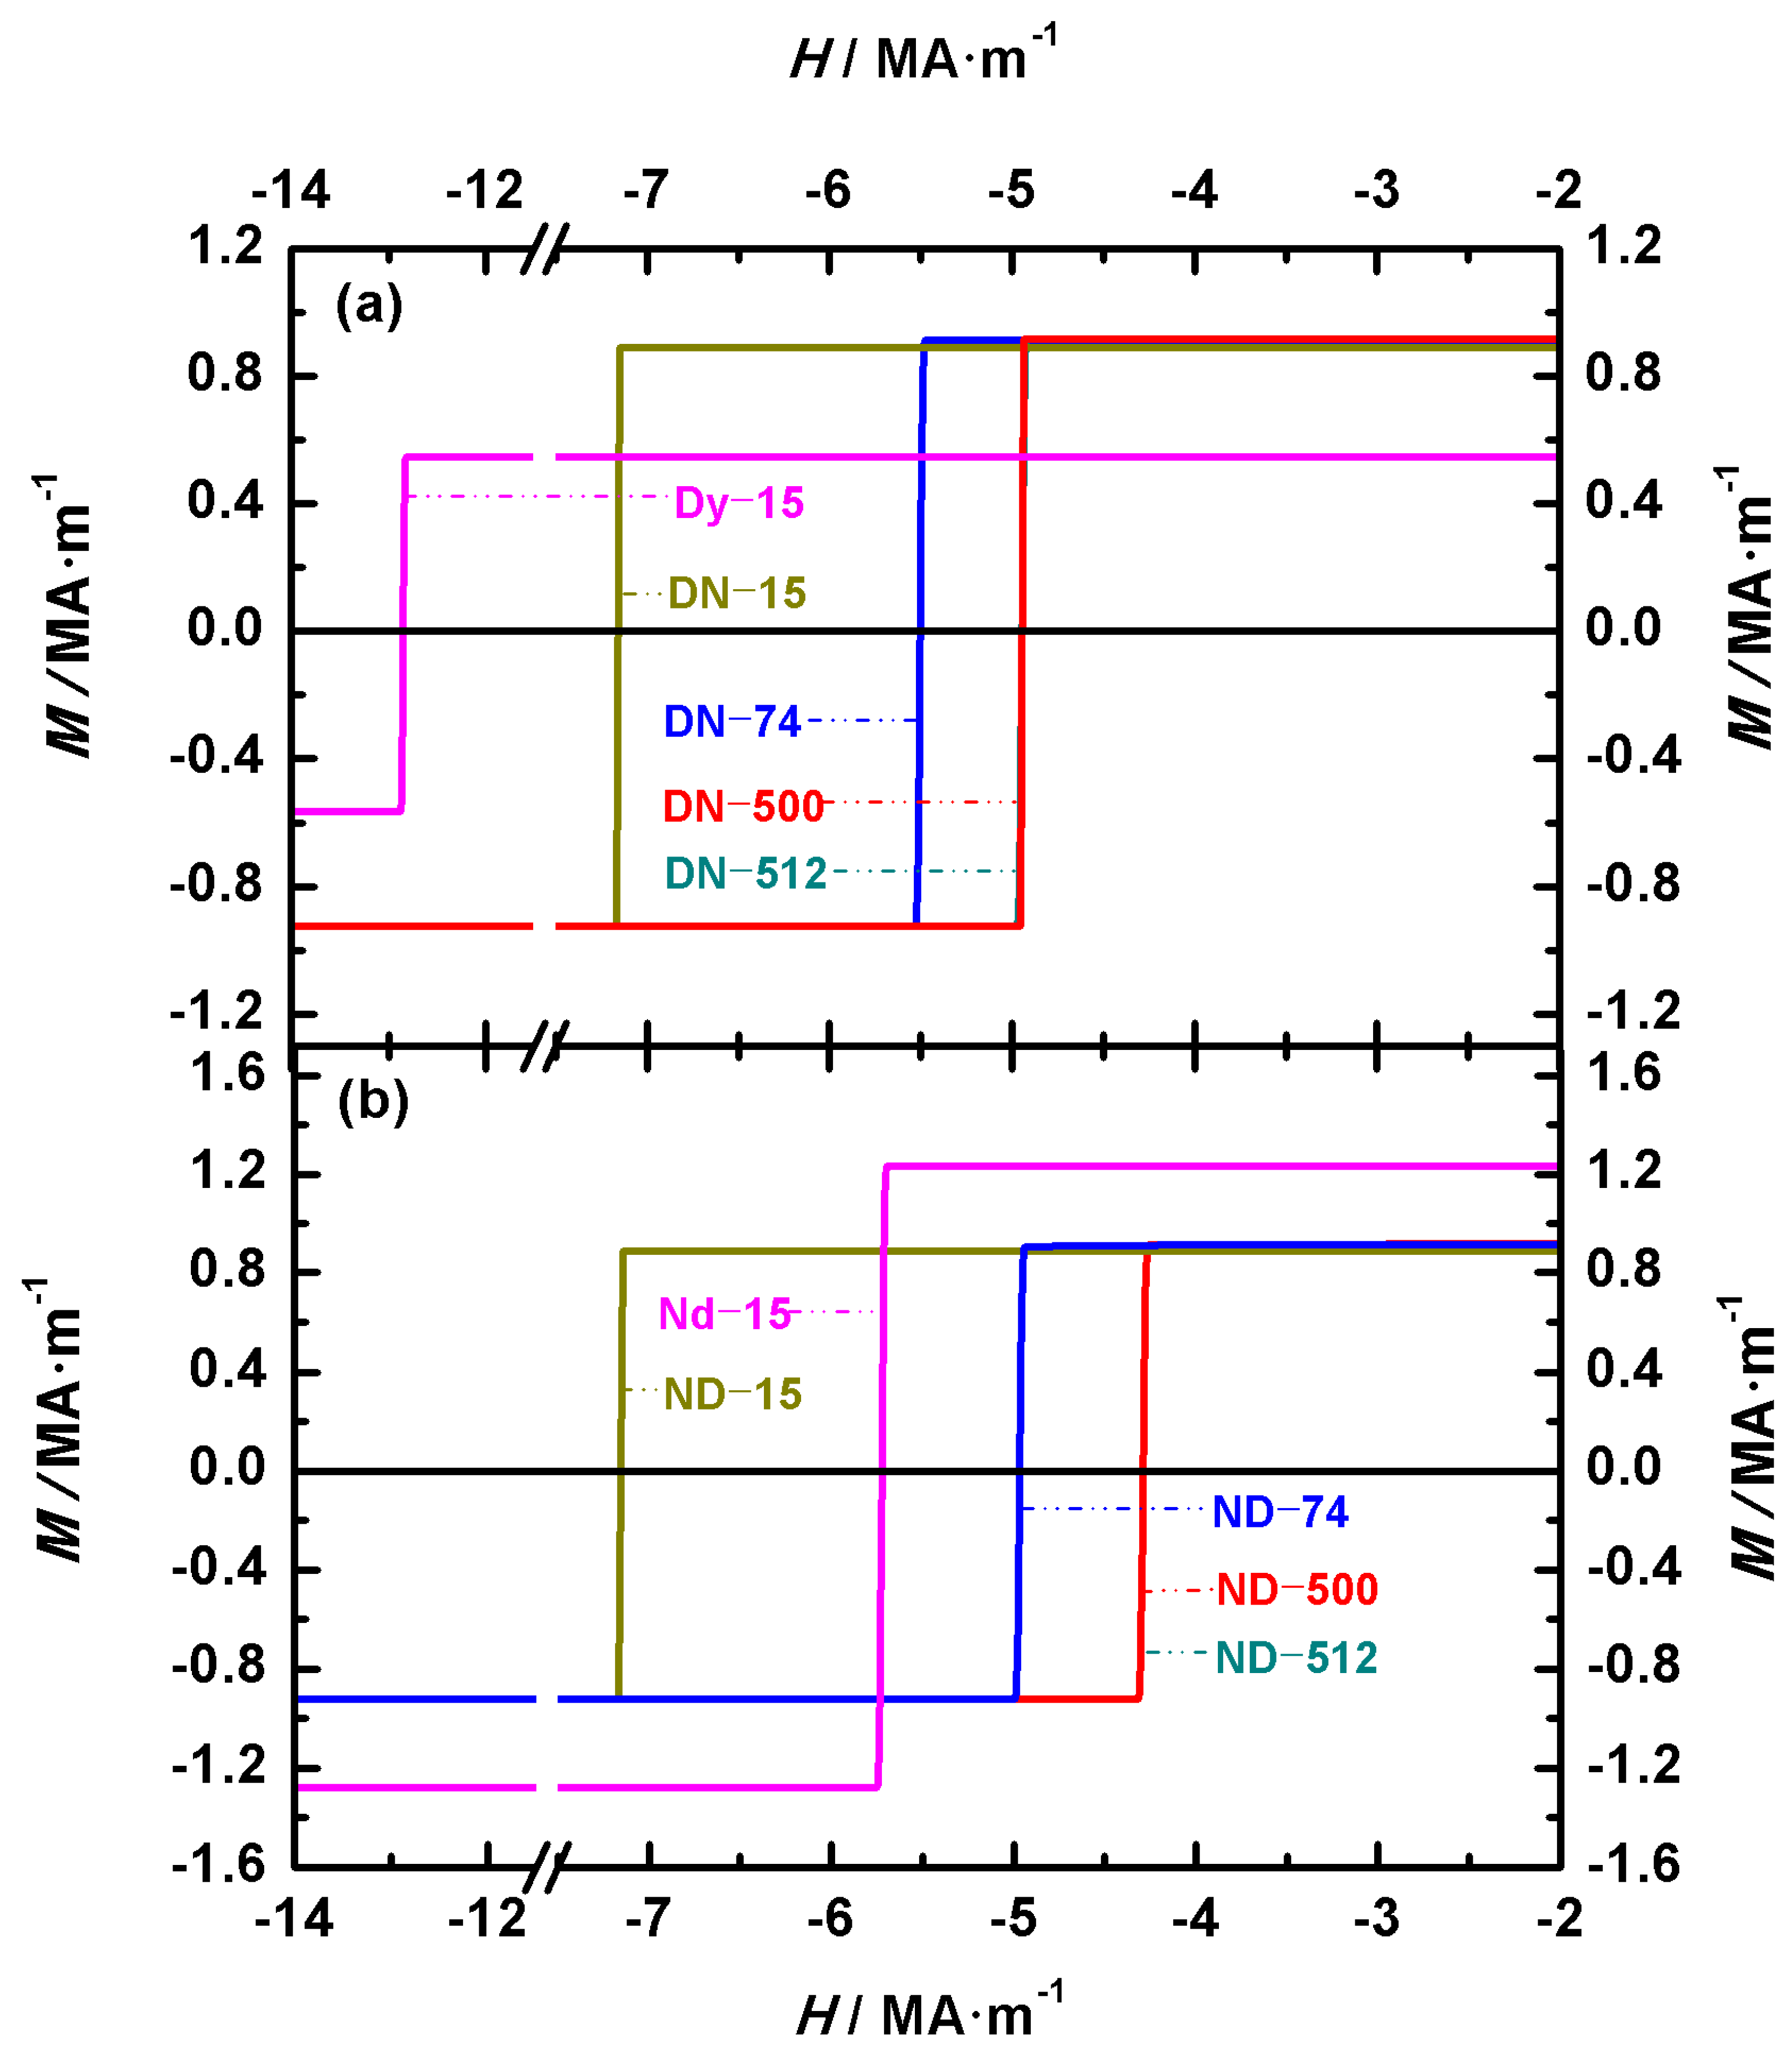
Figure 7 and
Figure 8 show the hysteresis loops of spherical Nd-Ce-Fe-B and Nd-Dy-Fe-B magnets, respectively. In
Figure 7a and 7b, Nd
2Fe
14B is located at the outer and inner regions of the biphasic magnets, respectively, whereas in
Figure 8a and 8b, Nd
2Fe
14B is located at the inner and outer regions of the biphasic magnets, respectively. In the cases where the main phases Nd
2Fe
14B, Ce
2Fe
14B, and Dy
2Fe
14B appear in the biphasic Nd-Ce-Fe-B and Nd-Dy-Fe-B spherical magnets, the hysteresis loops of the corresponding single-phase Nd
2Fe
14B, Ce
2Fe
14B, and Dy
2Fe
14B spheres are also presented. The single-phase models are labeled as Nd-15, Ce-15, and Dy-15, respectively, as shown in
Figure 7 and
Figure 8. From
Figure 7 and
Figure 8, the coercivities of single-phase Nd
2Fe
14B, Ce
2Fe
14B, and Dy
2Fe
14B are 5.71 MA·m
−1, 2.41 MA·m
−1, and 12.84 MA·m
−1, respectively. As shown in
Table 1, the magnetocrystalline anisotropy fields of single-phase Dy
2Fe
14B, Nd
2Fe
14B, and Ce
2Fe
14B decrease successively. It is well known that the magnetocrystalline anisotropy field determines the coercivity of a magnet. Therefore, when comparing the coercivities of biphasic Nd-Ce-Fe-B and Nd-Dy-Fe-B spherical magnets with those of the corresponding single-phase magnets of the same volume and shape, the coercivity decreases in the following order: Dy
2Fe
14B > Dy
2Fe
14B/Nd
2Fe
14B > Nd
2Fe
14B/Dy
2Fe
14B > Nd
2Fe
14B > Nd
2Fe
14B/Ce
2Fe
14B > Ce
2Fe
14B/Nd
2Fe
14B > Ce
2Fe
14B.
Figure 7 presents the hysteresis loops of Nd-Ce-Fe-B spherical magnets with outer/inner diameters of 12 nm/15 nm, 30 nm/38 nm, 59 nm/74 nm, 79 nm/100 nm, 398 nm/500 nm, 400 nm/504 nm, and 406 nm/512 nm.
Figure 7a,b show the hysteresis loops of the Nd
2Fe
14B/Ce
2Fe
14B (NC) and Ce
2Fe
14B/Nd
2Fe
14B (CN) structures, respectively. For the Nd
2Fe
14B/Ce
2Fe
14B (NC) structure, the coercivities of NC-15, NC-38, NC-74, and NC-100 are 3.78 MA·m
−1, 2.59 MA·m
−1, 2.17 MA·m
−1, and 2.07 MA·m
−1, respectively, while those of NC-500, NC-504, and NC-512 are all 1.75 MA·m
−1. For the Ce
2Fe
14B/Nd
2Fe
14B (CN) structure, the coercivities of CN-15, CN-38, CN-74, and CN-100 are 3.72 MA·m
−1, 2.49 MA·m
−1, 1.97 MA·m
−1, and 1.83 MA·m
−1, respectively, and those of CN-500, CN-504, and CN-512 are all 1.61 MA·m
−1.
Figure 8 presents the hysteresis loops of Nd-Dy-Fe-B spherical magnets with outer/inner diameters of 12 nm/15 nm, 59 nm/74 nm, 398 nm/500 nm, and 406 nm/512 nm.
Figure 8a,b show the hysteresis loops of the Dy
2Fe
14B/Nd
2Fe
14B (DN) and Nd
2Fe
14B/Dy
2Fe
14B (ND) structures, respectively. For the Dy
2Fe
14B/Nd
2Fe
14B (DN) structure, the coercivities of DN-15, DN-74, DN-500, and DN-512 are 7.15 MA·m
−1, 5.49 MA·m
−1, 4.94 MA·m
−1, and 4.94 MA·m
−1, respectively. For the Nd
2Fe
14B/Dy
2Fe
14B (ND) structure, the coercivities of ND-15, ND-74, ND-500, and ND-512 are 7.15 MA·m
−1, 4.96 MA·m
−1, 4.28 MA·m
−1, and 4.28 MA·m
−1, respectively.
To elucidate the influence of the main phase distribution and volume on the coercivity, the coercivity values of biphasic Nd-Ce-Fe-B and Nd-Dy-Fe-B spherical magnets are presented in
Figure 9.
Figure 9a,b correspond to the Nd-Ce-Fe-B and Nd-Dy-Fe-B spherical magnets, respectively. As shown in
Figure 9, for the spherical biphasic Nd-Ce-Fe-B and Nd-Dy-Fe-B magnets corresponding to the model in
Figure 1b, when the main phase with a larger magnetocrystalline anisotropy field surrounds the phase with a smaller anisotropy field, such as Nd
2Fe
14B/Ce
2Fe
14B (NC) or Dy
2Fe
14B/Nd
2Fe
14B (DN), the coercivity is higher compared with configurations where the phase positions are reversed, i.e., Ce
2Fe
14B/Nd
2Fe
14B (CN) or Nd
2Fe
14B/Dy
2Fe
14B (ND). This difference is small for small volumes but becomes more pronounced as the volume increases. Moreover, when the volume reaches a certain size, the coercivity of all magnets saturates and no longer changes. These qualitative findings are consistent with the conclusions drawn from the cubic model biphasic Nd-Ce-Fe-B magnets in
Figure 1a. This conclusion provides theoretical guidance for the structural design of high-coercivity rare earth permanent magnets in both experimental studies and industrial production.
