

Natural Sunlight Driven Photocatalytic Degradation of Methylene Blue and Rhodamine B over Nanocrystalline Zn2SnO4/SnO2

 ,
,  , , ,
, , ,  ,
,
Abstract

1. Introduction
2. Materials and Methods
3. Results and Discussion
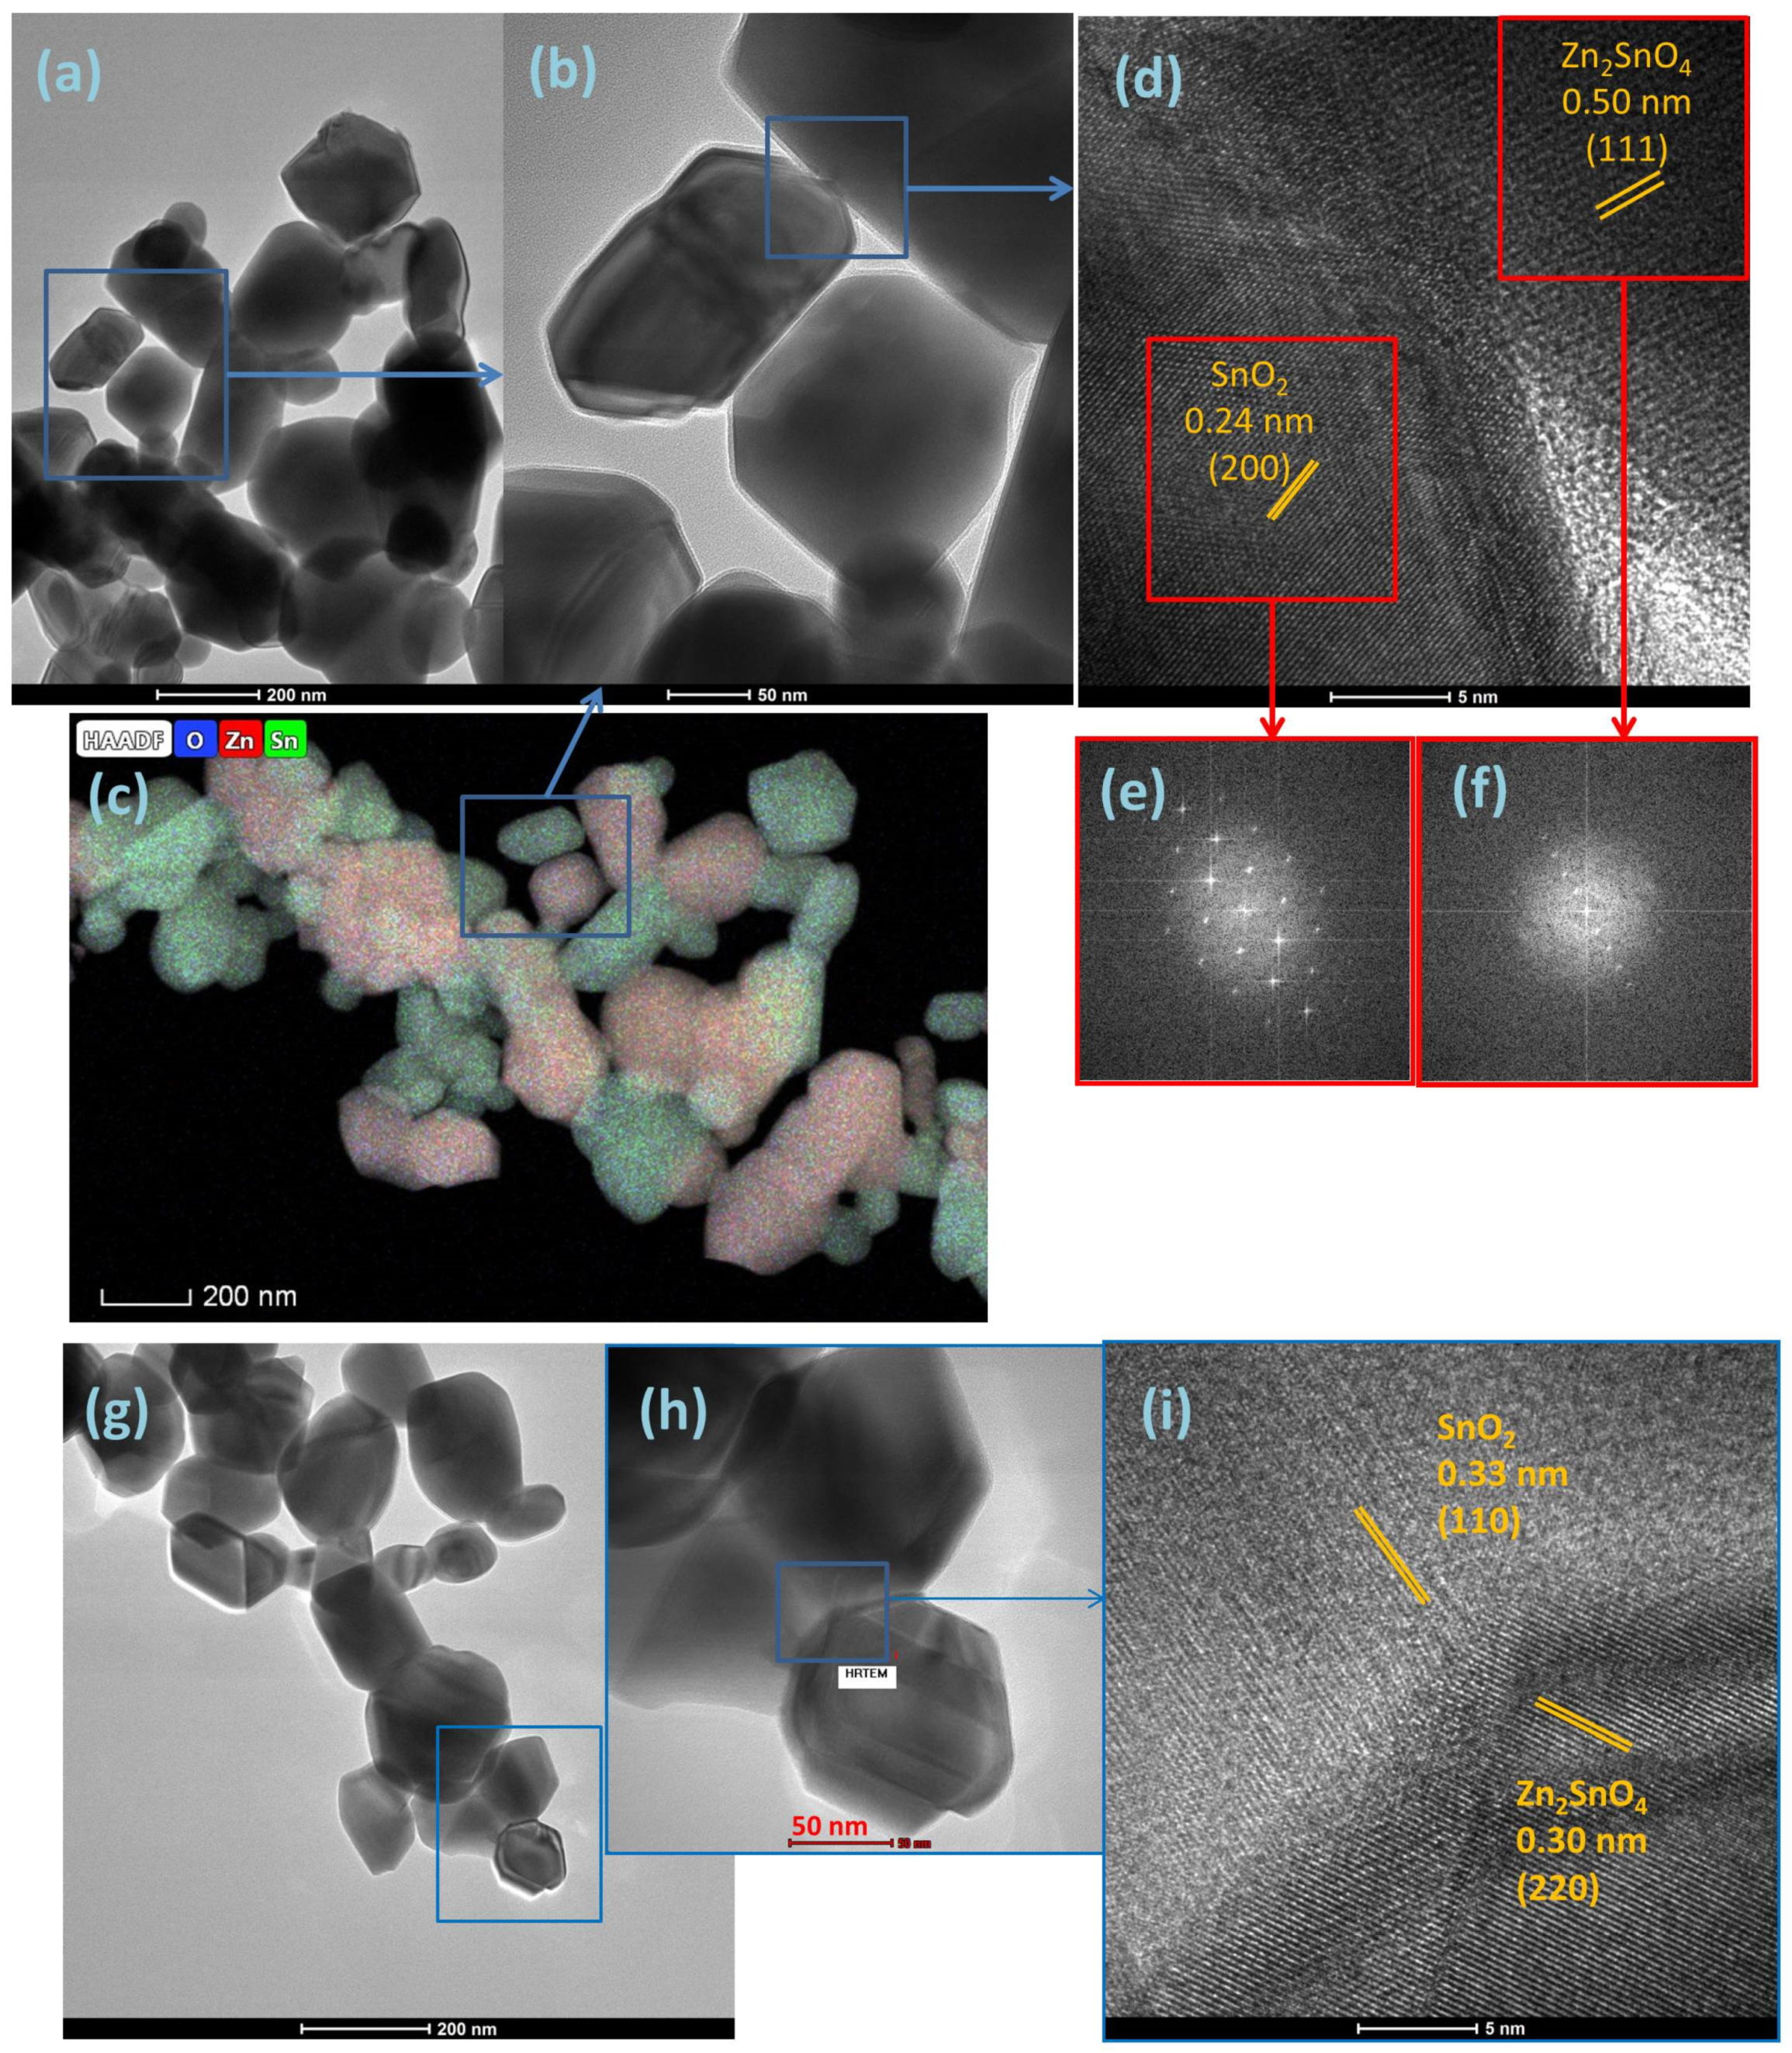
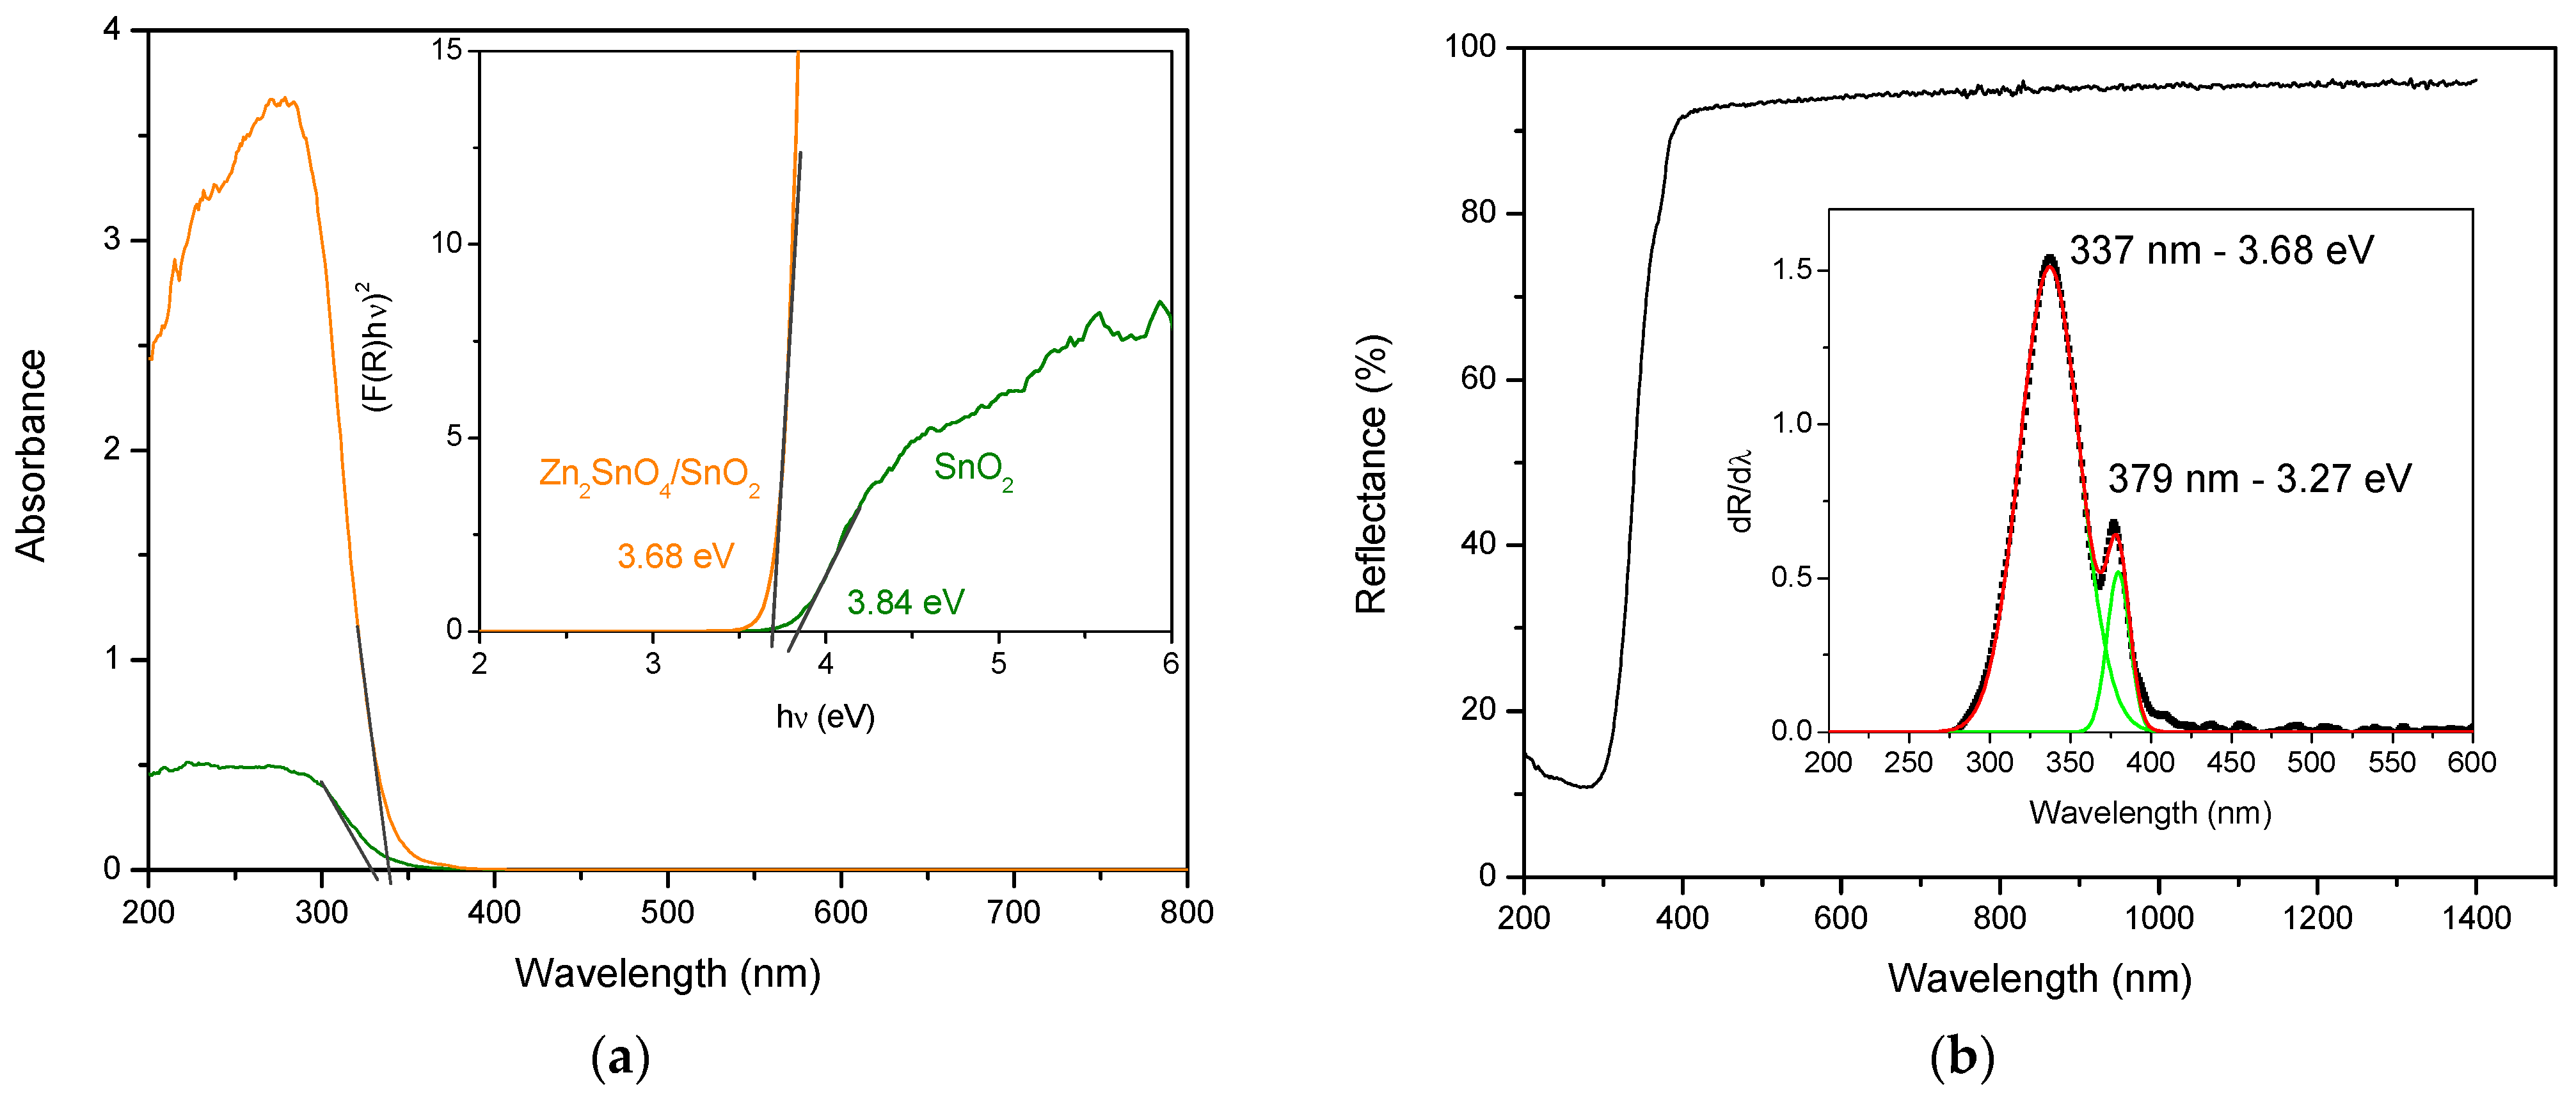
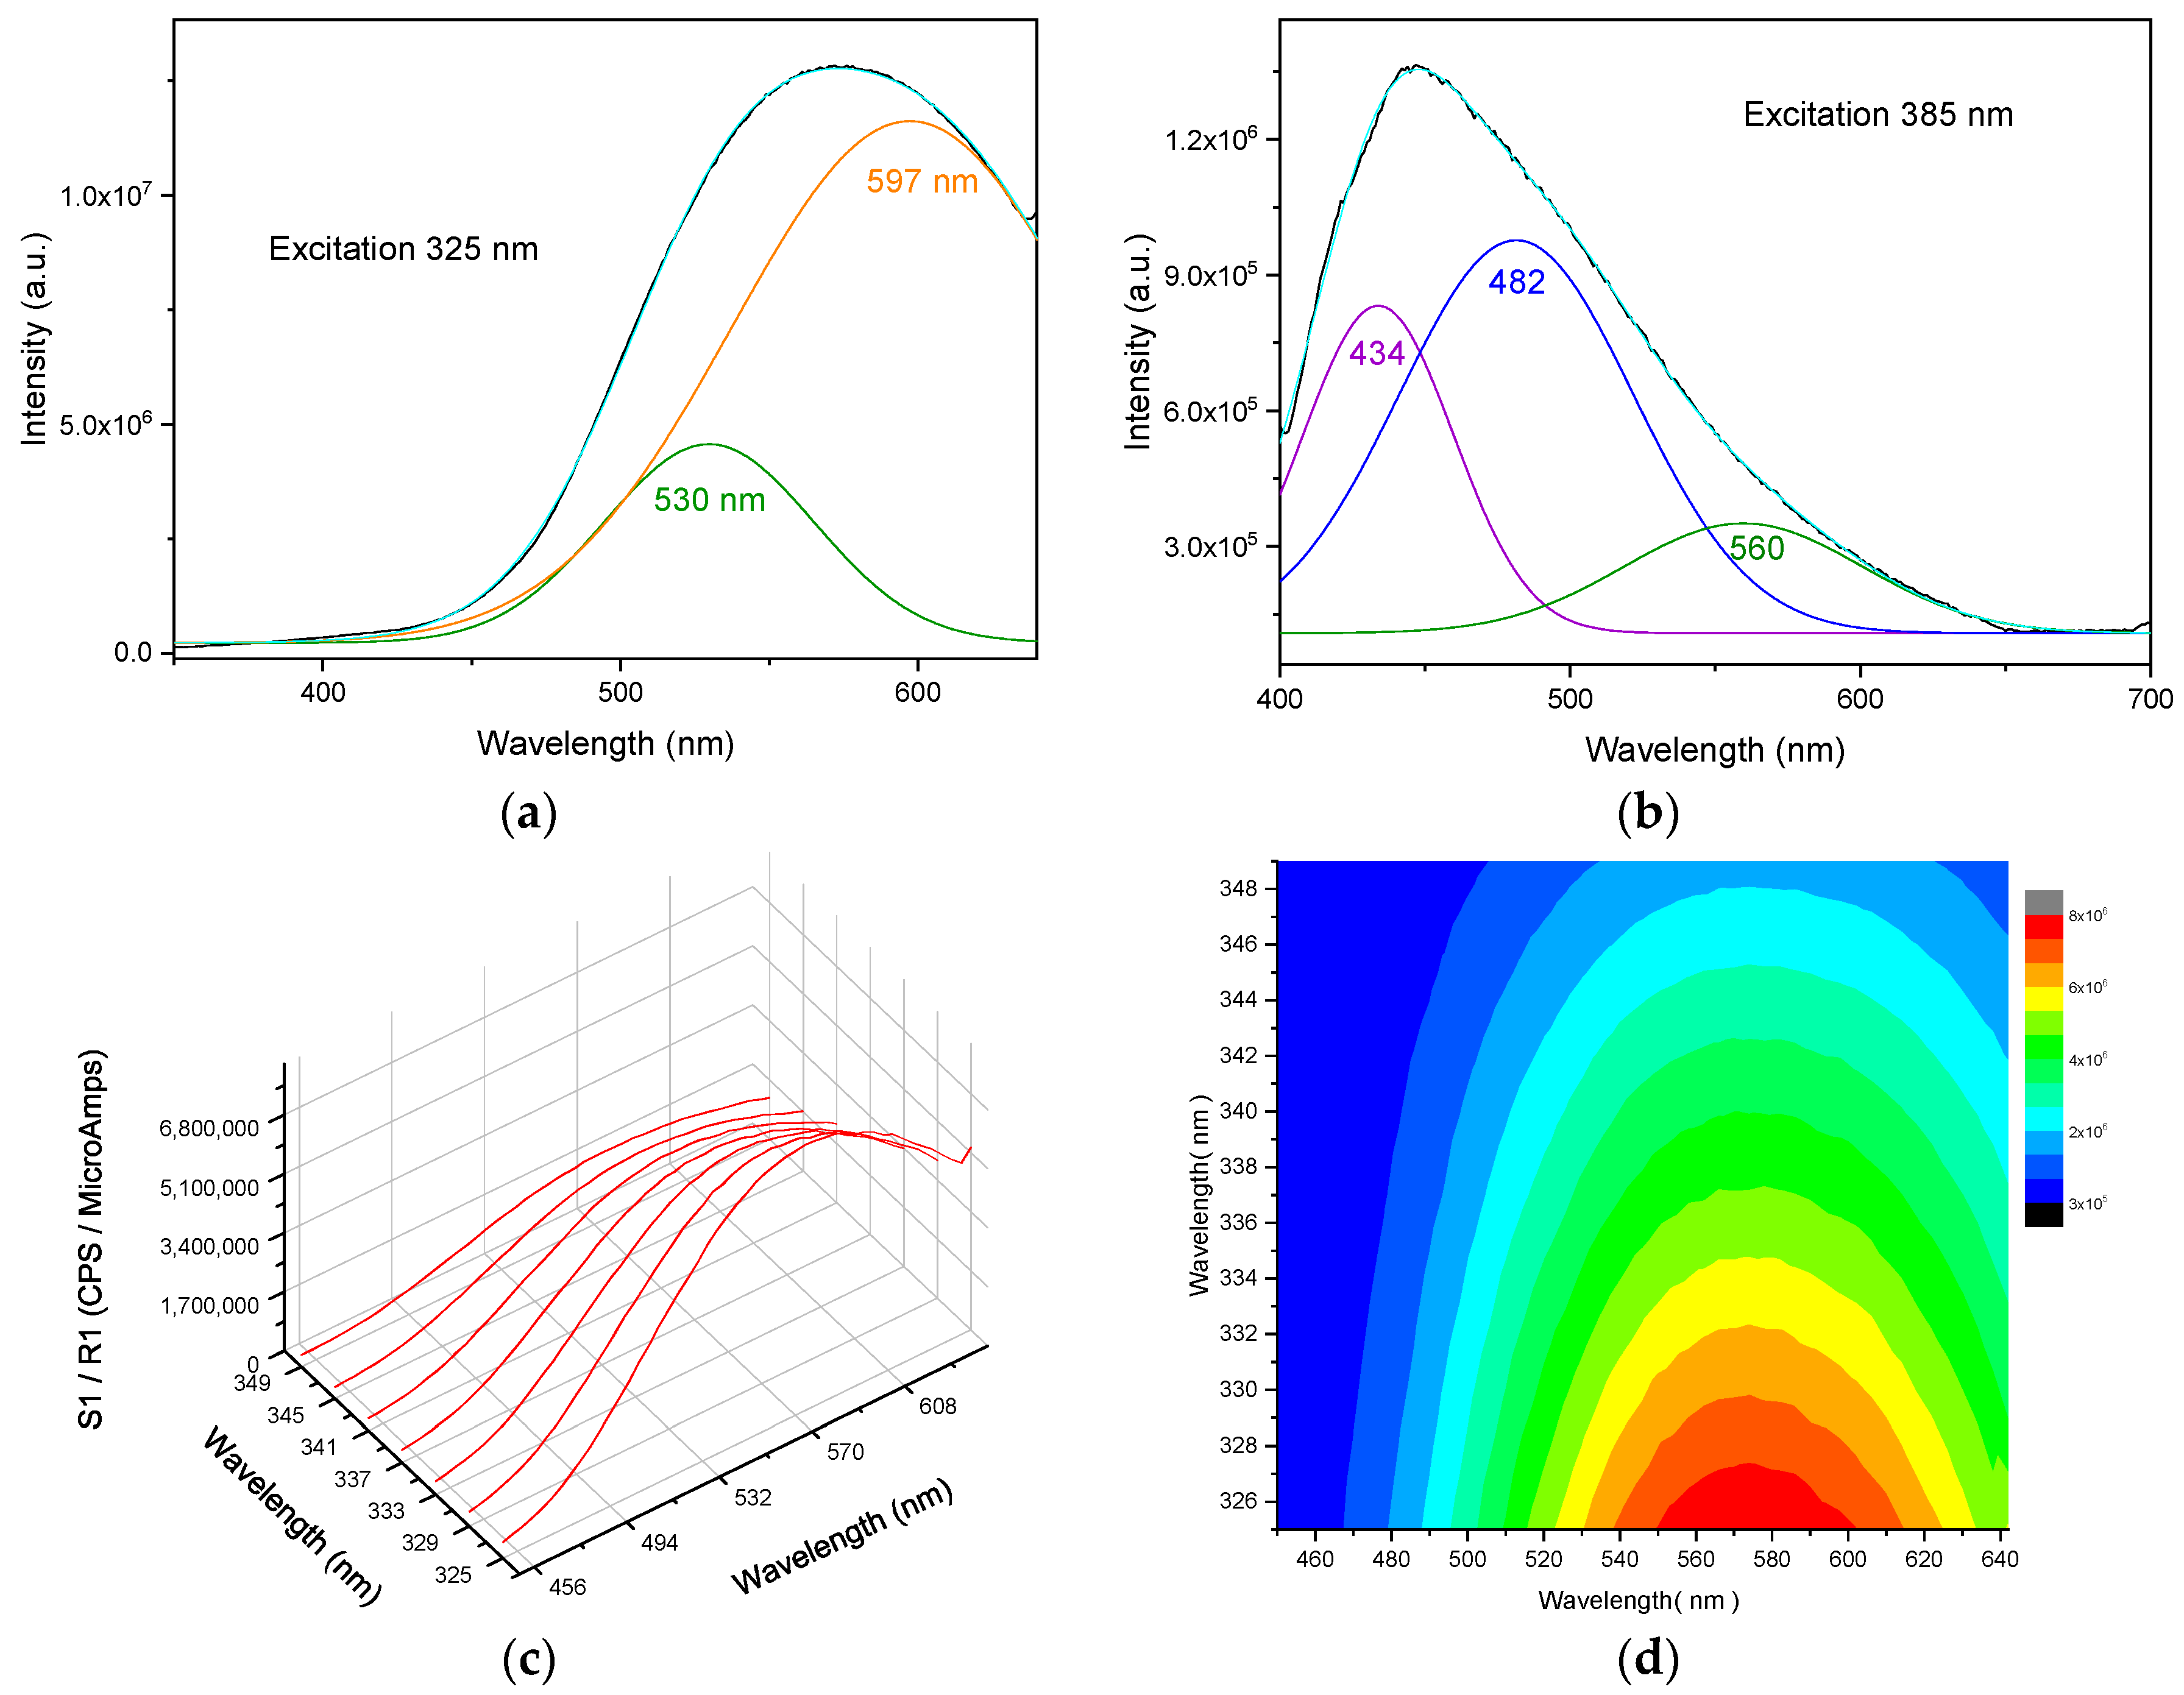
3.1. Structure, Morphology, and Optical Properties
3.2. Photodegradation of Dye in Natural Sunlight
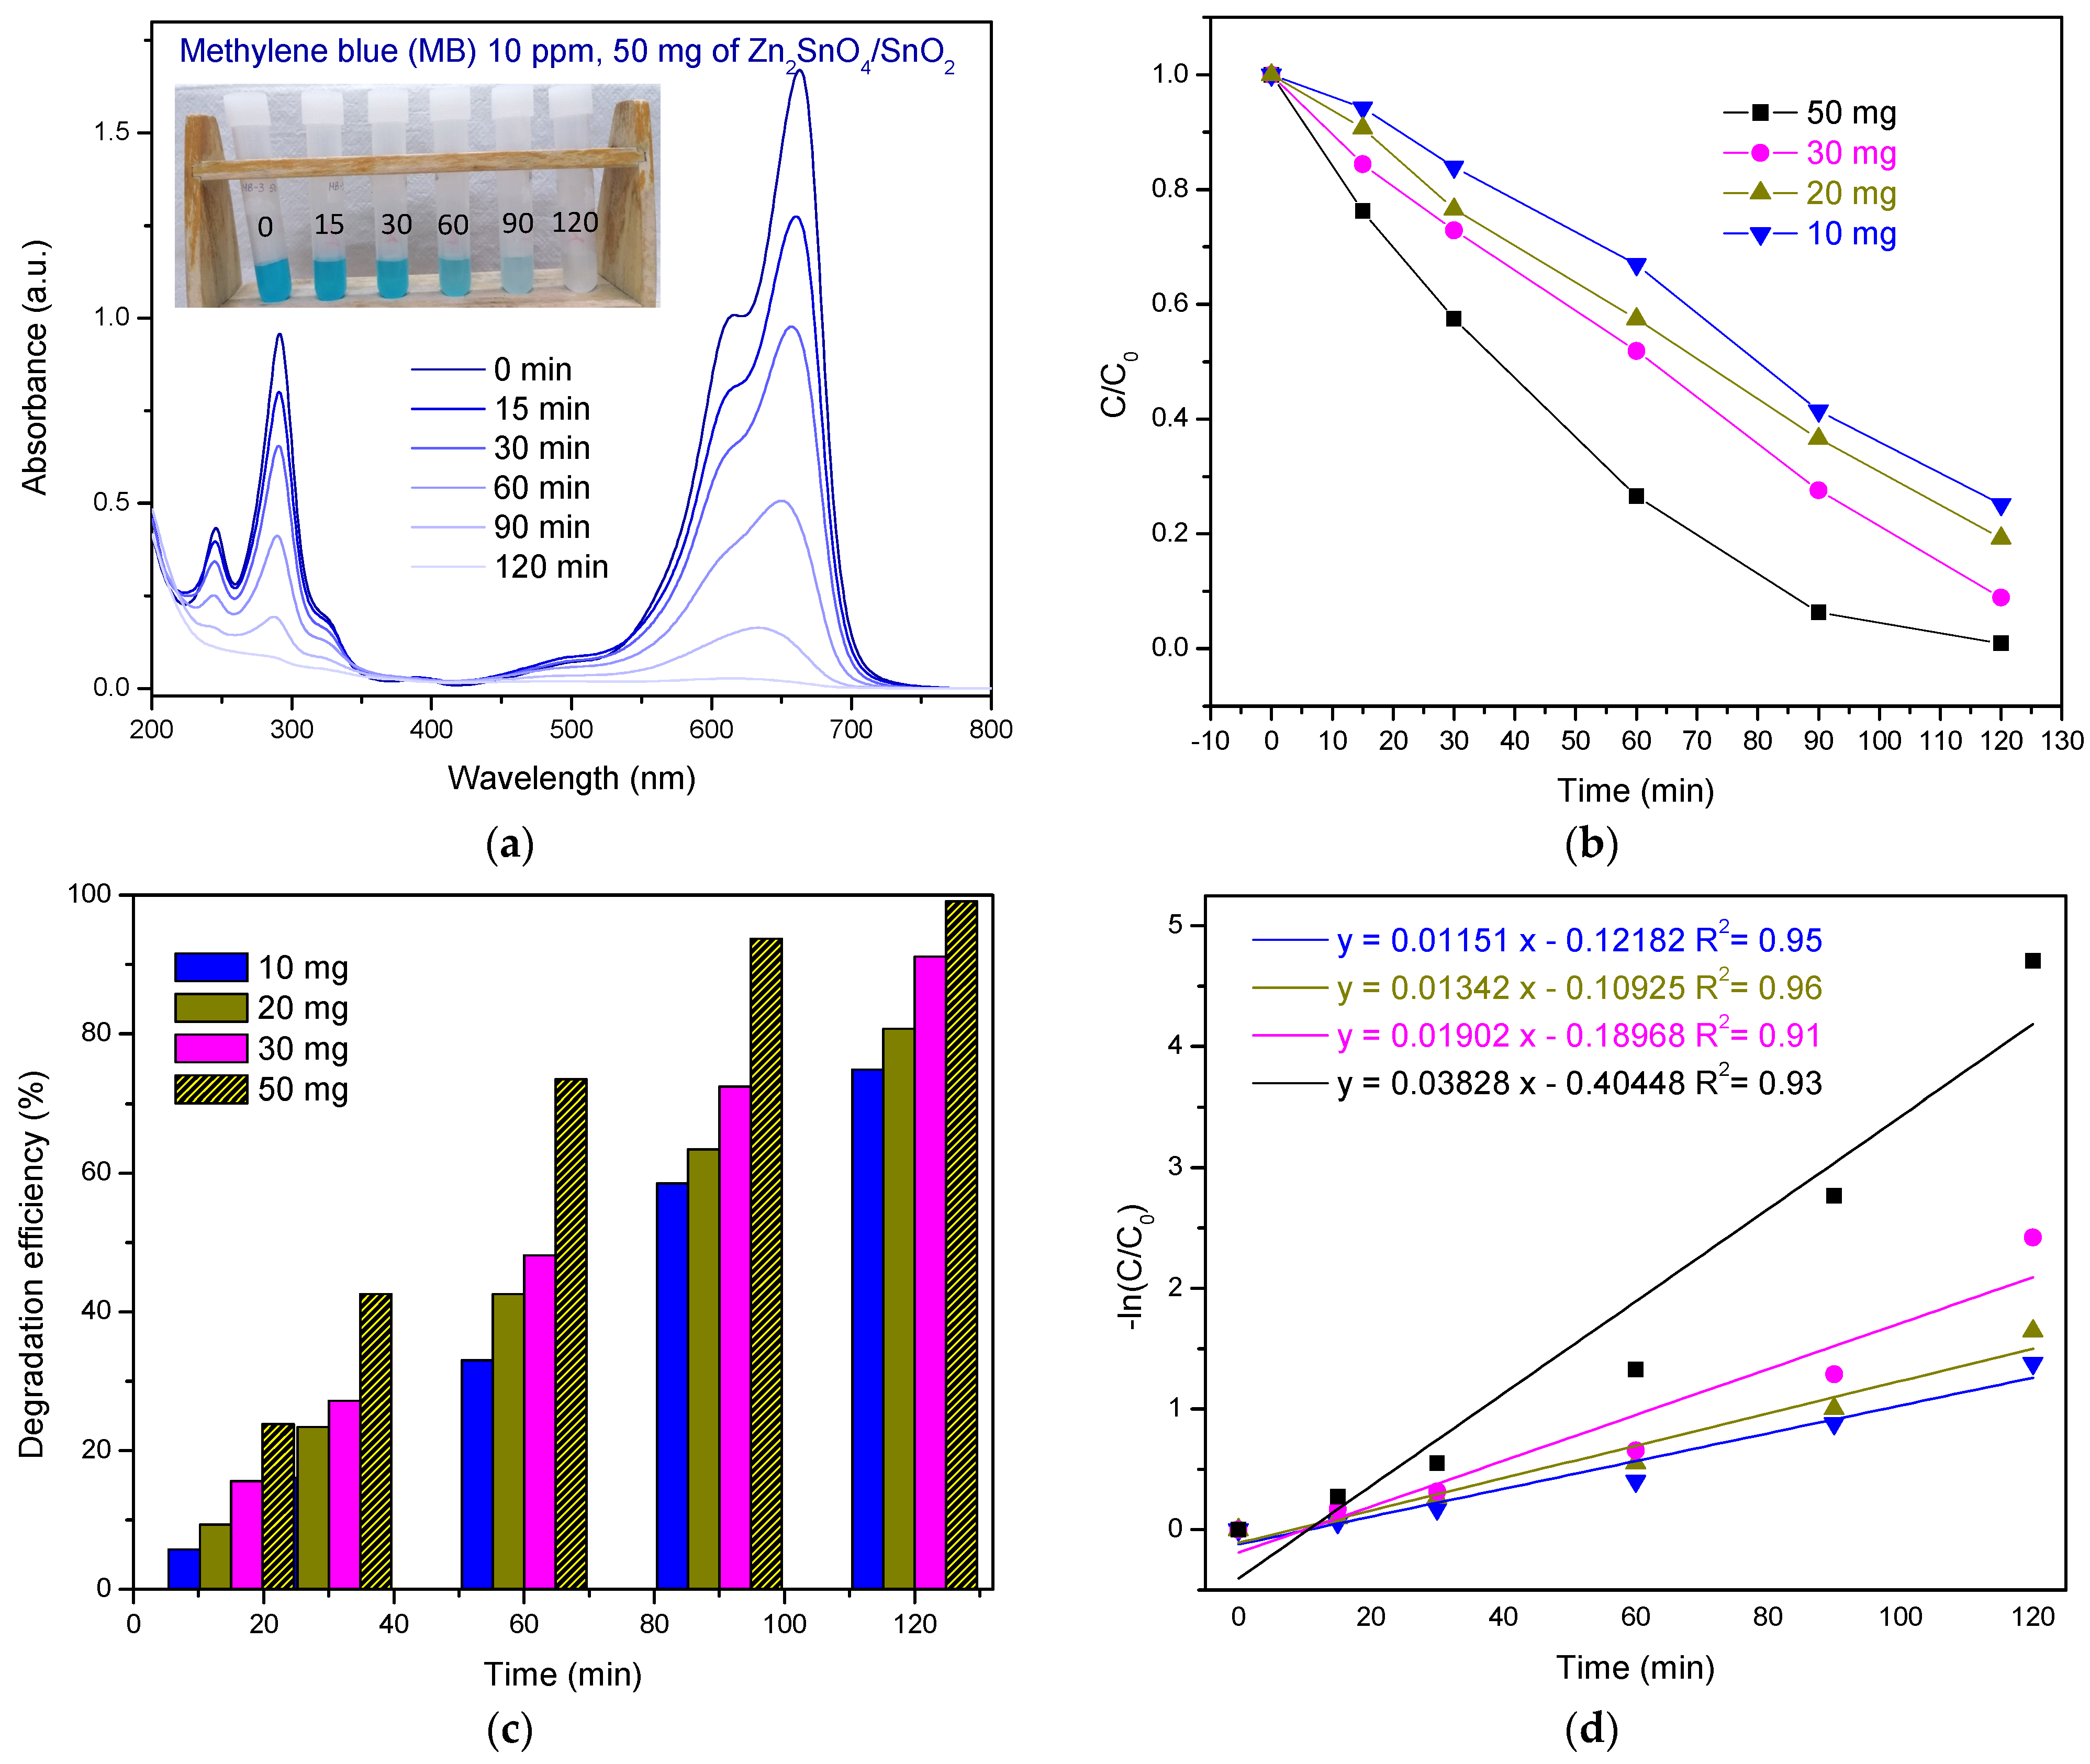
3.2.1. Photodegradation of MB
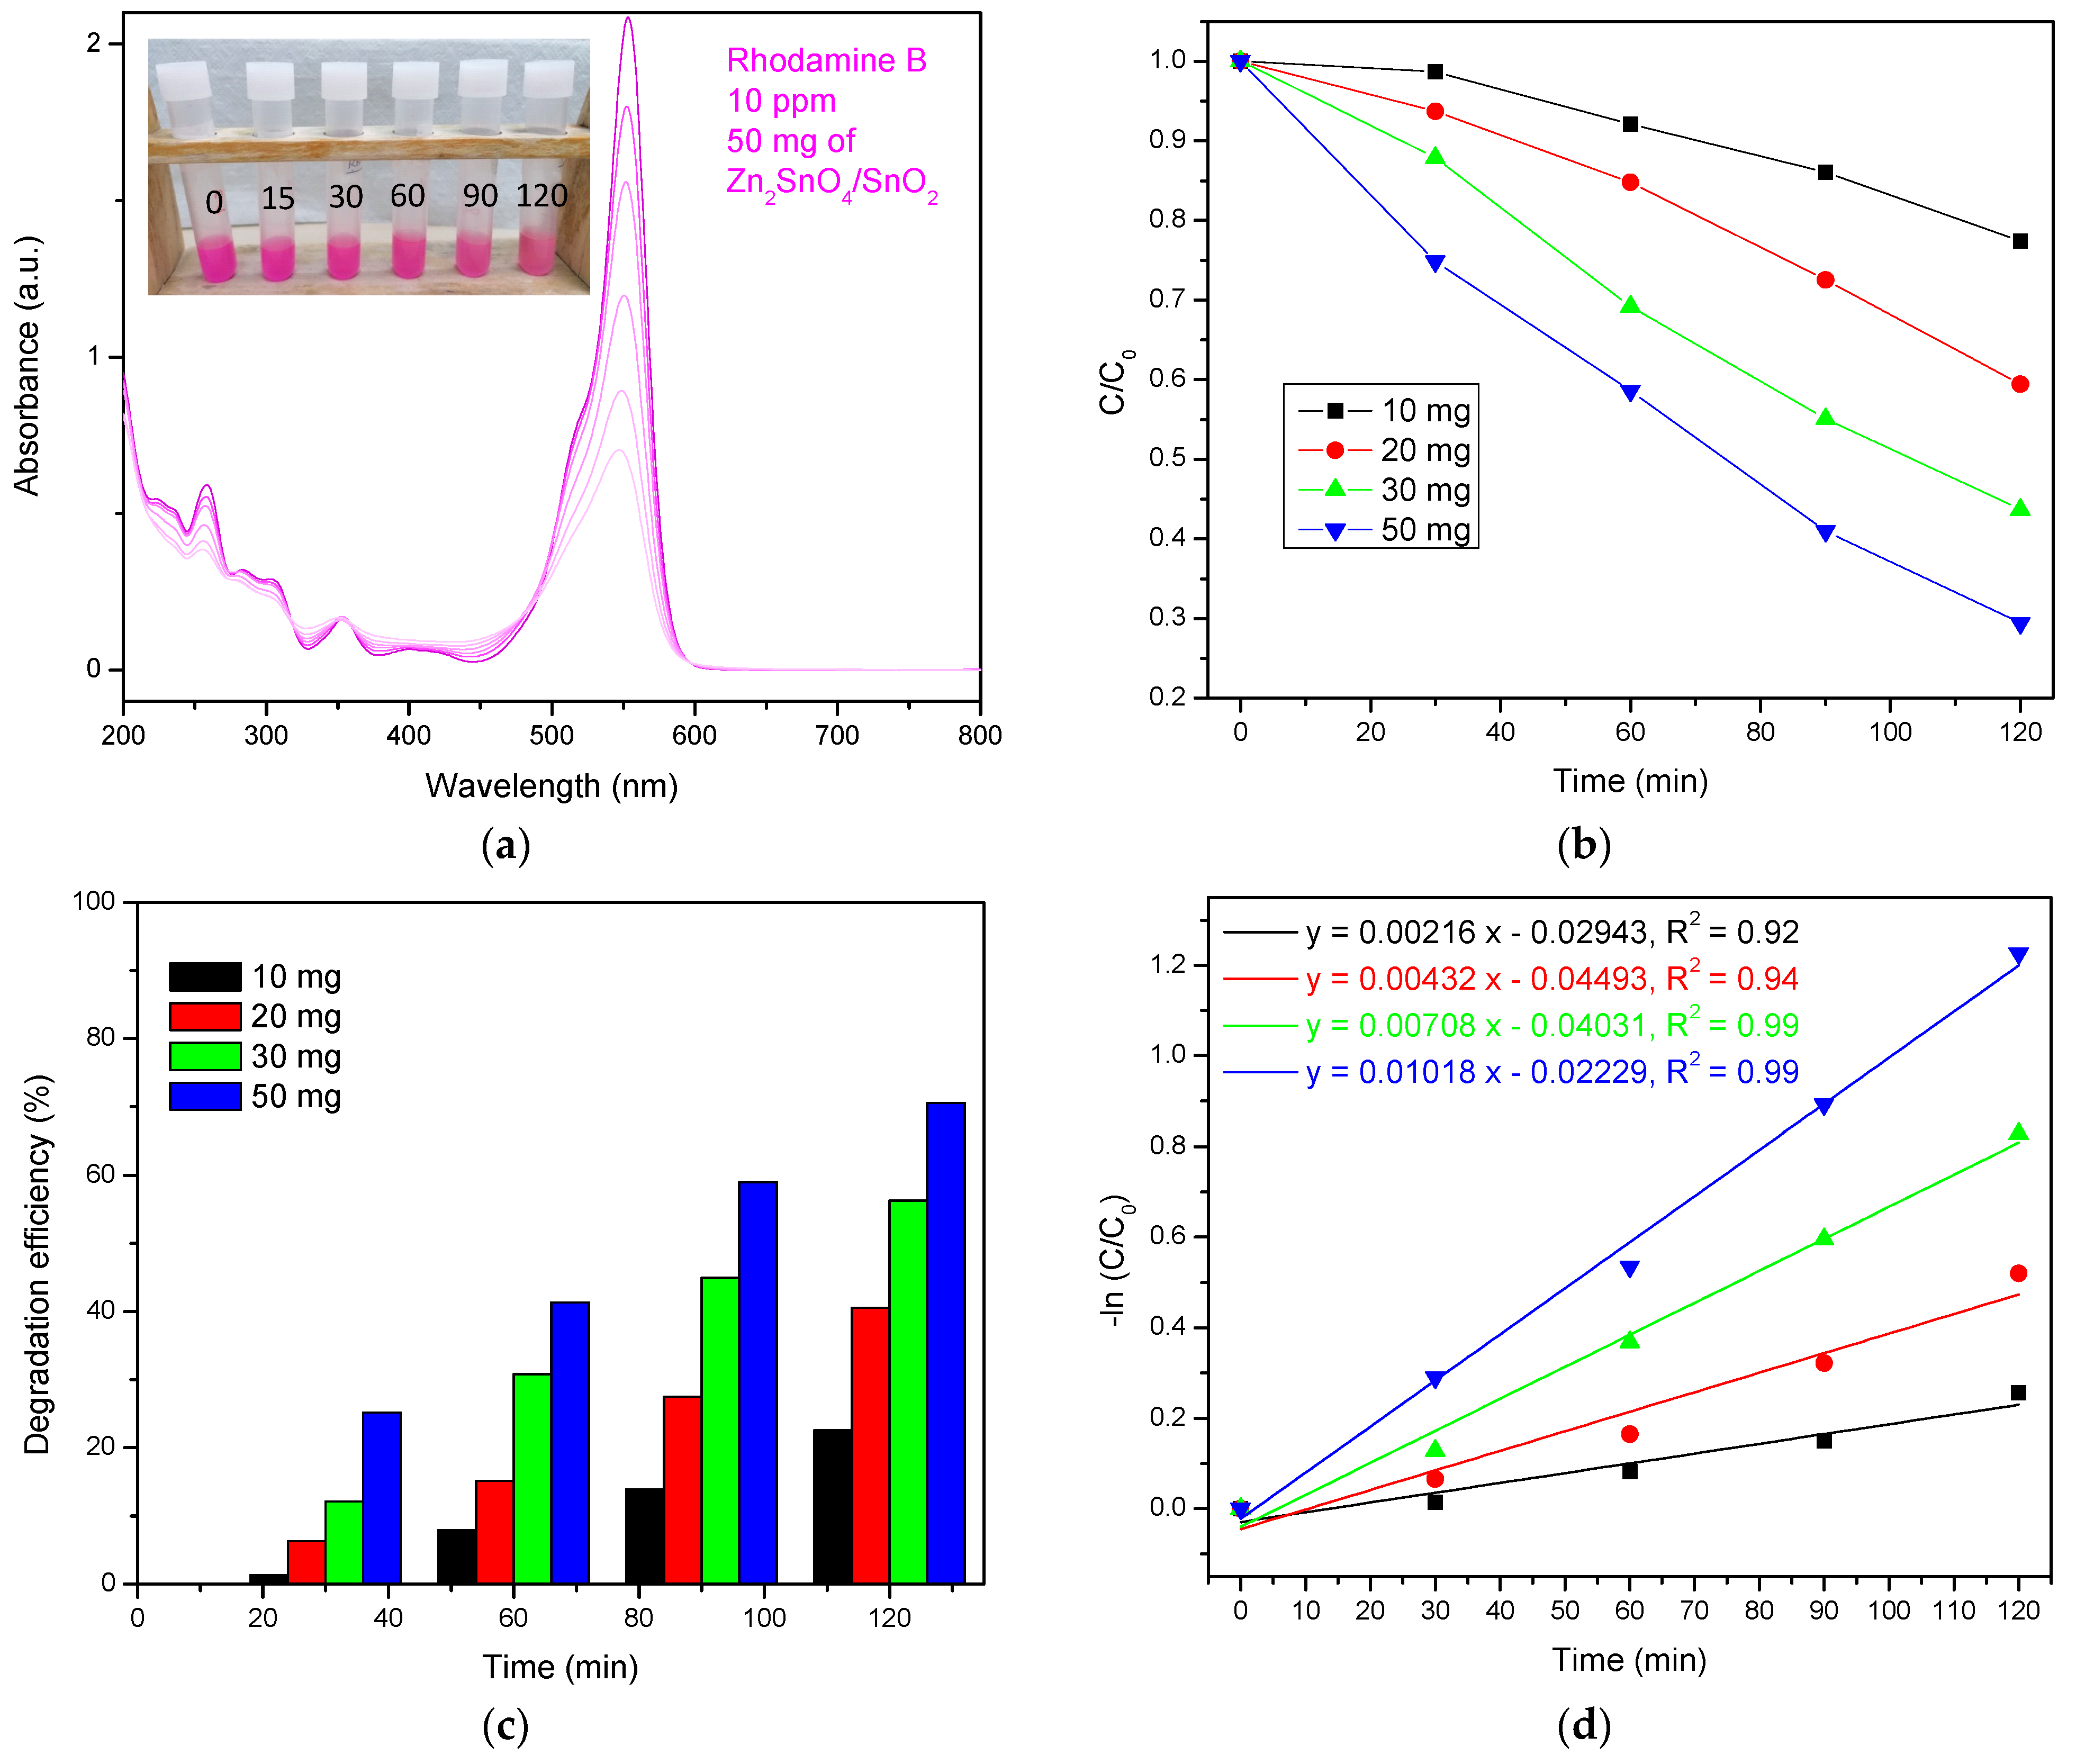
3.2.2. Photodegradation of RhB
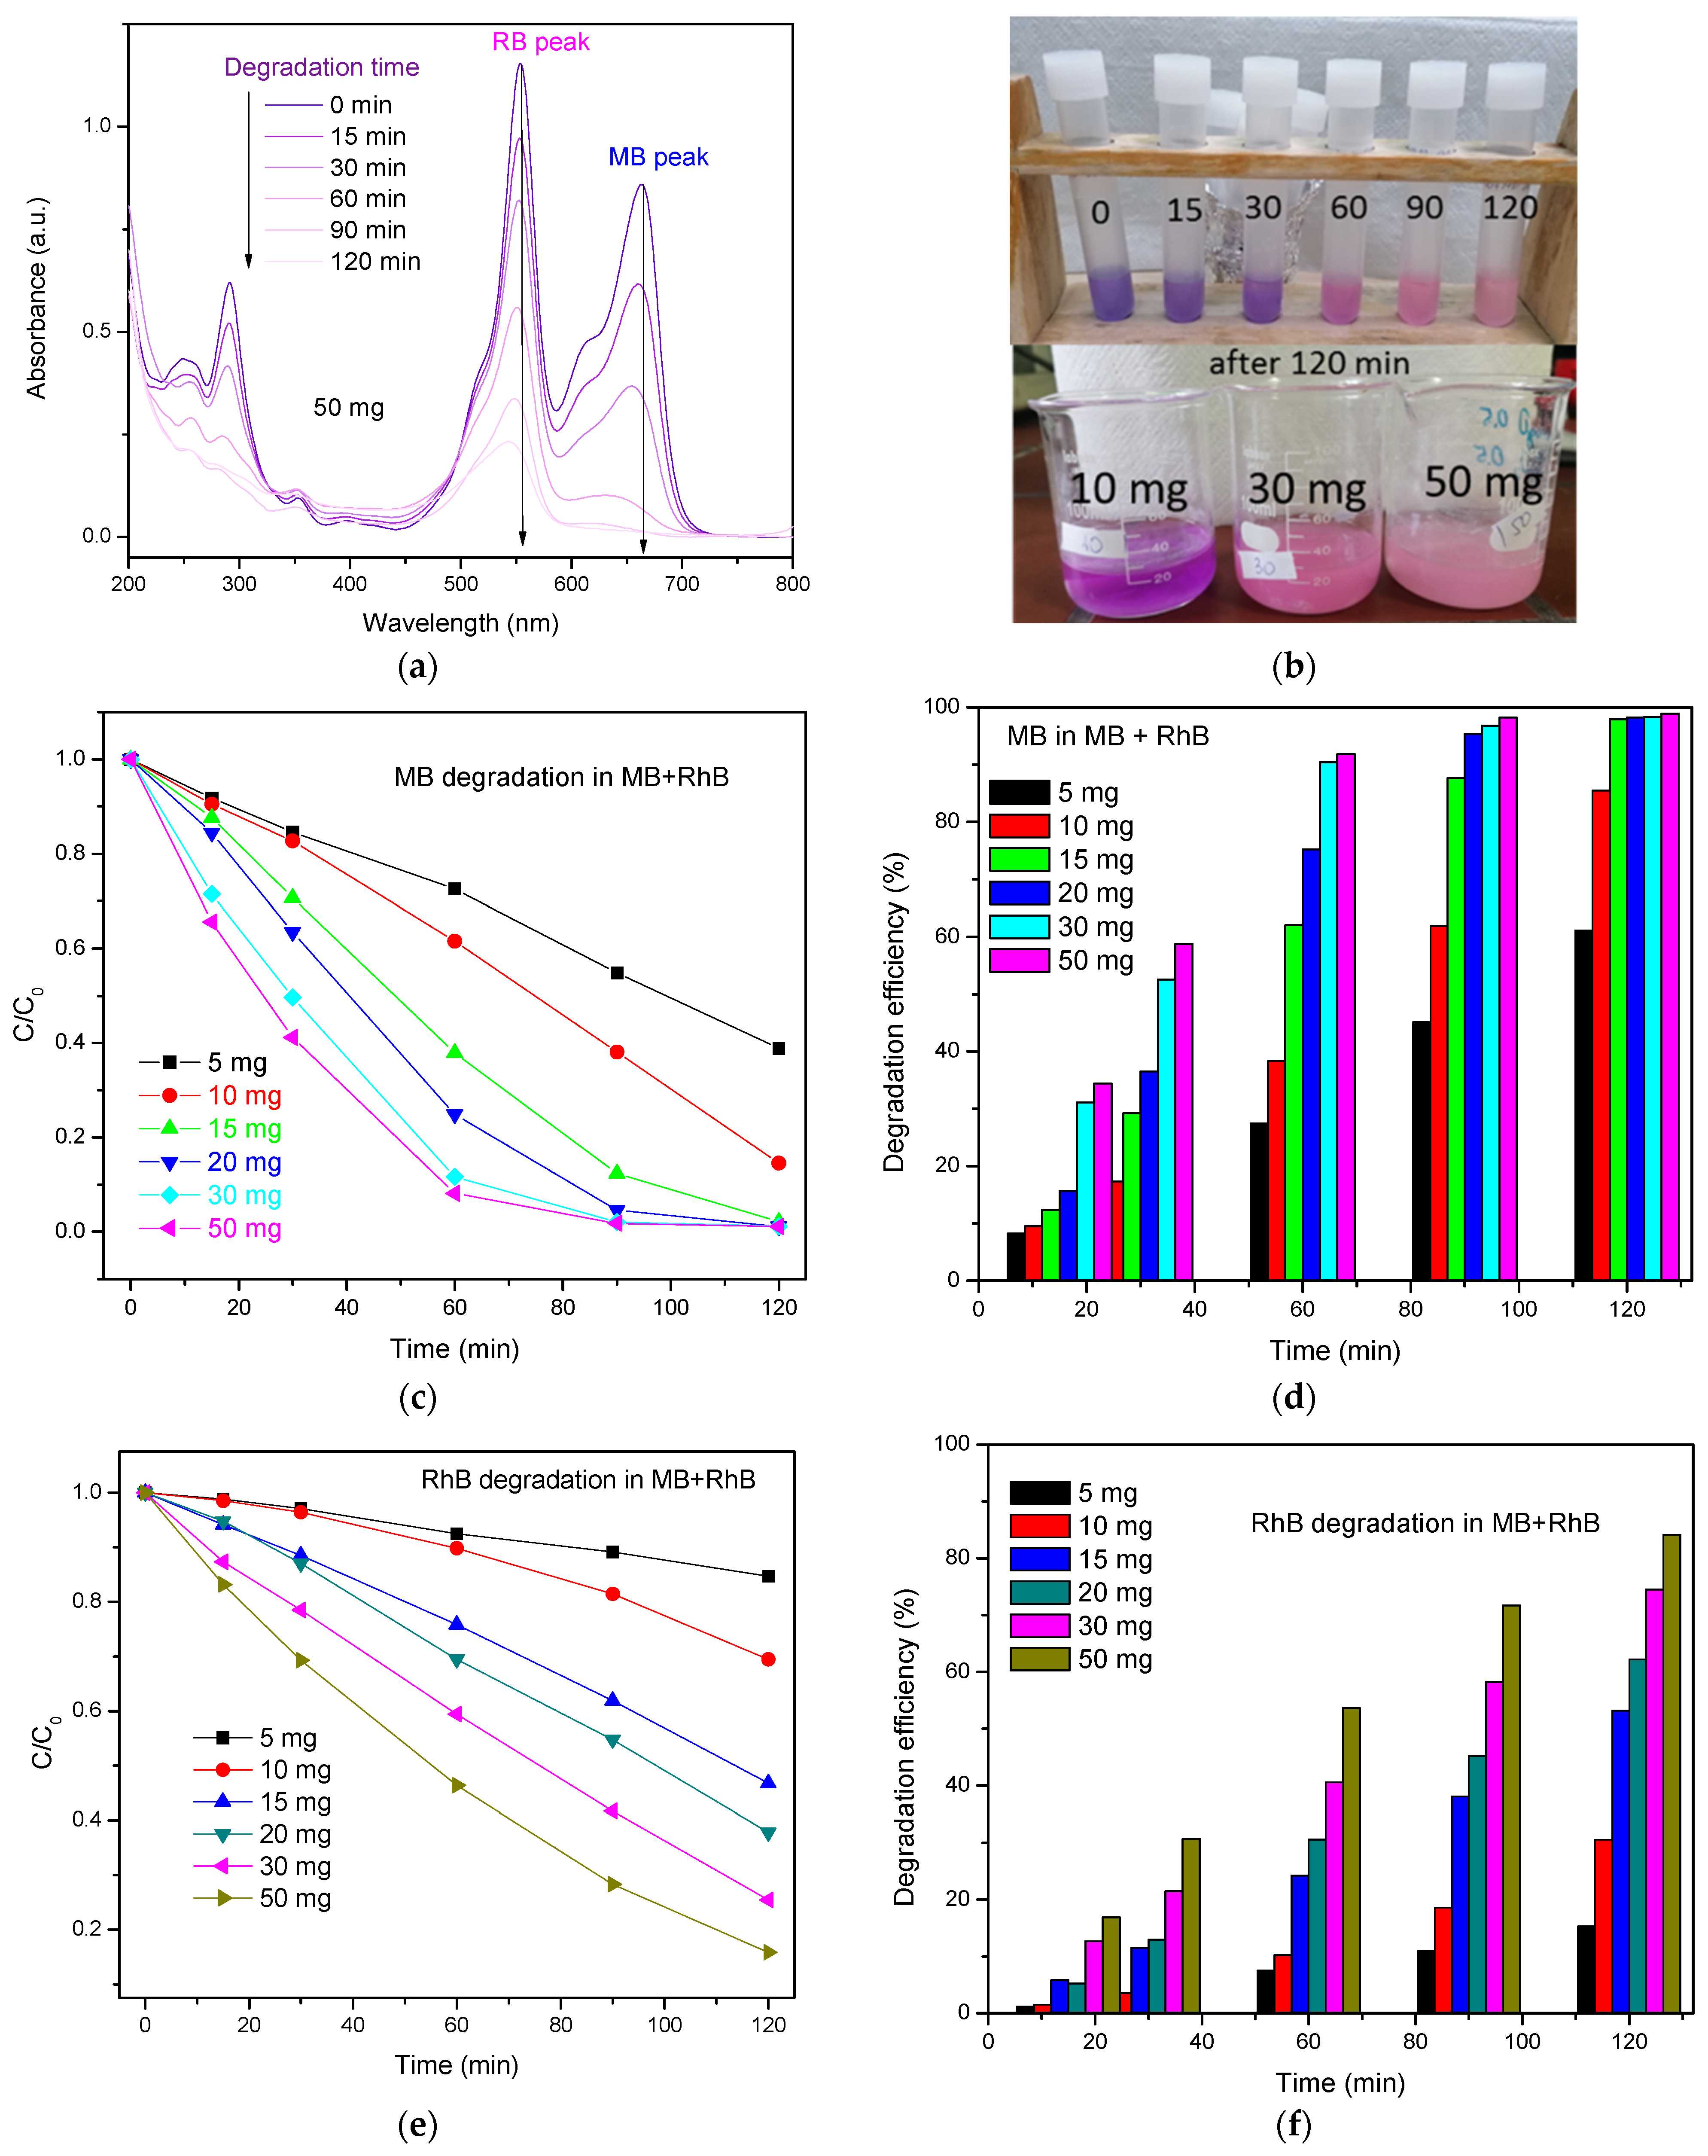
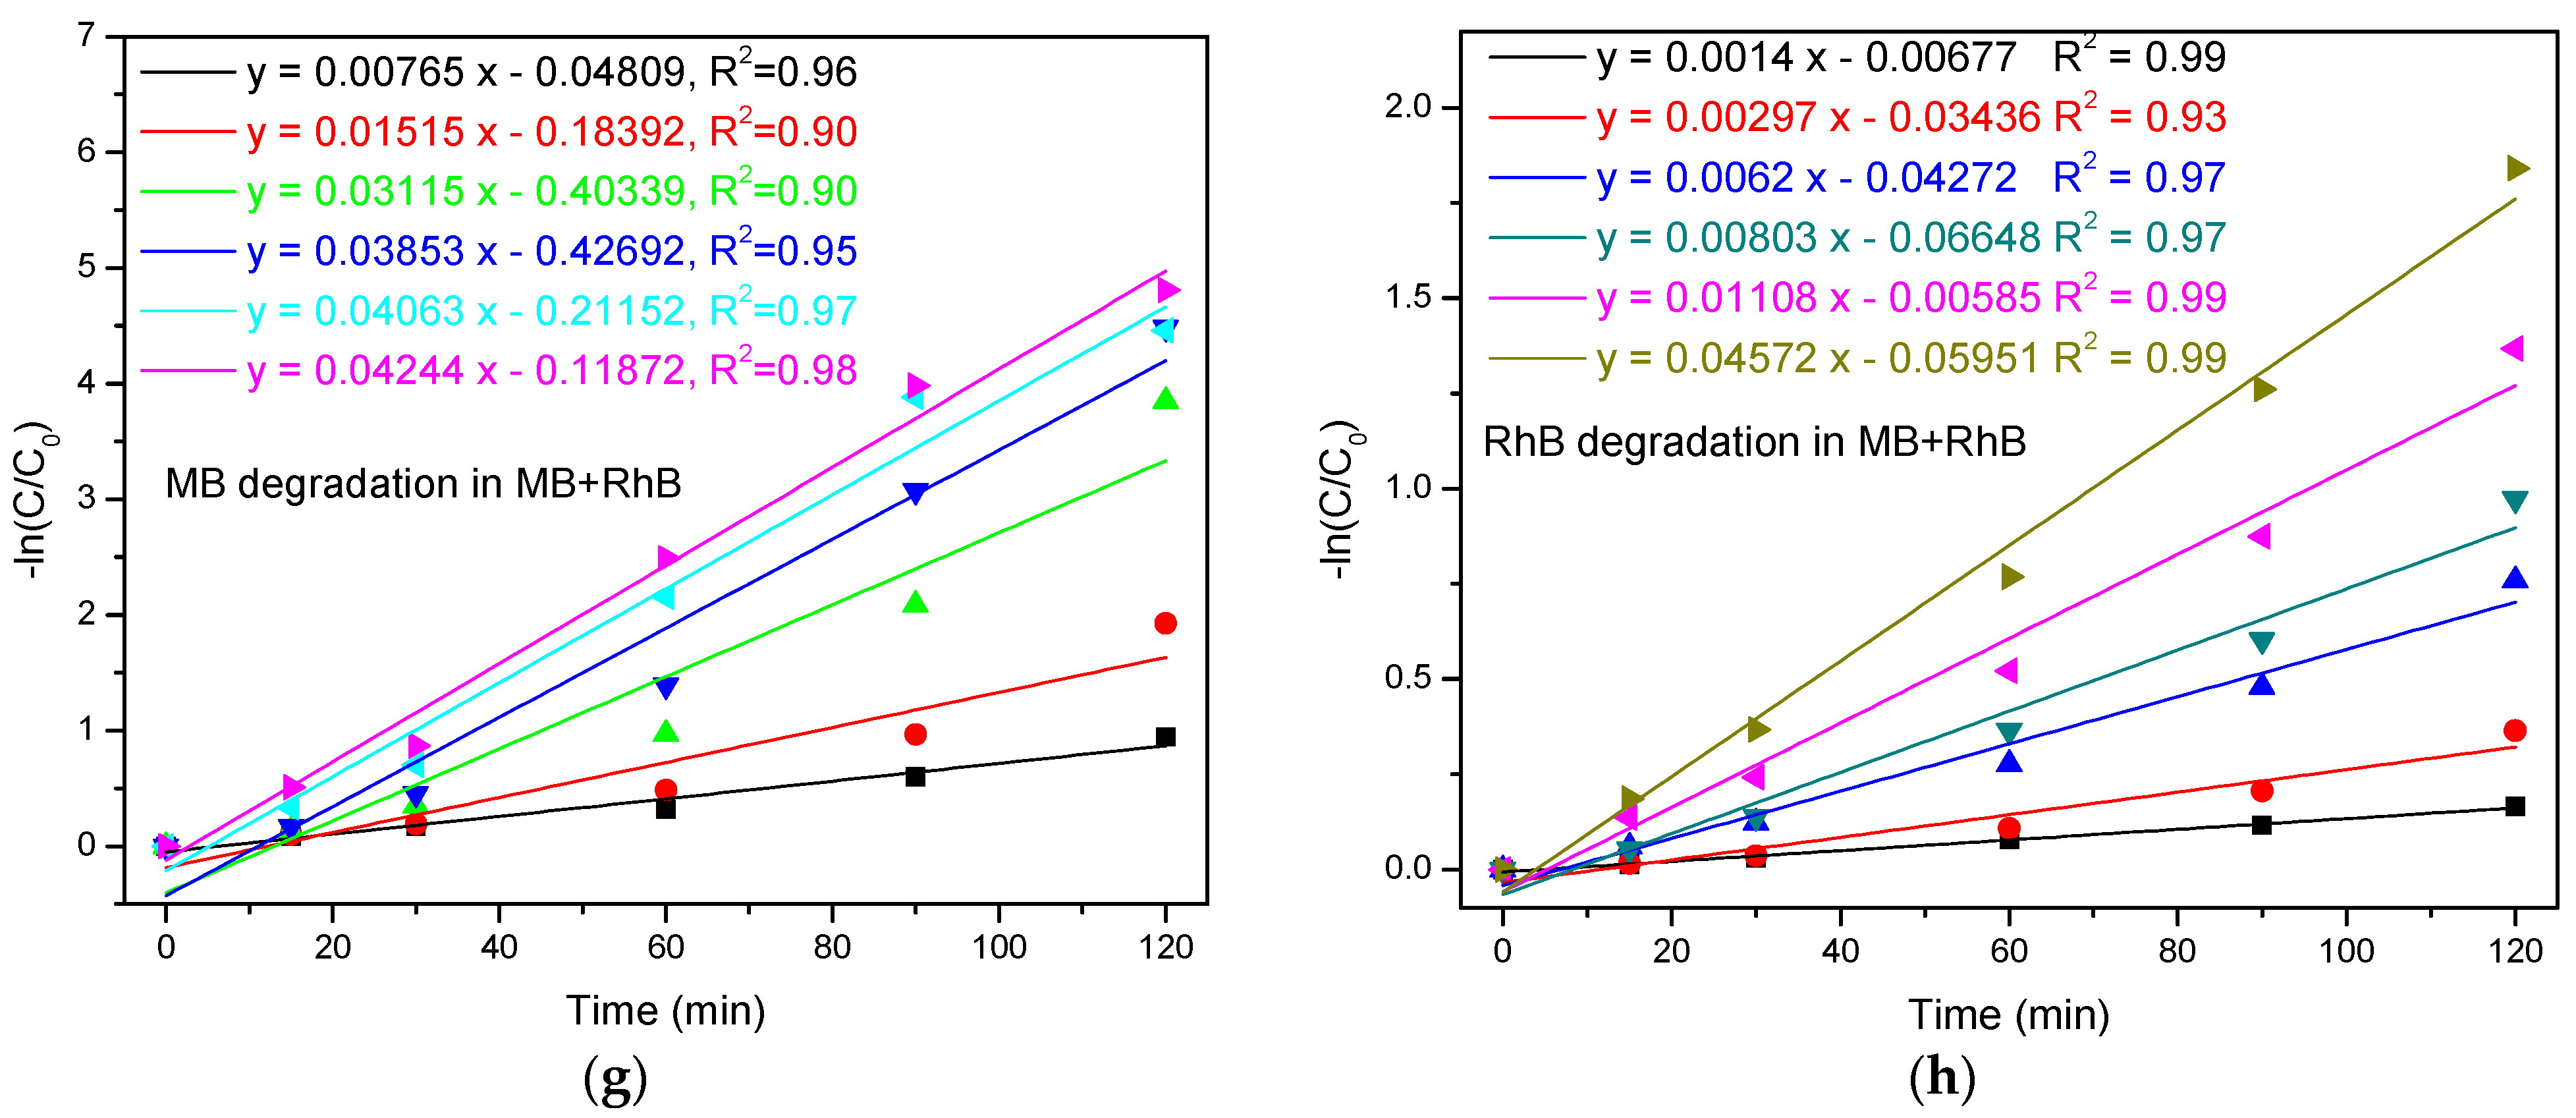
3.2.3. Photodegradation of MB+RhB
3.2.4. Zn2SnO4/SnO2 Pollutant Degradation Mechanism
3.3. MS Analysis—Degradation Mechanism
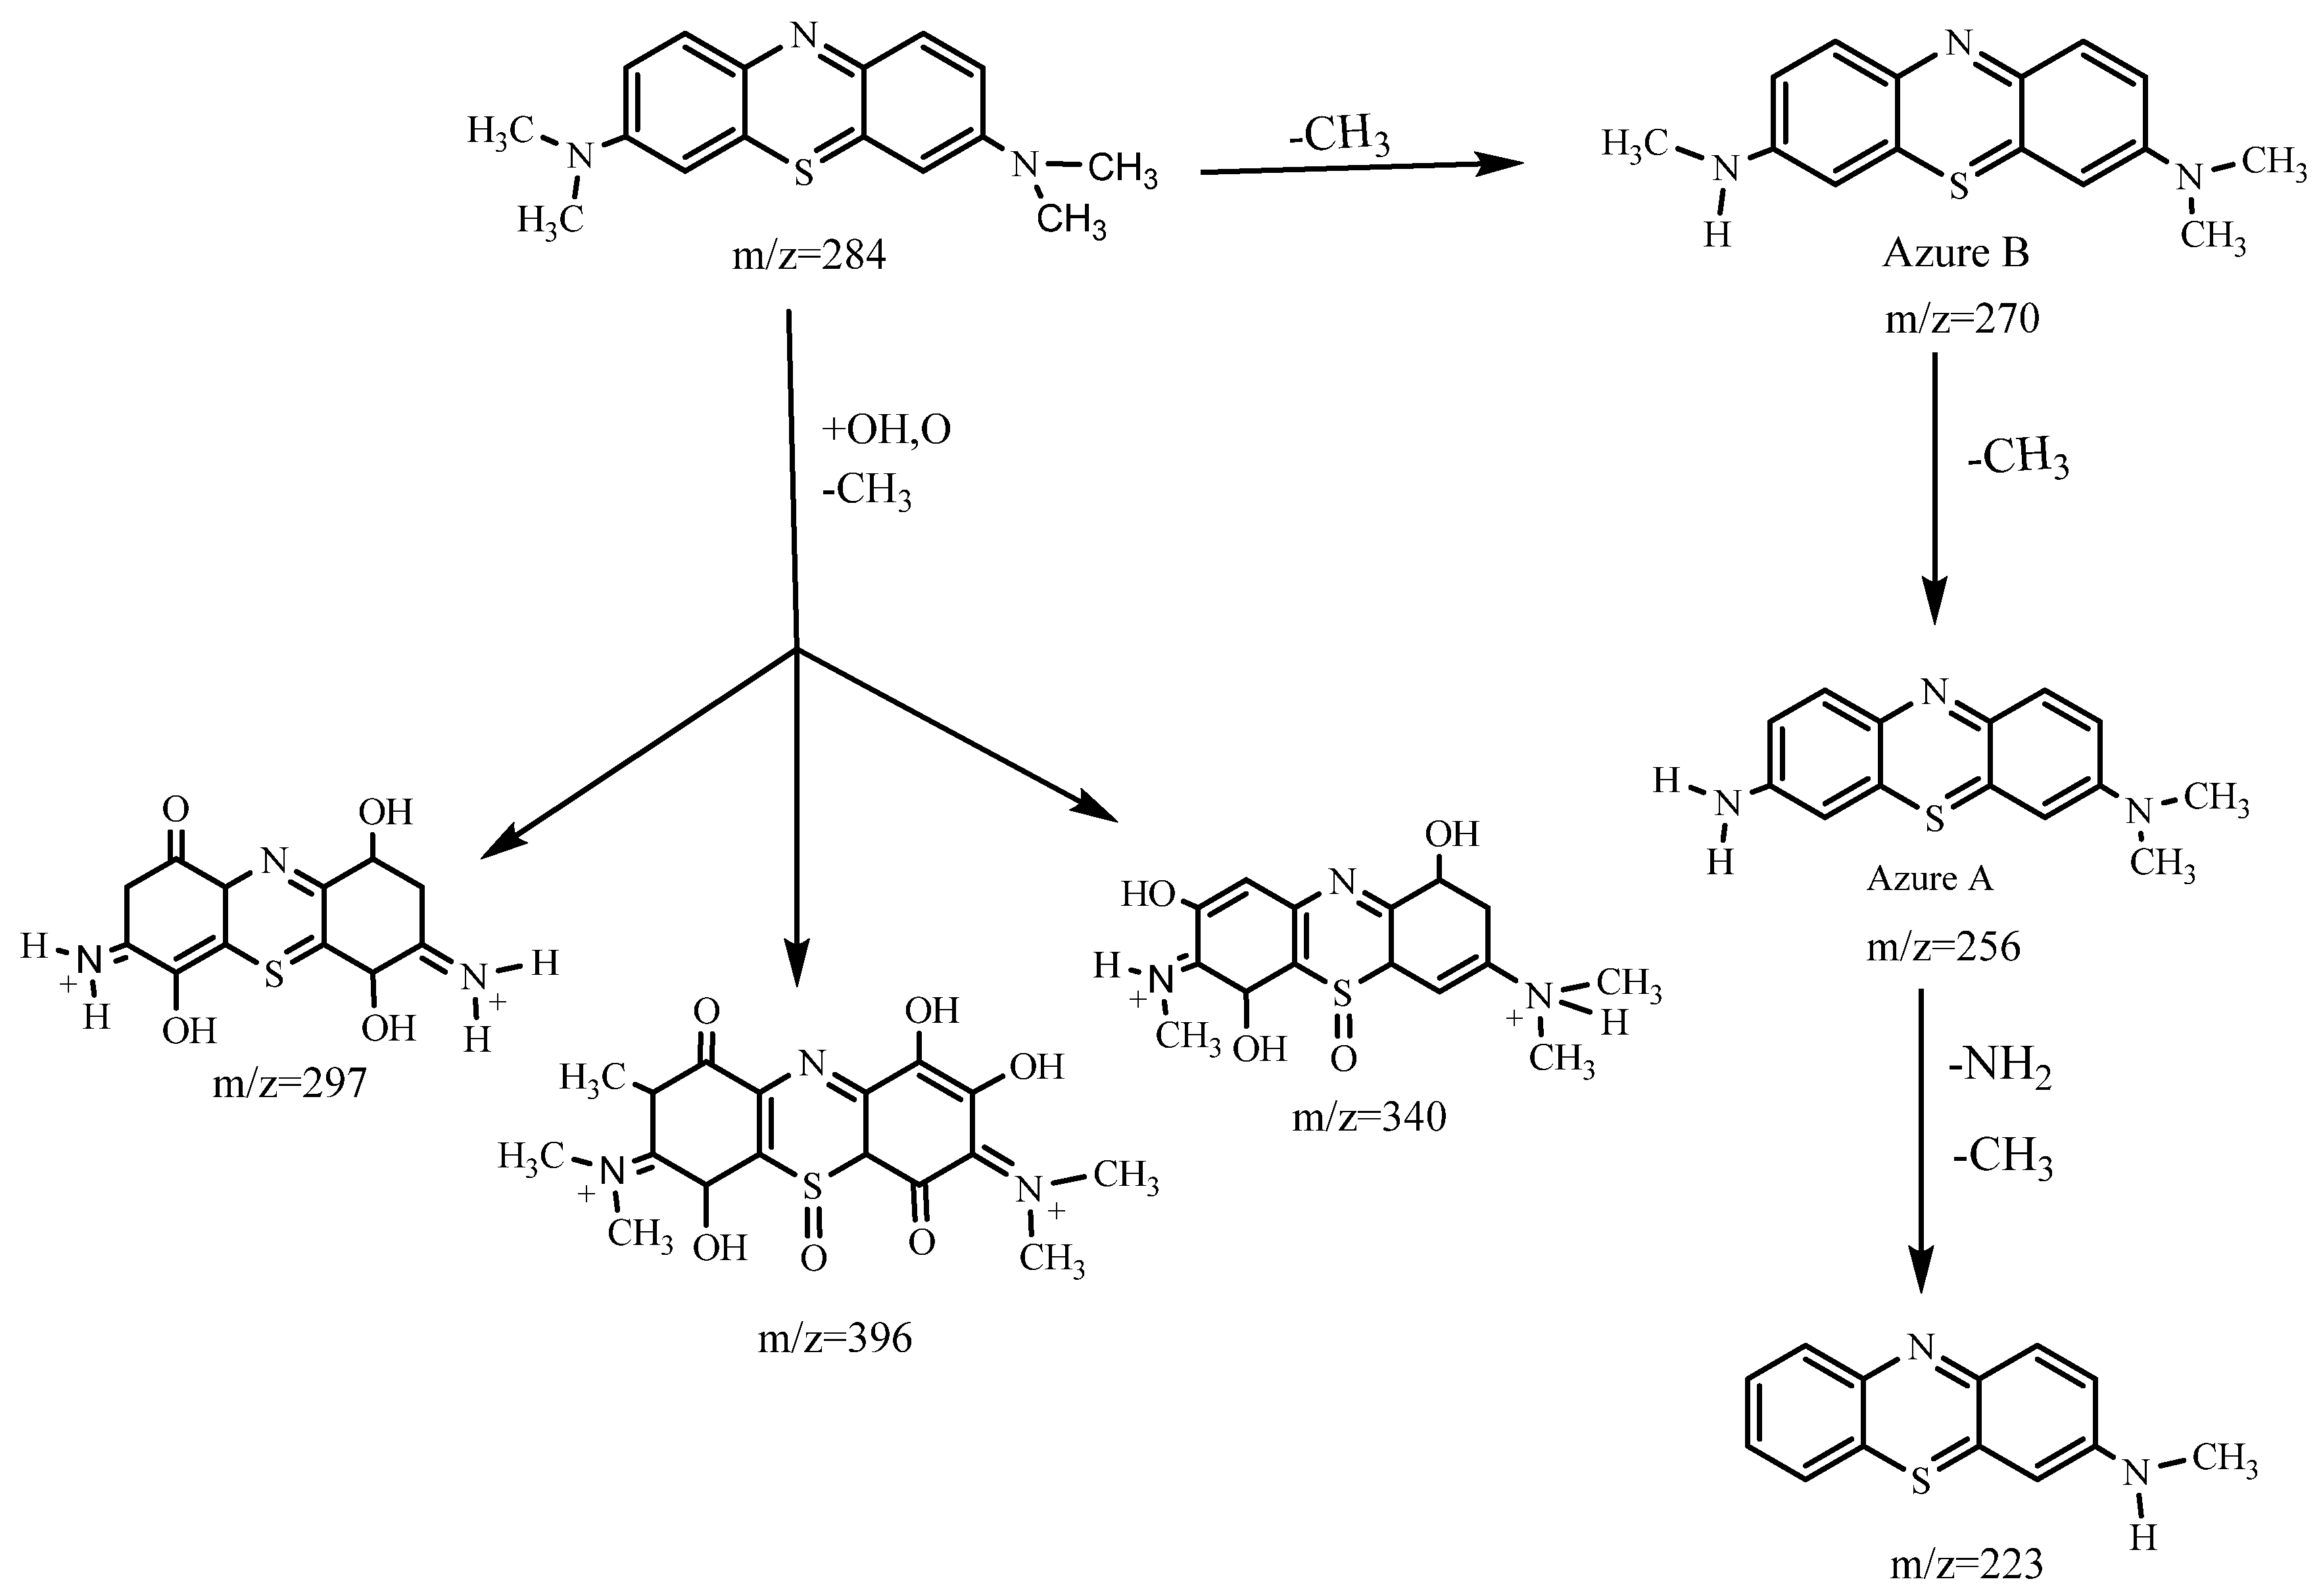
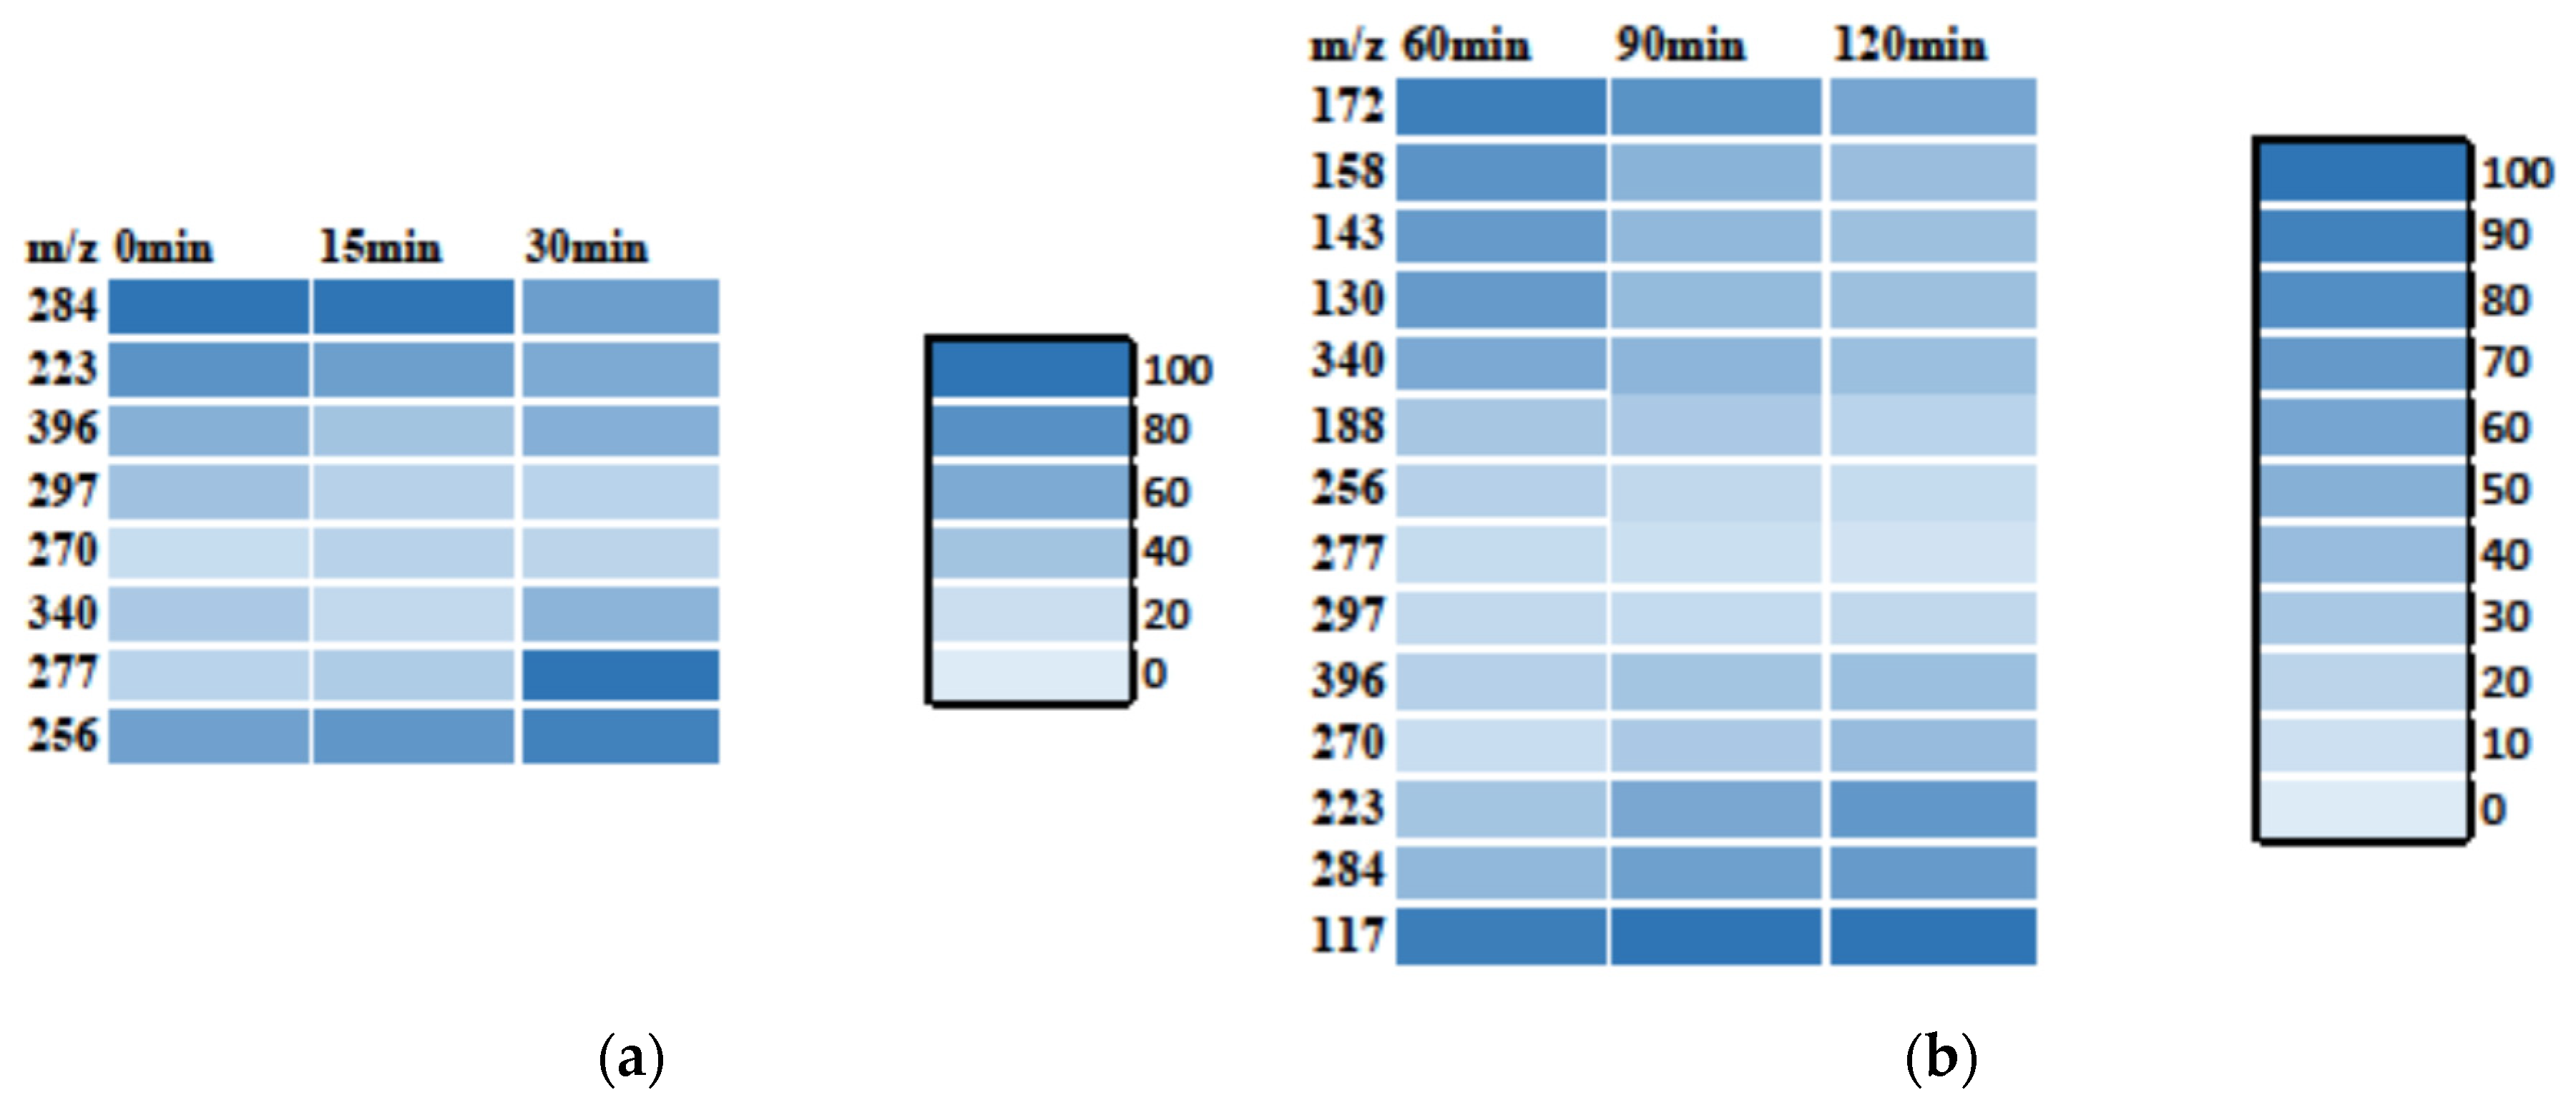
3.3.1. MB Degradation Pathway
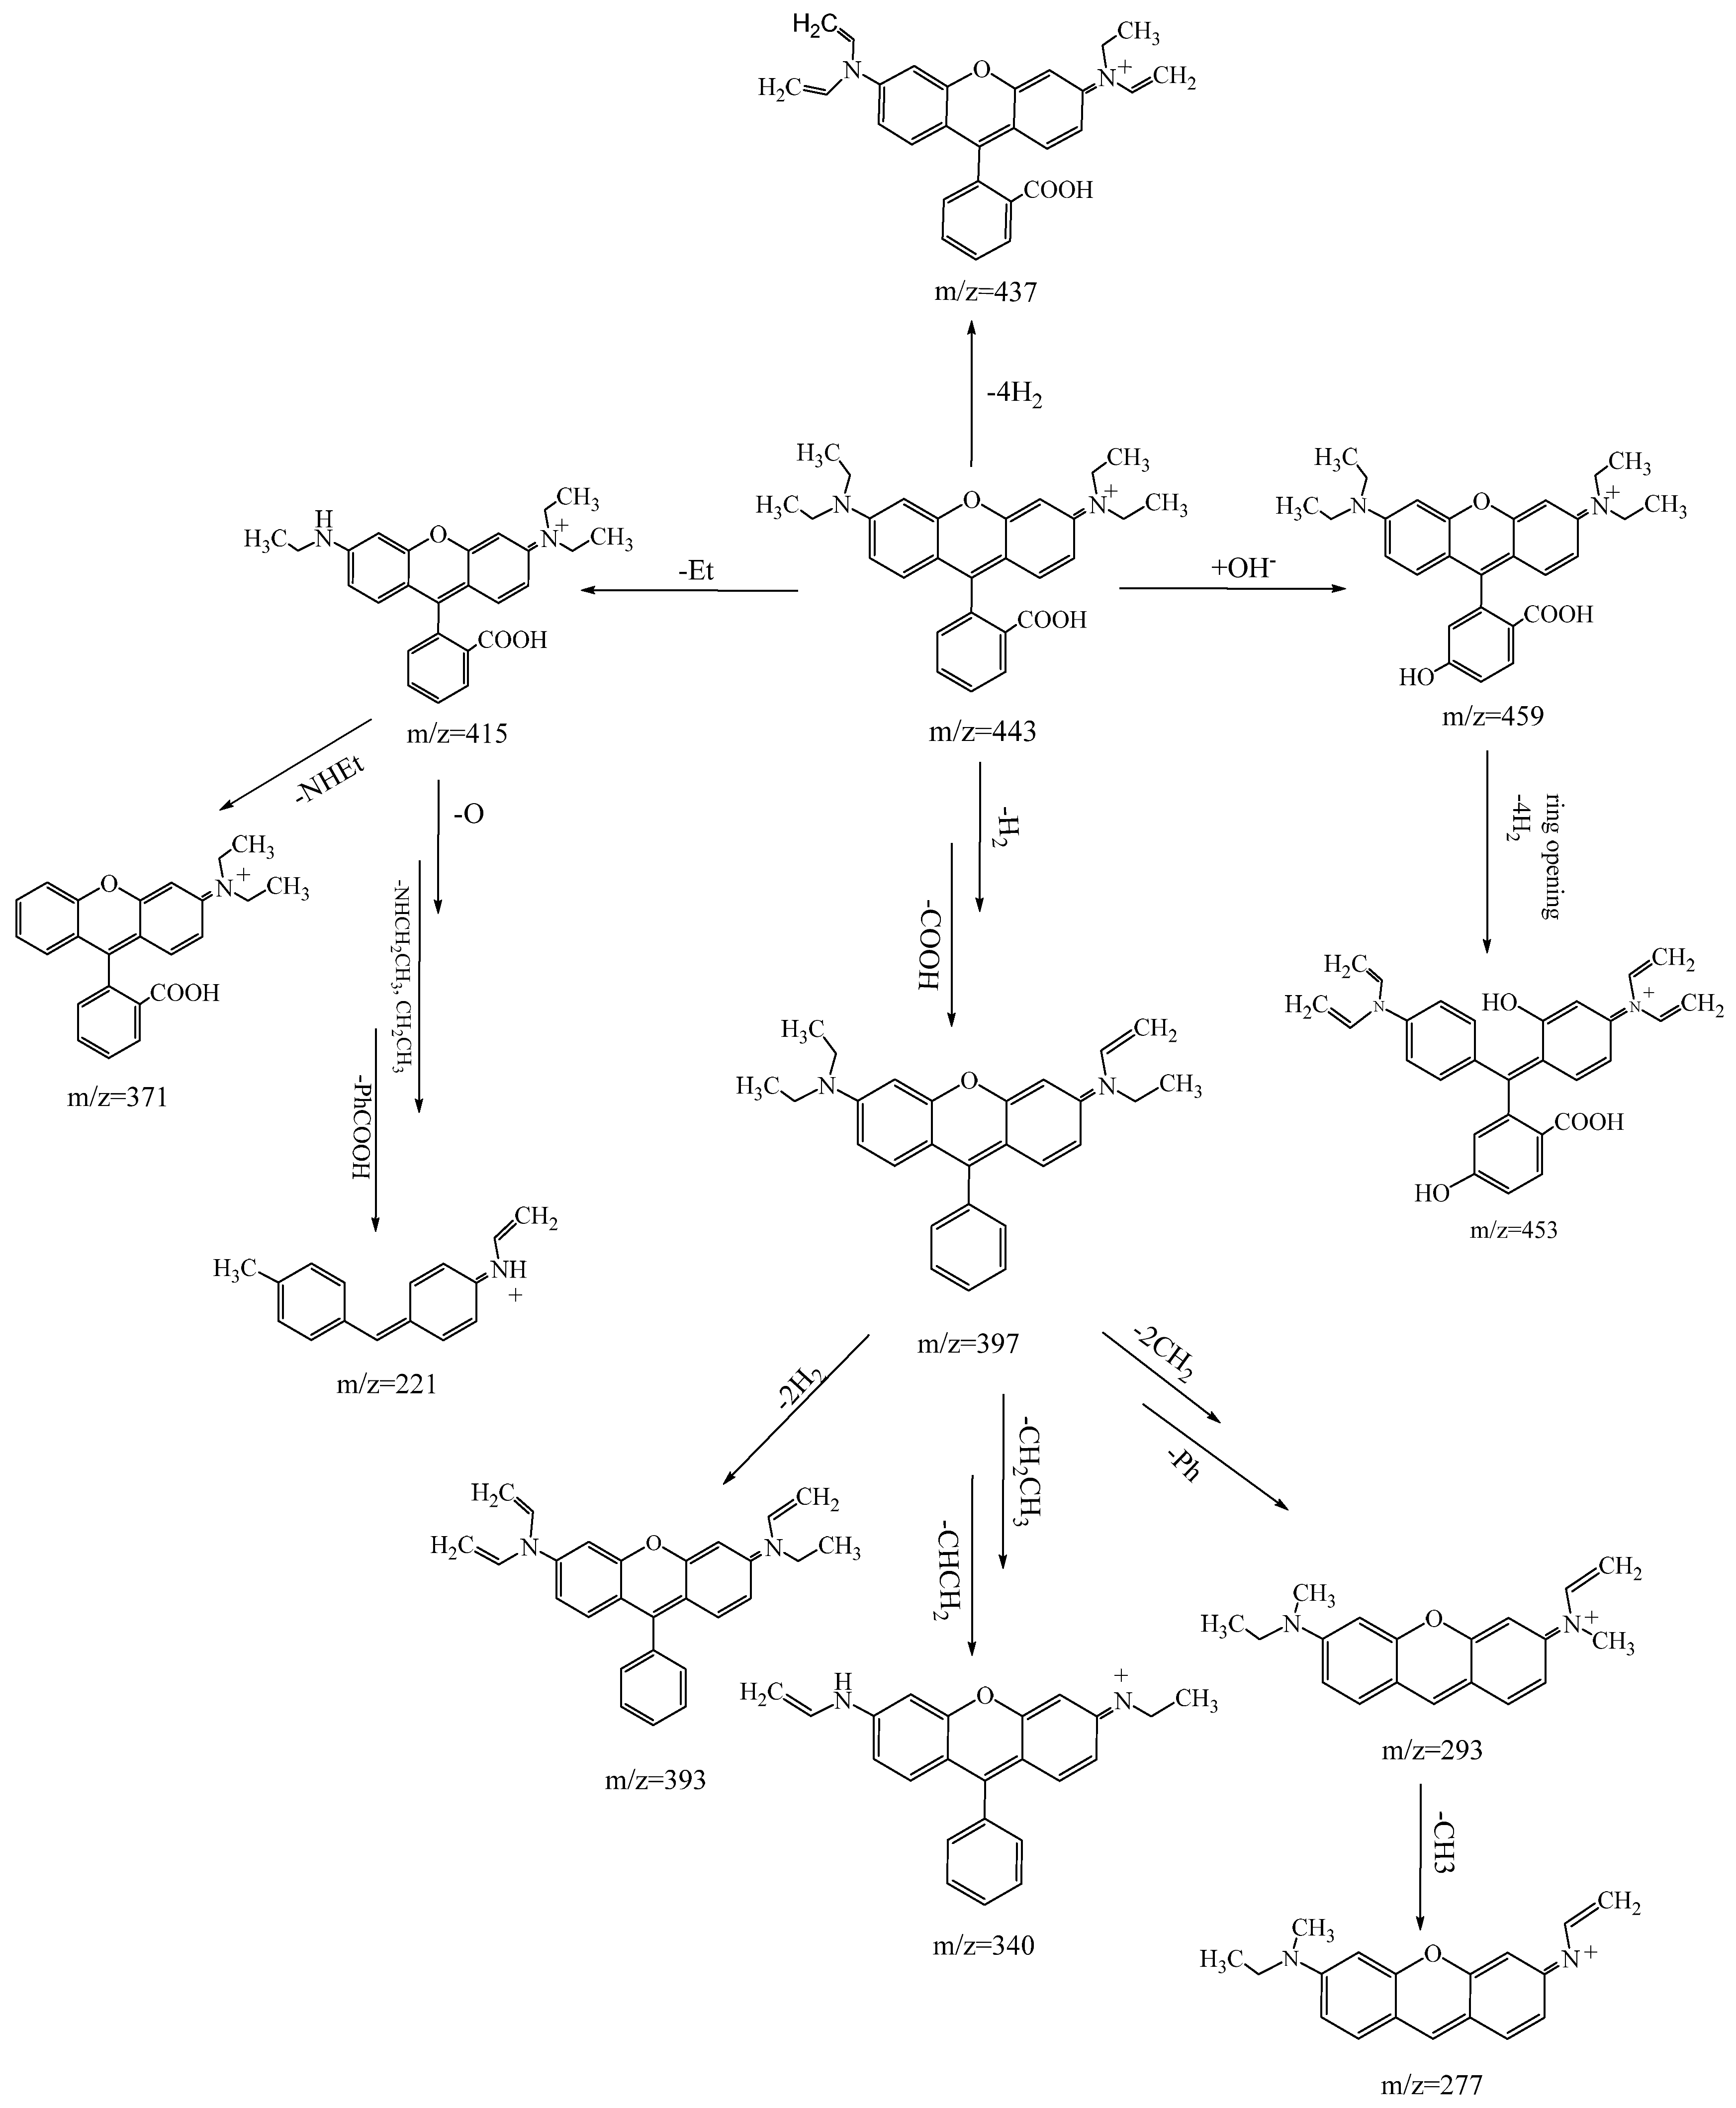
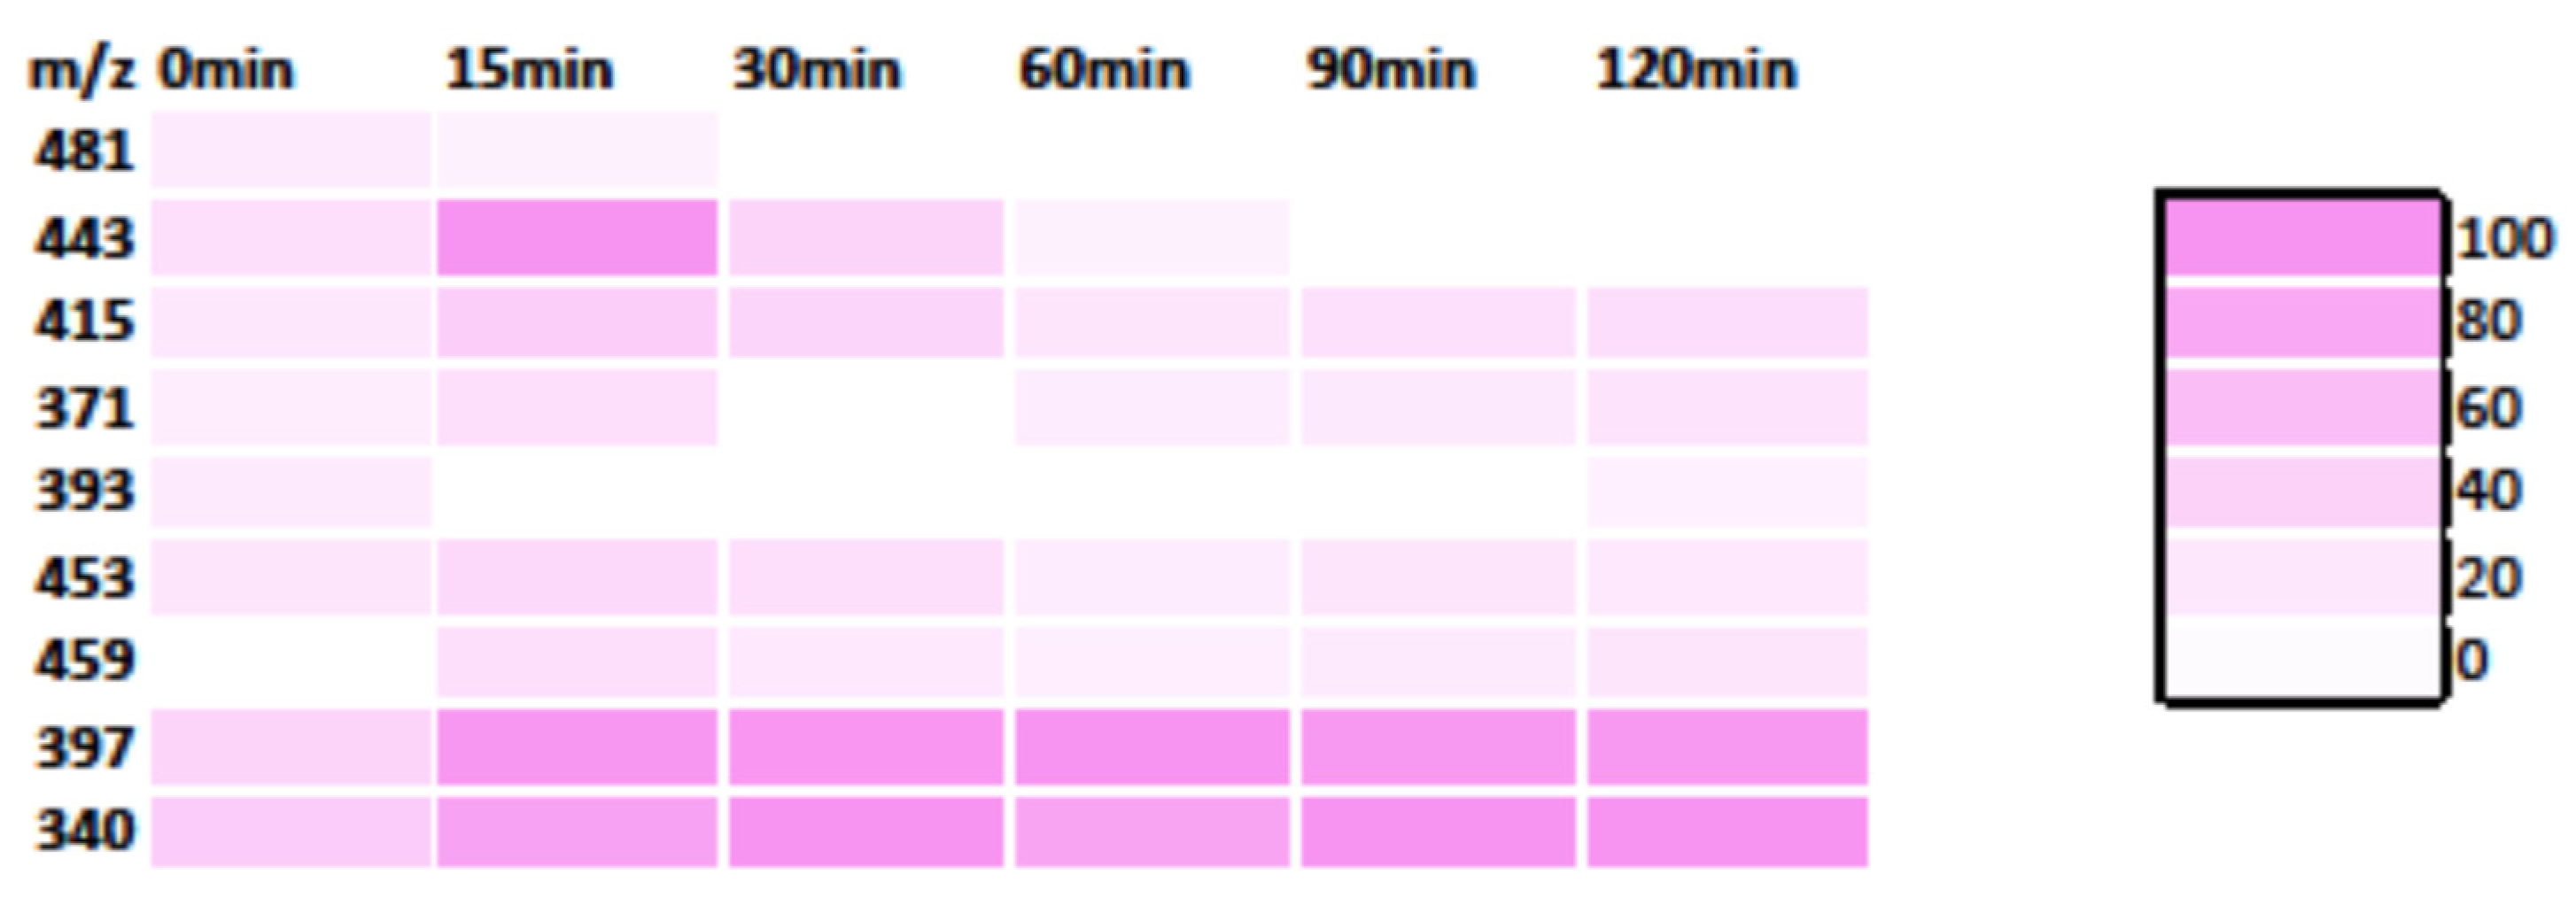
3.3.2. RhB Degradation Pathway
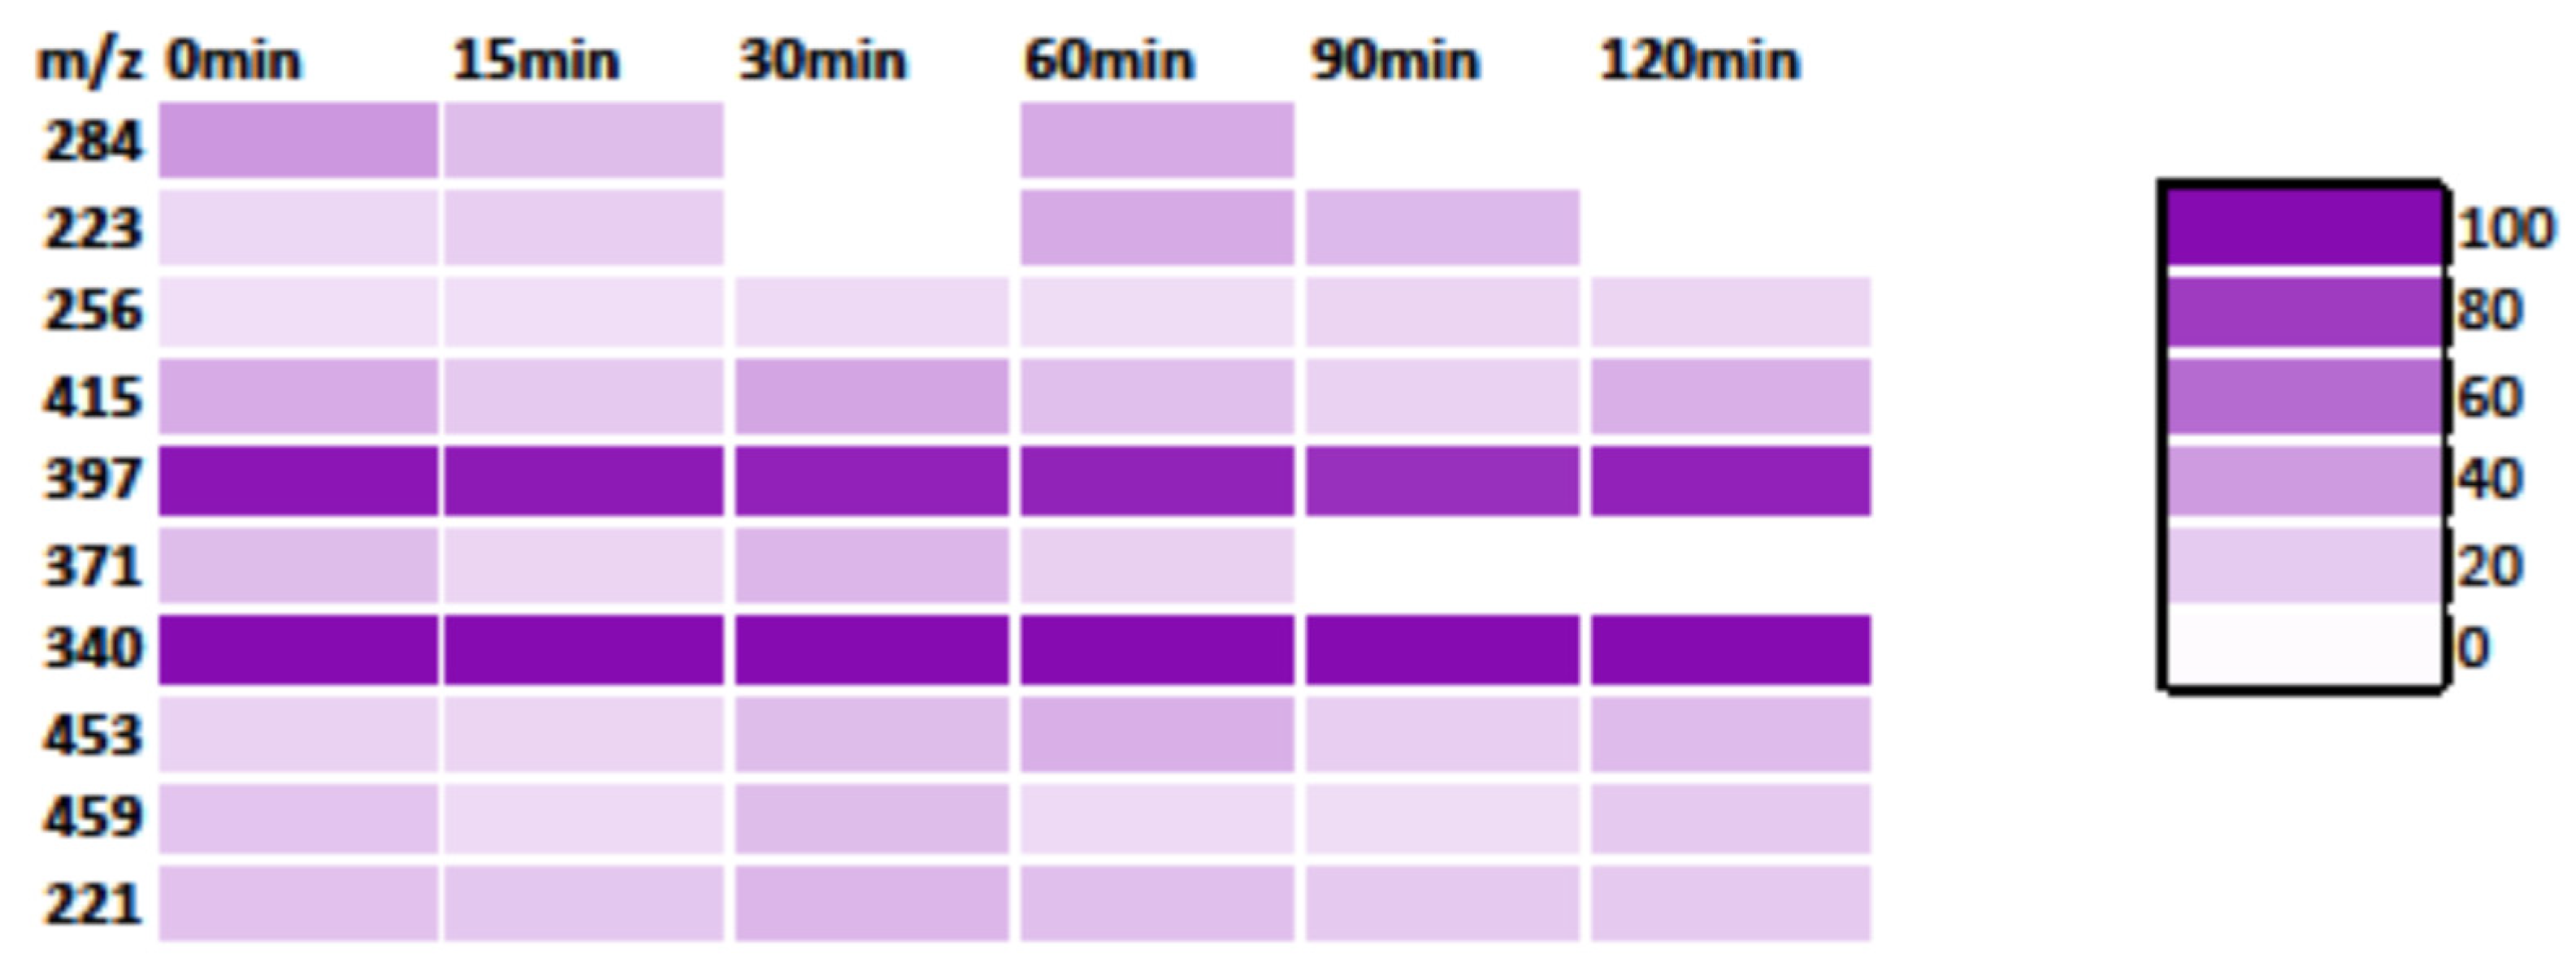
3.3.3. Degradation Pathway of the MB/RhB Mixture
4. Conclusions
Author Contributions
Funding
Data Availability Statement
Acknowledgments
Conflicts of Interest
References
- Byrne, C.; Subramanian, G.; Pillai, S.C. Recent advances in photocatalysis for environmental applications. J. Environ. Chem. Eng. 2018, 6, 3531–3555. [Google Scholar] [CrossRef]
- Son, B.T.; Long, N.V.; Hang, N.T.N. Fly ash-, foundry sand-, clay- and pumice-based metal oxide nanocomposite as green photocatalysts. RSC Adv. 2021, 11, 30805. [Google Scholar] [CrossRef]
- Chiu, Y.H.; Chang, T.F.M.; Chen, C.Y.; Sone, M.; Hsu, Y.J. Mechanistic insights into photodegradation of organic dyes using heterostructure photocatalysts. Catalysts 2019, 9, 430. [Google Scholar] [CrossRef]
- Iqbal, M.A.; Akram, S.; Khalid, S.; Lal, B.; Hassan, S.U.; Ashraf, R.; Kezembayeva, G.; Mushtaq, M.; Chinibayeva, N.; Hosseini-Bandegharaei, A. Advanced photocatalysis as a viable and sustainable wastewater treatment process: A comprehensive review. Environ. Res. 2024, 253, 118947. [Google Scholar] [CrossRef]
- Yadav, S.; Shakya, K.; Gupta, A.; Singh, D.; Chandran, A.R.; Aanappalli, A.V.; Goyal, K.; Rani, N.; Saini, K. A review on degradation of organic dyes by using metal oxide semiconductors. Environ. Sci. Pollut. Res. 2023, 30, 71912–71932. [Google Scholar] [CrossRef]
- Samadi, M.; Zirak, M.; Naseri, A.; Kheirabadi, M.; Ebrahimi, M.; Moshfegh, A.Z. Design and tailoring of one dimensional ZnO nanomaterials for photocatalytic degradation of organic dyes: A review. Res. Chem. Intermed. 2019, 45, 2197–2254. [Google Scholar] [CrossRef]
- Din, M.I.; Khalid, R.; Najeeb, J.; Hussain, Z. Fundamentals and photocatalysis of methylene blue dye using various nanocatalytic assemblies—A critical review. J. Clean. Prod. 2021, 298, 126567. [Google Scholar] [CrossRef]
- Dlugosz, O.; Staron, A.; Brzoza, P.; Banach, M. Synergistic effect of sorption and photocatalysis on the degree of dye removal in single and multicomponent systems on ZnO-SnO2. Environ. Sci. Pollut. Res. 2022, 29, 27042–27050. [Google Scholar] [CrossRef] [PubMed]
- Wang, H.; Zhang, L.; Chen, Z.; Hu, J.; Li, S.; Wang, Z.; Liu, J.; Wang, X. Semiconductor heterojunction photocatalysts: Design, construction, and photocatalytic performance. Chem. Soc. Rev. 2014, 43, 5234–5244. [Google Scholar] [CrossRef]
- Uddin, T.; Nicolas, Y.; Olivier, C.; Toupance, T.; Servant, L.; Müller, M.M.; Kleebe, H.J.; Ziegler, J.; Jaegermann, W. Nanostructured SnO2-ZnO heterojunction photocatalysis showing enhanced photocatalytic activity degradation of organic dyes. Inorg. Chem. 2012, 51, 7764–7773. [Google Scholar] [CrossRef]
- Kumar, N.; Jung, U.; Jung, B.; Park, J.; Naushad, M. Zinc hydroxystannate/zinc-tin oxide heterojunctions for the UVC assisted photodegradation of methyl orange and tetracycline. Environ. Pollut. 2023, 316, 120353. [Google Scholar] [CrossRef]
- Markovic, S.; Stankovic, A.; Dostanic, J.; Veselinovic, L.; Mancic, L.; Skapin, S.D.; Drazic, G.; Jankovic-Castvan, I.; Uskokovic, D. Simultaneous enhancement of natural sunlight and artificial UV-driven photocatalytic activity of a mechanically activated ZnO/SnO2 composite. RSC Adv. 2017, 7, 42725–42737. [Google Scholar] [CrossRef]
- Le, T.H.; Khiem, T.N.; Quynh, H.T.T.; Tuan, P.V. Effect of the composition ratio of ZnO/Zn2SnO4 composite on its visible photocatalytic activities in the photodegradation of methylene blue and rhodamine B organic dyes. Phys. Scr. 2025, 100, 1065986. [Google Scholar] [CrossRef]
- Vasiljevic, Z.Z.; Dojcinovic, M.P.; Vujancevic, J.D.; Jankovic-Castvan, I.; Ognjanovic, M.; Tadic, N.B.; Stojadinovic, S.; Brankovic, G.O.; Nikolic, M.V. Photocatalytic degradation of methylene blue under natural sunlight using iron titanate nanoparticles prepared by a modified sol-gel method. R. Soc. Open Sci. 2020, 7, 200708. [Google Scholar] [CrossRef] [PubMed]
- Rovisco, A.; Branquinho, R.; Martins, J.; Oliveira, M.J.; Nunes, D.; Fortunato, E.; Martins, R.; Barquinha, P. Seed-layer free zinc tin oxide tailored nanostructures for nanoelectronic applications: Effect of chemical parameters. ACS Appl. Nano Mater. 2018, 1, 3986–3997. [Google Scholar] [CrossRef] [PubMed]
- Jia, T.; An, J.; Yu, D.; Li, J.; Fu, F.; Wang, K.; Wang, W. Continuously improved photocatalytic performance of Zn2SnO4/SnO2/Cu2O composites by structural modification. Nanomaterials 2019, 9, 1390. [Google Scholar] [CrossRef] [PubMed]
- Rovisco, A.; Branquinho, R.; Deuermeier, J.; Freire, T.; Fortunato, E.; Martins, R.; Barquinha, P. Shape effect of zinc tin oxide nanostructures on photodegradation of methylene blue and rhodamine B under UV and visible light. ACS Appl. Nano Mater. 2021, 4, 1149. [Google Scholar] [CrossRef]
- Silvestri, S.; de Oliveira, J.F.; Foletto, E.L. Degradation of methylene blue using Zn2SnO4 catalysts prepared with pore-forming agents. Mater. Res. Bull. 2019, 117, 56–62. [Google Scholar] [CrossRef]
- Junploy, P.; Thongtem, S.; Thongtem, T.; Phurnangrat, A. Photocatalytic activity of Zn2SnO4-SnO2 nanocomposites produced by sonochemistry in combination with high temperature calcination. Superlattice. Microst. 2014, 74, 173–183. [Google Scholar] [CrossRef]
- Li, B.; Luo, L.; Xiao, T.; Hu, X.; Lu, L.; Wang, J.; Tang, Y. Zn2SnO4-SnO2 heterojunction nanocomposites for dye sensitized solar cells. J. Alloys Compd. 2011, 509, 2186–2191. [Google Scholar] [CrossRef]
- Wang, J.; Li, H.; Meng, S.; Zhang, L.; Fu, X.; Chen, S. One-pot hydrothermal synthesis of highly efficient SnOx/Zn2SnO4 composite photocatalyst for the degradation of methyl orange and gaseous benzene. Appl. Catal. B 2017, 200, 19–30. [Google Scholar] [CrossRef]
- Keles, E.; Yildirim, M.; Öztürk, T.; Yildirim, O.A. Hydrothermally synthesized UV light active zinc stannate: Tin oxide (ZTO: SnO2) nanocomposite photocatalysts for photocatalytic applications. Mater. Sci. Semicond. Proc. 2020, 110, 104959. [Google Scholar] [CrossRef]
- Junploy, P.; Phuruangrat, A.; Plubphon, N.; Thongtem, S. Photocatalytic degradation of methylene blue by Zn2SnO4-SnO2 system under UV visible radiation. Mater. Sci. Semicond. Proc. 2017, 66, 56–61. [Google Scholar] [CrossRef]
- Sun, L.; Han, X.; Jiang, Z.; Ye, T.; Li, R.; Zhao, X.; Han, X. Fabrication of cubic Zn2SnO4/SnO2 complex hollow structures and their sunlight-driven photocatalytic activity. Nanoscale 2016, 8, 12858. [Google Scholar] [CrossRef] [PubMed]
- Sun, L.; Li, S.; Su, Y.; He, D.; Zhang, Z. Surface-driven disorder engineered Zn2SnO4/SnO2 hollow microboxes with enhanced solar-driven photocatalytic activity. Appl. Surf. Sci. 2019, 463, 474–480. [Google Scholar] [CrossRef]
- Li, Z.; Zhao, Y.; Hua, L.; Xie, J.; Zhou, Y. Hollow SnO2/Zn2SnO4 cubes with porous shells towards n-butylamine sensing and photocatalytic applications. Vacuum 2020, 182, 109693. [Google Scholar] [CrossRef]
- Tang, M.; Snoussi, Y.; Bhakta, A.K.; El Garah, M.; Khalil, A.M.; Ammar, S.; Chehimi, M.M. Unusual, hierarchically structured composite of sugarcane pulp bagasse biochar loaded with Cu/Ni bimetallic nanoparticles for dye removal. Environ. Res. 2023, 232, 116232. [Google Scholar] [CrossRef]
- Yusuff, A.S.; Popoola, L.T.; Aderibigbe, E.I. Solar photocatalytic degradation of organic pollutants in textile industry wastewater by ZnO/pumice composite photocatalyst. J. Environ. Chem. Eng. 2020, 8, 103907. [Google Scholar] [CrossRef]
- Nikolic, M.V.; Labus, N.; Pavlovic, V.P.; Markovic, S.; Lukovic, M.D.; Tadic, N.; Vujancevic, J.; Vlahovic, B.; Pavlovic, V.B. Nanocrystalline Zn2SnO4/SnO2: Crystal structure and humidity influence on complex impedance. J. Electroceram. 2020, 45, 135–147. [Google Scholar] [CrossRef]
- Toby, B.H.; Von Dreele, R.B. GSAS II the genesis of an open-source all-purpose crystallography software package. J. Appl. Crystallogr. 2013, 46, 544–549. [Google Scholar] [CrossRef]
- Momma, K.; Izumi, F. VESTA 3 for three-dimensional visualization of crystal, volumetric and morphology data. J. Appl. Crystallogr. 2011, 44, 1271–1276. [Google Scholar] [CrossRef]
- Gracia, L.; Beltran, A.; Andres, J. A theoretical study on the pressure induced phase transitions in the inverse spinel structure Zn2SnO4. J. Phys. Chem. C 2011, 115, 7740–7746. [Google Scholar] [CrossRef]
- Bao, L.; Zang, J.; Wang, G.; Li, X. Atomic-scale imaging of cation ordering in inverse spinel Zn2SnO4 nanowires. Nano. Lett. 2014, 14, 6505–6509. [Google Scholar] [CrossRef] [PubMed]
- Wang, K.; Liu, D.; Deng, P.; Liu, L.; Lu, S.; Sun, Z.; Ma, Y.; Wang, Y.; Li, M.; Xia, B.Y.; et al. Band alignment in Zn2SnO4/SnO2 heterostructure enabling efficient CO2 electrochemical reduction. Nano Energy 2019, 64, 103954. [Google Scholar] [CrossRef]
- Li, H.; Ma, Q.; Guo, J.; Zhang, Q.; Wang, X.; Wang, Y. Enhanced surface electron migration of porous and hollow SnO2/Zn2SnO4 heterostructures for efficient triethylamine sensing performance. Appl. Surf. Sci. 2022, 597, 153752. [Google Scholar] [CrossRef]
- Hu, J.; Xiong, X.; Guan, W.; Tan, C. Hollow mesoporous SnO2/Zn2SnO4 heterojunction and RGO decoration for high-performance detection of acetone. ACS Appl. Mater. Interfaces 2022, 14, 55249–55263. [Google Scholar] [CrossRef]
- Dong, S.; Cui, L.; Tian, Y.; Xia, L.; Wu, Y.; Yu, J.; Bagley, D.M.; Sun, J.; Fan, M. A novel and high-performance double Z-scheme photocatalyst ZnO-SnO2-Zn2SnO4 for effective removal of the biological toxicity of antibiotics. J. Hazard. Mater. 2020, 399, 123017. [Google Scholar] [CrossRef]
- Lu, J.; Xie, Y.; Luo, F.; Fu, H.; Huang, X.; Liu, Y.; Liu, H. Heterostructures of mesoporous hollow Zn2SnO4/SnO2 microboxes for high-performance acetone sensors. J. Alloys Compd. 2020, 844, 155788. [Google Scholar] [CrossRef]
- Ye, W.; Li, J. Zn2SnO4/SnO2 heterojunctions regulated by the mineralizer sodium hydroxide promotes highly sensitive detection of formaldehyde vapor at room temperature. Ceram. Int. 2024, 50, 30541–30551. [Google Scholar] [CrossRef]
- Vasiljevic, Z.Z.; Lukovic, M.D.; Nikolic, M.V.; Tasic, N.B.; Mitric, M.; Aleksic, O.S. Nanostructured Fe2O3/TiO2 thick films: Analysis of structural and electronic properties. Ceram. Int. 2015, 41, 6889–6897. [Google Scholar] [CrossRef]
- Arlinghaus, F. Energy bands in stannic oxide (SnO2). J. Phys. Chem. Solids 1974, 35, 931–935. [Google Scholar] [CrossRef]
- Akgul, F.A.; Gumus, C.; Er, A.O.; Farha, A.H.; Akgul, G.; Ufuktepe, Y.; Liu, Z. Structural and electronic properties of SnO2. J. Alloys Compd. 2013, 579, 50–56. [Google Scholar] [CrossRef]
- Ahmed, A.S.; Azam, A.; Shafeq, M.; Chaman, M.; Tabassum, S. Temperature dependent structural and optical properties of tin oxide nanoparticles. J. Phys. Chem. Solids 2012, 73, 943–947. [Google Scholar] [CrossRef]
- Alpuche Aviles, M.A.; Wu, J. Photoelectrochemical study of the band structure of Zn2SnO4 prepared by the hydrothermal method. J. Am. Chem. Soc. 2009, 131, 3216–3224. [Google Scholar] [CrossRef]
- Jaculine, M.M.; Raj, C.J.; Das, S.J. Hydrothermal synthesis of highly crystalline Zn2SnO4 nanoflowers and their optical properties. J. Alloys Compd. 2013, 577, 131–137. [Google Scholar] [CrossRef]
- Marotti, R.E.; Giorgi, P.; Machado, G.; Dalchiele, E.A. Crystallite size dependence of band gap energy for electrodeposited ZnO grown at different temperatures. Sol. Energy Mater. Sol. Cells 2006, 90, 2356–2361. [Google Scholar] [CrossRef]
- Flak, D.; Braun, A.; Vollmer, A.; Rekas, M. Effect of titania on the electronic structure and transport properties of FSS-made Fe2O3 nanoparticles for hydrogen sensing. Sens. Actuators B 2013, 187, 347–355. [Google Scholar] [CrossRef]
- Rajic, V.; Stojkovic Simatovic, I.; Veselinovic, L.; Belosevic Cavor, J.; Novakovic, M.; Popovic, M.; Skapin, S.D.; Mojovic, M.; Stojadinovic, S.; Rac, V.; et al. Bifunctional catalytic activity of Zn1-xFexO toward the OER/ORR: Seeking an optimal stoichiometry. Phys. Chem. Chem. Phys. 2020, 22, 22078–22095. [Google Scholar] [CrossRef] [PubMed]
- Ali, M.B.; Bark-Bouaifel, F.; Elhouichet, H.; Sieber, B.; Addad, A.; Boussekey, L.; Ferid, M.; Boukherroub, R. Hydrothermal synthesis, phase structure, optical and photocatalytical properties of Zn2SnO4 nanoparticles. J. Colloid Interface Sci. 2015, 457, 360–369. [Google Scholar] [CrossRef]
- Mishra, R.K.; Kushwaha, A.; Sahay, P.P. Influence of Cu doping on the structural, photoluminescence and formaldehyde sensing properties of SnO2 nanoparticles. RSC Adv. 2014, 4, 3904. [Google Scholar] [CrossRef]
- Soltani, T.; Entezari, M.H. Photolysis and photocatalysis of methylene blue by ferrite bismuth nanoparticles under sunlight irradiation. J. Mol. Catal. A Chem. 2013, 377, 197–203. [Google Scholar] [CrossRef]
- Wang, F.; Min, S.; Han, Y.; Feng, L. Visible-light-induced photocatalytic degradation of methylene blue with polyaniline-sensitized composite photocatalysts. Superlattice. Microst. 2010, 48, 170–180. [Google Scholar] [CrossRef]
- Lee, J.W.; Nam, S.H.; Yu, J.H.; Kim, D.I.; Jeong, R.H.; Boo, J.H. Morphological modulation of urchin-line Zn2SnO4/SnO2 hollow spheres and their applications as photocatalysts and quartz crystal microbalance measurements. Appl. Surf. Sci. 2019, 474, 78–84. [Google Scholar] [CrossRef]
- Yu, K.; Yang, S.; He, H.; Sun, C.; Gu, C.; Ju, Y. Visible light-driven photocatalytic degradation of Rhodamine B over NaBiO3: Pathways and mechanism. J. Phys. Chem. A 2020, 113, 10024–10032. [Google Scholar] [CrossRef]
- Li, Z.; Yang, H.; Zhang, L.; Liu, R.; Zhou, Y. Stainless steel mesh-supported three-dimensional hierarchical SnO2/Zn2SnO4 composite for the applications in solar cell, gas sensor and photocatalysis. Appl. Surf. Sci. 2020, 502, 144113. [Google Scholar] [CrossRef]
- Small, J.M.; Hintelmann, H. Methylene blue derivatization then LC–MS analysis for measurement of trace levels of sulfide in aquatic samples. Anal. Bioanal. Chem. 2007, 387, 2881–2886. [Google Scholar] [CrossRef]
- Molla, A.; Sahu, M.; Hussain, S. Under dark and visible light: Fast degradation of methylene blue in the presence of Ag–In–Ni–S nanocomposites. J. Mater. Chem. A 2015, 3, 15616–15625. [Google Scholar] [CrossRef]
- Martin, N.; Leprince-Wang, Y. HPLC-MS and UV–Visible coupled analysis of methylene blue photodegradation by hydrothermally grown ZnO nanowires. Phys. Status Solidi 2021, 218, 2100532. [Google Scholar] [CrossRef]
- Gupta, V.K.; Manisha, S.; Raj, K.V. Hydrothermal modification and characterization of bentonite for reactive adsorption of methylene blue: An ESI-MS study. J. Environ. Chem. Eng. 2015, 3, 2172–2179. [Google Scholar] [CrossRef]
- Nguyen, T.B.; Doong, R.A.; Huang, C.P.; Chen, C.W.; Dong, C.D. Activation of persulfate by CoO nanoparticles loaded on 3D mesoporous carbon nitride (CoO@ meso-CN) for the degradation of methylene blue (MB). Sci. Total Environ. 2019, 675, 531–541. [Google Scholar] [CrossRef]
- Rovisco, A.; Morais, M.; Branquinho, R.; Fortunato, E.; Martins, R.; Barquinha, P. Microwave-assisted synthesis of Zn2SnO4 nanostructures for photodegradation of Rhodamine B under UV and sunlight. Nanomaterials 2022, 12, 2119. [Google Scholar] [CrossRef]
- Rasalingam, S.; Wu, C.M.; Koodali, R.T. Modulation of pore sizes of titanium dioxide photocatalysts by a facile template free hydrothermal synthesis method: Implications for photocatalytic degradation of rhodamine B. ACS Appl. Mater. Interfaces 2015, 7, 4368–4380. [Google Scholar] [CrossRef]
- Zhong, H.E.; Shaogui, Y.A.N.G.; Yongming, J.U.; Cheng, S.U.N. Microwave photocatalytic degradation of Rhodamine B using TiO2 supported on activated carbon: Mechanism implication. J. Environ. Sci. 2009, 21, 268–272. [Google Scholar] [CrossRef]
- Siwinska-Ciesielczyk, K.; Swigon, D.; Rychtowski, P.; Moszynska, D.; Zgola-Grzieskowiak, A.; Jesionowski, T. The performance of multicomponent oxide systems based on TiO2, ZrO2 and SiO2 in the photocatalytic degradation of Rhodamine B: Mechanism and kinetic studies. Colloids Surf. A 2020, 586, 124272. [Google Scholar] [CrossRef]
- Wang, G.L.; Wang, J.; Zhou, L.P.; Cai, X.; Xu, M.; Lin, J.; Muddassir, M.; Sakiyama, H. A multi-functional Cd (II)-based coordination polymer for the highly sensitive detection of nitrofurazone and photocatalytic efficiency of Rhodamine B. Inorg. Chim. Acta 2021, 527, 120566. [Google Scholar] [CrossRef]


| Sample | Conditions | DE (%) | k (min−1) | Ref. |
|---|---|---|---|---|
| Zn2SnO4/SnO2 nanocubes Zn:Sn = 1:1 | 100 mg-100 mL 2.5 ppm, UV-light | 91.6% 360 min | 0.007236 | [23] |
| Zn2SnO4/SnO2 nanocubes Zn:Sn = 3:2 | 100 mg-100 mL 2.5 ppm, UV-light | 99.4% 360 min | 0.012244 | [23] |
| Zn2SnO4/SnO2 nanoparticles | 100 mg-100 mL 2 ppm UV-light | 98.6% 220 min | 0.01763 | [19] |
| Zn2SnO4/SnO2 nanocubes | 100 mg-100 mL 2 ppm UV-light | 85.1% 220 min | 0.008893 | [19] |
| Zn2SnO4/SnO2 spheres | 5 mg-50 mL 10 ppm UV light | 60% 140 min | 0.0049 | [53] |
| Zn2SnO4/SnO2 urchin-like hollow spheres | 5 mg-50 mL 10 ppm UV light | 97% 140 min | 0.0209 | [53] |
| Zn2SnO4/SnO2 hollow cubes | 100 mg-100 mL, 10 ppm sim. sunlight | 97.1% 150 min | 0.0241 | [26] |
| Zn2SnO4/SnO2 solid cubes | 100 mg-100 mL 10 ppm sim. sunlight | 83.2% 150 min | 0.0114 | [26] |
| Zn2SnO4/SnO2 heterojunctions | 50 mg-50 mL 10 ppm natural sunlight | 99.1% 120 min | 0.03828 | This work |
| Sample | Conditions | DE (%) | k (min−1) | Ref. |
|---|---|---|---|---|
| Zn2SnO4/SnO2 double shell nanocubes | 50 mg-50 mL 6.4 ppm, simulated sunlight | 95%, 120 min | 0.0214 | [24] |
| Zn2SnO4/SnO2 yolk shell nanocubes | 50 mg-50 mL 6.4 ppm, simulated sunlight | 85%, 240 min | 0.0074 | [24] |
| Zn2SnO4/SnO2 hollow microbox | 20 mg-50 mL 10 ppm simulated sunlight | 83%, 45 min | - | [25] |
| Zn2SnO4/SnO2 nanocomposite | 40 mg-100 mL 5 ppm, UV-C light | 62% 60 min 94.5%, 240 min | 0.0111 | [22] |
| Zn2SnO4/SnO2 microspheres consisting of nanobelts | 80 mg on stainless steel mesh 100 mL, 10 ppm, simulated UV–Vis light | 93.4% 100 min | 0.028 | [55] |
| Zn2SnO4/SnO2 microspheres— nanoparticle-based nanosheets | 80 mg on stainless steel mesh 100 mL, 10 ppm simulated UV–Vis light | 99.9% 100 min | 0.036 | [55] |
| Zn2SnO4/SnO2 heterojunctions | 50 mg-50 mL 10 ppm natural sunlight | 70.6%, 120 min | 0.0108 | This work |
| Ion m/z | Exposure Time (min) | (Possible) Structure |
|---|---|---|
| 188.17 | 60 | 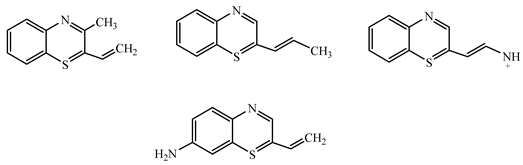 |
| 172.19 | 60 | 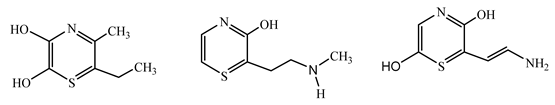 |
| 158.18 | 60 | 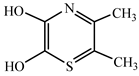 |
| 143.16 | 60 | 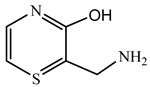 |
| 127.90 | 90 | 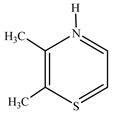 |
| 188.17 | 60 | 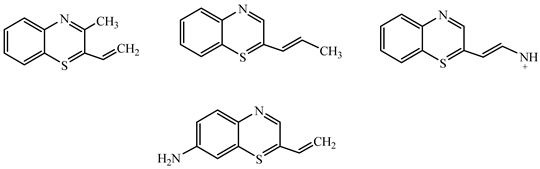 |
| 172.19 | 60 |  |
Disclaimer/Publisher’s Note: The statements, opinions and data contained in all publications are solely those of the individual author(s) and contributor(s) and not of MDPI and/or the editor(s). MDPI and/or the editor(s) disclaim responsibility for any injury to people or property resulting from any ideas, methods, instructions or products referred to in the content. |
© 2025 by the authors. Licensee MDPI, Basel, Switzerland. This article is an open access article distributed under the terms and conditions of the Creative Commons Attribution (CC BY) license (https://creativecommons.org/licenses/by/4.0/).
Share and Cite
Nikolic, M.V.; Vasiljevic, Z.Z.; Dimitrijevic, M.; Radmilovic, N.; Vujancevic, J.; Tanovic, M.; Tadic, N.B. Natural Sunlight Driven Photocatalytic Degradation of Methylene Blue and Rhodamine B over Nanocrystalline Zn2SnO4/SnO2. Nanomaterials 2025, 15, 1138. https://doi.org/10.3390/nano15141138
Nikolic MV, Vasiljevic ZZ, Dimitrijevic M, Radmilovic N, Vujancevic J, Tanovic M, Tadic NB. Natural Sunlight Driven Photocatalytic Degradation of Methylene Blue and Rhodamine B over Nanocrystalline Zn2SnO4/SnO2. Nanomaterials. 2025; 15(14):1138. https://doi.org/10.3390/nano15141138
Chicago/Turabian StyleNikolic, Maria Vesna, Zorka Z. Vasiljevic, Milena Dimitrijevic, Nadezda Radmilovic, Jelena Vujancevic, Marija Tanovic, and Nenad B. Tadic. 2025. "Natural Sunlight Driven Photocatalytic Degradation of Methylene Blue and Rhodamine B over Nanocrystalline Zn2SnO4/SnO2" Nanomaterials 15, no. 14: 1138. https://doi.org/10.3390/nano15141138
APA StyleNikolic, M. V., Vasiljevic, Z. Z., Dimitrijevic, M., Radmilovic, N., Vujancevic, J., Tanovic, M., & Tadic, N. B. (2025). Natural Sunlight Driven Photocatalytic Degradation of Methylene Blue and Rhodamine B over Nanocrystalline Zn2SnO4/SnO2. Nanomaterials, 15(14), 1138. https://doi.org/10.3390/nano15141138