
Probing the Structural Order of Half-Heusler Phases in Sb-Doped (Ti,Zr,Hf)NiSn Thermoelectrics


Abstract
1. Introduction
2. Materials and Methods
3. Results and Discussion
4. Conclusions
Author Contributions
Funding
Data Availability Statement
Acknowledgments
Conflicts of Interest
References
- Quinn, R.J.; Bos, J.G. Advances in half-Heusler alloys for thermoelectric power generation. Mater. Adv. 2021, 2, 6246–6266. [Google Scholar] [CrossRef]
- Villa, E.; Villa, F.; Rodriguez Crespo, B.; Lazpita, P.; Salazar, D.; Hosoda, H.; Chernenko, V. Shape memory and elastocaloric properties of melt-spun NiMn-based Heusler alloys. J. Alloys Compd. 2023, 965, 171437. [Google Scholar] [CrossRef]
- Govind, B.; Kumar, A.; Bano, S.; Bhardwaj, A.; Kumar Misra, D. Structural and Magnetic Properties of Ni1+xMnSb Bulk Heusler Composite Materials. ACS Omega 2020, 5, 11895–11900. [Google Scholar] [CrossRef] [PubMed]
- Tritt, T.M.; Subramanian, M.A. Thermoelectric Materials, Phenomena, and Applications: A Bird’s Eye View. MRS Bull. 2012, 31, 188–198. [Google Scholar] [CrossRef]
- Zhang, X.; Huang, M.; Li, H.; Chen, J.; Xu, P.; Xu, B.; Wang, Y.; Tang, G.; Yang, S.Z. Ultralow Thermal Conductivity and High Thermoelectric Performance in Heavy-Element Half-Heusler Alloys. J. Mater. Chem. A 2023, 11, 8150–8161. [Google Scholar] [CrossRef]
- Fitriani; Ovik, R.; Long, B.D.; Barma, M.; Riaz, M.C.; Sabri, M.F.M.; Said, S.M.; Saidur, R. A review on nanostructures of high-temperature thermoelectric materials for waste heat recovery. Renew. Sustain. Energy Rev. 2016, 64, 635–659. [Google Scholar] [CrossRef]
- Ojha, A.; Sabat, R.K.; Bathula, S. Advancement in half-Heusler thermoelectric materials and strategies to enhance the thermoelectric performance. Mat. Sci. Semicon. Proc. 2024, 171, 1369–8001. [Google Scholar] [CrossRef]
- Shobana Priyanka, D.; Sudharsan, J.B.; Srinivasan, M.; Elavarasan, N.; Ramasamy, P.; Fujiwara, K. Ferrimagnetic half Heusler alloys for waste heat recovery application—First principle study using different exchange–correlation functionals. J. Magn. Magn. Mater. 2023, 588, 171409. [Google Scholar] [CrossRef]
- Li, W.; Ghosh, S.; Liu, N.; Poudel, B. Half-Heusler thermoelectrics: Advances from materials fundamental to device engineering. Joule 2024, 8, 1274–1311. [Google Scholar] [CrossRef]
- Huang, L.; Zhang, Q.; Yuan, B.; Lai, X.; Yan, X.; Ren, Z. Recent progress in half-Heusler thermoelectric materials. Mater. Res. Bull. 2016, 76, 107–112. [Google Scholar] [CrossRef]
- Krez, J.; Balker, B. Thermoelectric Heusler compounds. In Heusler Alloys—Properties, Growth, Applications; Felser, C., Hirohata, A., Eds.; (Springer Series in Materials Science); Springer Nature: Berlin/Heidelberg, Germany, 2016; Volume 222, pp. 249–268. [Google Scholar] [CrossRef]
- Zilber, T.; Cohen, S.; Fuks, D.; Gelbstein, Y. TiNiSn half-Heusler crystals grown from metallic flux for thermoelectric applications. J. Alloys Comp. 2019, 781, 1132. [Google Scholar] [CrossRef]
- Guttmann, G.M.; Haroush, S.; Gelbstein, Y. Themechanical properties of inorganic thermoelectric materials: A review on characterization methods and correlations. ChemNanoMat 2022, 8, e202200203. [Google Scholar] [CrossRef]
- Yang, J.; Li, H.; Wu, T.; Zhang, W.; Chen, L.; Yang, J. Evaluation of Half-Heusler compounds as thermoelectric materials based on the calculated electrical transport properties. Adv. Funct. Mater. 2008, 18, 2880. [Google Scholar] [CrossRef]
- Sakurada, S.; Shutoh, N. Effect of Ti substitution on the thermoelectric properties of (Zr,Hf)NiSn half-Heusler compounds. Appl. Phys. Lett. 2005, 86, 082105. [Google Scholar] [CrossRef]
- Mesaritis, G.; Ioannou, I.; Delimitis, A.; Hatzikraniotis, E.; Gelbstein, Y.; Kyratsi, T. n-type (Zr,Ti)NiSn half Heusler materials via mechanical alloying: Structure, Sb-doping and thermoelectric properties. J. Phys. Chem. Sol. 2022, 167, 110735. [Google Scholar] [CrossRef]
- Ioannou, I.; Delimitis, A.; Gelbstein, Y.; Kyratsi, T. Reduction of Hf via Hf/Zr substitution in mechanically alloyed (Hf, Ti) CoSb half-Heusler solid solutions. Inorganics 2022, 10, 51. [Google Scholar] [CrossRef]
- Shutoh, N.; Sakurada, S. Thermoelectric properties of the TiX(Zr0.5Hf0.5)1-XNiSn half-Heusler compounds. J. Alloys Comp. 2005, 389, 204. [Google Scholar] [CrossRef]
- Rausch, E.; Balke, B.; Stahlhofen, J.M.; Ouardi, S.; Burkhardt, U.; Felser, C. Fine tuning of thermoelectric performance in phase-separated half-Heusler compounds. J. Mater. Chem. C 2015, 3, 10409. [Google Scholar] [CrossRef]
- Yan, Q.; Kanatzidis, M.G. High-performance thermoelectrics and challenges for practical devices. Nat. Mater. 2022, 21, 503–513. [Google Scholar] [CrossRef]
- Van Du, N.; Vu Binh, N.; Quang Trung, D.; Trung Tran, M.; Tu, N.; Thanh Huy, P.; Ur Rahman, J.; Ho Shin, W.; Anh Tuan, D.; Young Cho, J.; et al. Improved thermoelectric properties of Sb-doped Ti0.5Zr0.5NiSn alloy with refined structure induced by rapid synthesis processes. J. Alloys Compd. 2024, 970, 172528. [Google Scholar] [CrossRef]
- Qiu, P.; Yang, J.; Huang, X.; Chen, X.; Chen, L. Effect of antisite defects on band structure and thermoelectric performance of ZrNiSn half-Heusler alloys. Appl. Phys. Lett. 2010, 96, 152105. [Google Scholar] [CrossRef]
- Kim, K.S.; Kim, Y.-M.; Mun, H.; Kim, J.; Park, J.; Borisevich, A.Y.; Lee, K.H.; Kim, S.W. Direct Observation of Inherent Atomic-Scale Defect Disorders responsible for High-Performance Ti1-xHfxNiSn1-ySby Half-Heusler Thermoelectric Alloys. Adv. Mater. 2017, 29, 1702091. [Google Scholar] [CrossRef] [PubMed]
- Mesaritis, G.; Kyratsi, T. Hf Incorporation in (Ti,Zr)NiSn Half Heusler Solid Solutions via Mechanical Alloying. Energies 2022, 15, 7885. [Google Scholar] [CrossRef]
- Ravel, B.; Newville, M. Athena, Artemis, Hephaestus: Data analysis for X-ray absorption spectroscopy using IFEFFIT. J. Synchrotron Rad. 2005, 12, 537–541. [Google Scholar] [CrossRef]
- Ankudinov, A.L.; Ravel, B.; Rehr, J.J.; Conradson, S.D. Real-space multiple-scattering calculation and interpretation of x-ray-absorption near-edge structure. Phys. Rev. B 1998, 58, 7565–7576. [Google Scholar] [CrossRef]
- Newville, M. EXAFS analysis using FEFF and FEFFIT. J. Synchrotron Rad. 2001, 8, 96–100. [Google Scholar] [CrossRef]
- Stadnyk, Y.; Horyn, A.; Romaka, V.V.; Gorelenko, Y.; Romaka, L.P.; Hlil, E.K.; Fruchart, D. Crystal, electronic structure and electronic transport properties of the Ti(1-x)V(x)Ni Sn(x = 0-0.10) solid solutions. J. Solid State Chem. 2010, 183, 3023–3028. [Google Scholar] [CrossRef]
- Miyazaki, H.; Ozkendir, O.M.; Gunaydin, S.; Watanabe, K.; Soda, K.; Nishino, Y. Probing local distortion around structural defects in half-Heusler thermoelectric NiZrSn alloy. Sci. Rep. 2020, 10, 19820. [Google Scholar] [CrossRef]
- Rausch, E.; Castegnaro, M.V.; Bernardi, F.; Martins Alves, M.C.; Morais, J.; Balke, B. Short and long range order of Half-Heusler phases in (Ti,Zr,Hf)CoSb thermoelectric compounds. Acta Mater. 2016, 115, 308–313. [Google Scholar] [CrossRef]
- Ozkendir, O.M.; Miyazaki, H.; Gunaydin, S. Traces of Thermoelectric Properties on XAFS Spectra. J. Electron. Mater. 2022, 51, 1740–1751. [Google Scholar] [CrossRef]

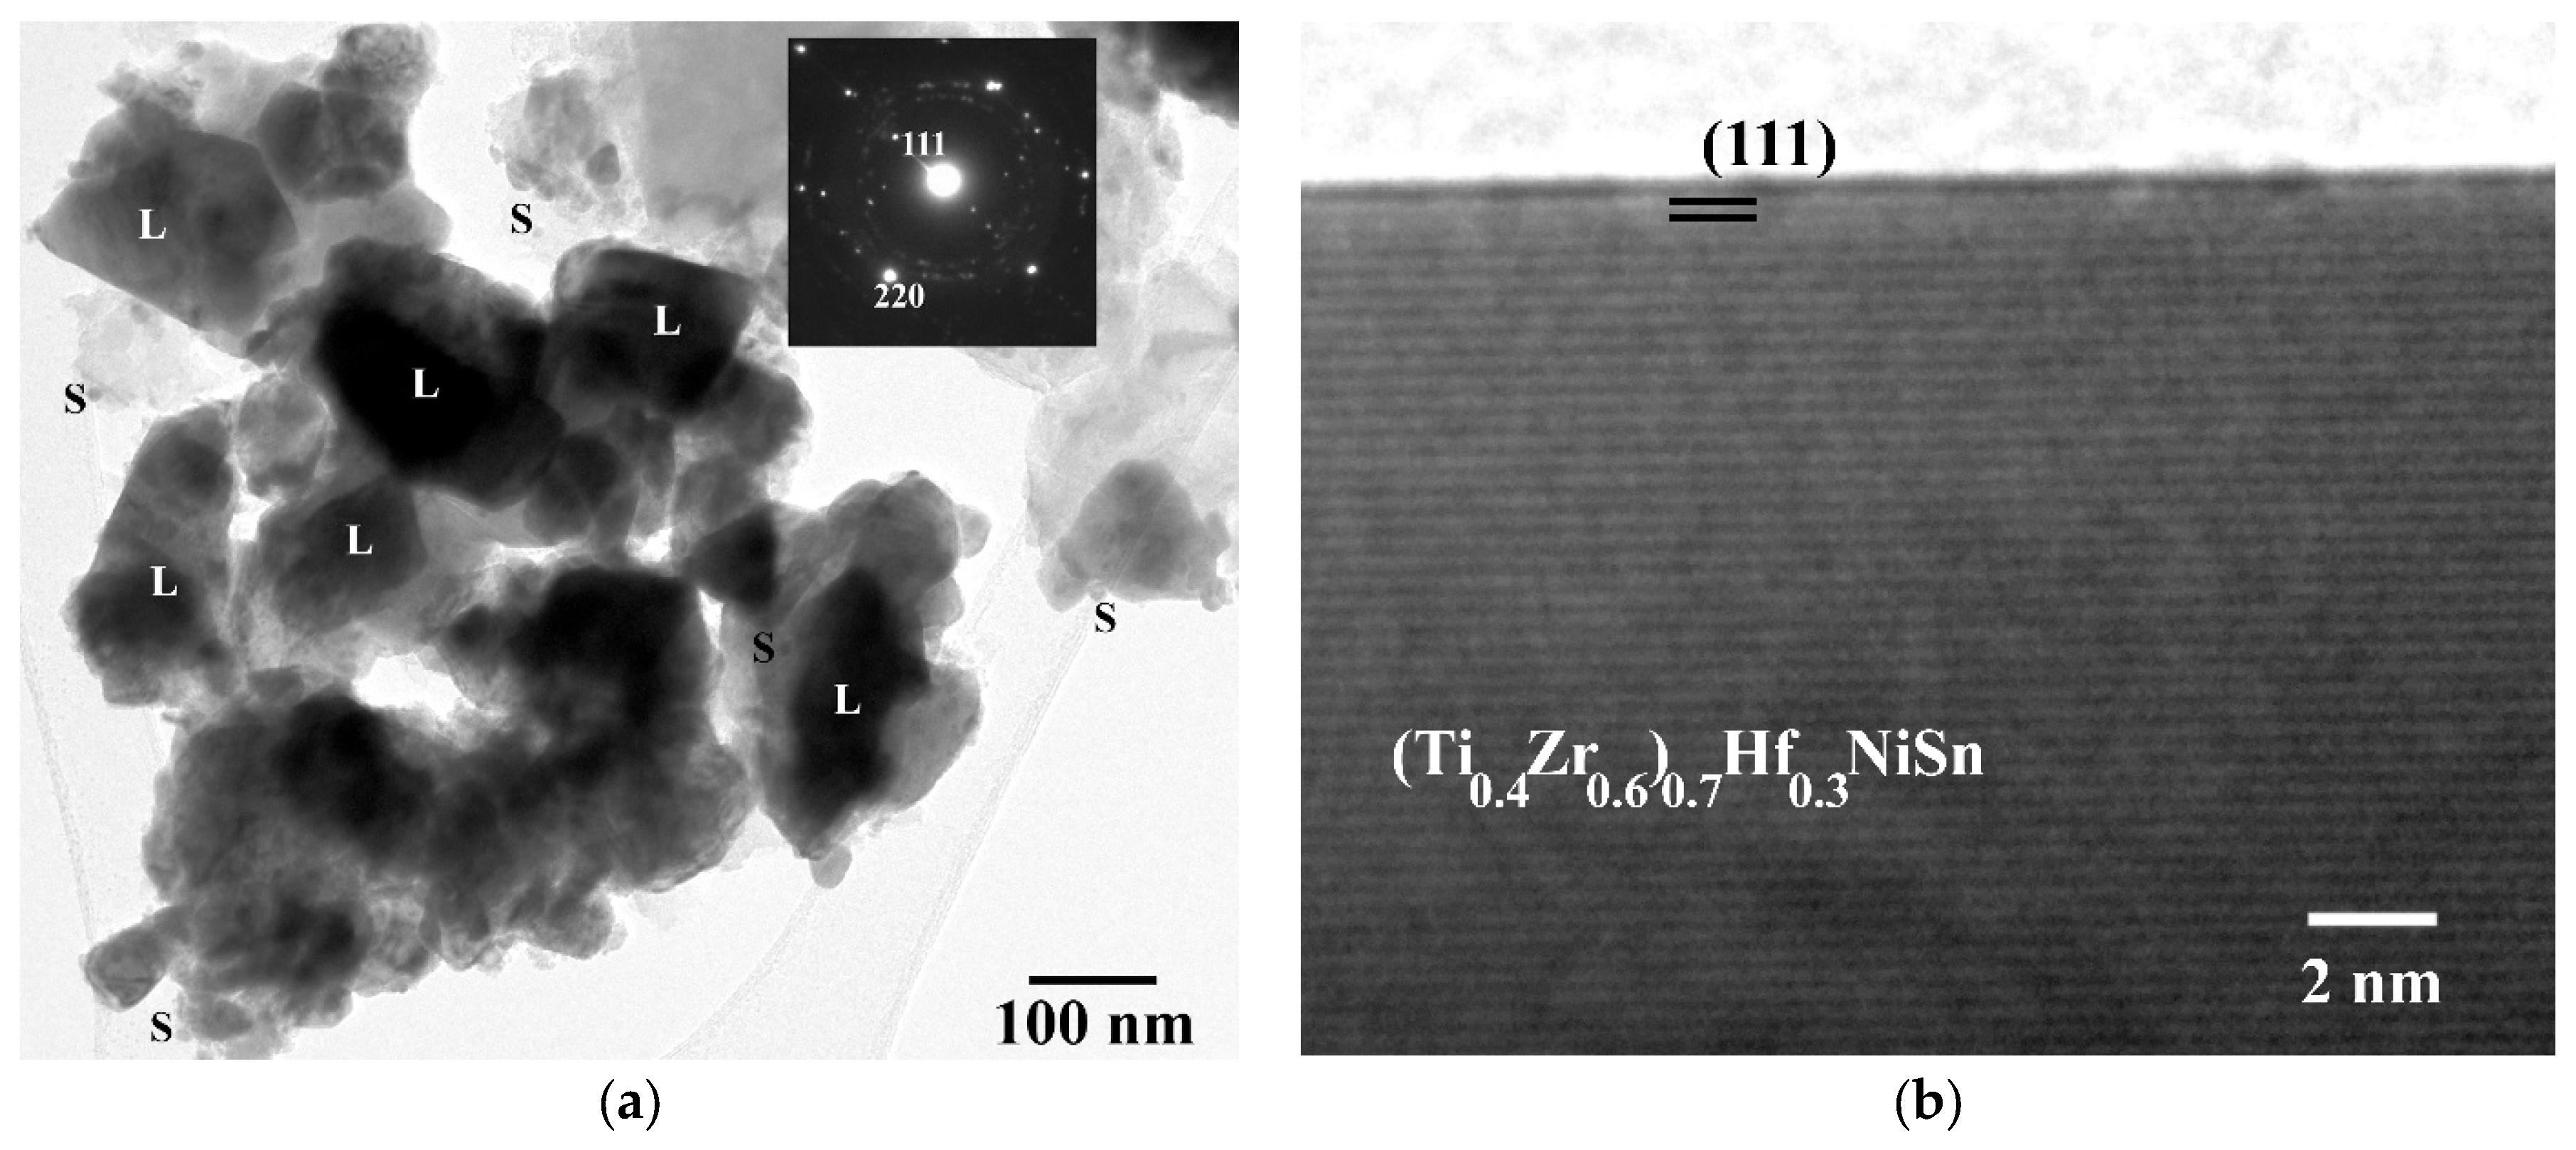
| SAD Spot | 111 | 200 | (210) | 220 | (321) | 333 |
|---|---|---|---|---|---|---|
| d-spacing (Å) | 3.501 | 3.022 | 2.696 | 2.133 | 1.611 | 1.174 |
| a (Å) | 6.064 | 6.045 | 6.029 | 6.032 | 6.027 | 6.102 |
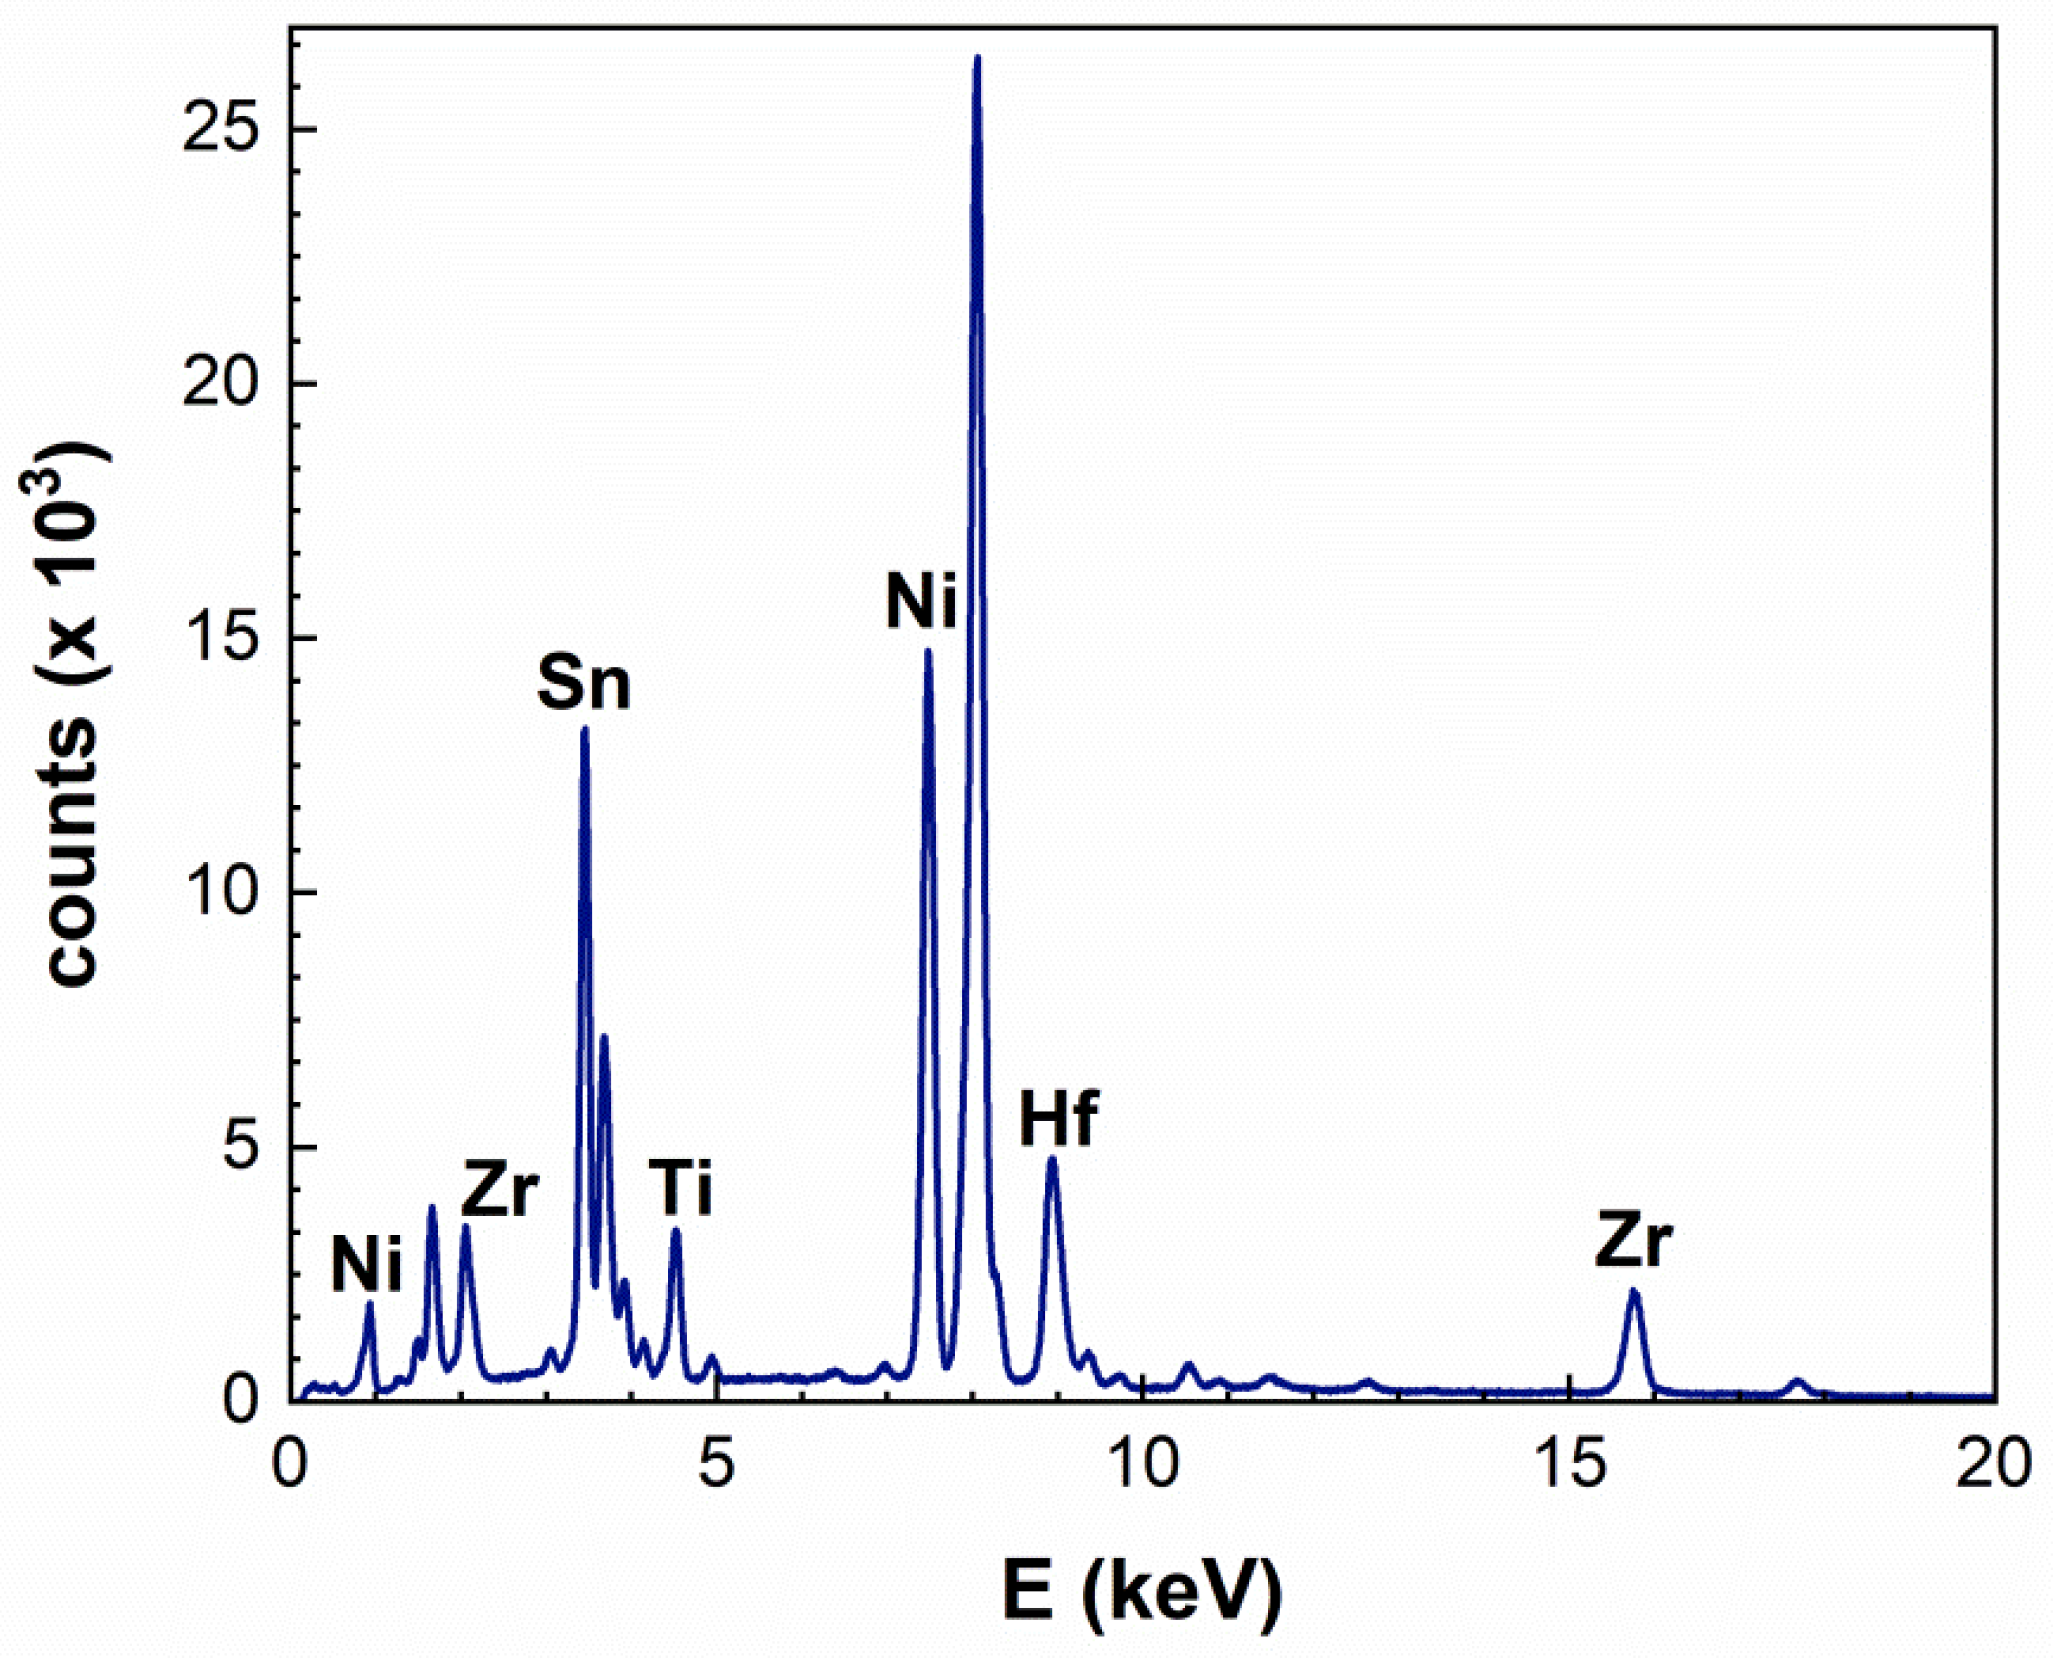
| Elements (at%) | Ti K | Zr L | Hf M | Ti + Zr + Hf | Ni K | Sn L | Sb L | Sn + Sb |
|---|---|---|---|---|---|---|---|---|
| Average | 9.6 | 10.4 | 13.8 | 33.8 | 34 | 28 | 4 | 32 |
| Nominal | 9.33 | 14 | 10 | 33.3 | 33.3 | 32.7 | 0.7 | 33.4 |
| Difference (%) | 2.9 | −25.7 | 38 | 1.5 | 2.1 | −14.4 | N/A | −4.2 |
| Average (Ni-norm.) | 0.28 | 0.31 | 0.41 | 0.99 | 1 | 0.82 | 0.18 | 0.94 |
| Nominal (Ni-norm.) | 0.28 | 0.42 | 0.3 | 1 | 1 | 0.98 | 0.02 | 1 |
| Difference (%) | 0 | −26.2 | 36.7 | −1 | 0 | −16.3 | N/A | −6 |
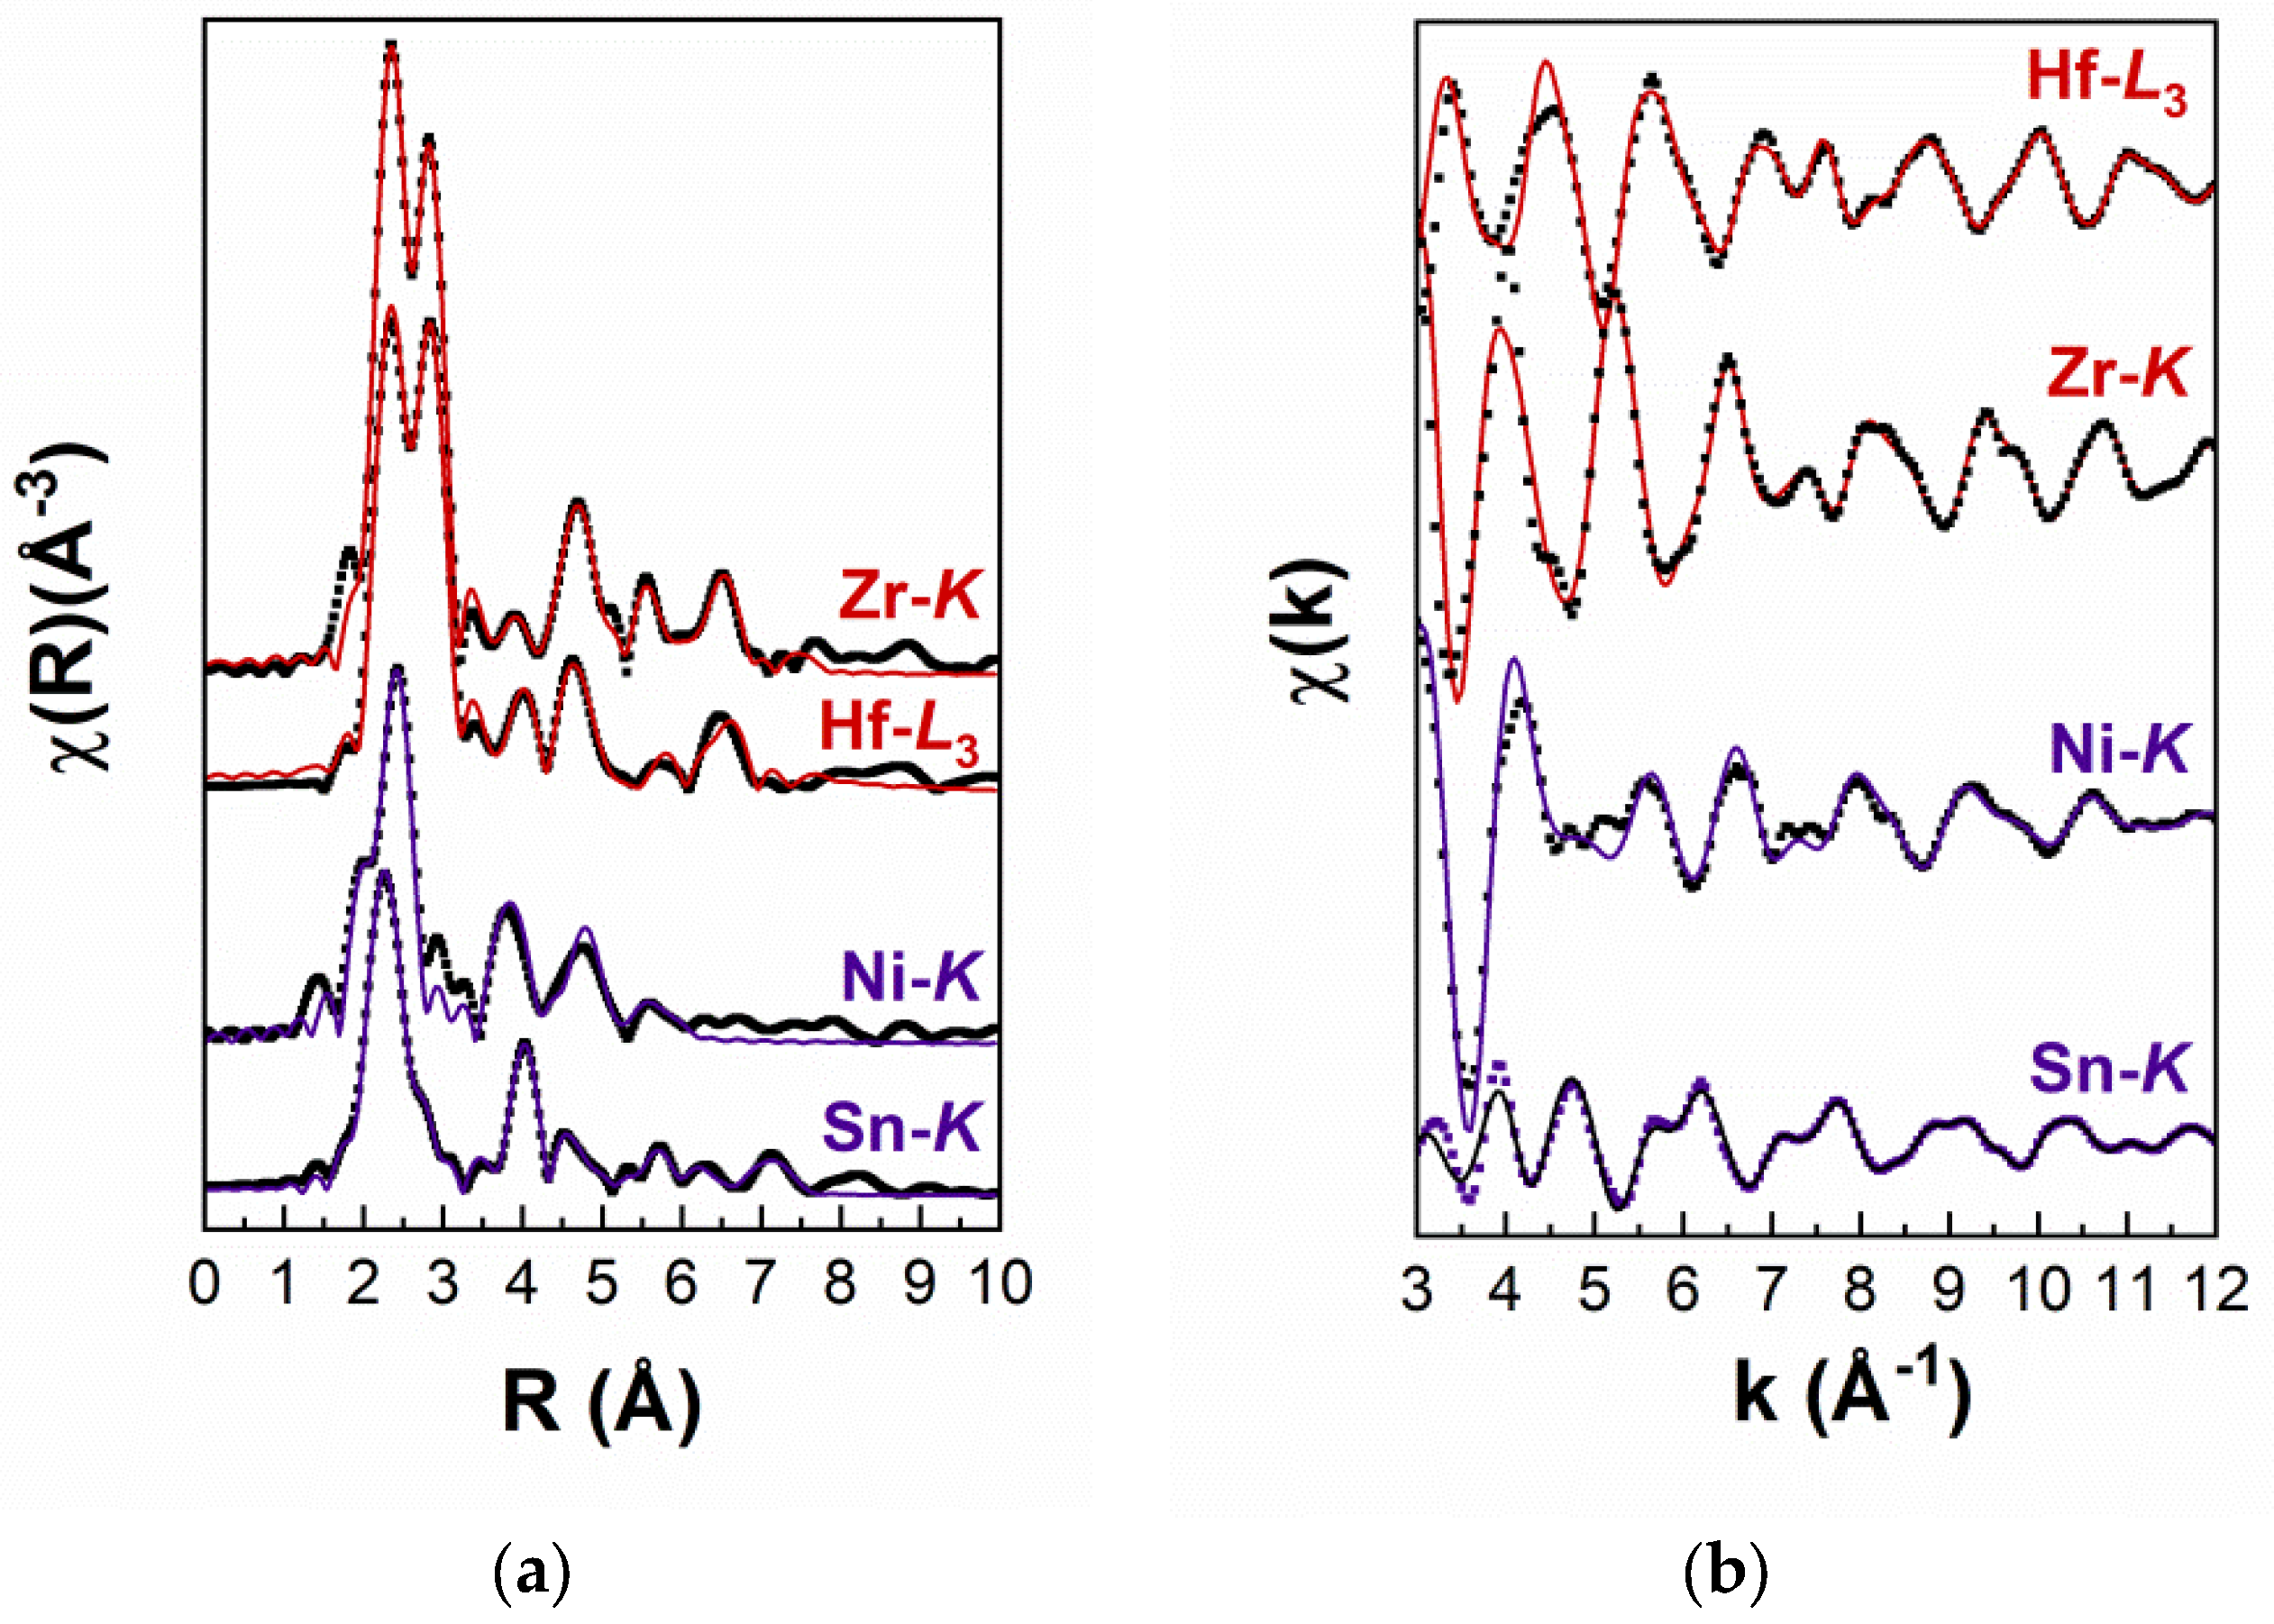
| Sn-K Edge | Ni-K Edge | Zr-K Edge | Hf-L3 Edge | ||
|---|---|---|---|---|---|
| at % Zr Atoms at % Hf Atoms | x = 45 ± 2 y = 30 ± 2 | x = 47 ± 4 y = 35 ± 4 | x = 42 ± 5 y = 29 ± 5 | x = 42 ± 3 y = 28 ± 3 | |
| 1st nn shell | Atom type | Ni | Sn | Ni | Ni |
| R (Å) (±0.01) | 2.61 | 2.60 | 2.64 | 2.61 | |
| DW (×10−3Å2) | 6.3 | 6.5 | 5.6 | 6.3 | |
| 2nd nn shell | Atom type | Zr | Zr | Sn | Sn |
| R (Å) (±0.02) | 3.05 | 2.65 | 3.05 | 3.02 | |
| DW (×10−3Å2) | 4.2 | 6.1 | 5.1 | 4.5 | |
| Atom type | Hf | Hf | |||
| R (Å) (±0.03) | 3.04 | 2.65 | |||
| DW (×10−3Å2) | 4.5 | 13.0 | |||
| Atom type | Ti | Ti | |||
| R (Å) (±0.04) | 3.05 | 2.60 | |||
| DW (×10−3Å2) | 4.5 | 4.2 | |||
| 3rd nn shell | Atom type | Sn | Ni | Zr | Zr |
| R (Å) (±0.05) | 4.29 | 4.29 | 4.27 | 4.29 | |
| DW (×10−3Å2) | 9.2 | 9.0 | 3.8 | 1.2 | |
| Atom type | Hf | Hf | |||
| R (Å) (±0.06) | 4.28 | 4.27 | |||
| DW (×10−3Å2) | 4.2 | 1.5 | |||
| Atom type | Ti | Ti | |||
| R (Å) (±0.07) | 4.27 | 4.30 | |||
| DW (×10−3Å2) | 2.9 | 2.2 | |||
| 4th nn shell | Atom type | Ni | Zr | Ni | Ni |
| R (Å) (±0.08) | 5.04 | 4.98 | 5.04 | 5.00 | |
| DW (×10−3Å2) | 18.0 | 5.5 | 4.7 | 7.6 | |
| Atom type | Hf | ||||
| R (Å) (±0.09) | 5.03 | ||||
| DW (×10−3Å2) | 1.9 | ||||
| Atom type | Ti | ||||
| R (Å) (±0.10) | 4.94 | ||||
| DW (×10−3Å2) | 3.3 | ||||
| 5th nn shell | Atom type | Zr | Sn | Sn | Sn |
| R (Å) (±0.11) | 5.18 | 4.97 | 5.04 | 5.06 | |
| DW (×10−3Å2) | 1.8 | 12.5 | 9.2 | 18.1 | |
| Atom type | Hf | ||||
| R (Å) (±0.12) | 5.20 | ||||
| DW (×10−3Å2) | 4.5 | ||||
| Atom type | Ti | ||||
| R (Å) (±0.13) | 5.17 | ||||
| DW (×10−3Å−2) | 1.9 | ||||
| 6th nn shell | Atom type | Sn | Ni | Zr | Zr |
| R (Å) (±0.14) | 5.98 | 6.01 | 3.09 | 6.01 | |
| DW (×10−3Å2) | 6.6 | 9.9 | 29.2 | 6.2 | |
| Atom type | Hf | Hf | |||
| R (Å) (±0.15) | 5.86 | 6.17 | |||
| DW (×10−3Å−2) | 2.6 | 4.9 | |||
| Atom type | Ti | Ti | |||
| R (Å) (±0.16) | 5.81 | 5.90 | |||
| DW (×10−3Å2) | 4.4 | 17.2 | |||
| 7th nn shell | Atom type | Ni | Ni | Ni | |
| R (Å) (±0.17) | 6.63 | 6.64 | 6.55 | ||
| DW (×10−3Å2) | 9.5 | 12.0 | 7.6 | ||
| 8th nn shell | Atom type | Zr | Sn | Sn | |
| R (Å) (±0.18) | 6.66 | 6.80 | 6.80 | ||
| DW (×10−3Å2) | 8.7 | 11.0 | 9.7 | ||
| Atom type | Hf | ||||
| R (Å) (±0.19) | 6.67 | ||||
| DW (×10−3Å2) | 8.7 | ||||
| Atom type | Ti | ||||
| R (Å) (±0.20) | 6.67 | ||||
| DW (×10−3Å2) | 9.3 | ||||
| 9th nn shell | Atom type | Sn | Zr | Zr | |
| R (Å) (±0.21) | 7.44 | 7.26 | 7.39 | ||
| DW (×10−3Å2) | 9.3 | 22.0 | 6.1 | ||
| Atom type | Hf | Hf | |||
| R (Å) (±0.22) | 7.27 | 7.39 | |||
| DW (×10−3Å2) | 3.8 | 4.9 | |||
| Atom type | Ti | Ti | |||
| R (Å) (±0.23) | 7.45 | 7.40 | |||
| DW (×10−3Å2) | 5.9 | 17.0 | |||
| 10th nn shell | Atom type | Ni | Ni | Ni | |
| R (Å) (±0.24) | 8.0 | 7.63 | 7.58 | ||
| DW (×10−3Å2) | 14.1 | 4.8 | 13.1 |
Disclaimer/Publisher’s Note: The statements, opinions and data contained in all publications are solely those of the individual author(s) and contributor(s) and not of MDPI and/or the editor(s). MDPI and/or the editor(s) disclaim responsibility for any injury to people or property resulting from any ideas, methods, instructions or products referred to in the content. |
© 2025 by the authors. Licensee MDPI, Basel, Switzerland. This article is an open access article distributed under the terms and conditions of the Creative Commons Attribution (CC BY) license (https://creativecommons.org/licenses/by/4.0/).
Share and Cite
Pinakidou, F.; Delimitis, A.; Katsikini, M. Probing the Structural Order of Half-Heusler Phases in Sb-Doped (Ti,Zr,Hf)NiSn Thermoelectrics. Nanomaterials 2025, 15, 1037. https://doi.org/10.3390/nano15131037
Pinakidou F, Delimitis A, Katsikini M. Probing the Structural Order of Half-Heusler Phases in Sb-Doped (Ti,Zr,Hf)NiSn Thermoelectrics. Nanomaterials. 2025; 15(13):1037. https://doi.org/10.3390/nano15131037
Chicago/Turabian StylePinakidou, Fani, Andreas Delimitis, and Maria Katsikini. 2025. "Probing the Structural Order of Half-Heusler Phases in Sb-Doped (Ti,Zr,Hf)NiSn Thermoelectrics" Nanomaterials 15, no. 13: 1037. https://doi.org/10.3390/nano15131037
APA StylePinakidou, F., Delimitis, A., & Katsikini, M. (2025). Probing the Structural Order of Half-Heusler Phases in Sb-Doped (Ti,Zr,Hf)NiSn Thermoelectrics. Nanomaterials, 15(13), 1037. https://doi.org/10.3390/nano15131037