Article

Enhancing Stability and Emissions in Metal Halide Perovskite Nanocrystals Through Mn2⁺ Doping

by
Thi Thu Trinh Phan
1,
Thi Thuy Kieu Nguyen
1,
Trung Kien Mac
2 and
Minh Tuan Trinh
1,*
1
Chemistry and Biochemistry Department, Utah State University, 300 Old Main Hill, Logan, UT 84322, USA
2
Physics Department, Utah State University, 300 Old Main Hill, Logan, UT 84322, USA
*
Author to whom correspondence should be addressed.
Nanomaterials 2025, 15(11), 847; https://doi.org/10.3390/nano15110847
Submission received: 1 May 2025 / Revised: 27 May 2025 / Accepted: 29 May 2025 / Published: 1 June 2025
(This article belongs to the Special Issue Recent Advances in Halide Perovskite Nanomaterials)

Abstract

:
Metal halide perovskite (MHP) nanocrystals (NCs) offer great potential for high-efficiency optoelectronic devices; however, they suffer from structural softness and chemical instability. Doping MHP NCs can overcome this issue. In this work, we synthesize Mn-doped methylammonium lead bromide (MAPbBr3) NCs using the ligand-assisted reprecipitation method and investigate their structural and optical stability. X-ray diffraction confirms Mn2⁺ substitution at Pb2⁺ sites and lattice contraction. Photoluminescence (PL) measurements show a blue shift, significant PL quantum yield enhancement, reaching 72% at 17% Mn2⁺ doping, and a 34% increase compared to undoped samples, attributed to effective defect passivation and reduced non-radiative recombination, supported by time-resolved PL data. Mn2⁺ doping also improves long-term stability under ambient conditions. Low-temperature PL reveals the crystal-phase transitions of perovskite NCs and Mn-doped NCs to be somewhat different than those of pure MAPbBr3. Mn2⁺ incorporation into perovskite promotes self-assembly into superlattices with larger crystal sizes, better structural order, and stronger inter-NC coupling. These results demonstrate that Mn2⁺ doping enhances both optical performance and structural robustness, advancing the potential of MAPbBr3 NCs for stable optoelectronic applications.

Graphical Abstract

1. Introduction

Metal halide perovskites (MHP) nanocrystals (NCs) or quantum dots are gaining significant interest due to their intriguing optical and physical properties, including bandgap tunability via tuning NC size and chemical compositions, high radiative recombination rate, defect tolerance, high absorption coefficient, high photoluminescence (PL) quantum yield, long-range coherent coupling, and strong Coulomb interaction [1,2,3,4]. These excellent properties offer MHP NCs as building blocks for developing highly efficient optoelectronic devices, for example, light-emitting diodes [5,6], photodetectors [7], photovoltaic cells [8,9,10], lasers [11,12], and single-photon sources [4,13,14]. Three-dimensional MHPs generally have a structure of ABX3, where A is a cation and can be Cs+ or methylammonium CH3NH3+ (MA), B is a divalent metal ion like Pb2+ or Sn2+, and X is a halide anion (X = I, Br, Cl). At room temperature, the crystal adopts a cubic phase, consisting of a cubic array of corner-sharing BX6 octahedra, with the A-site cation located within the cuboctahedral cavities. High synthesis yields can be achieved using established methods such as hot injection or ligand-assisted reprecipitation (LARP) [15,16]. The most common perovskite NCs are CsPbX3 and MAPbX3, because of their ease of synthesis. However, MHP structures are soft and chemically unstable; with dynamic and weak surface–ligand binding and susceptibility to anion exchange reactions, their stability has always been a large concern and challenge. MHP NCs are affected by external factors such as light, humidity, ambient temperature, and proton exchange reactions, leading to a decrease in the photoluminescence quantum yield (PLQY) over time, hindering their practical applications. Several strategies have been proposed and implemented to improve the optoelectronic performance of MHP NCs, such as surface passivation, heterostructure formation, A-site doping, B-site doping, and core/shell structures [17,18,19,20]. B-site doping is an effective strategy for enhancing the PLQY of MHP NCs, offering a straightforward synthesis process that preserves the integrity of the perovskite structure. In addition, B-site doping also enables the emergence of new physical phenomena and allows for precise tuning of the optical and electronic properties of the material [20,21,22,23,24,25,26]. Wang et al. doped Eu3+ into CsPbCl3, and the positions of typical emission bands were tuned by adjusting the Eu3+ ion doping amount [27]. In general, metallic ions such as Co2+, Cu2+, Mn2+, Fe2+, and rare earth ions are suitable for B-site dopants into MHP NCs; enhancing their optoelectronic properties hold promise for their applications in highly efficient optoelectronic devices [28,29,30,31,32]. Among them, Mn2+ is the most sought after, due to its unique chemical and physical properties, such as exhibiting bright and stable PL, introducing magnetic and spintronic properties, and enhancing the optical stability of perovskite materials [21,22,33,34,35,36]. Not all metallic ions can be doped into perovskites. With the structure ABX3, the Goldschmidt tolerance factor, t = r A + r X 2 × ( r B + r X ) , should be in the range of 0.76–1.13 to ensure the three-dimensional perovskite structure, where rA, rB, and rX are the radii of atoms A, B, and X, respectively [37,38]. The doped metal species are also constrained by the octahedral coefficient μ, defined by μ = r B / r X ; the stability range for μ is between 0.44 and 0.89 [39,40]. The incorporation of Mn2+ into APbX3 perovskite crystal lattice at an optimal concentration would increase the tolerance factor, improve the structural stability, and enhance the radiation pathways [37,38]. Liu et al. elucidated the role of the relative strengths of the Mn-Cl bond in the precursor and host lattice in incorporating Mn2+ ions into perovskite CsPbX3 NCs. They successfully doped Mn2+ into CsPbCl3 NCs and observed a dual-band emission, which originated from the energy transfer between the Mn2⁺ ion and the host [41]. In addition, cation dopants can suppress non-radiative (NR) recombination due to effectively passivating surface and structural defects, leading to an increase in the PLQY of perovskite NCs [35,42]. The mechanism of Mn2+ doping is explained through the dynamic exchange of cations and halogen anions. The homologous bond dissociation between Mn-X (halogen) and Pb-X is extremely important, and enables the successful substitution of Pb2+ by Mn2+ [43,44].
Most Mn2+-doped MHP NCs, particularly CsPbBr3 and CsPbI3, have been synthesized using a hot injection method. While this approach yields high-quality NCs, it requires a high reaction temperature and the precise control of temperature and reaction time and poses significant challenges for scale-up. In this study, we synthesized Mn2+-doped MAPbBr3 NCs using a simple method, ligand-assisted reprecipitation, at room temperature. We observed PLQY improvement in MAPbBr3 NCs with Mn-dopant, reaching an optimal value of 72% at 17% Mn2+, an increase of 34% compared to the undoped sample. Mn2+ doping can passivate the defects of NCs, replacing the vacancy of cation sites without changing the structure of the perovskite material, resulting in significantly improved optical stability. In addition, to investigate the effect of Mn2+ on the optical and structural stabilities, we monitor the long-term stability of the sample under ambient conditions, assess optical properties at low temperatures, and grow NC superlattices from non-doped and Mn-doped MAPbBr3 NCs. The improvement in NC quality when using Mn2+ doping is a promising strategy for growing superlattices of MAPbBr3 NCs via a self-assembly process.

2. Materials and Methods

2.1. Materials

Lead (II) bromide (99%), methylamine bromide (CH3NH2Br), manganate (II) bromide (99%), n-octylamine (≥99%), oleic acid (≥90%), N,N-dimethylformamide (DMF), and toluene, didodecyldimethylammonium bromide (DDAB, 98%) were purchased from Sigma-Aldrich (Merck KGaA, Darmstadt, Germany).

2.2. Synthesis of Mn-Doped MAPbBr3 NCs

The method we used to synthesize xMn-CH3NH3PbBr3 NCs was ligand-assisted reprecipitation (LARP), where x is the mole percentage in the precursors. First, 0.2 mmol of CH3NH3Br, 0.2(1−x) mmol of PbBr2, and 0.2x mmol of MnBr2 (x = 0, 0.05, 0.1, 0.15, 0.17, 0.2, and 0.25) were mixed in 5 mL of DMF with 40 μL of oleylamine (OLA) and 400 μL of oleic acid (OA) to generate a precursor solution for the standard manufacturing of MAPbBr3 NCs. After that, at room temperature, the precursor solution was injected into toluene at a 1:10 volume ratio. The reaction was left for 10 min to form colloidal MAPbBr3 NCs. The product was then centrifuged at 7000 rpm for 10 min. The large crystal aggregated at the bottom was removed. The upper fraction was then further centrifuged at 20,000 rpm for 2 h to discard the supernatant. The bottom containing NCs was then diluted in toluene to make a NC solution. Since the exact amount of Mn2⁺ incorporated into the perovskite lattice is unknown, we name the Mn-doped samples as xMn-MAPbBr3, where x is the molar ratio of Mn to the total (Pb+Mn).

2.3. Surface Passivation

A mixture of 9.2 mg of dimethyldidodecylammonium bromide (DDAB) in toluene (2 mL) was prepared to have a solution of DDAB in toluene (0.01 M). Then, 200 μL of the purified xMn-MAPbBr3 NCs and 10 μL of DDAB solution (0.1 M) were mixed and stirred for 1 h at room temperature [45]. We discarded the supernatant and dispersed the precipitate in 5 mL of toluene.

2.4. Preparation of NC Superlattice

xMn-MAPbBr3 (x = 0 and x = 0.17) NC solutions were used to form a superlattice via the self-assembly method through the gradual evaporation of the solvent. The square pieces of silicon substrate <P-111> 1 cm × 1 cm were placed in a glass Petri dish of a diameter of 90 mm. Approximately 50 μL of the NC solution was dropped onto the Si substrate. To protect it from ambient light and air currents, the Petri dish was covered with a glass lid and loosely wrapped in foil. The superlattice was formed in about 8 to 10 h [45].

2.5. Characterizations

X-ray diffractions (XRD) were recorded using an X-ray diffractometer (Rigaku Corp. Tokyo, Japan, Cu Kα with λ = 1.54056 Å, 40 kV, and 40 mA). The samples were prepared by drop-casting NC solution onto a silicon substrate, <P-111>, for measurements.
Atomic force microscopy (AFM) imaging was performed to measure the thickness and morphology of MAPbBr3 superlattice, using a silicon tip operating in semi-contact mode from NTEGRA Spectra II (NT-MDT Inc., Moscow, Russia).
Photoluminescence (PL) confocal scanning: The measurement device was equipped with a confocal laser microscope. The excitation and collection were carried out with a 100x-long working distance objective with a numerical aperture of 0.67. The sample was excited via the femtosecond laser pulses at a wavelength of 400 nm or 800 nm, with a pulse duration of <100 fs and a repetition rate of 80 MHz (Mai Tai, Spectra Physics, Newport Corporation, Irvine, CA, USA). The PL image was captured using a Galvo mirror scanning system (Thorlabs, Newton, NJ, USA), and the PL signal was recorded using an EM-CCD camera.
Optical Spectroscopy: The absorption spectra were measured with a UV-VIS spectrophotometer (Shimadzu RF-5301PC, Kyoto, Japan). A femtosecond laser pulse at 400 nm was used to excite the sample for PL spectral measurements. Using a 10× magnification objective for excitation and collection through a long-pass chromatic mirror and color filter, an Ocean Optics spectrometer (Ocean Insight, Orlando, FL, USA) was also used for this measurement. Time-resolved photoluminescent (TRPL) dynamics were obtained using time-correlated single photon counting (TCSPC), PicoHarp300 (PicoQuant, Berlin, Germany). The samples for PL and TRPL measurements were prepared by drop-casting NC solution onto a silicon substrate.

3. Results and Discussion

3.1. Structural Characterization of Mn-Doped MAPbBr3 NCs

The one-pot synthesis of Mn-doped MAPbBr3 perovskite NCs using ligand-assisted reprecipitation (LARP) is described in Section 2.2. Briefly, a mixture of precursors including MABr, PbBr2, MnBr2 (x molar fraction), OLA, and OA with the desired stoichiometric molar concentrations in a polar DMF solvent was injected into a non-polar anti-solvent toluene container under vigorous stirring at room temperature. The crystal growth is due to a reduction in solubility via the anti-solvent, leading to supersaturation and fast nucleation (Figure 1a). The ligands (OA and OLA) prevent uncontrolled aggregation, provide colloidal stability, and passivate the crystal surface. This synthesis method is simple, a room temperature process, and scalable. The NC size can be controlled via the reaction temperature (see Figure S2 Supporting Information). In the Mn-doped perovskite, Mn2+ substitutes for the Pb2+ cation site. The perovskite structure is maintained even though the cell size is decreased because of the smaller atomic size of Mn2⁺ compared to Pb. The shrinkage of the crystal lattice is reflected in a shift in the XRD pattern. The Mn2+ ions directly participate in the nucleation process to form MAPb1−yMnyBr3 NCs, within the limit of the Mn2+ concentration, allowing the perovskite structure to be stable. This can be confirmed through the calculation of the tolerance factor and octahedral factor of the perovskite [37,38,46]. These considerations reflect a trade-off between the colloidal stability and the successful incorporation of Mn2+ ions.
Figure 1 presents the XRD patterns of xMn-MAPbBr3 NCs for various Mn2+ concentrations. There are two strong diffraction peaks at around 15.2° and 30.4°, corresponding to the (100) and (200) for both pure and Mn2+-doped MAPbBr3, confirming the cubic phase of perovskite crystal at room temperature [47,48] (see the similar XRD pattern of the MAPbBr3 single crystal and NCs in the Supporting Information, Figure S1). No secondary peaks were observed on the XRD patterns, and the shift in the XRD peaks confirms the effective incorporation of Mn2+ into the MAPbBr3 lattice. The XRD peak shift increases with the increasing doping concentration up to 20% of Mn2⁺, which indicates the incorporation of Mn2+ into the crystal lattice. It has been reported that doping can induce structural evolution, especially when the size mismatch between the dopant atom and the substituted atom is large, but the small distortion here shows that the lattice contraction and octahedral tilt are not strong enough to produce a discernible structural change [49]. The XRD peak shift to a larger angle is shown in Figure 1c, with an increasing dopant concentration because of the contraction of the lattice due to the replacement of higher crystal radii Pb2+ ions (1.12–1.19 Å) by smaller Mn2+ ions (0.8 Å) [50,51,52]. However, at x = 0.25, the XRD behavior is different. It shifts to a lower angle and a small new peak appears at 28.5°. The different behavior of the XRD shift at x = 0.25 is unclear; it could be at a high Mn2⁺ concentration the Mn2+ ions do not substitute Pb2+ ions, but rather form segregated crystal phases of MAPbBr3 and MAMnBr3, which will lead to a lower PLQY. A higher Mn2+ concentration pushes the tolerance factor and octahedral coefficient, which are in the range of 0.76–1.13 and 0.44–0.89, respectively [36,37], out of the stable range. The calculated tolerance factor and octahedral coefficient for MAPbBr3 and MAMnBr3 are given in the Supporting Information. Further research is needed to reveal the crystal structures at high Mn2⁺ concentrations.
At room temperature, the MAPbBr3 crystal has the cubic phase, and the lattice parameter a is calculated from the XRD peak (200) using the formula [53]: a = d .   h 2 + k 2 + l 2 , where (h k l) are the Miller indices and d is the interplanar spacing, which is calculated using Bragg’s law nλ = 2d.sinθ. In the XRD, θ is the diffraction angle and λ is the wavelength of the incident X-ray (1.54 Å for Cu Kα) for the first-order diffraction n = 1. In Figure 1c, the calculated lattice parameter decreases with increasing Mn2⁺ concentrations, except for the 25% Mn2⁺ dopant. This indicates that the smaller dopant Mn2+ ions are substituting for Pb2+ ions, causing the contraction of the lattice. This observation is consistent with Vegard’s law, which states that the lattice parameter changes linearly with composition of a solid [54].

3.2. Optical Characterization of Mn-Doped MAPbBr3 NCs

Figure 2 presents the optical characterizations of xMn-MAPbBr3, with the Mn2+ concentration increasing from x = 0 to 0.25. We observe a gradual blue shift in the emission wavelength from 517 to 492 nm, in agreement with the previous observations [55]. The absorption, emission, and PLQY measurements were carried out on NCs in toluene solutions. The incorporation of Mn2+ ions in the crystal lattice may also perturb the electronic band structure of the perovskite crystal causing spectral shift, although it does not introduce new energy levels. While Mn-dopant in CsPbCl3 introduced new energy levels and dual-band emissions arose [21,56], the absence of Mn2+ emissions in Mn-doped CsPbBr3 or MAPbBr3 was due to the negligible difference between the 4T1 and 6A1 band gap of the d-state of Mn2+ ions and the transition band gap of pure APbBr3 crystals [57,58,59].
As the Mn2+ doping concentration increases, the PLQY increases from 38% for the pure MAPbBr3 to 72% for the 17% Mn2+ concentration. Further increasing the Mn2+ doping concentration results in a drop in the PLQY. At 25% of Mn2+, the PLQY is 49% (Figure 2b). The significant PLQY enhancement with increasing Mn2+ concentration to MAPbBr3 NCs indicates the efficient reduction in NR recombination pathways. It has been suggested that Mn2+ ions fill the Pb2+ vacancies and passivate the dangling bonds and defects of the crystal surface [55]. Further increasing the Mn2+ concentration above 20% leads to a decrease in the PLQY, possibly due to the strong distortion of the crystal lattice introducing new defects, or may result in the segregation phase of MAPbBr3 and MAMnBr3, forming domain boundaries and defects as the reverse change in the XRD shift (Figure 1c).
To have better insight into the reduction in NR recombination pathways induced by Mn2+ doping, we measure the time-resolved PL (TRPL) dynamics at various Mn2+ concentrations, as shown in Figure 2c. The measurements were performed on thin films, and the resulting dynamics reveal two decay time constants corresponding to radiative and NR recombination. For simplicity, we assume that the radiative rate remains constant across different Mn2+ concentrations. We performed global fitting of the dynamics, keeping the radiative lifetime fixed for all traces. The fit is used a biexponential function,
I ( t ) = A 1 exp ( t τ 1 ) + A 2 exp ( t τ 2 ) ,
where (A1, τ 1 ) and (A2, τ 2 ) are the amplitudes and lifetimes of NR and radiative decay channels, respectively. The obtained fitting constants are displayed in Figure 2d, and the radiative lifetime is 7.8 ± 0.1 ns for all traces. The NR lifetime increases from 1.4 to 1.7 ns (at x = 0.1, 0.15, and 0.17), further increasing the Mn2⁺ concentration results in the reduction in the NR lifetime. The radiative lifetime of excitons in perovskite NCs has been reported to vary largely from a few to tens of ns, depending on the NC size and excitation conditions. The NR lifetime was reported to be ~1.5 ns, in agreement with our observation [60,61]. The most important observation here is the percentage of the NR amplitude constant, A1. This represents the weight of the NR channel. As can be seen, the weight of NR recombination is 76% for non-doped NCs and drops to 51% at x = 0.15, and rises to ~87% at x = 0.2 and 0.25. The lowest NR component at x = 0.15 is consistent with the maximum PLQY at x = 0.17. It is worth noting that while the PLQY measurements were performed on solution samples, the TRPL dynamics were measured on NC films, which may lead to some discrepancies between the two measurements. Mn2⁺ doping, at an optimal concentration, effectively reduces non-radiative recombination by filling Pb2⁺ vacancies and passivating defects and dangling bonds. Perovskite materials are intrinsically soft and ionic, which makes them prone to ion migration and phase segregation. Since Mn2⁺ has a smaller ionic radius than Pb2⁺, it can substitute for Pb in the lattice, leading to a more compact and rigid crystal structure that enhances overall stability. Moreover, Mn doping helps to suppress halide ion migration by anchoring halide ions or introducing lattice distortions that act as barriers to ion movement. It also passivates halide vacancies and reduces deep-level defects, thereby improving optical quality and enhancing the long-term durability of the perovskite structure [62,63].

3.3. Optical Stability of Mn-Doped MAPbBr3 NCs

As discussed above, Mn2⁺ doping in MAPbBr3 NCs enhances the PLQY by reducing non-radiative decay channels. Mn2⁺ doping also improves the long-term optical stability. Figure 3 shows the PL stability of MAPbBr3 NC films stored under ambient conditions over 180 h. The as-synthesized xMn-MAPbBr3 NCs exhibit PL intensity degradation, with the PL intensity retaining only 12% and 52% of the initial value for x = 0 and x = 0.17, respectively. This result indicates that Mn-doped perovskite NCs are significantly more stable than their undoped counterparts. To further enhance the optical stability, we treated the NCs with DDAB. After 180 h under ambient conditions, the PL intensities of the DDAB-treated NCs with x = 0 and x = 0.17 retained 62% and 72% of their original values, respectively, as shown in Figure 3b. A previous study showed that DDAB surface passivation effectively reduces the surface and defect states, enhances optical stability against light-induced PL quenching, and improves long-term stability [64]. The DDA⁺ cations can replace the native oleic acid and oleylamine ligands on the NC surface or fill in for missing ligands, thereby protecting the NCs from environmental factors such as humidity, oxidation, and other external degradation sources. Therefore, Mn2⁺ doping improves the PLQY and the optical stability of MAPbBr3 NCs by filling Pb2⁺ vacancies, passivating defects, reducing ion migration due to the stronger Mn–X bonds compared to Pb–X bonds, and enhancing the overall crystal robustness by minimizing lattice distortion.

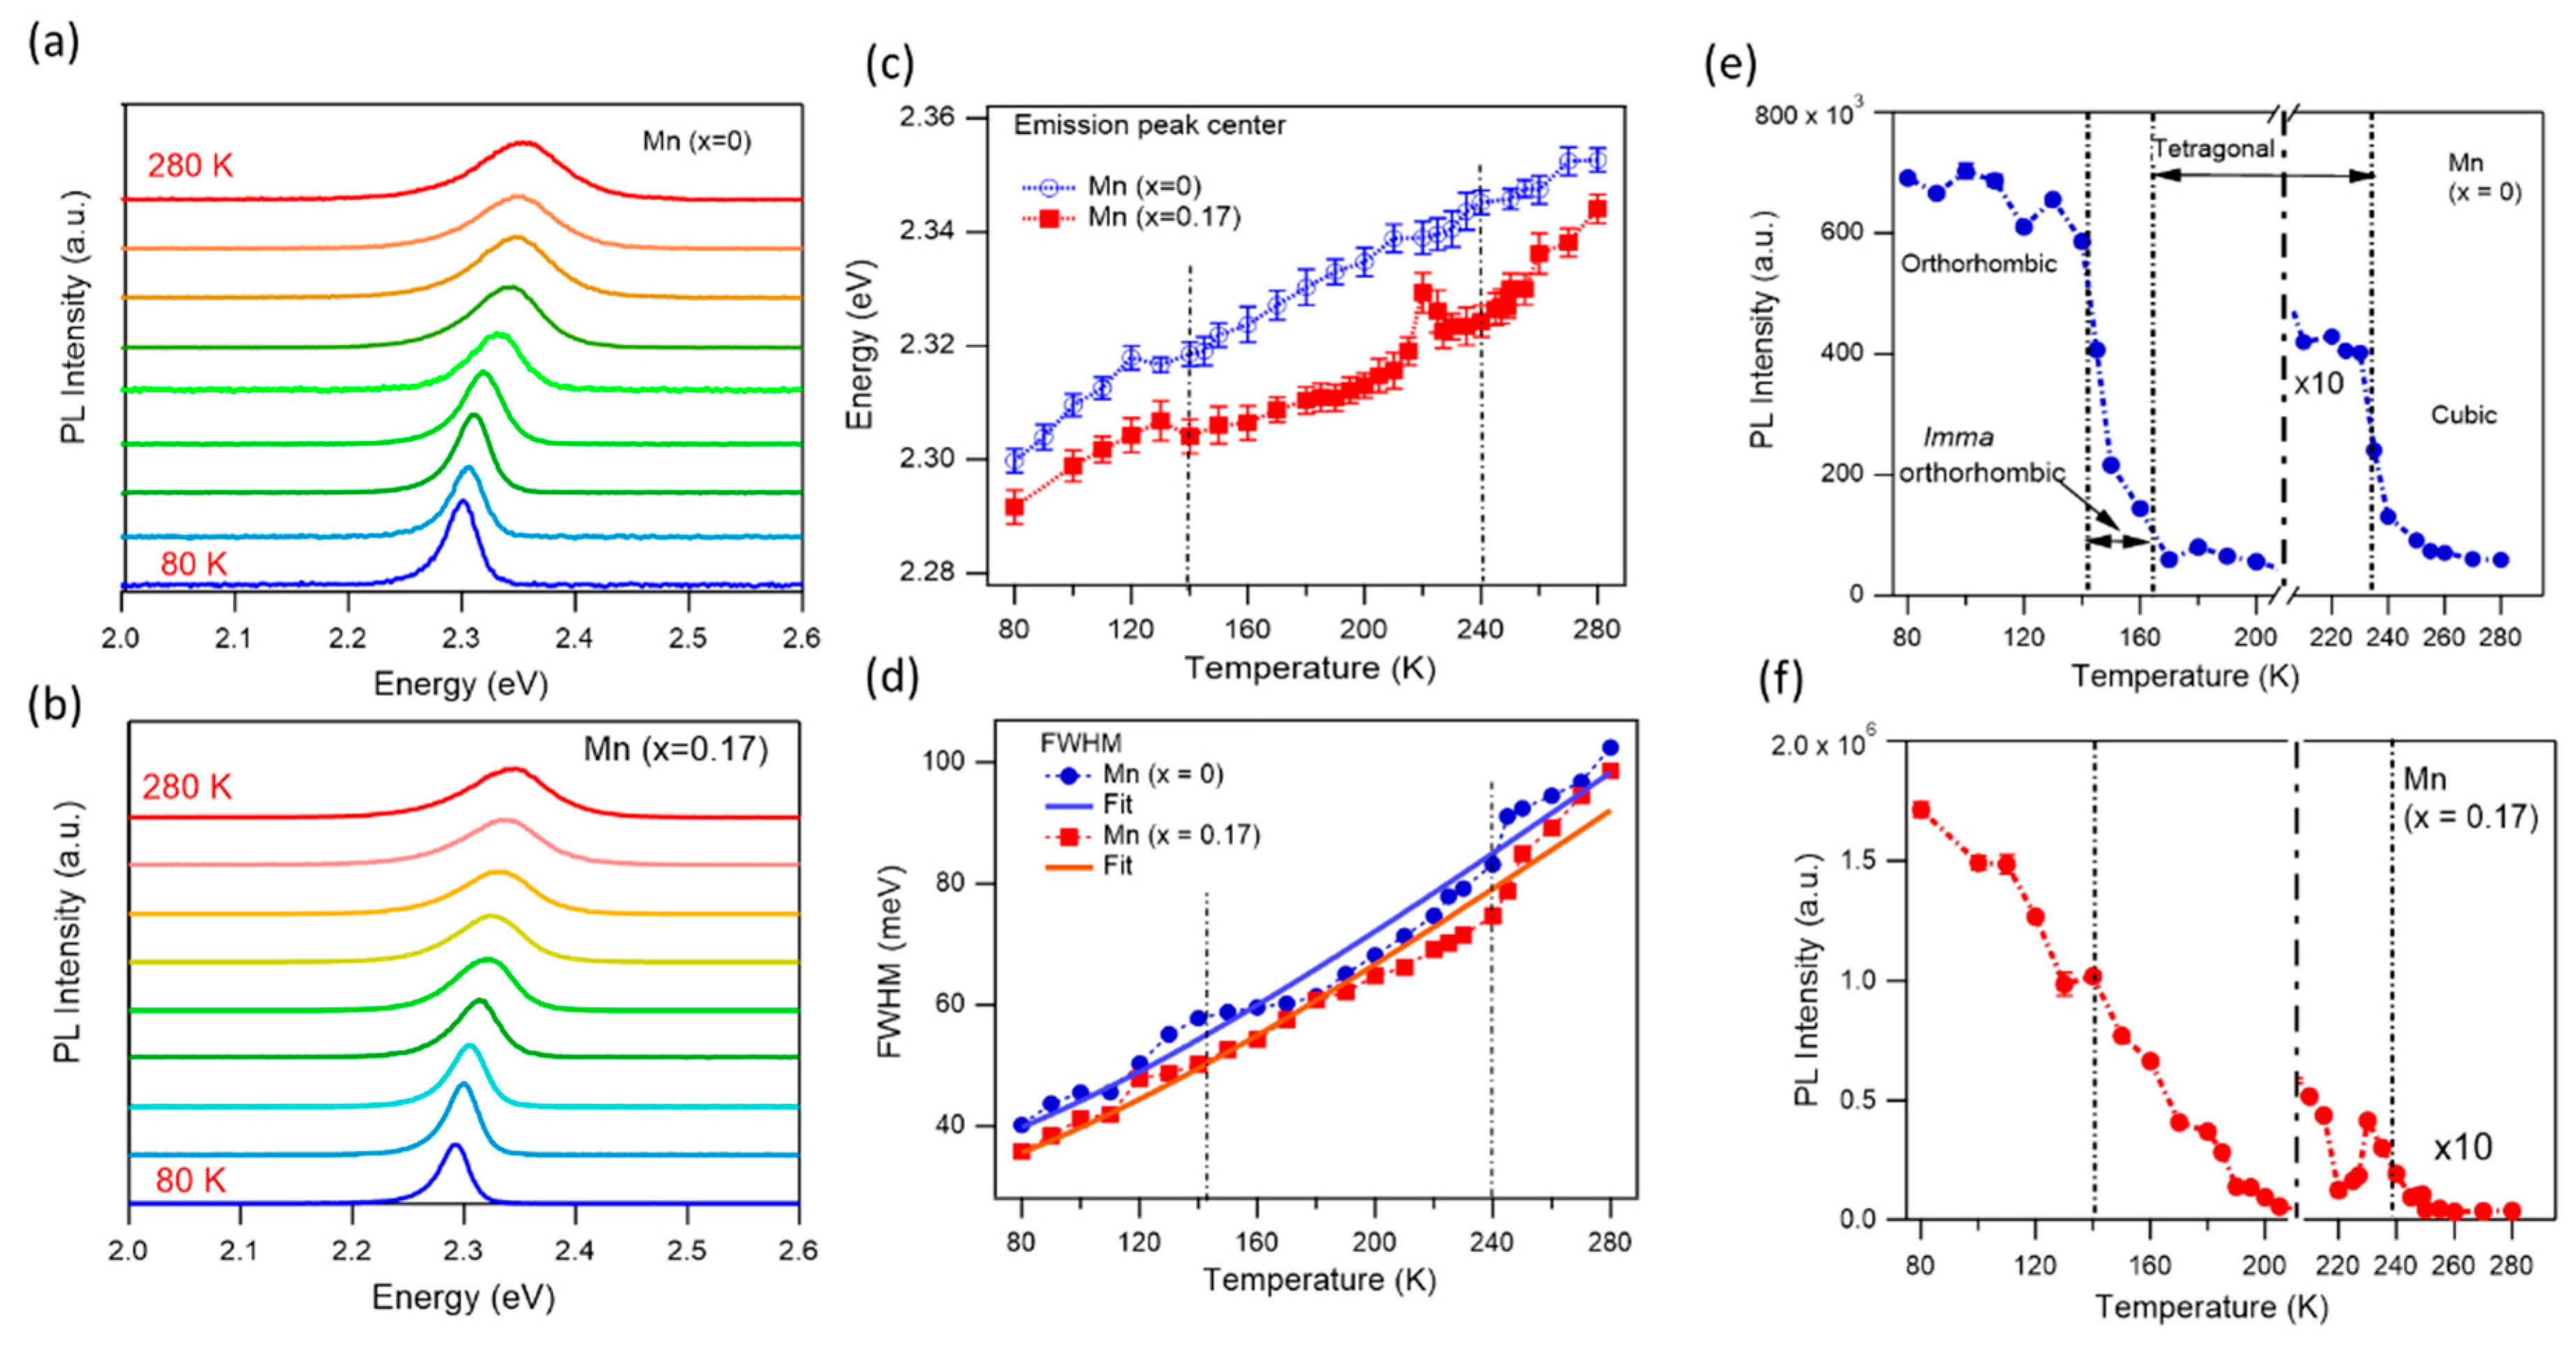
3.4. Optical Properties at Low Temperature and Crystal Phase Transitions

Incorporating Mn2+ into MAPbBr3 NCs may also affect crystal structure, therefore affecting crystallographic phases and phase transition temperatures. To investigate optical properties at different crystal phases, we measure the PL spectra from 80 K to 280 K for two samples, non-doped and 17% Mn-doped NCs. The latter case exhibits the highest PLQY for Mn-doped samples. Figure 4 presents the PL spectra, PL intensities, wavelengths, and line widths of these two samples at different temperatures. Similarly to previous observations in MHP NCs, the PL intensities decreased, the maximum PL peak blue shifted (emission energy increased), and the spectral line width broadened with increasing temperatures [65,66]. Notably, the observed blue shift in PL with increasing temperature is opposite to the typical behavior seen in conventional semiconductors, where lattice expansion generally leads to a red shift. In conventional semiconductors, the valence band maxima (VBM) and conduction band minima (CBM) arise from bonding and antibonding orbital pairs, respectively. As the temperature increases, thermal expansion causes the crystal lattice to dilate, resulting in a reduction in the bandgap energy, which can be described using the Varshni equation [67]. In contrast, the electronic structure of MAPbBr3 crystals is fundamentally different. The VBM originates from a strong antibonding interaction between the Pb 6s and Br 4p orbitals, while the CBM arises from an antibonding combination of the Pb 6p and Br 4s orbitals [40,65,68]. As the lattice expands with temperature, the VBM shifts downward in energy due to its antibonding nature (weakened antibonding interactions between atoms), whereas the CBM is relatively insensitive to lattice deformation. This asymmetry leads to an overall increase in the bandgap with temperature. Both undoped and Mn-doped MAPbBr3 NCs exhibit similar temperature-dependent behavior. However, an anomalous behavior is observed in Mn-doped MAPbBr3 at around 220 K, where a sharp blue shift is followed by a red shift at 227 K. This irregular trend coincides with a threefold drop in PL intensity in the same temperature range (Figure 4f). This observation suggests a possible phase transition occurring near 220 K. Further investigation is needed to clarify the origin of this unusual bandgap and PL intensity behavior in Mn-doped MAPbBr3 NCs in this temperature range.
The PL line width (FWHM) broadening observed with temperature originates from enhanced exciton–phonon interaction, as more phonons participate in the emission process at higher temperatures (Figure 4d). The temperature-dependent line width broadening is nearly identical for both undoped and Mn-doped MAPbBr3 NCs (Figure 4d). Although both acoustic and longitudinal optical (LO) photons can contribute to homogeneous PL line width broadening, LO phonons have been reported as the dominant factor in perovskite NCs [66]. To deepen our insight into the role of exciton–phonon coupling, we fit the FWHM as a function of temperature, Γ ( T ) , using the following equation [69,70]:
Γ ( T ) = Γ 0 + Γ a c + Γ L O = Γ 0 + γ a c T + γ L O N L O ( T ) ,
where Γ 0 is the inhomogeneous PL broadening, which is temperature-independent and arises from the NC size distribution. Γ a c and Γ L O are homogeneous broadening contributions from acoustic and longitudinal optical phonon scattering, respectively. γ a c and γ L O are the exciton–phonon coupling strengths for acoustic and LO phonons, respectively. The phonon population follows the Bose–Einstein distribution:
N L O ( T ) = 1 e E L O K B T 1 ,
where E L O is the LO phonon energy and k B is the Boltzmann constant. Using Equation (2) to fit the FWHM in Figure 4d, we obtained the parameters Γ 0 ,   γ a c , E L O , and γ L O that are 32 ± 5 meV, 0.07 ± 0.02 meV/K, 24 ± 4 meV, and 80 ± 7 meV for non-doped MAPbBr3 NCs, and 29 ± 6 meV, 0.06 ± 0.0 meV/K, 25 ± 5 meV, and 85 ± 7 meV for Mn-doped MAPbBr3 NCs. These values are consistent with the previous observations in perovskite film and NCs, except the acoustic phonon couplings in our case are much lower in comparison with the report from Ref. [66]. This low acoustic phonon contribution is also consistent with the earlier studies [69,70]. Some discrepancies between the fitted curves and the experimental data in Figure 4d may arise from the asymmetric PL line shape, which could be attributed to a low-energy shoulder peak. This feature likely originates from shallow trap states in the perovskite NCs, as discussed in the Supporting Information, Figure S4.
Figure 4e,f presents the temperature-dependent PL intensities of the two samples. As the temperature increases, the PL intensities decrease due to enhanced NR recombination. At high temperatures, strong carrier–phonon interactions enable electrons or holes to acquire sufficient thermal energy to overcome potential barriers and transition into defect states, facilitating NR recombination. Conversely, at low temperatures, the MAPbBr3 crystal structure becomes more ordered as the MA+ cations, which rotate freely at room temperature, are immobilized. This structural ordering can lead to higher emission rates and narrower spectral line widths. Moreover, when the temperature changes across the crystallographic phase transitions, the relative alignment between excited carriers and trap energy levels shifts. As a result, we expect abrupt changes in the PL intensity due to variations in NR activation across the phase transition points. It has been reported that bulk MAPbBr3 perovskites exhibit three distinct crystallographic phases: below 144 K is the orthorhombic (Pnma) phase, between 144 and 237 K is the tetragonal phase (I4/mcm), and above 237 K is the cubic phase (Pm 3 ¯ m) [71]. However, there has been debate regarding a transient phase within the 148–155 K range, which has been attributed to phase coexistence [72,73]. More recently, Abia et al. employed neutron diffraction to sequentially analyze the crystallographic phase in this temperature range and identified the phase as orthorhombic Imma [74]. MAPbBr3 perovskites in nanostructured forms, such as NCs, are suggested to suppress noticeable phase transitions, likely due to their reduced crystal size, which inhibits structural transformation. As a result, no clear PL intensity change is typically observed across the known phase transition temperatures [66]. We speculate that the absence of distinct PL intensity changes in NCs across the phase transition points arises from effective surface passivation with a high PLQY, which minimizes the influence of defects or traps across different crystal phases. To see the crystal transition phases, we intended to keep the sample in ambient conditions for one week before measurements, starting from a low PLQY (see Figure 3). The phase transition temperatures for non-doped MAPbBr3 NCs are clear (Figure 4e). During the orthorhombic-to-tetragonal phase transition, the PL intensity decreases by nearly 80-fold. Within the Imma orthorhombic phase (140–160 K), the PL intensity gradually decreases. At the tetragonal-to-cubic transition (~135 K), the PL intensity drops by about fivefold. Within a single phase, the PL intensity remains relatively stable. In contrast, Mn-doped MAPbBr3 NCs do not exhibit a clear orthorhombic-to-tetragonal phase transition, Instead, the PL intensity decreases steadily with increasing temperature. An anomalous change is observed at 220 K, accompanied by a corresponding shift in the PL peak energy (see Figure 4c). A sharp drop in the PL intensity, approximately eightfold, occurs during the transition from the tetragonal to cubic phase. These results demonstrate that crystal phase transitions can be effectively tracked through temperature-dependent changes in the PL intensity.

3.5. Superlattice Formation of xMn-MAPbBr3 NCs

NCs can self-assemble into highly ordered and periodic structures known as superlattices (SLs). This artificial crystal-like arrangement facilitates inter-NC coupling, giving rise to emergent collective electronic, optical, or transport properties that are not present in uncoupled NCs. Most SLs reported to date have been formed using all-inorganic perovskite NCs, such as CsPbBr3 synthesized via the hot injection method, which yields high crystal quality and uniformity [75]. The formation of high-quality superlattices relies heavily on the NCs’ size and shape uniformity, as well as their surface chemistry. In contrast, hybrid organic–inorganic perovskites like MAPbBr3, typically synthesized using the LARP method, often result in lower crystal quality and hence affect superlattice growth. However, as discussed above, Mn2⁺ doping in MAPbBr3 has been shown to enhance NC quality, increase quantum yield, and improve material stability, factors that can promote the formation of higher-quality SLs. Furthermore, post-synthesis treatment with DDAB effectively passivates the NC surface, providing favorable conditions for self-assembly. In this study, we compared superlattice formation using pristine MAPbBr3 NCs and Mn2⁺-doped MAPbBr3 NCs (17% Mn2⁺), both treated with DDAB. Optical microscopy images (Figure 5) reveal that Mn-doped NCs form well-defined SLs with a regular square shape, larger SL sizes (7–9 µm vs. 2–4 µm for the non-doped NCs), higher uniformity, and clearer backgrounds. Atomic force microscopy (AFM) shows that SLs from pristine NCs have dimensions of ~3 µm in size and ~0.55 µm in thickness, whereas SLs from Mn-doped NCs reach ~8 µm in size and ~0.8 µm in thickness. Additionally, the surface of Mn-doped SLs is noticeably flatter. Additional optical images are given in the Supporting Information, Figures S5 and S6.
To have a better PL imaging resolution, we performed two-photon fluorescence (2PF) confocal imaging, using a femtosecond laser with 800 nm excitation. Figure 6a,b present the PL images of SLs grown from non-doped and Mn-doped MAPbBr3 NCs. Notably, 2PF intensities are localized higher at the edges of the Mn-doped SLs, which may indicate improved surface passivation at the edge surfaces. To investigate the strong inter-NC coupling, we measured the PL spectra and dynamics of the randomly oriented NC film via drop-casting and compared them to those from SLs; the data are given in Figure 6c,d. For the non-doped NCs, the SL PL spectrum is 8 nm red-shifted compared to that from the drop-cast film. The redshift indicates the strong coupling of NCs in SLs, resulting in the weakening of quantum confinement. For the Mn-doped MAPbBr3 NCs, the redshift in SLs is larger, 13 nm, in comparison to that of the drop-cast film. The larger redshift in Mn-doped NC superlattices indicates that the Mn facilitates the stronger inter-NC coupling. The PL dynamics are presented in Figure 6e,f. The double exponential fits to the dynamics returns the lifetime constants of t1 and t2 of the samples that are given in Table 1. As can be seen, the time constants for SLs are always shorter than those of the random orientation NC film. The observations suggest that the exciton can be delocalized in the SLs, resulting in exciton–exciton annihilation. For the Mn-doped MAPbBr3 NCs, the time constant is much shorter in comparison to that of a non-doped sample. Together with the stronger spectral redshift, we can conclude that Mn dopant facilitates the stronger inter-NC coupling.

4. Conclusions

In summary, we demonstrate that controlled Mn2⁺ doping in MAPbBr3 NCs significantly enhances their optical performance and structural stability. Mn2⁺ ions are successfully incorporated into the perovskite lattice at concentrations of up to 25%, inducing lattice contraction without compromising the crystal integrity or optical properties. This doping results in a notable increase in the photoluminescence quantum yield, reaching a maximum of 72% at 17% Mn2+ doping, and a reduction in non-radiative recombination, as confirmed by PL dynamics and time-resolved measurements. Mn2⁺ doping also improves the ambient optical stability of the NCs, which is further enhanced by surface passivation using DDAB. Temperature-dependent PL studies reveal both conventional and anomalous emission behaviors in the Mn-doped samples. Structurally, Mn2⁺ doping enhances the robustness of MAPbBr3 via filling vacancies and trap states and substituting Pb2⁺ sites without disrupting the lattice framework. Moreover, Mn2⁺ incorporation promotes the self-assembly of MAPbBr3 NCs into superlattice structures, leading to larger nanocrystals and improved crystallinity. These findings offer valuable insights into the role of transition metal doping in tuning the optical and structural properties of perovskite NCs, paving the way for the development of doped perovskites with improved functionality for lighting and optoelectronic applications.

Supplementary Materials

The following supporting information can be downloaded at: https://www.mdpi.com/article/10.3390/nano15110847/s1. Figure S1. XRD patterns of the MAPbBr3 single crystal (red) and NCs (blue). Figure S2. MAPbBr3 nanocrystals were synthesized with tunable sizes controlled by the reaction temperature. Figure S3. The correlation between the lattice parameter (blue) and the PL shift as a function of Mn concentration. Figure S4. The emission spectra of MAPbBr3 NCs and the fits with a double Gaussian function. Non-doped NC at 80 K (a) and 280 K (b), Mn-doped NCs (x = 0.17) at 80 K (c) and 280 K (d). Figure S5. Optical images of non-doped NC superlattices at different locations. Figure S6. Optical images of Mn-doped (x = 0.17) NC superlattices at different locations.

Author Contributions

M.T.T. conceived the project and wrote the manuscript. T.T.T.P. synthesized materials, conducted the experiments, analyzed the data, and wrote the manuscript. T.T.K.N. and T.K.M. contributed to the material synthesis and characterizations. All authors have read and agreed to the published version of the manuscript.

Funding

This research received no external funding.

Data Availability Statement

The original contributions presented in this study are included in the article. Further inquiries can be directed to the corresponding author.

Conflicts of Interest

The authors declare no conflicts of interest.

References

  1. Hassan, Y.; Song, Y.; Pensack, R.D.; Abdelrahman, A.I.; Kobayashi, Y.; Winnik, M.A.; Scholes, G.D. Structure-Tuned Lead. Halide Perovskite Nanocrystals. Adv. Mater. 2016, 28, 566–573. [Google Scholar] [CrossRef] [PubMed]
  2. Malgras, V.; Tominaka, S.; Ryan, J.W.; Henzie, J.; Takei, T.; Ohara, K.; Yamauchi, Y. Observation of Quantum Confinement in Monodisperse Methylammonium Lead Halide Perovskite Nanocrystals Embedded in Mesoporous Silica. J. Am. Chem. Soc. 2016, 138, 13874–13881. [Google Scholar] [CrossRef] [PubMed]
  3. Droseros, N.; Longo, G.; Brauer, J.C.; Sessolo, M.; Bolink, H.J.; Banerji, N. Origin of the Enhanced Photoluminescence Quantum Yield in MAPbBr3 Perovskite with Reduced Crystal Size. ACS Energy Lett. 2018, 3, 1458–1466. [Google Scholar] [CrossRef]
  4. Zhu, C.; Boehme, S.C.; Feld, L.G.; Moskalenko, A.; Dirin, D.N.; Mahrt, R.F.; Stöferle, T.; Bodnarchuk, M.I.; Efros, A.L.; Sercel, P.C.; et al. Single-Photon Superradiance in Individual Caesium Lead Halide Quantum Dots. Nature 2024, 626, 535–541. [Google Scholar] [CrossRef]
  5. Chiba, T.; Kido, J. Lead Halide Perovskite Quantum Dots for Light-Emitting Devices. J. Mater. Chem. C 2018, 6, 11868–11877. [Google Scholar] [CrossRef]
  6. Li, Y.-F.; Chou, S.-Y.; Huang, P.; Xiao, C.; Liu, X.; Xie, Y.; Zhao, F.; Huang, Y.; Feng, J.; Zhong, H.; et al. Stretchable Organometal-Halide-Perovskite Quantum-Dot Light-Emitting Diodes. Adv. Mater. 2019, 31, e1807516. [Google Scholar] [CrossRef]
  7. Zou, T.; Liu, X.; Qiu, R.; Wang, Y.; Huang, S.; Liu, C.; Dai, Q.; Zhou, H. Enhanced UV-C Detection of Perovskite Photodetector Arrays via Inorganic CsPbBr3 Quantum Dot Down-Conversion Layer. Adv. Opt. Mater. 2019, 7, e1801812. [Google Scholar] [CrossRef]
  8. Jia, D.; Chen, J.; Zhuang, R.; Hua, Y.; Zhang, X. Inhibiting Lattice Distortion of CsPbI 3 Perovskite Quantum Dots for Solar Cells with Efficiency over 16.6%. Energy Environ. Sci. 2022, 15, 4201–4212. [Google Scholar] [CrossRef]
  9. Jia, D.; Chen, J.; Qiu, J.; Ma, H.; Yu, M.; Liu, J.; Zhang, X. Tailoring Solvent-Mediated Ligand Exchange for CsPbI3 Perovskite Quantum Dot Solar Cells with Efficiency Exceeding 16.5%. Joule 2022, 6, 1632–1653. [Google Scholar] [CrossRef]
  10. Jia, D.; Chen, J.; Zhuang, R.; Hua, Y.; Zhang, X.; Jia, D.; Chen, J.; Zhang, X.; Zhuang, R.; Hua, Y. Antisolvent-Assisted In Situ Cation Exchange of Perovskite Quantum Dots for Efficient Solar Cells. Adv. Mater. 2023, 35, e2212160. [Google Scholar] [CrossRef]
  11. Huang, C.-Y.; Zou, C.; Mao, C.; Corp, K.L.; Yao, Y.-C.; Lee, Y.-J.; Schlenker, C.W.; Jen, A.K.Y.; Lin, L.Y. CsPbBr3 Perovskite Quantum Dot Vertical Cavity Lasers with Low Threshold and High Stability. ACS Photonics 2017, 4, 2281–2289. [Google Scholar] [CrossRef]
  12. Chen, L.-J.; Dai, J.-H.; Lin, J.-D.; Mo, T.-S.; Lin, H.-P.; Yeh, H.-C.; Chuang, Y.-C.; Jiang, S.-A.; Lee, C.-R. Wavelength-Tunable and Highly Stable Perovskite-Quantum-Dot-Doped Lasers with Liquid Crystal Lasing Cavities. ACS Appl. Mater. Interfaces 2018, 10, 33307–33315. [Google Scholar] [CrossRef]
  13. Utzat, H.; Sun, W.; Kaplan, A.E.K.; Krieg, F.; Ginterseder, M.; Spokoyny, B.; Klein, N.D.; Shulenberger, K.E.; Perkinson, C.F.; Kovalenko, M.V.; et al. Coherent Single-Photon Emission from Colloidal Lead Halide Perovskite Quantum Dots. Science 2019, 363, 1068–1072. [Google Scholar] [CrossRef] [PubMed]
  14. Zhu, C.; Marczak, M.; Feld, L.; Boehme, S.C.; Bernasconi, C.; Moskalenko, A.; Cherniukh, I.; Dirin, D.; Bodnarchuk, M.I.; Kovalenko, M.V.; et al. Room-Temperature, Highly Pure Single-Photon Sources from All-Inorganic Lead Halide Perovskite Quantum Dots. Nano Lett. 2022, 22, 3751–3760. [Google Scholar] [CrossRef] [PubMed]
  15. Kirakosyan, A.; Yun, S.; Yoon, S.-G.; Choi, J. Surface Engineering for Improved Stability of CH3NH3PbBr3 Perovskite Nanocrystals. Nanoscale 2018, 10, 1885–1891. [Google Scholar] [CrossRef]
  16. Mosconi, E.; Umari, P.; De Angelis, F. Electronic and Optical Properties of MAPbX3 Perovskites (X = I, Br, Cl): A Unified DFT and GW Theoretical Analysis. Phys. Chem. Chem. Phys. 2016, 18, 27158–27164. [Google Scholar] [CrossRef]
  17. Dai, S.-W.; Hsu, B.-W.; Chen, C.-Y.; Lee, C.-A.; Liu, H.-Y.; Wang, H.-F.; Huang, Y.-C.; Wu, T.-L.; Manikandan, A.; Ho, R.-M.; et al. Perovskite Quantum Dots with Near Unity Solution and Neat-Film Photoluminescent Quantum Yield by Novel Spray Synthesis. Adv. Mater. 2018, 30, 1705532. [Google Scholar] [CrossRef]
  18. Xu, K.; Vickers, E.T.; Rao, L.; Lindley, S.A.; Allen, A.C.; Luo, B.; Li, X.; Zhang, J.Z. Synergistic Surface Passivation of CH3NH3PbBr3 Perovskite Quantum Dots with Phosphonic Acid and (3-Aminopropyl) Triethoxysilane. Chem.—A Eur. J. 2019, 25, 5014–5021. [Google Scholar] [CrossRef]
  19. Ahmed, G.H.; Yin, J.; Bakr, O.M.; Mohammed, O.F. Successes and Challenges of Core/Shell Lead. Halide Perovskite Nanocrystals. ACS Energy Lett. 2021, 6, 1340–1357. [Google Scholar] [CrossRef]
  20. Lu, Y.; Alam, F.; Shamsi, J.; Abdi-Jalebi, M. Doping Up the Light: A Review of A/B-Site Doping in Metal Halide Perovskite Nanocrystals for Next-Generation LEDs. J. Phys. Chem. C 2024, 128, 10084–10107. [Google Scholar] [CrossRef]
  21. Ricciarelli, D.; Meggiolaro, D.; Belanzoni, P.; Alothman, A.A.; Mosconi, E.; De Angelis, F. Energy vs. Charge Transfer in Manganese-Doped Lead Halide Perovskites. ACS Energy Lett. 2021, 6, 1869–1878. [Google Scholar] [CrossRef]
  22. Vargas, B.; Reyes-Castillo, D.T.; Coutino-Gonzalez, E.; Sánchez-Aké, C.; Ramos, C.; Falcony, C.; Solis-Ibarra, D. Enhanced Luminescence and Mechanistic Studies on Layered Double-Perovskite Phosphors: Cs4Cd1-XMnxBi2Cl12. Chem. Mater. 2020, 32, 9307–9315. [Google Scholar] [CrossRef]
  23. Wei, Z.; Liao, W.Q.; Tang, Y.Y.; Li, P.F.; Shi, P.P.; Cai, H.; Xiong, R.G. Discovery of an Antiperovskite Ferroelectric in [(CH3)3NH]3(MnBr3)(MnBr4). J. Am. Chem. Soc. 2018, 140, 8110–8113. [Google Scholar] [CrossRef] [PubMed]
  24. Hu, Y.; Zhang, X.; Yang, C.; Li, J.; Wang, L. Fe2+ Doped in CsPbCl3 Perovskite Nanocrystals: Impact on the Luminescence and Magnetic Properties. RSC Adv. 2019, 9, 33017–33022. [Google Scholar] [CrossRef] [PubMed]
  25. Ferro, S.M.; Wobben, M.; Ehrler, B. Rare-Earth Quantum Cutting in Metal Halide Perovskites—A Review. Mater. Horiz. 2021, 8, 1072–1083. [Google Scholar] [CrossRef]
  26. Zeng, M.; Artizzu, F.; Liu, J.; Singh, S.; Locardi, F.; Mara, D.; Hens, Z.; Van Deun, R. Boosting the Er3+1.5 Μm Luminescence in CsPbCl3Perovskite Nanocrystals for Photonic Devices Operating at Telecommunication Wavelengths. ACS Appl. Nano Mater. 2020, 3, 4699–4707. [Google Scholar] [CrossRef]
  27. Wang, W.; Song, S.; Lv, P.; Li, J.; Cao, B.; Liu, Z. Thermally Stable Rare-Earth Eu3+-Doped CsPbCl3 Perovskite Quantum Dots with Controllable Blue Emission. J. Lumin. 2023, 260, 119894. [Google Scholar] [CrossRef]
  28. Milstein, T.J.; Kroupa, D.M.; Gamelin, D.R. Picosecond Quantum Cutting Generates Photoluminescence Quantum Yields Over 100% in Ytterbium-Doped CsPbCl3 Nanocrystals. Nano Lett. 2018, 18, 3792–3799. [Google Scholar] [CrossRef]
  29. Kroupa, D.M.; Roh, J.Y.; Milstein, T.J.; Creutz, S.E.; Gamelin, D.R. Quantum-Cutting Ytterbium-Doped CsPb(Cl1–XBrx)3 Perovskite Thin Films with Photoluminescence Quantum Yields over 190%. ACS Energy Lett. 2018, 3, 2390–2395. [Google Scholar] [CrossRef]
  30. Kim, B.-J.; Fabbri, E.; Abbott, D.F.; Cheng, X.; Clark, A.H.; Nachtegaal, M.; Borlaf, M.; Castelli, I.E.; Graule, T.; Schmidt, T.J. Functional Role of Fe-Doping in Co-Based Perovskite Oxide Catalysts for Oxygen Evolution Reaction. J. Am. Chem. Soc. 2019, 141, 5231–5240. [Google Scholar] [CrossRef]
  31. Pan, G.; Bai, X.; Yang, D.; Chen, X.; Jing, P.; Qu, S.; Zhang, L.; Zhou, D.; Zhu, J.; Xu, W.; et al. Doping Lanthanide into Perovskite Nanocrystals: Highly Improved and Expanded Optical Properties. Nano Lett. 2017, 17, 8005–8011. [Google Scholar] [CrossRef] [PubMed]
  32. Zheng, B.; Fan, J.; Chen, B.; Qin, X.; Wang, J.; Wang, F.; Deng, R.; Liu, X. Rare-Earth Doping in Nanostructured Inorganic Materials. Chem. Rev. 2022, 122, 5519–5603. [Google Scholar] [CrossRef] [PubMed]
  33. Xu, K.; Vickers, E.T.; Luo, B.; Allen, A.C.; Chen, E.; Roseman, G.; Wang, Q.; Kliger, D.S.; Millhauser, G.L.; Yang, W.; et al. First Synthesis of Mn-Doped Cesium Lead. Bromide Perovskite Magic. Sized Clusters at Room Temperature. J. Phys. Chem. Lett. 2020, 11, 1162–1169. [Google Scholar] [CrossRef]
  34. Lin, C.Q.; Liu, M.L.; Yang, Z.; Wang, H.; Pan, C.Y. Mn2+ Doped CsPbBr3 Perovskite Quantum Dots with High Quantum Yield and Stability for Flexible Array Displays. J. Solid. State Chem. 2023, 327, 124295. [Google Scholar] [CrossRef]
  35. Parobek, D.; Roman, B.J.; Dong, Y.; Jin, H.; Lee, E.; Sheldon, M.; Son, D.H. Exciton-to-Dopant Energy Transfer in Mn-Doped Cesium Lead. Halide Perovskite Nanocrystals. Nano Lett. 2016, 16, 7376–7380. [Google Scholar] [CrossRef]
  36. Liu, Y.; Jiang, Y.; Xu, Z.; Li, L.; Zhang, D.; Zheng, W.; Liang, D.; Zheng, B.; Liu, H.; Sun, X.; et al. Magnetic Doping Induced Strong Circularly Polarized Light Emission and Detection in 2D Layered Halide Perovskite. Adv. Opt. Mater. 2022, 10, 2200183. [Google Scholar] [CrossRef]
  37. Guria, A.K.; Dutta, S.K.; Adhikari, S.D.; Pradhan, N. Doping Mn2+ in Lead Halide Perovskite Nanocrystals: Successes and Challenges. ACS Energy Lett. 2017, 2, 1014–1021. [Google Scholar] [CrossRef]
  38. Gao, D.; Qiao, B.; Xu, Z.; Song, D.; Song, P.; Liang, Z.; Shen, Z.; Cao, J.; Zhang, J.; Zhao, S. Postsynthetic, Reversible Cation Exchange between Pb2+ and Mn2+ in Cesium Lead Chloride Perovskite Nanocrystals. J. Phys. Chem. C 2017, 121, 20387–20395. [Google Scholar] [CrossRef]
  39. Travis, W.; Glover, E.N.K.; Bronstein, H.; Scanlon, D.O.; Palgrave, R.G. On the Application of the Tolerance Factor. to Inorganic and Hybrid. Halide Perovskites: A Revised System. Chem. Sci. 2016, 7, 4548–4556. [Google Scholar] [CrossRef]
  40. Manser, J.S.; Christians, J.A.; Kamat, P.V. Intriguing Optoelectronic Properties of Metal. Halide Perovskites. Chem. Rev. 2016, 116, 12956–13008. [Google Scholar] [CrossRef]
  41. Liu, W.; Lin, Q.; Li, H.; Wu, K.; Robel, I.; Pietryga, J.M.; Klimov, V.I. Mn2+-Doped Lead Halide Perovskite Nanocrystals with Dual-Color Emission Controlled by Halide Content. J. Am. Chem. Soc. 2016, 138, 14954–14961. [Google Scholar] [CrossRef]
  42. Chen, D.; Zhou, S.; Fang, G.; Chen, X.; Zhong, J. Fast Room-Temperature Cation Exchange Synthesis of Mn-Doped CsPbCl3 Nanocrystals Driven by Dynamic Halogen Exchange. ACS Appl. Mater. Interfaces 2018, 10, 39872–39878. [Google Scholar] [CrossRef]
  43. Zhou, S.; Zhu, Y.; Zhong, J.; Tian, F.; Huang, H.; Chen, J.; Chen, D. Chlorine-Additive-Promoted Incorporation of Mn2+ Dopants into CsPbCl3 Perovskite Nanocrystals. Nanoscale 2019, 11, 12465–12470. [Google Scholar] [CrossRef] [PubMed]
  44. Huang, G.; Wang, C.; Xu, S.; Zong, S.; Lu, J.; Wang, Z.; Lu, C.; Cui, Y. Postsynthetic Doping of MnCl2 Molecules into Preformed CsPbBr3 Perovskite Nanocrystals via a Halide Exchange-Driven Cation Exchange. Adv. Mater. 2017, 29, 1700095. [Google Scholar] [CrossRef] [PubMed]
  45. Boehme, S.C.; Bodnarchuk, M.I.; Burian, M.; Bertolotti, F.; Cherniukh, I.; Bernasconi, C.; Zhu, C.; Erni, R.; Amenitsch, H.; Naumenko, D.; et al. Strongly Confined CsPbBr3 Quantum Dots as Quantum Emitters and Building Blocks for Rhombic Superlattices. ACS Nano 2023, 17, 2089–2100. [Google Scholar] [CrossRef] [PubMed]
  46. Bartel, C.J.; Sutton, C.; Goldsmith, B.R.; Ouyang, R.; Musgrave, C.B.; Ghiringhelli, L.M.; Scheffler, M. New Tolerance Factor to Predict the Stability of Perovskite Oxides and Halides. Sci. Adv. 2019, 5, eaav0693. [Google Scholar] [CrossRef]
  47. Shi, D.; Adinolfi, V.; Comin, R.; Yuan, M.; Alarousu, E.; Buin, A.; Chen, Y.; Hoogland, S.; Rothenberger, A.; Katsiev, K.; et al. Low Trap-State Density and Long Carrier Diffusion in Organolead Trihalide Perovskite Single Crystals. Science 2015, 347, 519–522. [Google Scholar] [CrossRef]
  48. Saidaminov, M.I.; Abdelhady, A.L.; Murali, B.; Alarousu, E.; Burlakov, V.M.; Peng, W.; Dursun, I.; Wang, L.; He, Y.; MacUlan, G.; et al. High-Quality Bulk Hybrid Perovskite Single Crystals within Minutes by Inverse Temperature Crystallization. Nat. Commun. 2015, 6, 7586. [Google Scholar] [CrossRef]
  49. Biswas, A.; Bakthavatsalam, R.; Kundu, J. Efficient Exciton to Dopant Energy Transfer in Mn2+-Doped (C4H9NH3)2PbBr4 Two-Dimensional (2D) Layered Perovskites. Chem. Mater. 2017, 29, 7816–7825. [Google Scholar] [CrossRef]
  50. Zhou, G.; Jiang, X.; Molokeev, M.; Lin, Z.; Zhao, J.; Wang, J.; Xia, Z. Optically Modulated Ultra-Broad-Band Warm White Emission in Mn2+-Doped (C6H18N2O2)PbBr4 Hybrid Metal Halide Phosphor. Chem. Mater. 2019, 31, 5788–5795. [Google Scholar] [CrossRef]
  51. Dutta, A.; Behera, R.K.; Deb, S.; Baitalik, S.; Pradhan, N. Doping Mn(II) in All-Inorganic Ruddlesden–Popper Phase of Tetragonal Cs2PbCl2I2 Perovskite Nanoplatelets. J. Phys. Chem. Lett. 2019, 10, 1954–1959. [Google Scholar] [CrossRef] [PubMed]
  52. Kirberger, M.; Yang, J.J. Structural Differences Between Pb2+- and Ca2+-Binding Sites in Proteins: Implications with Respect to Toxicity. J. Inorg. Biochem. 2008, 102, 1901. [Google Scholar] [CrossRef]
  53. Dutta, S.; Yang, L.; Liu, S.Y.; Liu, C.M.; Liaw, L.J.; Som, S.; Mohapatra, A.; Sankar, R.; Lin, W.C.; Chao, Y.C. Impact of Co2+ on the Magneto-Optical Response of MAPbBr3: An Inspective Study of Doping and Quantum Confinement Effect. Mater. Today Phys. 2022, 27, 100843. [Google Scholar] [CrossRef]
  54. Moj, K.; Owsiński, R.; Robak, G.; Gupta, M.K.; Scholz, S.; Mehta, H. Measurement of Precision and Quality Characteristics of Lattice Structures in Metal-Based Additive Manufacturing Using Computer Tomography Analysis. Measurement 2024, 231, 114582. [Google Scholar] [CrossRef]
  55. Jiang, M.C.; Pan, C.Y. Research on the Stability of Luminescence of CsPbBr3 and Mn:CsPbBr3 PQDs in Polar Solution. RSC Adv. 2022, 12, 15420–15426. [Google Scholar] [CrossRef]
  56. Lin, C.C.; Xu, K.Y.; Wang, D.; Meijerink, A. Luminescent Manganese-Doped CsPbCl3 Perovskite Quantum Dots. Sci. Rep. 2017, 7, 45906. [Google Scholar] [CrossRef]
  57. Liu, Y.; Zhao, Y.; Zhu, Y.; Zhan, Y.; Matras-Postolek, K.; Yang, P. Ion Exchange Derived CsPbBr3:Mn Nanocrystals with Stable and Bright Luminescence towards White Light-Emitting Diodes. Mater. Res. Bull. 2022, 153, 111915. [Google Scholar] [CrossRef]
  58. Chen, B.; Jiang, C.; Wang, Y.; Du, L. Investigation for Structural and Electronic Properties of Mn-Doped Perovskite at Different Doping Concentrations. Comput. Mater. Sci. 2025, 252, 113782. [Google Scholar] [CrossRef]
  59. Du, L.; An, J.; Katayama, T.; Duan, M.; Shi, X.P.; Wang, Y.; Furube, A. Photogenerated Carrier Dynamics of Mn2+ Doped CsPbBr3 Assembled with TiO2 Systems: Effect of Mn Doping Content. J. Chem. Phys. 2024, 160, 164713. [Google Scholar] [CrossRef]
  60. Trinh, C.T.; Minh, D.N.; Ahn, K.J.; Kang, Y.; Lee, K.G. Verification of Type-A and Type-B-HC Blinking Mechanisms of Organic–Inorganic Formamidinium Lead Halide Perovskite Quantum Dots by FLID Measurements. Sci. Rep. 2020, 10, 2172. [Google Scholar] [CrossRef]
  61. Hu, F.; Yin, C.; Zhang, H.; Sun, C.; Yu, W.W.; Zhang, C.; Wang, X.; Zhang, Y.; Xiao, M. Slow Auger Recombination of Charged Excitons in Nonblinking Perovskite Nanocrystals without Spectral Diffusion. Nano Lett. 2016, 16, 6425–6430. [Google Scholar] [CrossRef] [PubMed]
  62. Ji, Y.; Zhang, J.B.; Shen, H.R.; Su, Z.; Cui, H.; Lan, T.; Wang, J.Q.; Chen, Y.H.; Liu, L.; Cao, K.; et al. Improving the Stability of α-CsPbI3Nanocrystals in Extreme Conditions Facilitated by Mn2+Doping. ACS Omega 2021, 6, 13831–13838. [Google Scholar] [CrossRef]
  63. Futscher, M.H.; Gangishetty, M.K.; Congreve, D.N.; Ehrler, B. Manganese Doping Stabilizes Perovskite Light-Emitting Diodes by Reducing Ion Migration. ACS Appl. Electron. Mater. 2020, 2, 1522–1528. [Google Scholar] [CrossRef]
  64. Phan, T.T.T.; Nguyen, T.K.; Mac, T.K.; Trinh, M.T. Understanding and Eliminating Transient Photoluminescence Quenching in Lead. Halide Perovskite Quantum Dots for Photonic Applications. ACS Appl. Nano Mater. 2025. [Google Scholar] [CrossRef]
  65. Lee, S.M.; Moon, C.J.; Lim, H.; Lee, Y.; Choi, M.Y.; Bang, J. Temperature-Dependent Photoluminescence of Cesium Lead Halide Perovskite Quantum Dots: Splitting of the Photoluminescence Peaks of CsPbBr3 and CsPb(Br/I)3 Quantum Dots at Low Temperature. J. Phys. Chem. C 2017, 121, 26054–26062. [Google Scholar] [CrossRef]
  66. Woo, H.C.; Choi, J.W.; Shin, J.; Chin, S.H.; Ann, M.H.; Lee, C.L. Temperature-Dependent Photoluminescence of CH3NH3PbBr3 Perovskite Quantum Dots and Bulk Counterparts. J. Phys. Chem. Lett. 2018, 9, 4066–4074. [Google Scholar] [CrossRef]
  67. Varshni, Y.P. Temperature Dependence of the Energy Gap in Semiconductors. Physica 1967, 34, 149–154. [Google Scholar] [CrossRef]
  68. Meloni, S.; Palermo, G.; Ashari-Astani, N.; Grätzel, M.; Grätzel, G.; Rothlisberger, U. Valence and Conduction Band Tuning in Halide Perovskites for Solar Cell Applications †. J. Mater. Chem. A 2016, 4, 15997–16002. [Google Scholar] [CrossRef]
  69. Wu, K.; Bera, A.; Ma, C.; Du, Y.; Yang, Y.; Li, L.; Wu, T. Temperature-Dependent Excitonic Photoluminescence of Hybrid Organometal Halide Perovskite Films. Phys. Chem. Chem. Phys. 2014, 16, 22476–22481. [Google Scholar] [CrossRef]
  70. Wright, A.D.; Verdi, C.; Milot, R.L.; Eperon, G.E.; Pérez-Osorio, M.A.; Snaith, H.J.; Giustino, F.; Johnston, M.B.; Herz, L.M. Electron–Phonon Coupling in Hybrid Lead Halide Perovskites. Nat. Commun. 2016, 7, 11755. [Google Scholar] [CrossRef]
  71. Wolf, C.; Kim, J.S.; Lee, T.W. Structural and Thermal Disorder of Solution-Processed CH3NH3PbBr3 Hybrid Perovskite Thin Films. ACS Appl. Mater. Interfaces 2017, 9, 10344–10348. [Google Scholar] [CrossRef] [PubMed]
  72. Yang, B.; Ming, W.; Du, M.-H.; Keum, J.K.; Puretzky, A.A.; Rouleau, C.M.; Huang, J.; Geohegan, D.B.; Wang, X.; Xiao, K.; et al. Real-Time Observation of Order-Disorder Transformation of Organic Cations Induced Phase Transition and Anomalous Photoluminescence in Hybrid Perovskites. Adv. Mater. 2018, 30, 1705801. [Google Scholar] [CrossRef] [PubMed]
  73. López, C.A.; Martínez-Huerta, M.V.; Alvarez-Galván, M.C.; Kayser, P.; Gant, P.; Castellanos-Gomez, A.; Fernández-Díaz, M.T.; Fauth, F.; Alonso, J.A. Elucidating the Methylammonium (MA) Conformation in MAPbBr3 Perovskite with Application in Solar Cells. Inorg. Chem. 2017, 56, 14214–14219. [Google Scholar] [CrossRef] [PubMed]
  74. Abia, C.; López, C.A.; Cañadillas-Delgado, L.; Fernández-Diaz, M.T.; Alonso, J.A. Crystal Structure Thermal Evolution and Novel Orthorhombic Phase of Methylammonium Lead Bromide, CH3NH3PbBr3. Sci. Rep. 2022, 12, 18647. [Google Scholar] [CrossRef]
  75. Rainò, G.; Becker, M.A.; Bodnarchuk, M.I.; Mahrt, R.F.; Kovalenko, M.V.; Stöferle, T. Superfluorescence from Lead Halide Perovskite Quantum Dot Superlattices. Nature 2018, 563, 671–675. [Google Scholar] [CrossRef]
Figure 1. (a) Schematic of Mn-doped MAPbBr3 NC synthesis and the perovskite crystal structure; (b) XRD patterns of xMn-MAPbBr3 NCs with different Mn2+ concentrations; and (c) 2θ degree (red) at (200) plane and calculated lattice parameter (blue) as a function of Mn2+ concentration.
Nanomaterials 15 00847 g001
Figure 2. Optical characterizations of xMn-MAPbBr3 perovskite NCs. (a) Absorption (dashed) and emission (solid) spectra with the different Mn2+ doping concentrations. The PL spectra were measured at 400 nm excitation. (b) Mn2+ concentration dependence of the emission wavelength (green) and PLQY (red). (c) Normalized PL dynamics at 400 nm excitation, excitation pulse 100 fs. (d) Non-radiative lifetime (τ1) and its amplitude percentages obtained from global fittings, the radiative lifetime was held the same for all fits. Fitted radiative lifetime returns a value of 7.8 ± 1 ns.
Nanomaterials 15 00847 g002
Figure 3. Optical stability of xMn-MAPbBr3 samples with x = 0 and x = 0.17 over 180 h for non-treated NCs (a) and DDAB-treated NCs (b). The samples were diluted in toluene solvent and drop-cast on Si substrate for storage and measurement in ambient conditions.
Nanomaterials 15 00847 g003
Figure 4. Temperature dependence of optical properties from 80 to 280 K. PL spectra of non-doped (a) and 17% Mn-doped (b) MAPbBr3 NCs. (c) PL emission peak maxima in energy; (d) emission line widths (FWHM) with the fits from exciton–phonon coupling equation; and (e,f) PL intensities for non-doped (blue) and 17% Mn-doped (red) NCs. Vertical dashed lines indicate the temperatures where the crystal phase transition happens. The dot-dashed line at 210 K in (e,f) represents where the data at temperatures > 210 K were magnified by 10×.
Nanomaterials 15 00847 g004
Figure 5. Superlattice characterization for non-doped (top row) and 17% Mn-doped (second row) MAPbBr3 NCs. (a,b) Optical images of superlattices in the best area of SL formation, scale bar: 10 mm. (c,d) AFM images were obtained using semi-contact mode. (e,f) AFM cross-sections were obtained via the white dashed lines in (c,d).
Nanomaterials 15 00847 g005
Figure 6. Optical characterization of superlattices grown from non-doped (top row) and 17% Mn-doped (bottom row) MAPbBr3 NCs. (a,b) PL confocal image obtained using two-photon fluorescence (2PF); the excitation laser is at 800 nm. Inset: the profiles of individual SLs indicated by the white dashed lines. (c,d) Emission spectra of SLs and drop-cast films. (e,f) PL dynamics of the SLs and drop-cast film NCs.
Nanomaterials 15 00847 g006
Table 1. Time constants for different samples.
MAPbBr3Mn-Doped MAPbBr3 (x = 0.17)
Time constantst1 (ns)t2 (ns)t1 (ns)t2 (ns)
Drop-cast film14.41.465.9
Superlattice0.93.40.62.2
Disclaimer/Publisher’s Note: The statements, opinions and data contained in all publications are solely those of the individual author(s) and contributor(s) and not of MDPI and/or the editor(s). MDPI and/or the editor(s) disclaim responsibility for any injury to people or property resulting from any ideas, methods, instructions or products referred to in the content.

