3. Results and Discussion
The stable
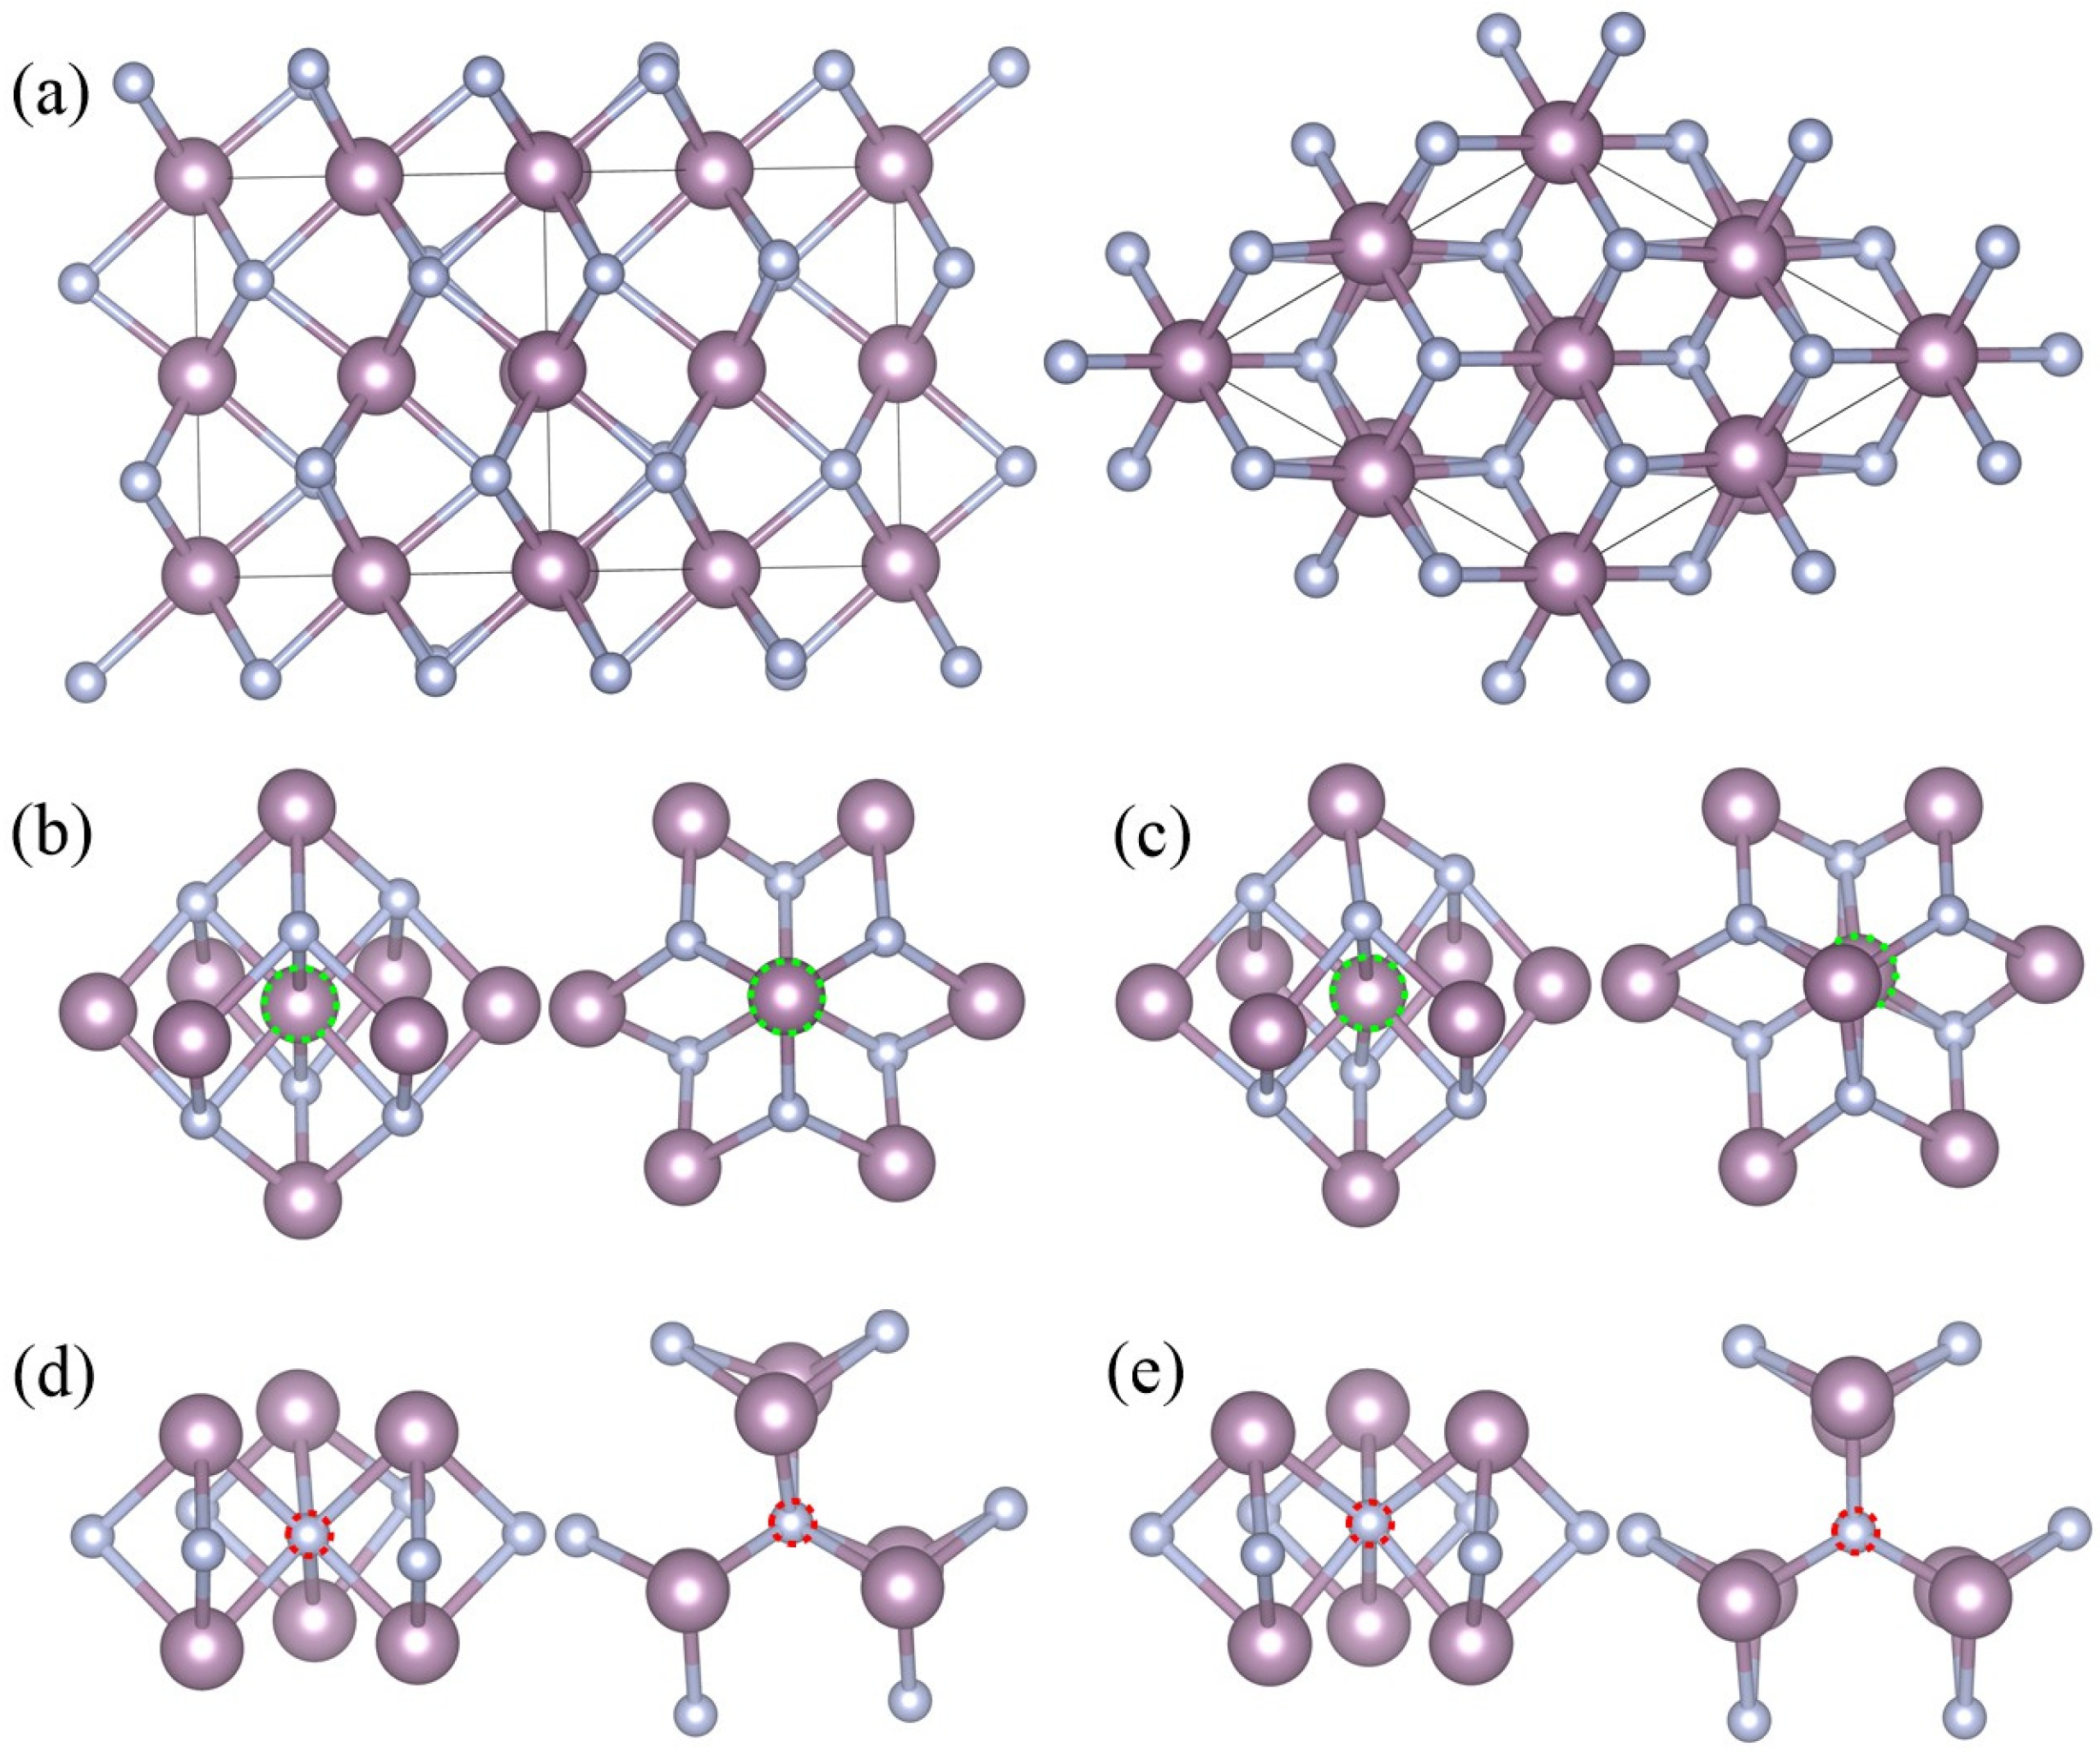
δ-MoN crystallizes in a distorted NiAs-type structure with a space group of
P6
3mc (186) [
3,
28], which is an interstitial compound with metal atoms forming a hexagonal lattice and non-metallic atoms located at the trigonal prismatic voids of the metallic lattice. Distinct alternating hexagonal layers of Mo and N atoms can be seen in the crystal structure of
δ-MoN [c.f.
Figure 1a]. In
δ-MoN, there are two kinds of lattice points for Mo and N atoms. The Mo atoms are at the 2
a(0, 0,
z) (
z = 0) and 6
c(
x, –
x,
z) (
x = 0.4877,
z = 0) sites while the N atoms are at the 2
b(1/3, 2/3,
z) (
z = 0.2612) and 6
c(
x, –
x,
z) (
x = 0.8302,
z = 0.2438) sites [
28]. Each unit cell of
δ-MoN contains eight Mo atoms [two Mo(2
a) atoms and six Mo(6
c) atoms] and eight N atoms [two N(2
b) atoms and six N(6
c) atoms].
For the monovacancy configuration, a 2 × 2 × 2 supercell containing 64 Mo atoms and 64 N atoms was used to study the
δ-MoN with one single vacancy. An isolated vacancy was created by removing one neutral atom (either Mo or N) from the supercell, which accounted for 1.56% vacancy concentration. Each time, one atom was removed from the supercell and a new monovacancy structure was built. There were four configurations considered in our calculations, namely, Mo
63N
64(2
a) [one molybdenum vacancy at Mo(2
a) site,
VMo(2a)], Mo
63N
64(6
c) [one molybdenum vacancy at Mo(6
c) site,
VMo(6c)], Mo
64N
63(2
b) [one nitrogen vacancy at N(2
b) site,
VN(2b)], and Mo
64N
63(6
c) [one nitrogen vacancy at N(6
c) site,
VN(6c)]. The corresponding local geometries are shown in
Figure 1b–e.
We first performed a geometry optimization for the perfect supercell. It was found that the calculated lattice parameters (
a = 11.581 Å,
c = 11.305 Å) were in good agreement with experimental values (
a = 11.483 Å,
c = 11.237 Å) [
28] with deviations within 1%, confirming the reliability of our computational approach. On the basis of equilibrium structure, four monovacancy configurations were constructed and relaxed to the minimum energy geometries and the obtained lattice parameters are listed in
Table 1.
It is clearly seen in
Table 1 that the presence of Mo or N vacancy had a nonnegligible effect on the geometry of
δ-MoN, that is, the lattice parameters in the
a,b directions were elongated whereas in the
c direction, they were compressed. Four monovacancy configurations were all characterized by the shrinkage of the cell volume and a decrease in the
c/
a value. This case could be attributed to the atomic rearrangement caused by vacancies. Here, we take Mo
63N
64(6
c) as an example to illustrate the reason for this change. In the hexagonal structure of
δ-MoN, each Mo atom is surrounded by fourteen neighboring atoms. The first shell contains six first-nearest N atoms and the second shell involves eight second-nearest Mo atoms. The Mo-vacancy creation breaks adjacent Mo–N bonds and leads to a bipyramid-like hollow structure, as shown in
Figure 1c, in which six Mo atoms in the
ab plane make up a slightly deformed hexagon and other two Mo atoms along the
c axis form two vertices of the bipyramid. The departure of Mo atom results in its neighboring atoms moving away from their original positions. Most evidently, two vertex Mo atoms of the bipyramid move inwards by a large magnitude of 0.24 Å, which is owing to the local collapse of the 3D anion–cation network caused by the missing Mo atom. Such a decrease in the Mo–Mo distance along the
c axis is undoubtedly the origin of the shortening of lattice parameter
c. Moreover, the significant change in the Mo–Mo distance breaks the force equilibrium between atoms and thus induces a certain degree of strain in the next bonds. To attain a new force equilibrium, neighboring atoms will follow the Mo displacements to reduce the tension. One consequence is that the hexagon Mo atoms of the bipyramid move outwards by about 0.02 Å, which is consistent with the slightly expanded supercell in the
a,b directions. The Mo–N bond lengths around the Mo vacancy changed from the initial 2.09–2.26 Å to 2.11–2.26 Å in the study, with an average decrease of only 0.03 Å. Ultimately, the Mo vacancy at 6
c position resulted in the shrinkage of the cell volume by 0.6% and the
c/
a value was reduced to 0.964. Similar changes can also be found in other monovacancy systems. However, it is noted that these changes in Mo
64N
63(2
b) and Mo
64N
63(6
c) are not as evident as those in Mo-monovacancy systems, which is due to the small radius of the N atom and its interstitial position. The remaining differences between Mo
63N
64(2
a) and Mo
63N
64(6
c) [or Mo
64N
63(2
b) and Mo
64N
63(6
c)] are attributed to the substantial differences in the atomic arrangements in these two configurations.
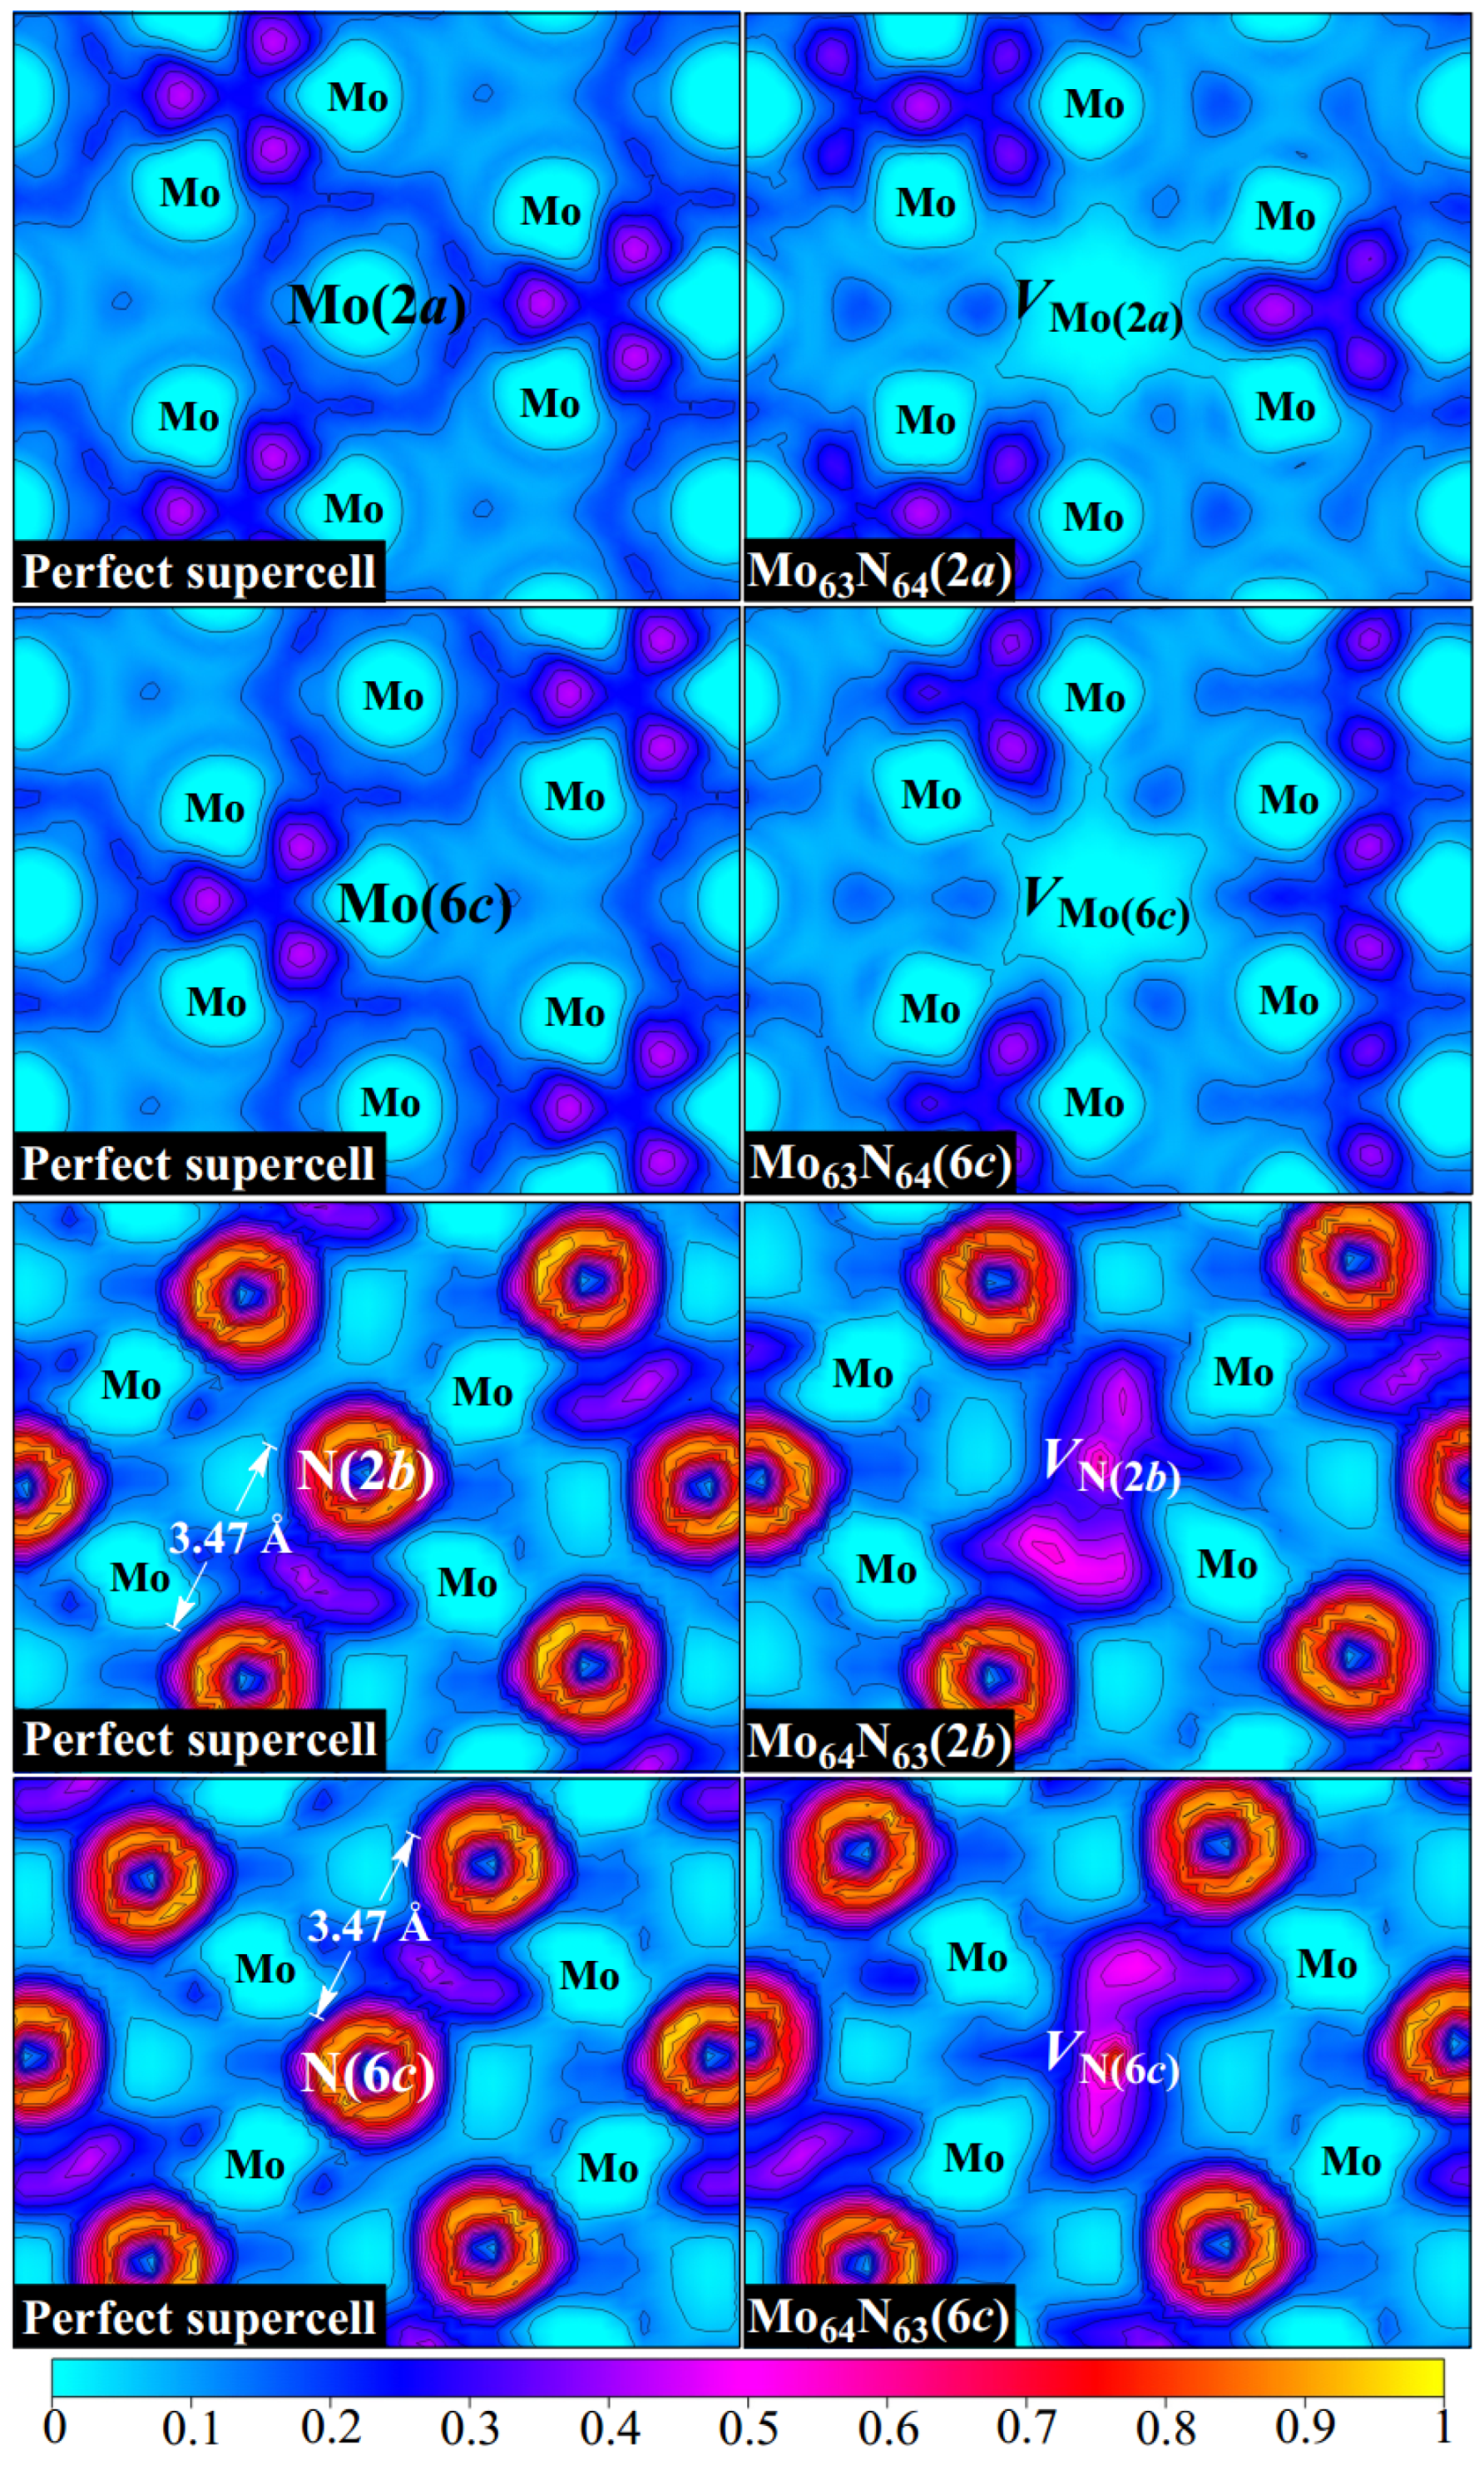
To further investigate the effects of vacancies on the bonding properties of
δ-MoN, we analyze, in detail, the electron localization function (ELF) as introduced by Becke and Edgecombe [
29,
30,
31]. This function describes the probability of finding two electrons with the same spin in space and provides a basis for a well-defined classification of chemical bonds [
32]. The ELF takes the values ranging from 0 to 1, where 1 denotes the perfect localization of electrons, 0 represents low electron density, and 0.5 indicates a free electron gas.
Figure 2 displays the ELF distributions of perfect
δ-MoN as well as for four monovacancy systems.
We first examine the bonding characteristics of
δ-MoN. The metallic bond, as a type of shared-electron interaction, possesses a distinctive feature wherein the ELF basins are big and extend over a region between bonded atoms. The ELF in the interaction region can be a non-nuclear maximum, like in covalent bonds, or a weak minimum as sparse electron gas [
32]. It is clearly seen in
Figure 2 that obvious metallic bonds exist in
δ-MoN as the ELF basins (with the values of about 0.1–0.4) extend between metal atoms, which form continuous pathways for electrons to travel through. This is in line with the broad and delocalized
d states throughout the valence and conduction bands, as is reflected from the density of states in
Figure 3. The observed nonuniformity of electron localization between metal atoms is attributed to the uneven Mo–Mo distances determined by the crystal symmetry. It is noteworthy that due to the dispersed metallic bonds throughout the crystal, there is an enhanced localization of electrons between two neighboring N atoms that are far apart (the N–N distance is more than 3.4 Å, much larger than the sum of their covalent radii of 1.5 Å), which is favorable for stabilizing the structure of
δ-MoN. Unlike the extended ELF basins of metallic bonds, covalent bonding is characterized by the presence of non-nuclear maxima on the line connecting two atoms. The ionic bonding is featured by a spherical ELF distribution around the atomic nucleus, which has no sharing electrons in the interstitial region. It is observed in
Figure 2 that the ELF attains local maxima between Mo and N atoms. This is in accordance with the characteristics of covalent bonding. However, the electrons are not accumulated at the middle point of the Mo–N path but near the N site, showing the charge transfer to the N atom. According to the Bader charge analysis [
33], each N atom in
δ-MoN gains about 1.28 electrons, indicating a net shared charge of −1.72|e| with its adjacent Mo atoms, as the expected oxidation state is N
3−. Therefore, the Mo–N interaction can be described as a partial covalent bond with some ionic component, which is consistent with the previous study [
34]. In a word, a combined covalent–metallic–ionic bonding is found in the compound of
δ-MoN.
Based on the structural analysis, we know that the formation of Mo or N vacancy breaks the force equilibrium between atoms and leads to atomic rearrangement. This rearrangement changes the interactions between atoms, thus redistributing the electron localization of
δ-MoN, as can be seen in the ELF in
Figure 2. As we know, the departure of the Mo atom will take away the electrons that were originally intended to be transferred to surrounding N atoms. Therefore, as the cost of Mo absence, the electron density around Mo vacancy tends to be depleted to compensate for the electron deficiency of N atoms, resulting in a large positive Mo hollow in
δ-MoN. On the contrary, evident electron accumulation is observed at a N vacancy. The removal of the N atom breaks adjacent Mo–N bonds and releases electrons that should have been hybridized. Nevertheless, these released electrons are not completely returned to Mo atoms but are partially trapped at the N vacancy, forming a uniform electron gas region. Excess electrons make the N vacancy negatively charged and form a weak bonding with its surrounding atoms. Thus, we can say that the creation of Mo and N vacancies has different influences on the bonding of
δ-MoN. The former results in significant electron deficiency in the Mo hollow while the latter leads to excess electrons being trapped at the N vacancy.
Table 2 lists the oxidation states for six first-nearest-neighbor N (or Mo) atoms around
VMo (or
VN) in monovacancy systems. For the six first-nearest Mo atoms surrounding
VN, the oxidation-state deviations from the perfect system are pronounced, with variations up to −0.27 [e.g., from +1.33 to +1.06 in Mo
64N
63(6
c)], indicating significant local charge redistribution. In contrast, N atoms adjacent to
VMo exhibit minimal charge perturbations, with differences not exceeding 0.10, suggesting weaker electronic coupling between N atoms and the vacant site. This difference in the charge response between Mo and N sublattices is likely driven by the higher electronegativity and smaller atomic radius of N, which limits its ability for charge redistribution. As compared to the perfect system, the charge redistribution around the vacancy presents broken-symmetry characteristics, which may induce local asymmetric polarization. However, the vacancy-induced perturbation decays rapidly with distance. Beyond the first coordination shell, the variation in oxidation states in outer Mo shells diminishes sharply, with a maximum deviation of 0.07, and eventually approaches zero at larger distances. Similarly, N atoms in outer shells show negligible changes (≤0.03), consistent with the short-range nature of vacancy effects. This rapid attenuation is mainly attributed to the delocalized electrons in
δ-MoN, which can efficiently screen localized charge disturbances.
We further calculate the electronic density of states (DOS) for the perfect and four monovacancy structures, as shown in
Figure 3. It can be seen that introducing one Mo or N vacancy into the superlattice changes the detailed structure of the DOS but does not fundamentally alter the metallic property of
δ-MoN. Significant
p–d hybridization between Mo-4
d and N-2
p orbitals (particularly in the deep bands of about –8 to –4 eV), as well as delocalized Mo-4
d states dominating the Femi level, can also be observed in four monovacancy systems. However, due to the local damage of the transport channel caused by vacancies, a slight decrease in the DOS occurs at the Femi level, as is evidenced by the magnified DOS profiles focusing on the energy range of –0.8 to 0.6 eV in
Figure 3. As we know, the density of states near the Fermi level plays an important role on the non-equilibrium transport properties of materials. A suppression of the DOS near the Fermi level inevitably reduces the population of delocalized electronic states participating in charge transport, thereby lowering the intrinsic carrier concentration. Meanwhile, vacancies act as scattering centers, disrupting the periodic potential of the lattice and enhancing electron–phonon or defect-mediated scattering events. This increases the scattering rate, further degrading the carrier mobility. The diminished carrier concentration coupled with degraded mobility will suppress the transport properties, which can be further confirmed by the calculated electronic conductivity in the final section.
Interestingly, a weak vacancy-induced magnetism is found in two Mo-vacancy-contained systems, Mo
63N
64(2
a) and Mo
63N
64(6
c). As is seen in the ELF in
Figure 2, in contrast to the uniform electron gas present at the N vacancy, exposed dangling bonds pointing towards the Mo hollow obviously exist in Mo
63N
64(2
a) and Mo
63N
64(6
c). The removal of the Mo atom breaks surrounding Mo–Mo metallic bonds and creates dangling bonds around the vacancy, leaving Mo-4
d electrons unpaired and induces magnetism in
δ-MoN. To gain more insight into this Mo-vacancy-induced magnetism, the spin charge density distributions of Mo
63N
64(2
a) and Mo
63N
64(6
c) are presented in
Figure 4. Clearly, the magnetic moments of these two systems mainly originate from the spin-polarized Mo-4
d orbitals around the vacant site. The two main contributors, i.e., the two prominently spin-polarized Mo-4
d orbitals [Mo
1,2-4
d around
VMo(2a) or Mo
3,4-4
d around
VMo(6c)], provide magnetic moments of approximately 0.31 and 0.10
μB for Mo
63N
64(2
a) and Mo
63N
64(6
c), respectively. However, the Mo atoms adjacent to Mo
1,2 or Mo
3,4 are antiferromagnetically polarized due to the through-bond spin polarization. Ultimately, this antiferromagnetic Mo–Mo coupling results in 0.22 and 0.04
μB total magnetic moments for Mo
63N
64(2
a) and Mo
63N
64(6
c), respectively. It is not surprising that such small magnetic moments will not be apparently reflected from the total density of states (c.f.
Figure 3). Thus, in each system, we select two Mo atoms (the two main magnetic contributors as mentioned above) to plot the partial density of states, as shown in
Figure 4. The imbalance of spin-up and spin-down channels suggests the magnetic characteristics of Mo
63N
64(2
a) and Mo
63N
64(6
c).
The stability of a vacancy-contained system can be evaluated by the formation energy (
Ef), which is defined thus [
35]:
Here,
is the total energy of a vacancy-contained system and
is the energy of a perfect supercell.
ni denotes the number of deficient atoms and
denotes the chemical potential for species
i (Mo or N). The chemical potentials of Mo and N (
and
) are not fixed but depend on growth conditions, ranging between Mo-rich (N-poor) and N-rich (Mo-poor) limits. The low and high values of
correspond to N-rich and Mo-rich growth conditions, respectively, while
exhibits the inverse dependence. To maintain structural stability,
and
must satisfy the thermodynamic stability equilibrium:
, with the constraints
≤
and
≤
. Under N-rich growth conditions,
is estimated by the consideration of N
2 molecule (
), and
is obtained from
. Under Mo-rich growth conditions,
is determined as the energy of a molybdenum atom in bulk Mo and
is evaluated by
. The calculated formation energies of four monovacancy systems are summarized in
Table 1. It is known that formation energy is an important index that describes the energy cost for creating a vacancy in the host material. The smaller the formation energy is, the easier it is to create a vacancy. It is clearly seen in
Table 1 that Mo-vacancy creation prefers N-rich conditions while N-vacancy creation depends more on Mo-rich conditions. Under equivalent growth conditions, Mo and N vacancies tend to be located at the 2
a and 2
b sites, respectively. The lowest vacancy formation energy is attained at the Mo(2
a) lattice site under N-rich growth conditions, with a rather small value of 0.08 eV. A defective metallic sublattice is characteristic of nitrides that form in thin films and ultra-disperse powders [
14]. The higher formation energy of Mo
63N
64(6
c) as compared to that of Mo
63N
64(2
a) can be understood by considering the local bonding around different Mo sites. Due to the mixed bonding nature of
δ-MoN, each Mo atom that wants to leave has to break the surrounding Mo–N bonds and detach from the binding of Mo–Mo metallic bonds. The average Mo(6
c)–N bond length is 2.18 Å, about 0.02 Å shorter than that of Mo(2
a)–N. Moreover, the evident deformation of Mo(6
c)-4
d orbital is observed from the ELF in
Figure 2, indicating a strong metal–metal interaction. These two factors suggest that more energy cost is required to remove a Mo atom from the 6
c site, which means a higher formation energy. Similarly, stronger local bonding around the N(6
c) site results in 0.34 eV energy higher than the vacancy formation at N(2
b) site as the average Mo–N(6
c) bond length is about 0.01 Å shorter than that of Mo–N(2
b).
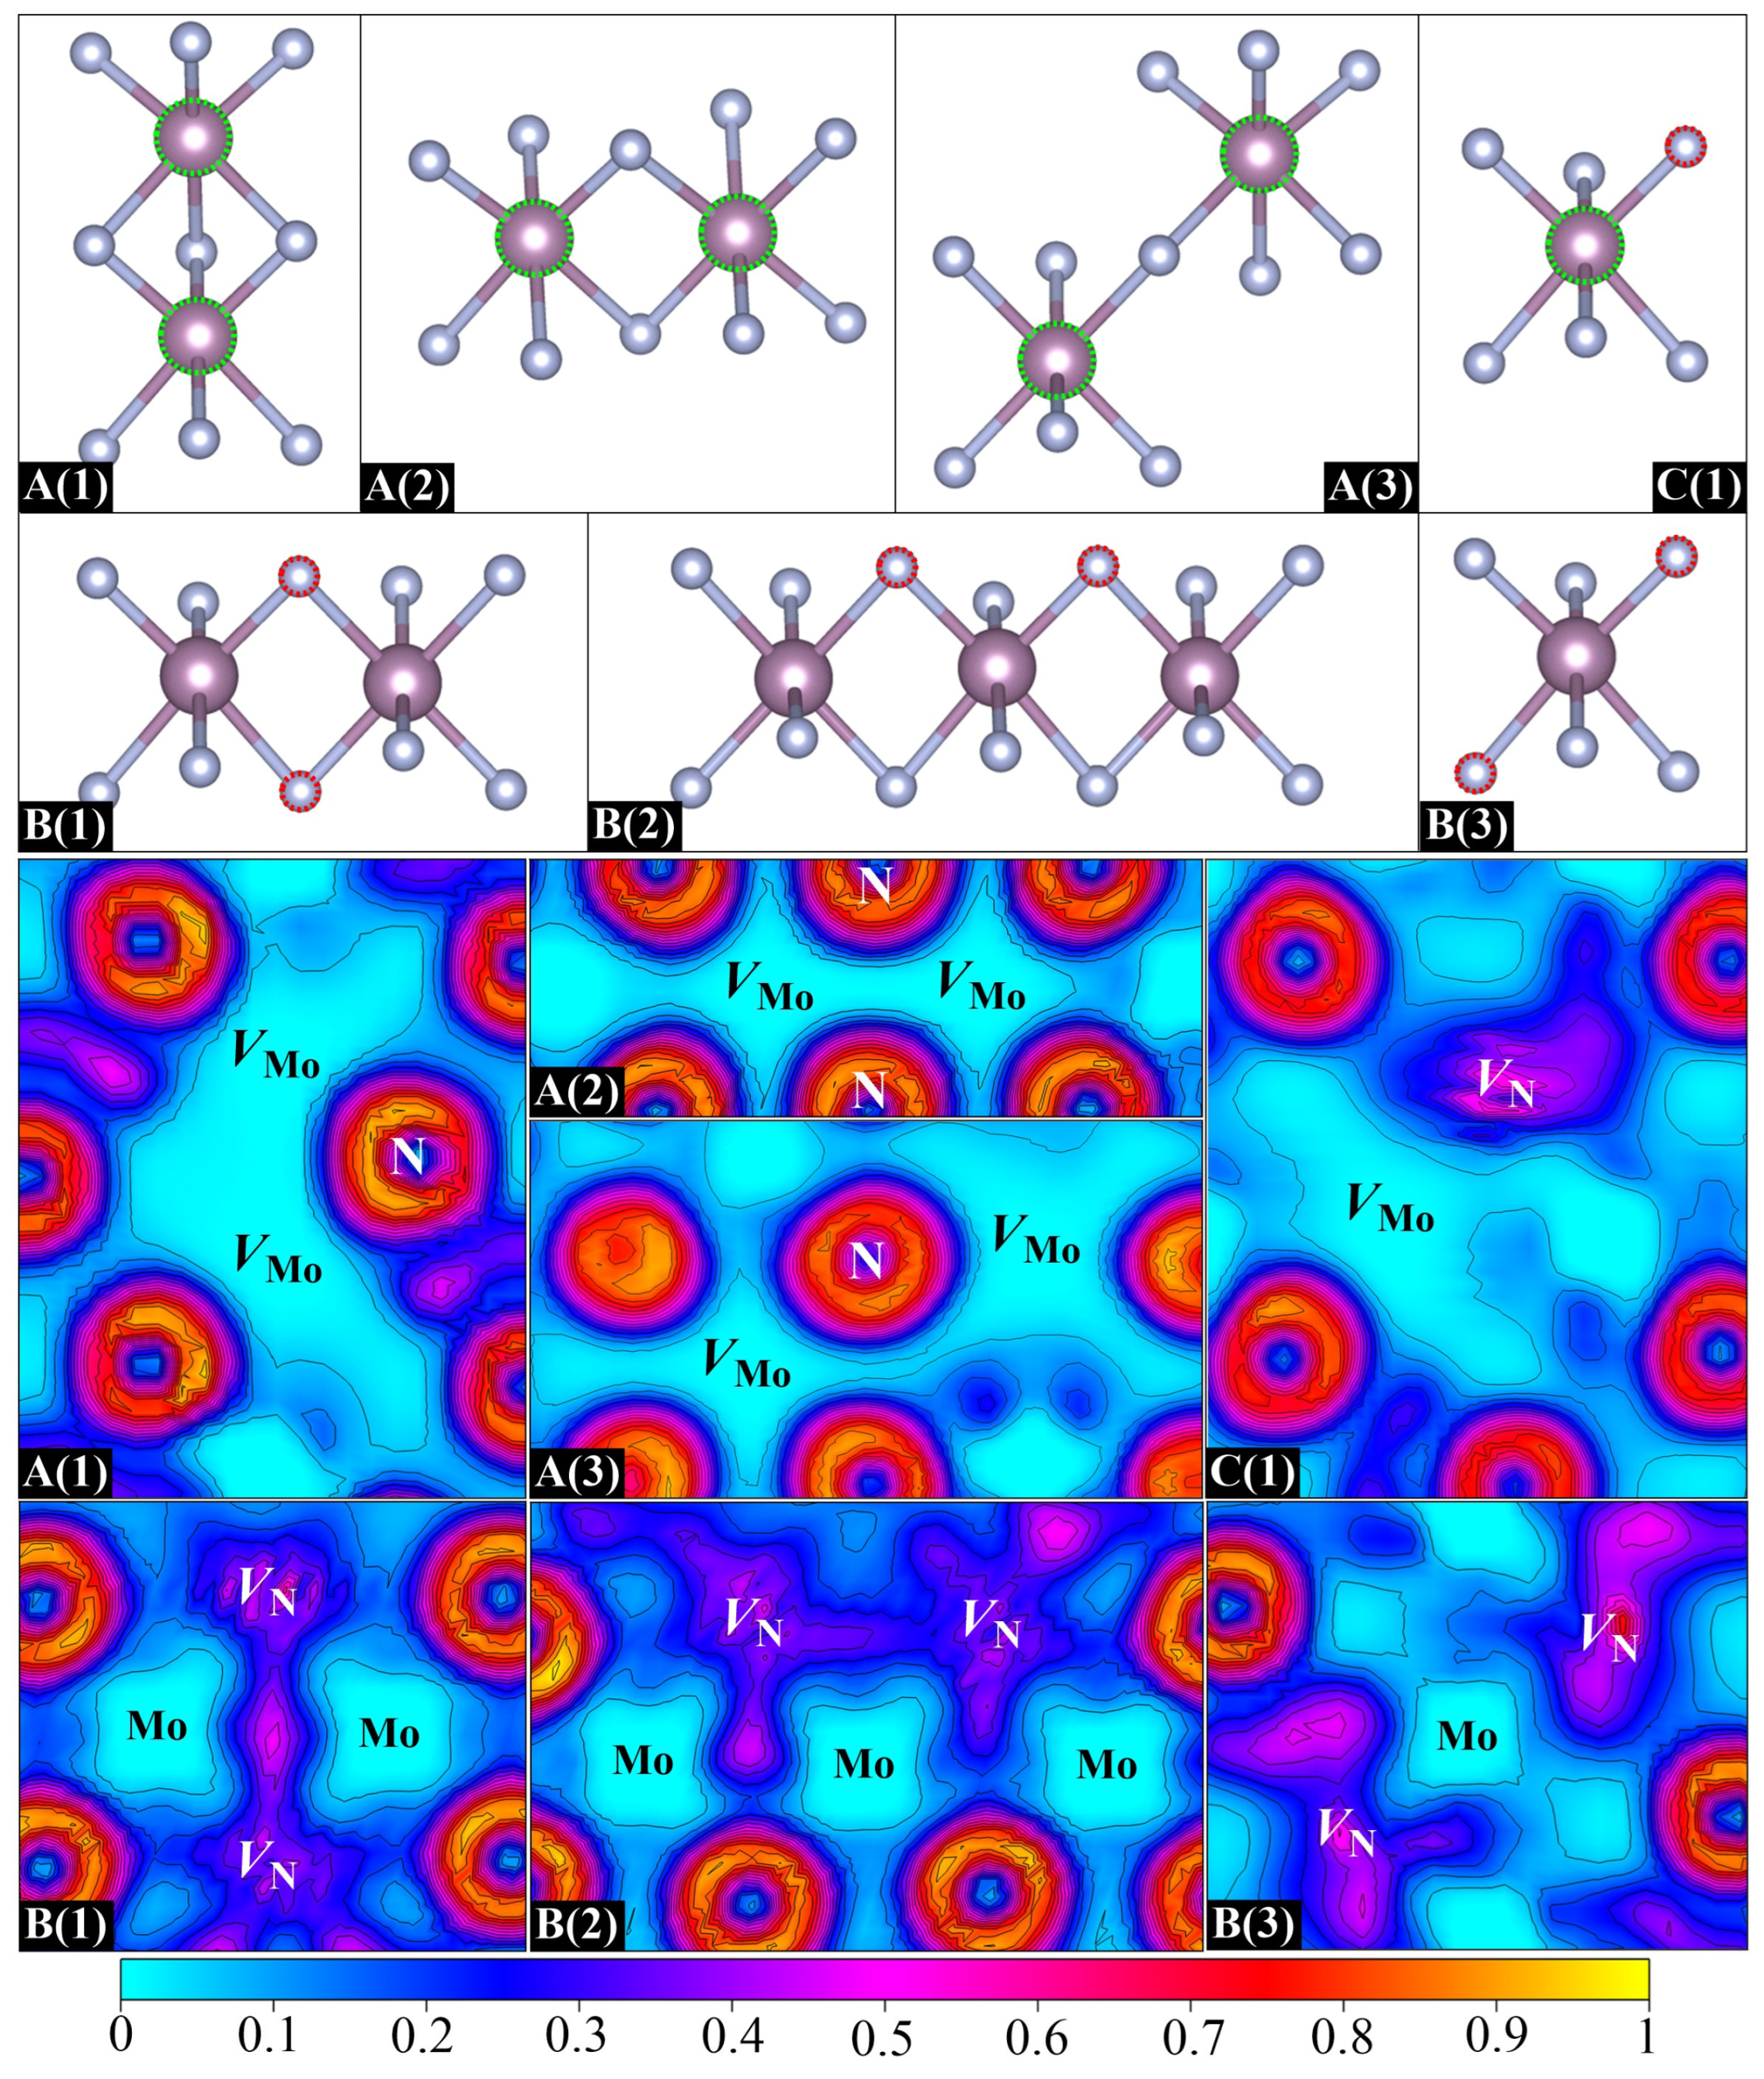
Next, we extend the analysis to a series of vacancy–vacancy pairs (divacancies) in
δ-MoN. Each divacancy has been obtained by removing two neutral atoms from a 2 × 2 × 2 supercell, which amounts to 3.13% vacancy concentration. As there are two kinds of atoms (Mo and N) in
δ-MoN, three types of vacancy–vacancy pairs have been considered in our calculations: Mo
62N
64 (containing two Mo vacancies,
VMo–
VMo pair), Mo
64N
62 (containing two N vacancies,
VN–
VN pair), and Mo
63N
63 (containing one Mo vacancy and one N vacancy,
VMo–
VN pair). This consideration generates seven different divacancies, as shown in
Figure 5. These divacancy configurations are designed based on crystallographic symmetry and distinct vacancy pair arrangements within the superlattice framework. A(1), A(2), and A(3) are three
VMo–
VMo pairs with three, two, and one bridging N atoms, respectively. In each plane, A(1), A(2), and A(3) exhibit distinct
X:
Y N-coordination ratios (2:2, 4:4, 4:2), where
X and
Y denote the first-shell nitrogen atoms bound to each vacancy in the
VMo–
VMo pair. B(1), B(2), and B(3) are three
VN–
VN pairs. B(1) has two bridging Mo atoms while B(2) and B(3) both contain a single bridging Mo atom but differ in lattice orientations. C(1) refers to a
VMo–
VN pair with two adjacent Mo and N vacancies. For all seven divacancy configurations, the separation between periodic images of vacancies ranges from 8.5–10.2 Å.
The interaction between vacancies in a cluster can be evaluated by the binding energy, which is defined thus [
36]:
Here,
or
corresponds to the formation energy of a single vacancy and
denotes the formation energy of a vacancy cluster. The calculated formation and binding energies of seven different divacancies are listed in
Table 3.
Here, we first focus on three
VMo–
VMo pairs. Obviously, the binding energies of A(1), A(2), and A(3) are all negative, as is observed in
Table 3. Moreover, the closer the
VMo–
VMo distance is, the more negative the binding energy is. In particular, a binding energy of –1.14 eV is found for A(1), which corresponds to the nearest
VMo–
VMo distance. Such a negative value suggests a strong
VMo–
VMo repulsive interaction, which inevitably induces a higher formation energy than the creation of two isolated vacancies, indicating its thermodynamic instability. To better characterize this vacancy–vacancy interaction, the ELF distributions for different types of divacancies are displayed in
Figure 5. As discussed above, the departure of the Mo atom removes its
ds electrons and results in a significant lack of electrons around the Mo vacant site. As a result, once a
VMo–
VMo pair is formed, the two electron-depleted neighbors may lead to a larger hollow area, as is evidenced by the ELF in
Figure 5. The repulsion between two positively charged Mo vacancies is responsible for the negative binding energies of
VMo–
VMo pairs. It is reasonable to suppose that Mo vacancies in real samples are often far enough apart to ensure that they do not interact with each other. However, different cases are found for
VN–
VN pairs. Noticeably, a positive binding energy of 0.20 eV that demonstrates an attractive interaction is obtained for B(1). In contrast to the significant depletion of electrons of
VMo–
VMo pairs, the electron density of B(1) is seen to be dispersed throughout two N vacancies, and particularly, there is a large portion accumulated in the interaction region, which suggests a tendency to form a
VN–
VN binding cluster. It is noteworthy that this electron accumulation not only tightly binds the
VN–
VN pair but also enhances the interaction between two shared Mo atoms. As can be seen in
Figure 5, the local geometry of B(1) is characterized by a planar quadrilateral structure that is formed by two N vacancies and two shared Mo atoms. The ELF basins of both N vacancies extend to the middle of two shared Mo atoms, resulting in an increase in the electron density in the Mo–Mo interaction region. The Mo–Mo distance is correspondingly shortened by about 0.02 Å. A stable local quadrilateral structure is thus formed in B(1), which is beneficial for stabilizing the geometry. Unlike the geometry of B(1), two N vacancies in B(2) are located in two adjacent quadrilateral structures connected by one mediated Mo atom. This
VN–
VN arrangement causes the electron density in each N vacancy to spread towards its respective quadrilateral center, which is featured by two relatively separated ELF basins with only few shared electrons in the
VN–
VN interaction region. The small negative binding energy of –0.04 eV indicates that the
VN–
VN repulsive interaction is slightly dominant in B(2). As for B(3), two well-separated ELF basins explain why it possesses a negative binding energy. Therefore, it can be concluded that, different from the distance dependence of
VMo–
VMo interaction, the
VN–
VN interaction relies more on the arrangement of two vacancies. With respect to the
VMo–
VN pair, an expected positive binding energy is found for C(1) as there is a positive and negative interaction between Mo and N vacancies, demonstrating the possible formation of
VMo–
VN binding clusters in
δ-MoN.
The above findings stimulate our interest in studying the possibility of forming larger vacancy clusters (trivacancies) in
δ-MoN. The removal of three atoms from the supercell yields a vacancy concentration not exceeding 4.69%, which lies within the experimentally reported reference range [
17,
19,
22]. Considering the
VMo–
VN attractive interaction and the arrangement dependence of
VN–
VN pairs, three types of vacancy clusters were built:
VMo–
VN–
VMo (two Mo vacancies with one mediated N vacancy),
VN–
VMo–
VN (two N vacancies with one mediated Mo vacancy), and
VN–
VN–
VN (three adjacent N vacancies).
Figure 6 presents the eight built structures: D(1), D(2), and D(3) are three
VMo–
VN–
VMo clusters; E(1), E(2), and E(3) are three
VN–
VMo–
VN clusters; and F(1) and F(2) are two
VN–
VN–
VN clusters. The
VMo–
VMo–
VMo clusters are not discussed here due to the repulsion between adjacent Mo vacancies. For the majority of designed trivacancy configurations, the separation between periodic images of vacancies exceeds 8.5 Å. One exception is F(1), where the nearest distance between vacancy images is about 5.7 Å. To address potential finite-size effects, we have employed an enlarged 2 × 2 × 3 supercell to calculate the formation energy of F(1), yielding a value of 3.10 eV under N-deficient conditions, which is close to that obtained from the standard 2 × 2 × 2 supercell, with deviations limited to ~50 meV. Further analysis of the electronic transport property demonstrates the similarity between 2 × 2 × 2 and 2 × 2 × 3 supercells, confirming the validity of the smaller supercell for qualitative interpretation.
The formation and binding energies of eight trivacancies are listed in
Table 4. It is clear that all three
VMo–
VN–
VMo clusters exhibit negative binding energies, especially for D(1). It is seen in the ELF distributions in
Figure 6 that there is a significant electron loss in the N vacancy on the side adjacent to the Mo hollows. The remaining electrons are mainly distributed around the N vacant site rather than spreading into the mediating region between two Mo vacancies. Large positive Mo hollows can be obviously seen in the three
VMo–
VN–
VMo clusters, which is very similar to what is found in the case of
VMo–
VMo pairs. Although the N vacancy has contributed some electrons to compensate for the electron deficiency of Mo vacancies, it is still far from fully mediating the direct
VMo–
VMo interaction. The negative binding energy is proof that the direct
VMo–
VMo repulsion is superior to the
VMo–
VN attraction in the
VMo–
VN–
VMo cluster. As for the
VN–
VMo–
VN clusters of E(1) and E(2), their specific arrangements of vacancies result in two triangular structures, which can well balance the internal
VMo–
VN attraction and
VN–
VN repulsion, thus leading to small negative binding energies. The
VN–
VMo–
VN cluster of E(3) corresponds to a sandwich structure with one Mo vacancy in the interlayer and two N vacancies in the outer layers. This special structure ensures that the direct
VN–
VN repulsion can be well shielded by the mediated Mo vacancy. The
VMo–
VN attraction thus becomes the dominant interaction in the cluster, giving rise to a positive binding energy. The above analysis of
VN–
VN pairs offers us some clues for designing
VN–
VN–
VN clusters. F(1) and F(2) are two designed
VN–
VN–
VN clusters, both composed of two connected planar quadrilateral structures. Their
VN–
VN–
VN angles are about 150 and 50 degrees, respectively. It is evident from
Figure 6 that the electron densities of three N vacancies in F(1) are well connected and form a uniform electron gas passing through the entire vacancy region, indicating the formation of a
VN–
VN–
VN binding cluster, which is consistent with its positive binding energy. Nevertheless, unlike the extended ELF basin in F(1), a triangular electron gas region is formed in F(2) owing to its smaller
VN–
VN–
VN angle. The structure of F(2) can be regarded as a folded F(1), with a significant decrease in the
VN–
VN–
VN angle by about 100 degrees. The distance between two endpoint N vacancies in F(2) is dramatically reduced as compared to that of F(1), thus leading to a B(2)-type
VN–
VN repulsive interaction. The structural stability of F(2) is accordingly disrupted, resulting in a smaller binding energy than that of F(1). Therefore, it can be said that the N vacancies in
δ-MoN prefer to extend along the diagonal of interconnected quadrilaterals in adjacent N layers rather than clustering in the local structure.
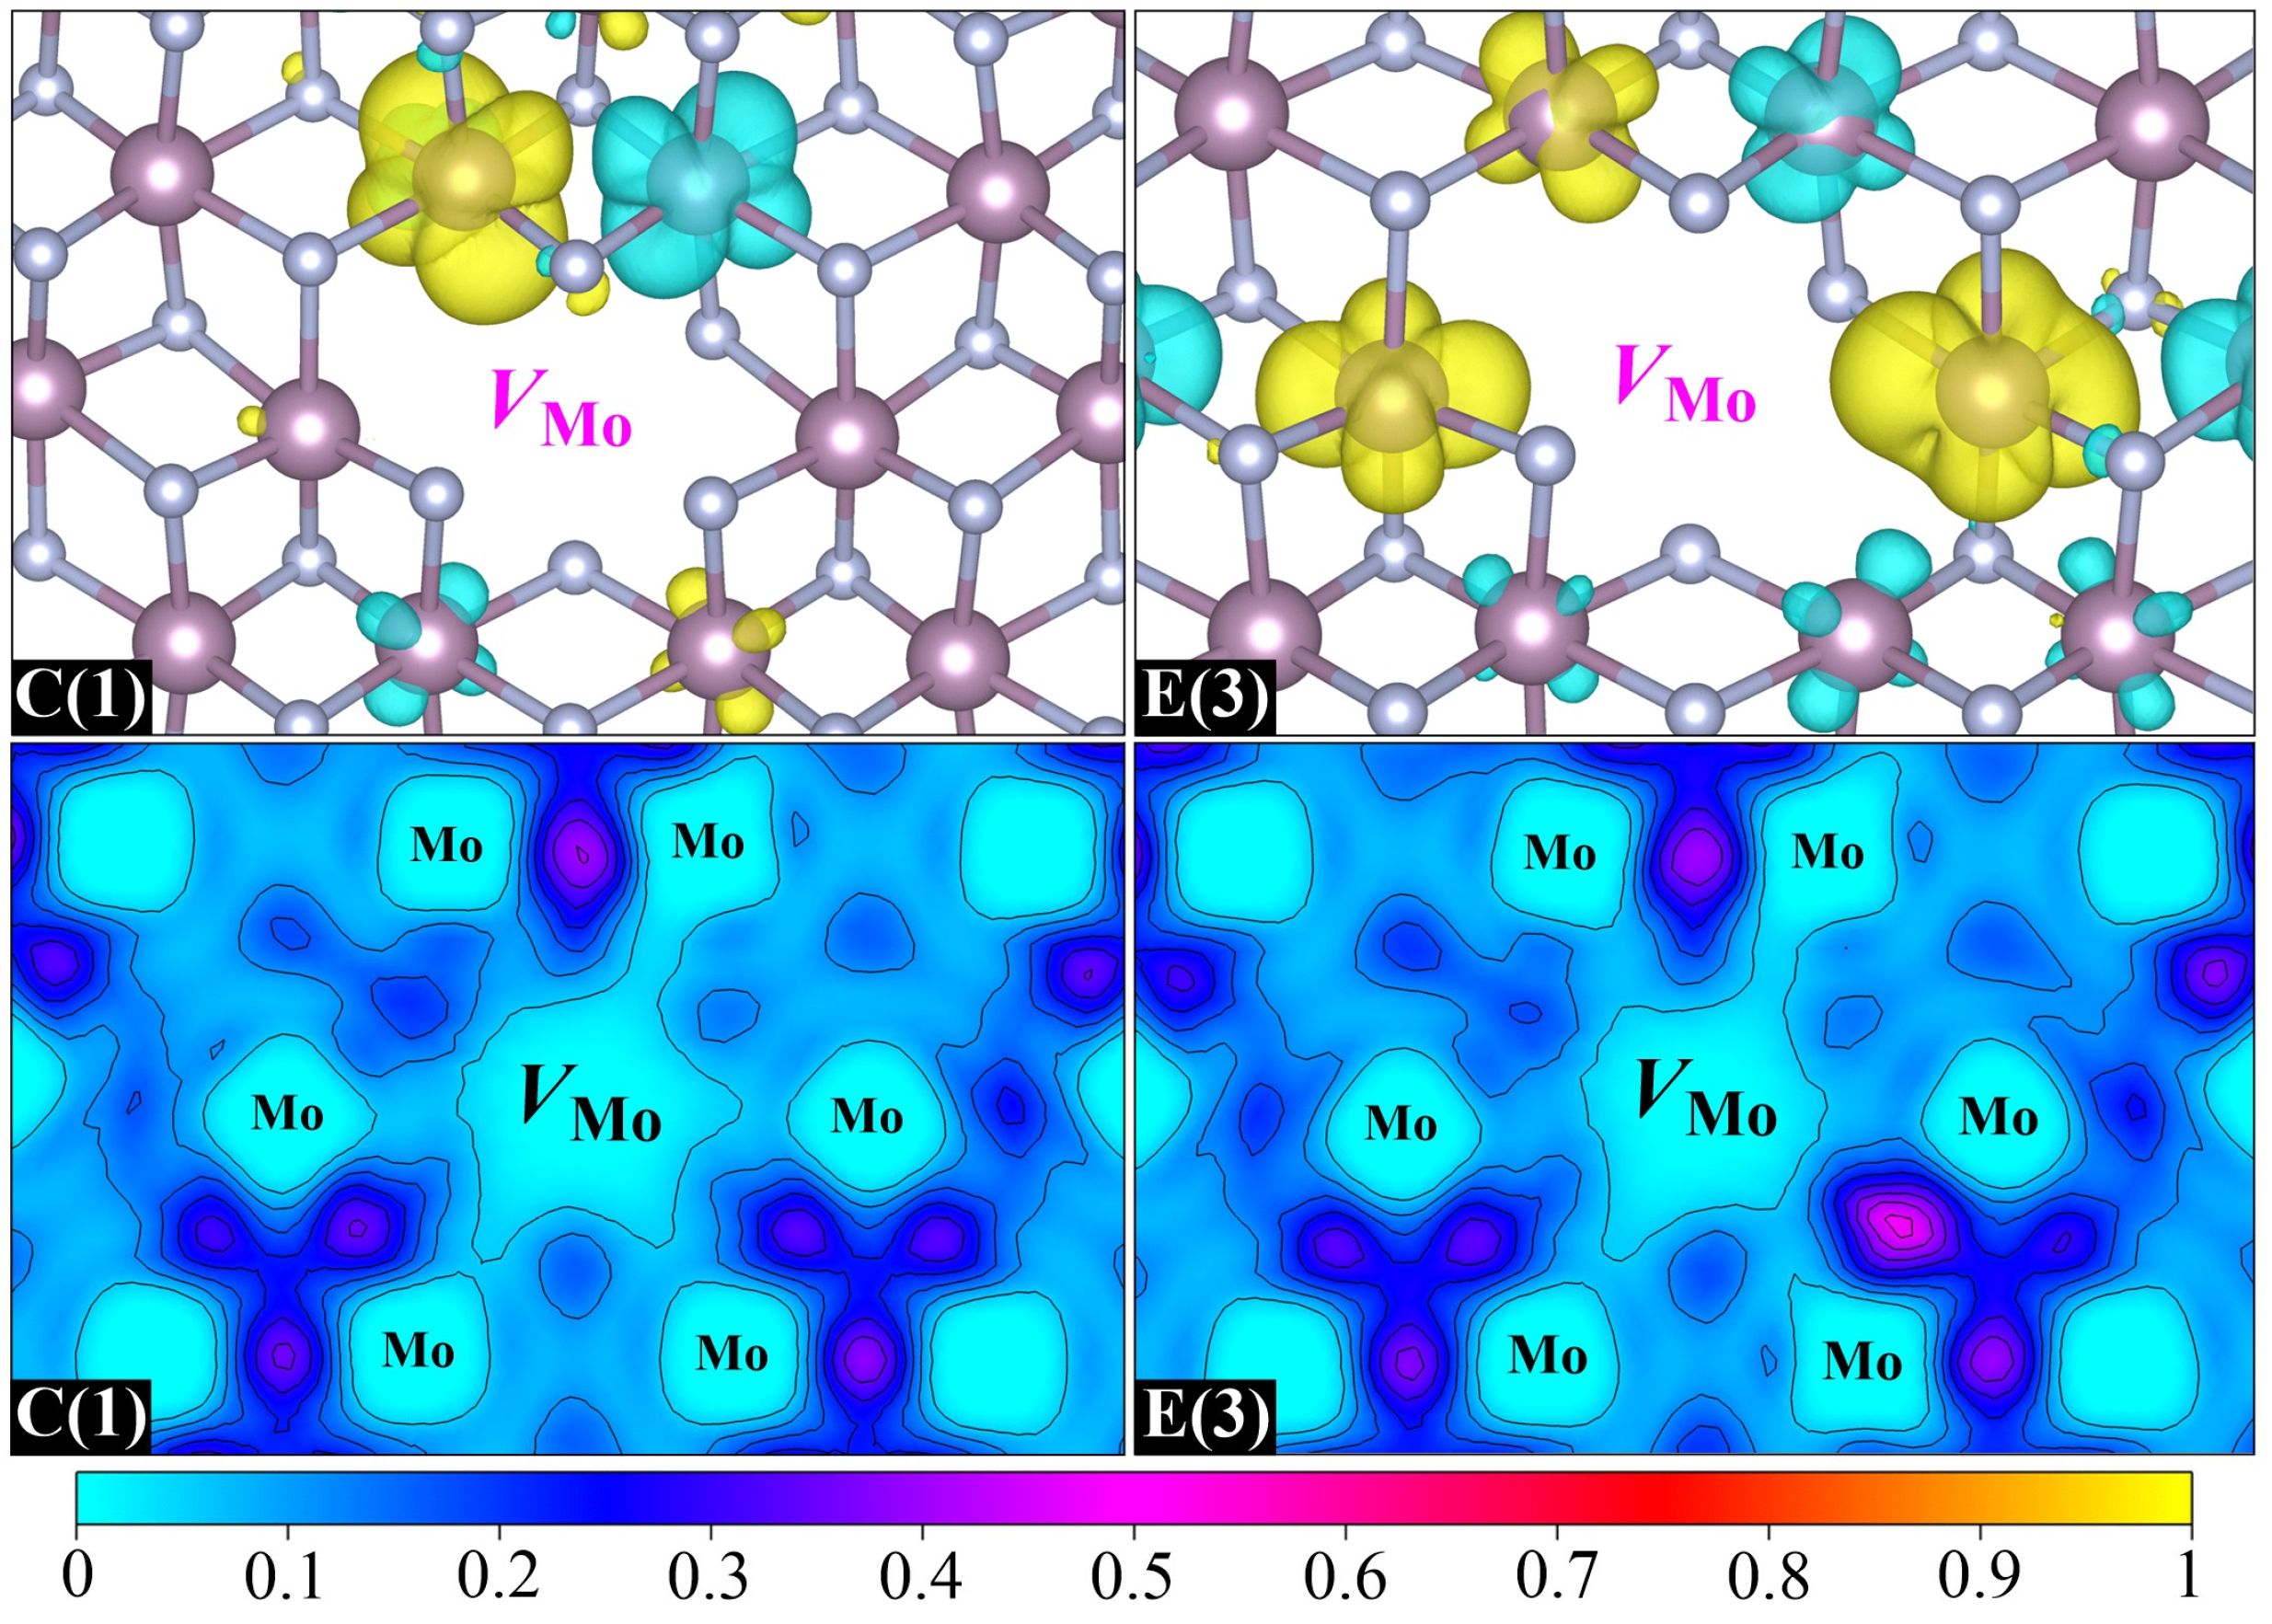
Then, we investigate the magnetic properties of two stable Mo-vacancy-contained binding clusters, namely, C(1) and E(3). Their spin charge density and ELF distributions are displayed in
Figure 7. It is clear that the magnetic moments of C(1) and E(3) mainly come from the spin polarization of Mo-4
d orbitals around the Mo vacancy, which is similar to the case of Mo-monovacancy systems. It is noteworthy that the maximum magnetic moment contributed by a single
d orbital in C(1) is as high as 0.27
μB, and increases to 0.30
μB in E(3), which is almost equivalent to the magnetic moment offered by the two main contributors in Mo
63N
64(2
a) (0.31
μB). This indicates that the formation of the
VMo–
VN or
VN–
VMo–
VN binding cluster is beneficial for enhancing the Mo-vacancy-induced magnetism, which can be further confirmed by the ELF distributions. Once the
VMo–
VN or
VN–
VMo–
VN binding is formed in
δ-MoN, the significant electron loss caused by the departure of the Mo atom could be compensated for by the excess electrons in the N vacancy. As a result, more unpaired electrons will be left around the Mo vacant site, which is the origin of larger magnetic moments. The antiferromagnetic Mo–Mo interaction is also nonnegligible in the two binding clusters, which results in 0.13 and 0.29
μB total magnetic moments for C(1) and E(3), respectively. Similar to Mo-monovacancy systems, the total density of states for C(1) and E(3) exhibits weak spin polarization (
Figure S2), indicating the spatially localized nature of spin polarization around the vacancy site.
Finally, we calculate the electronic conductivities at the temperature of 300 K for the perfect supercell and six selected stable vacancy-contained systems based on the semi-classical Boltzmann theory [
37]. In this framework, the electronic conductivity is defined in units’ relaxation time. The calculated results are summarized in
Table 5. The conductivities along all three crystallographic axes (
XX:
a-axis,
YY:
b-axis, ZZ:
c-axis) have been evaluated, with average values provided for comparative analysis.
It is evident from
Table 5 that the perfect supercell exhibits strong intrinsic anisotropy, with
YY-direction conductivity (4.072 × 10
19 S/m·s) exceeding those of the
XX and
ZZ directions by a factor of ~3.1, which originates from anisotropic electronic delocalization governed by crystallographic symmetry. The introduction of vacancies universally suppresses conductivity due to the dual effects of reduced carrier density near the Fermi level (c.f.
Figure 3 and
Figure S2) and degraded mobility. However, the extent of degradation and its anisotropy depend on the vacancy type and concentration. For instance, a single Mo vacancy [Mo
63N
64(2
a)] preferentially disrupts
YY-direction transport, reducing by 34.6%, suggesting Mo-dominated conduction channels along
b-axis, while a single N vacancy [Mo
64N
63(2
b)] severely compresses
ZZ-direction conductivity, lowering by 41.2%, highlighting nitrogen’s critical role in facilitating interlayer charge transfer along the
c-axis. Multi-vacancy configurations amplify these effects significantly. Taking F(1) as an example, triple N vacancies induce an 81.6% reduction in
ZZ-direction conductivity, as compared to that of the perfect supercell. Calculations performed on a larger 2 × 2 × 3 supercell with triple N vacancies results in a
ZZ-direction conductivity of 0.229 × 10
19 S/m·s and an average conductivity of 0.988 × 10
19 S/m·s, suggesting the disruption of transport channels along the
c-axis, consistent with the behavior observed in the 2 × 2 × 2 supercell. Noticeably, Mo vacancies introduce weak spin asymmetry between spin-up and spin-down conductivities, consistent with the emergence of local magnetism in Mo-vacancy-contained systems, while N vacancies exhibit negligible spin polarization. The anisotropic conductivity degradation aligns with the directional disruption of transport pathways. The
YY direction’s sensitivity to Mo vacancies implies the dominance of axial Mo–Mo bonding networks in
b-axis conduction. The ZZ direction’s sensitivity to N vacancies suggests their critical function in mediating vertical charge transport across layers.
In summary, this study presented a detailed theoretical analysis on the vacancy formation and clustering behavior in δ-MoN, revealing the effects of vacancies on the bonding, electronic structure, magnetism, and transport properties. Nevertheless, the influence of excess vacancies on other important properties, such as phase stability and mechanical performance, remains underexplored. This highlights the necessity for future investigations and provides guidance for our subsequent work.


