3.1. Characterization of Ag@CeO2
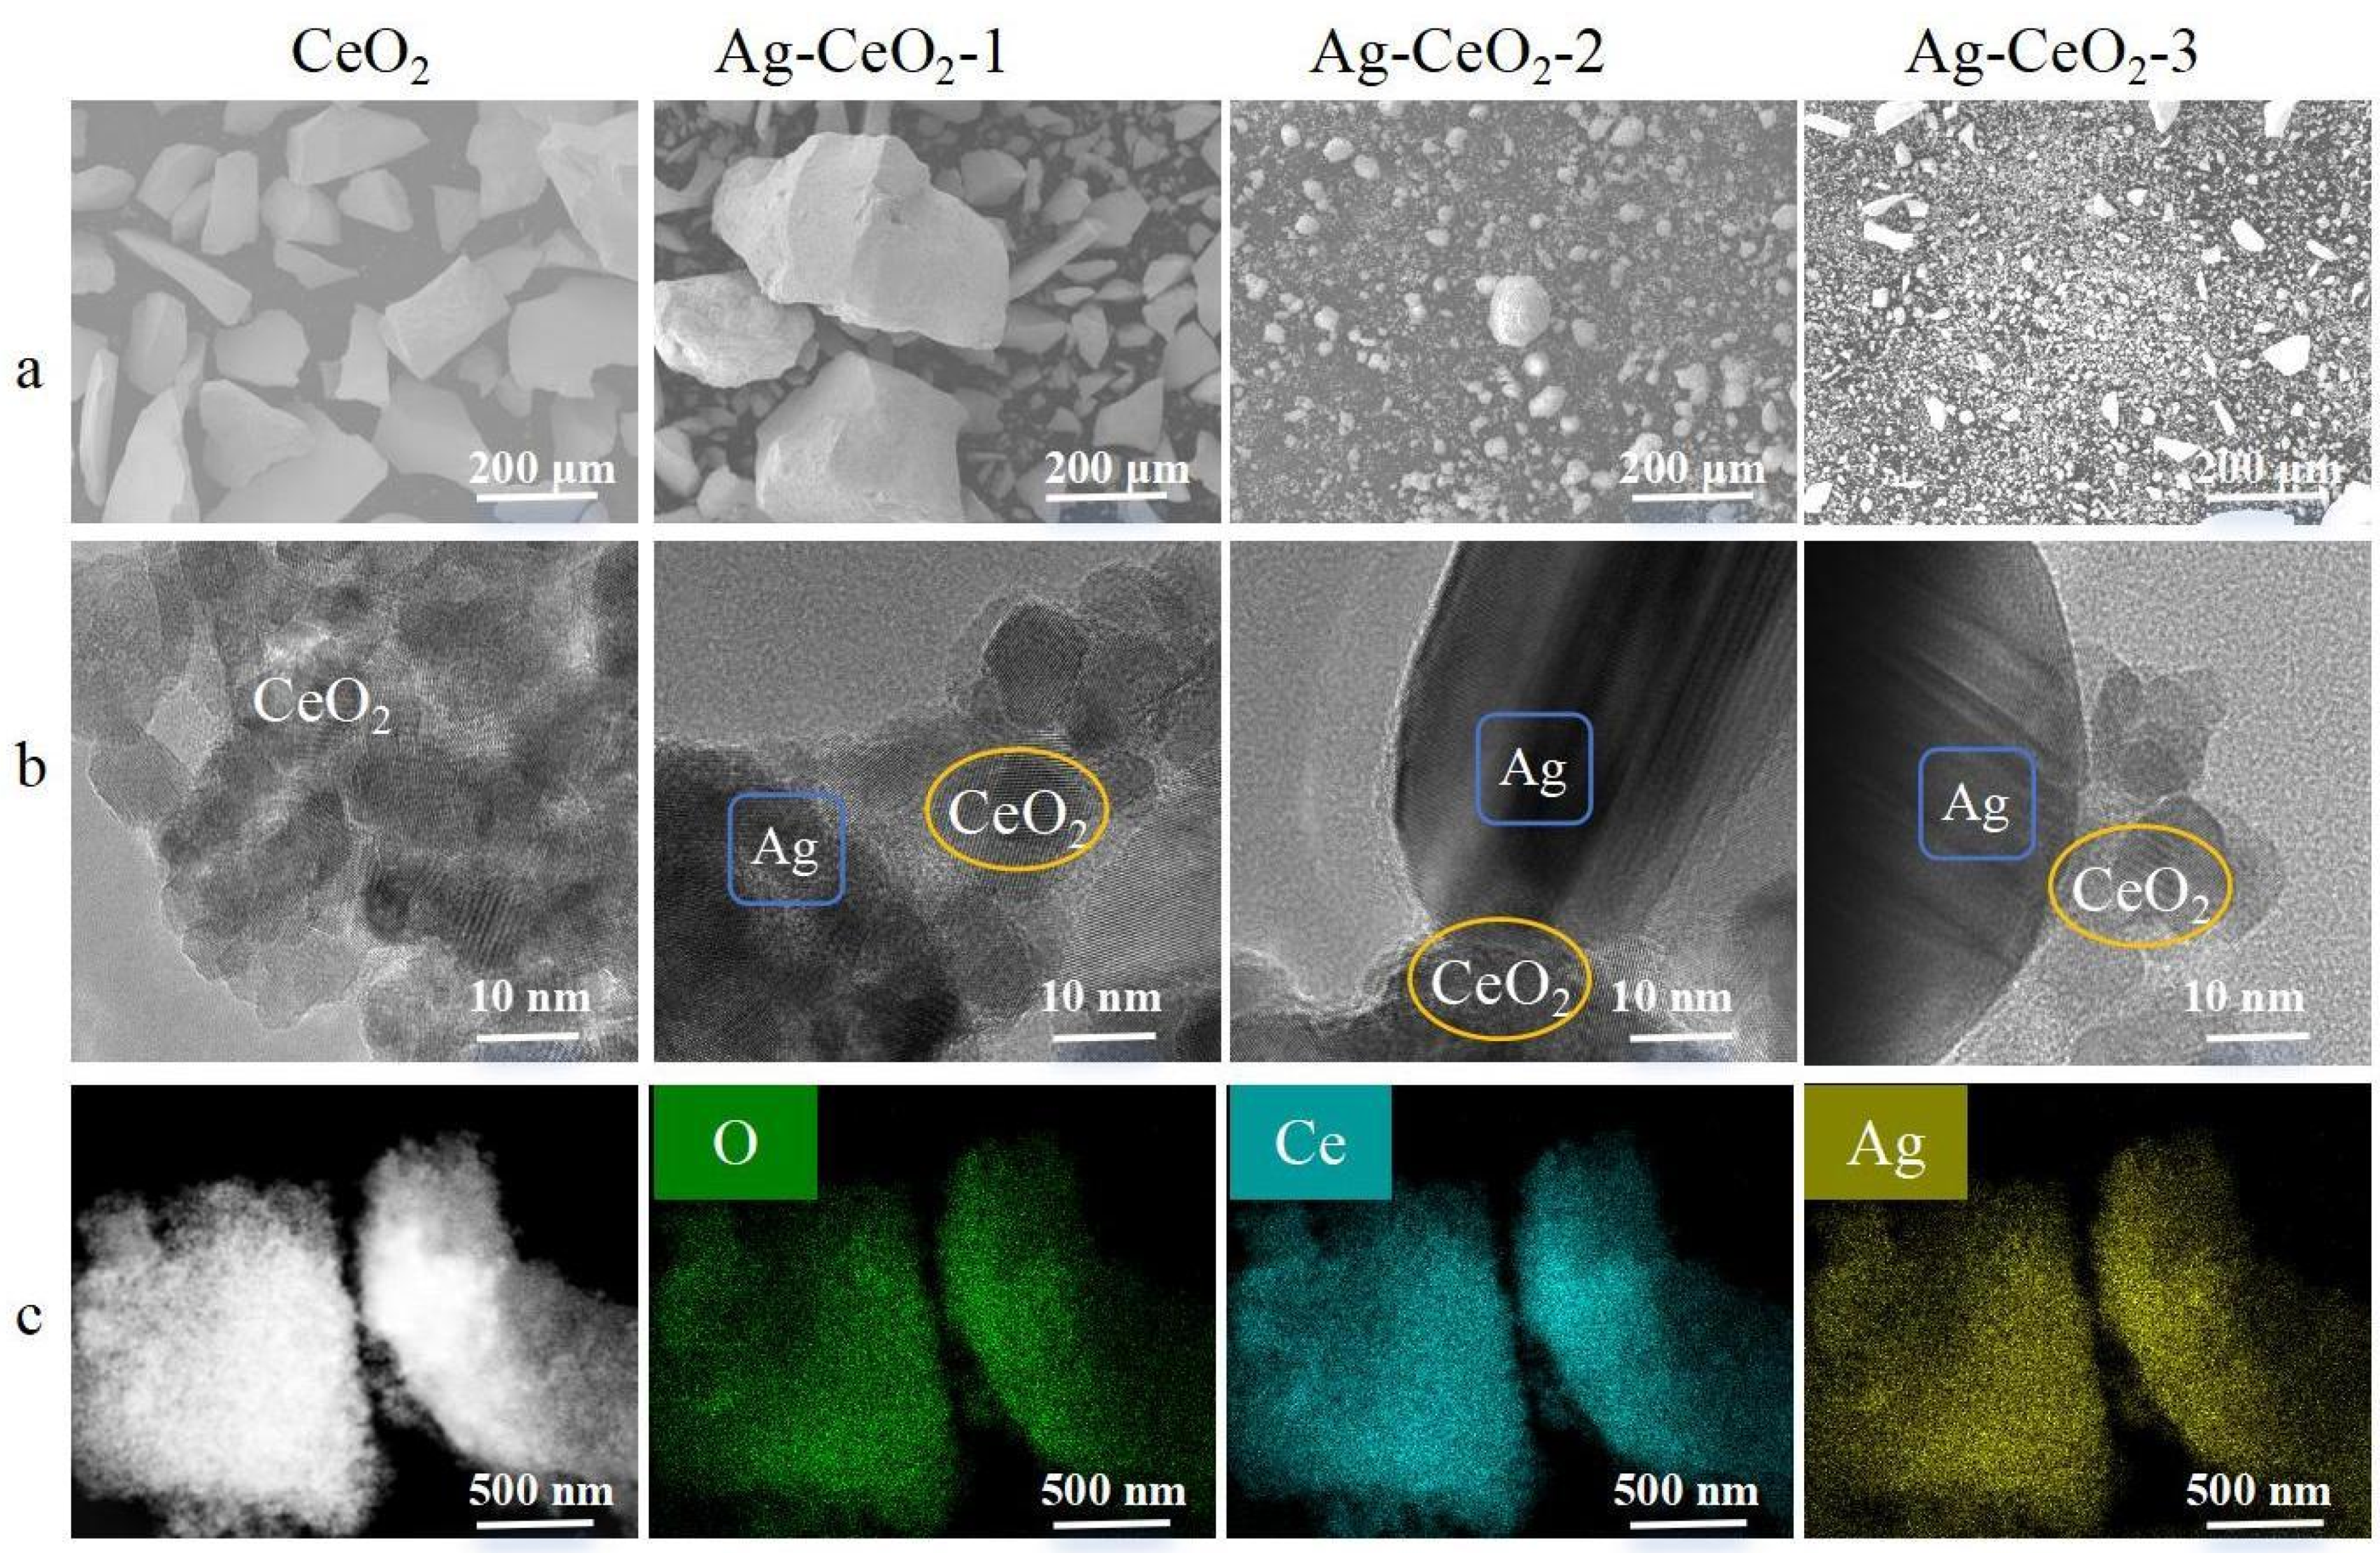
The SEM characterization of the synthesized Ag@CeO
2 in
Figure 1a revealed significant agglomerations of CeO
2 particles in Ag@CeO
2-1, whereas the Ag@CeO
2-2 and Ag@CeO
2-3 particles obtained exhibited a more dispersed morphology. Further TEM characterization in
Figure 1b facilitated a clearer observation of the particle morphology of the synthesized nanoparticles. Combined with mapping elemental analysis in
Figure 1c, it confirmed the presence of both Ag and CeO
2 of synthesized Ag@CeO
2 nanoparticles, indicating the successful preparation of Ag@CeO
2 nanoparticles.
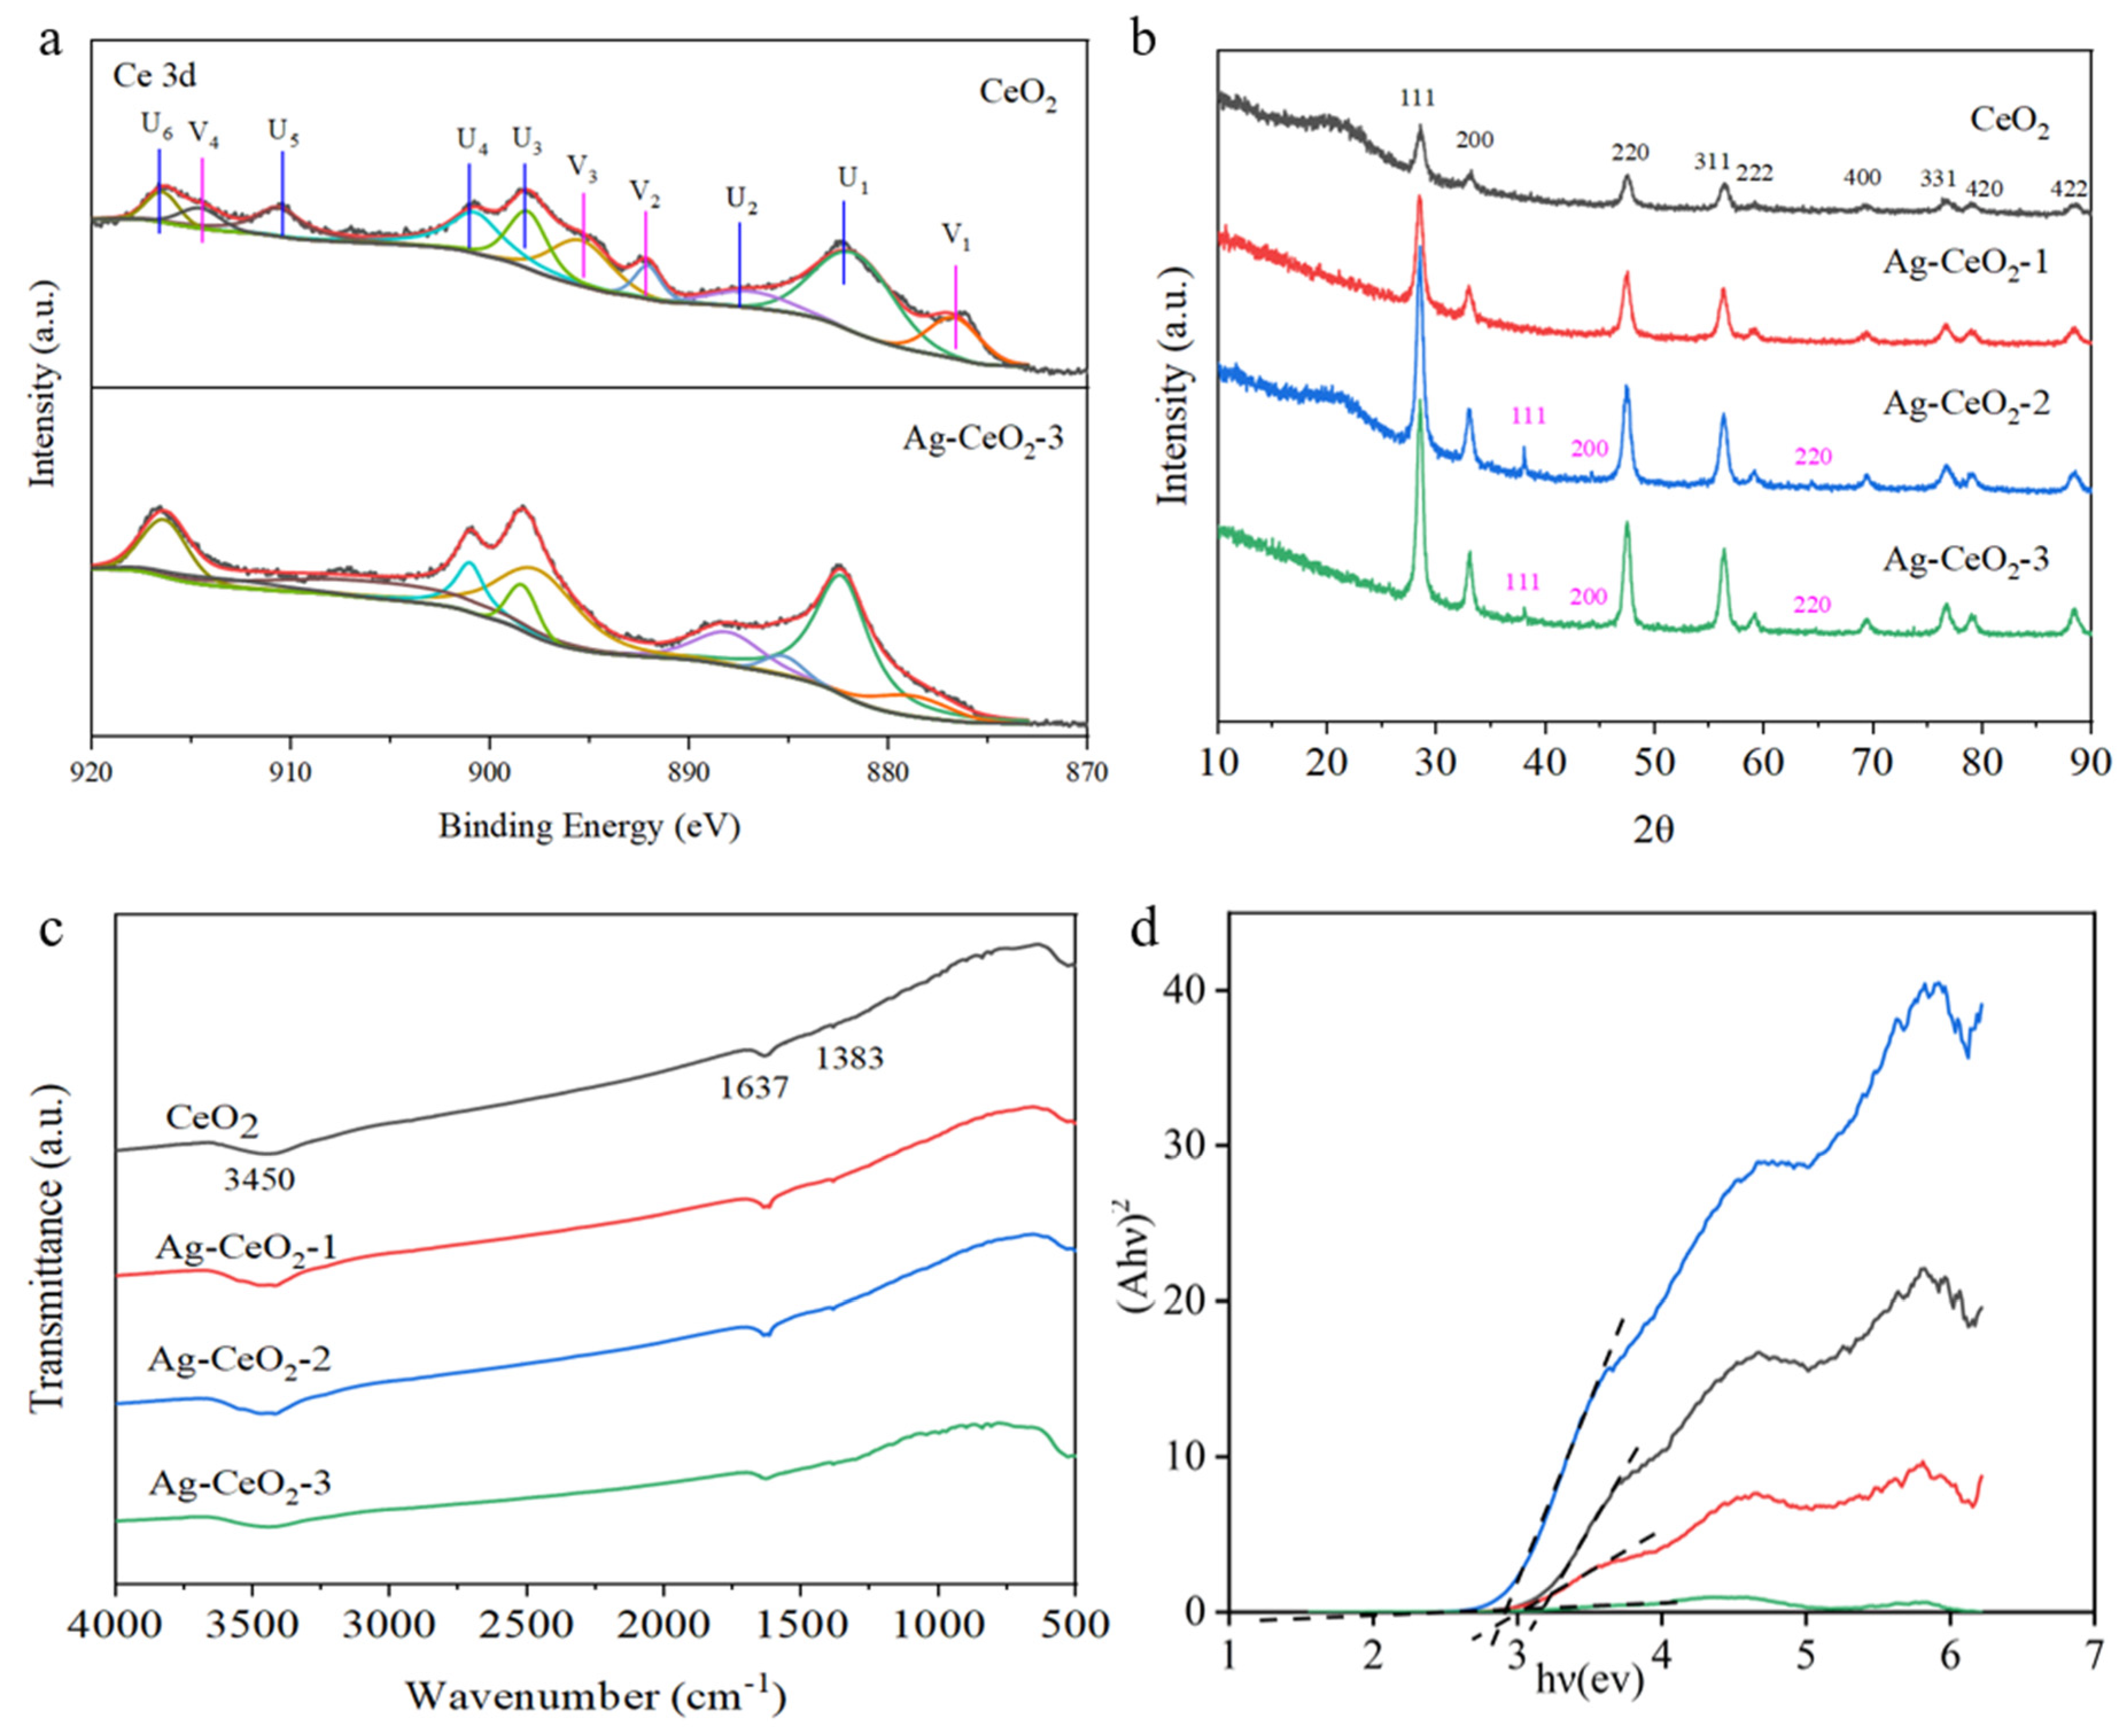
XPS analysis in
Figure 2a presents Ce 3d in both pure CeO
2 and Ag@CeO
2-3 samples. A comparison between these two samples reveals that the Ce 3d spectrum displays a rather complex structure. The peaks labeled U1–U6 correspond to six peaks associated with Ce
4+ 3d (881.73, 886.95, 895.45, 900.76, 910.61, and 916.47 eV), while V1–V4 represent four peaks related to Ce
3+ 3d (876.69, 892.09, 893.13, and 914.57 eV). It is calculated that the percentage of Ce
4+ in pure CeO
2 is approximately 71.34%, while that for Ce
3+ is about 28.66%. With the addition of Ag, it can be determined that the percentage of Ce
4+ in Ag@CeO
2-3 was increased to approximately 85.35%, confirming electronic interactions between Ag and CeO
2, while the percentage of Ce
3+ decreases to around 14.65%. This indicates that incorporating Ag promotes an increase in the proportion of Ce
4+, thereby enhancing enzyme mimetic activity, which favors biological applications.
Structural characterization conducted via XRD demonstrated that pure CeO
2 exhibits a classical crystalline fluorite structure characterized by several distinct diffraction peaks at angles including 2θ = 28.5°, 33.1°, 47.5°, 56.3°, 59.1°, 69.4°, 76.7°, 79.1°, and 88.4° in
Figure 2b. These peaks correspond to the (111), (200), (220), (311), (222), (400), (331), (420), (422) planes in JCPDS card No. 34-0394 and (311), (222), (400), (331), (420), (422) planes, respectively, as listed in JCPDS card No. 34-0394. The Ag@CeO
2 nanoparticles synthesized using method I show almost no observed peaks corresponding to metallic silver, indicating that Ag is highly dispersed on the surface of CeO
2, making it difficult to detect. In contrast, XRD analysis of Ag@CeO
2-2 and Ag@CeO
2-3 revealed peaks at 2θ = 38.2°, 44.2°, and 68.4°, corresponding to the (111), (200), and (220) planes of face-centered cubic Ag (JCPDS File No. 89-3722), corresponding to the (111), (200), and (220) planes, associated with Ag composition, respectively (JCPDS File No. 89-3722). These results indicated that Ag had been successfully loaded onto the CeO
2 surface.
FTIR spectra of pure CeO
2, Ag@CeO
2-1, Ag@CeO
2-2, and Ag@CeO
2-3 were characterized in
Figure 2c. The broad peak observed at 3450 cm
−1 is attributed to the stretching vibrations of the O-H group, likely resulting from moisture absorbed from the air onto the sample surfaces. The absorption band at 1637 cm
−1 corresponds to an O-Ce-O bond and resembles the bending mode of H-O-H. A minor peak at 1384 cm
−1 can be associated with the bending vibrations of Ce-O bonds, while the absorption peak detected at 554 cm
−1 relates to Ce-O bond vibrations. Notably, the peaks for both pure CeO
2 and variously prepared Ag@CeO
2 nanoparticles remained nearly identical. Moreover, the high dispersion of Ag loaded onto CeO
2 surfaces made it difficult to observe Ag by FTIR. As shown in
Figure 2d, the band gap of CeO
2, Ag-CeO
2-1, Ag-CeO
2-2, and Ag-CeO
2-3 is about 3.14 eV, 3.01 eV, 2.93 eV, and 2.67 eV, respectively. The band gap energy decreased when Ag was coupled with CeO
2, and the Ag-CeO
2 nanoparticles with low band gap energy exhibited better performance in visible light-induced reactions. This also proves that the plasmon resonance effect of the precious metal Ag caused the formation of localized energy levels within the original CeO
2 band gap, thereby reducing band gap.
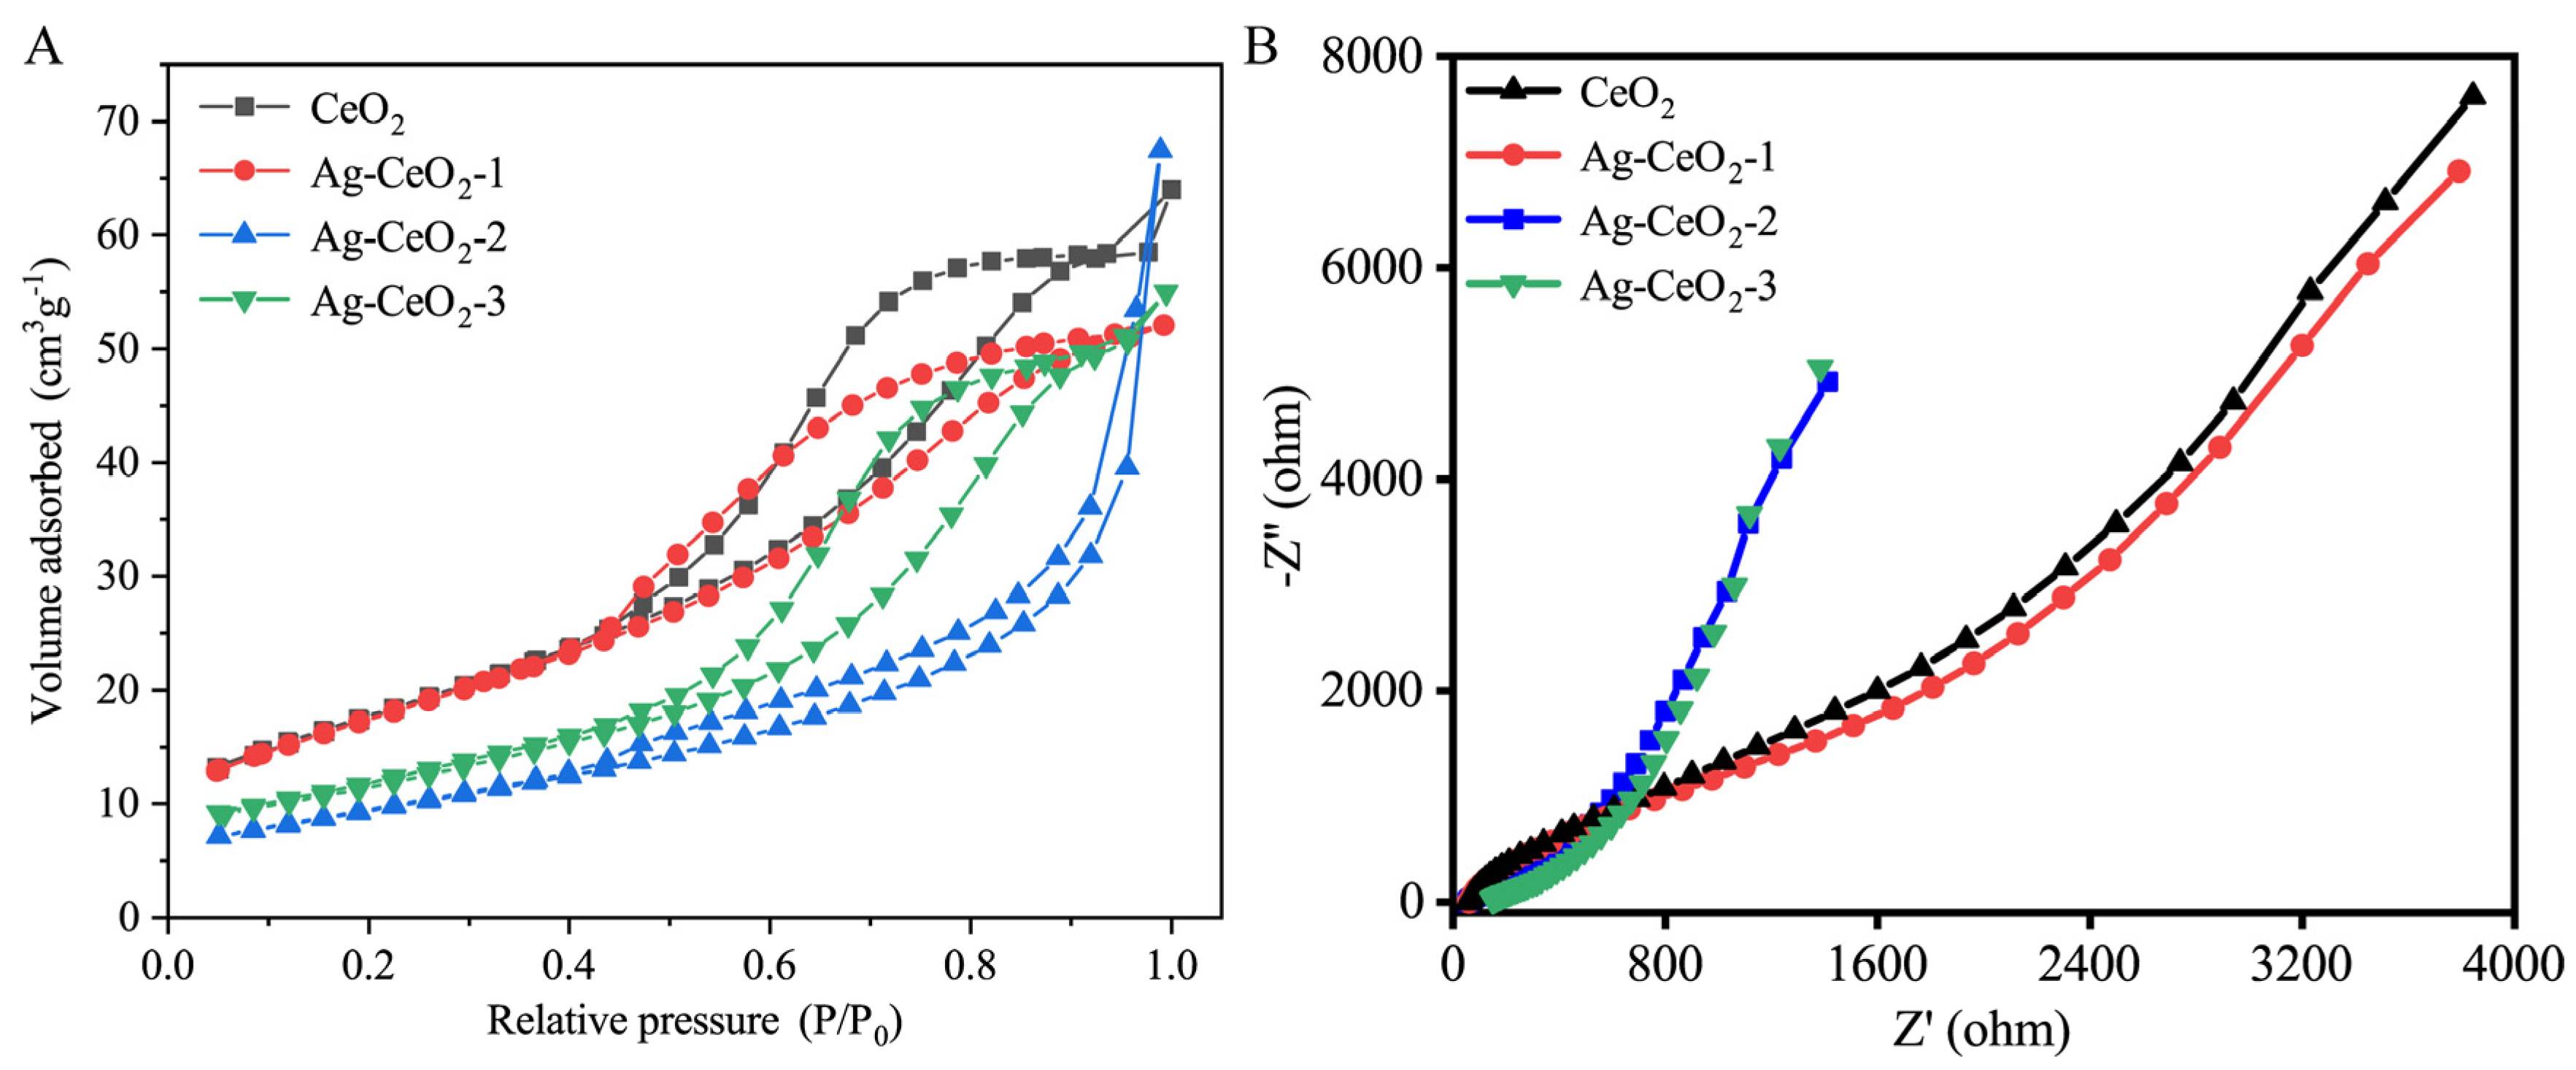
Figure 3A presents the N
2 adsorption-desorption isotherms of pure CeO
2 and Ag@CeO
2 composite nanomaterials. CeO
2, Ag@CeO
2-1, and Ag@CeO
2-3 displayed type IV isotherms with H3 hysteresis loops, likely resulting from the aggregation of cubic particles and the subsequent formation of slit-like pore structures. In contrast, Ag@CeO
2-2 showed typical type IV isotherms with H2 hysteresis loops, which may stem from pores formed by composition agglomeration. Slit porous materials are well-known for their significant role in biocontainment, as drug molecules can be easily transported and loaded within the porous structure. The pore size and specific surface area of the samples were determined from the pore size distribution curves in
Table 1. The specific surface areas of CeO
2, Ag@CeO
2-1, Ag@CeO
2-2, and Ag@CeO
2-3 are 64.5235 m
2/g, 63.4621 m
2/g, 33.9442 m
2/g, and 41.3521 m
2/g, respectively. While N
2 adsorption-desorption isotherms and pore size distribution provide critical insights into the textural properties of the materials, it should be noted that these data primarily reflect bulk structural features rather than directly proving silver loading. The observed differences in hysteresis loops (H3 for Ag@CeO
2-1/3 vs. H2 for Ag@CeO
2-2) and specific surface area reduction (from 64.52 m
2/g for pure CeO
2 to 41.35 m
2/g for Ag@CeO
2-3) are consistent with silver incorporation but require validation through complementary techniques. Furthermore, XPS analysis in
Figure 2a demonstrated altered Ce
3+/Ce
4+ ratios, confirming electronic interactions between Ag and CeO
2. XRD patterns in
Figure 2b revealed distinct metallic Ag peaks (2θ = 38.2°, 44.2°) in Ag@CeO
2-2/Ag@CeO
2-3, absent in pure CeO
2. These combined results provide unambiguous evidence for successful silver loading, with N
2 isotherms serving as secondary indicators of structural modification.
Figure 3B presents electrochemical impedance spectroscopy (EIS) analysis of the prepared samples, employed to assess their electron transfer efficiency. A smaller semicircle diameter in the Nyquist plot signifies lower resistance. The Ag@CeO
2 nanoparticles exhibited markedly reduced resistance compared to pure CeO
2, notably Ag@CeO
2-2, which exhibits the smallest charge transfer resistance. It is speculated that silver (Ag), being a good conductor, forms a conductive network when doped into cerium dioxide, thereby improving electronic conductivity. Furthermore, optimized dispersion in Ag@CeO
2-2 may contribute to its superior conductivity. Besides, the sharp increase in the slope of the straight line for Ag@CeO
2-2 and Ag@CeO
2-3, indicating that these materials of Ag@CeO
2-2 and Ag@CeO
2-3 are primarily electron conductive, is good electronic conductivity. The introduction of silver significantly improved the conductivity of ceria, and with the optimization of doping conditions, the conductivity was further enhanced. This indicates significantly enhanced interfacial photogenerated charge transfer efficiency, attributed to Ag composition loading. This advantageous electrical property not only boosts electron transfer but also promises to minimize external environmental interference in cell impedance detection, making Ag@CeO
2-3 a promising candidate for high-sensitivity biosensing applications.
From
Figure 3, strong interfacial bonding (Ce-O-Ag) of Ag@CeO
2-1 promotes electron transfer from Ag to CeO
2, increasing the proportion of Ce
3⁺ and the concentration of oxygen vacancies, while Ag exists in an oxidized state, enhancing the interfacial charge transfer capacity with low impedance. Ag@CeO
2-2 presents Ag particles that are in situ dispersed on the surface of porous CeO
2 in a metallic state of Ag
0, with a moderate concentration of oxygen vacancies and interfacial contact, resulting in moderate impedance. For Ag@CeO
2-3, there is only physical adsorption between Ag and CeO
2, with hindered interfacial electron transfer and high impedance, and Ag exists as large Ag
0 particles with a low proportion of Ce
3⁺. Besides, the interfaces of Ce-O-Ag in Ag@CeO
2-1 promote the transfer of electrons from Ag to CeO
2, increasing the proportion of Ce
3+ and leading to more oxygen vacancies, while Ag exists in an oxidation state that enhances the charge transfer ability of the interface of low impedance. Ag particles in Ag@CeO
2-2 are dispersed in situ on the surface of porous CeO
2 in a metallic state (Ag
0), with moderate oxygen vacancy concentration and interfacial contact. Ag@CeO₂-3 exhibits physical adsorption between Ag and CeO₂, the interface electron transfer is blocked, and Ag exists in large particle Ag
0 and a low proportion of Ce
3+. As a result, Ag@CeO
2 materials synthesized by three different methods have different oxygen vacancies and, consequently, different antioxidant abilities.
In short, three synthetic methods were employed to investigate the distinct binding mechanisms between Ag nanoparticles and CeO2. Ag@CeO2-1 was synthesized via co-precipitation under strongly alkaline conditions, forming an Ag-Ce composite hydroxide precursor. After calcination, Ag was embedded into the CeO2 lattice, inhibiting its growth. However, lattice distortion caused broadening of the XRD peaks. Ag@CeO2-2 was prepared using homogeneous precipitation with urea to slowly release NH3, forming a homogeneous precursor. Low-temperature drying preserved a porous structure, and subsequent calcination yielded small crystallite CeO2 with uniformly dispersed metallic Ag0 (high specific surface area). Ag@CeO2-1 was fabricated via impregnation, physically adsorbing Ag onto pre-formed CeO2 surfaces. During calcination, Ag migrated and agglomerated into large Ag0 particles (distinct metallic Ag peak), leading to pore blockage (lowest specific surface area), hindered interfacial electron transfer (high impedance), and a reduced proportion of Ce3+. The three methods resulted in distinct Ag-support interactions: lattice embedding, uniform dispersion, and surface agglomeration, respectively.
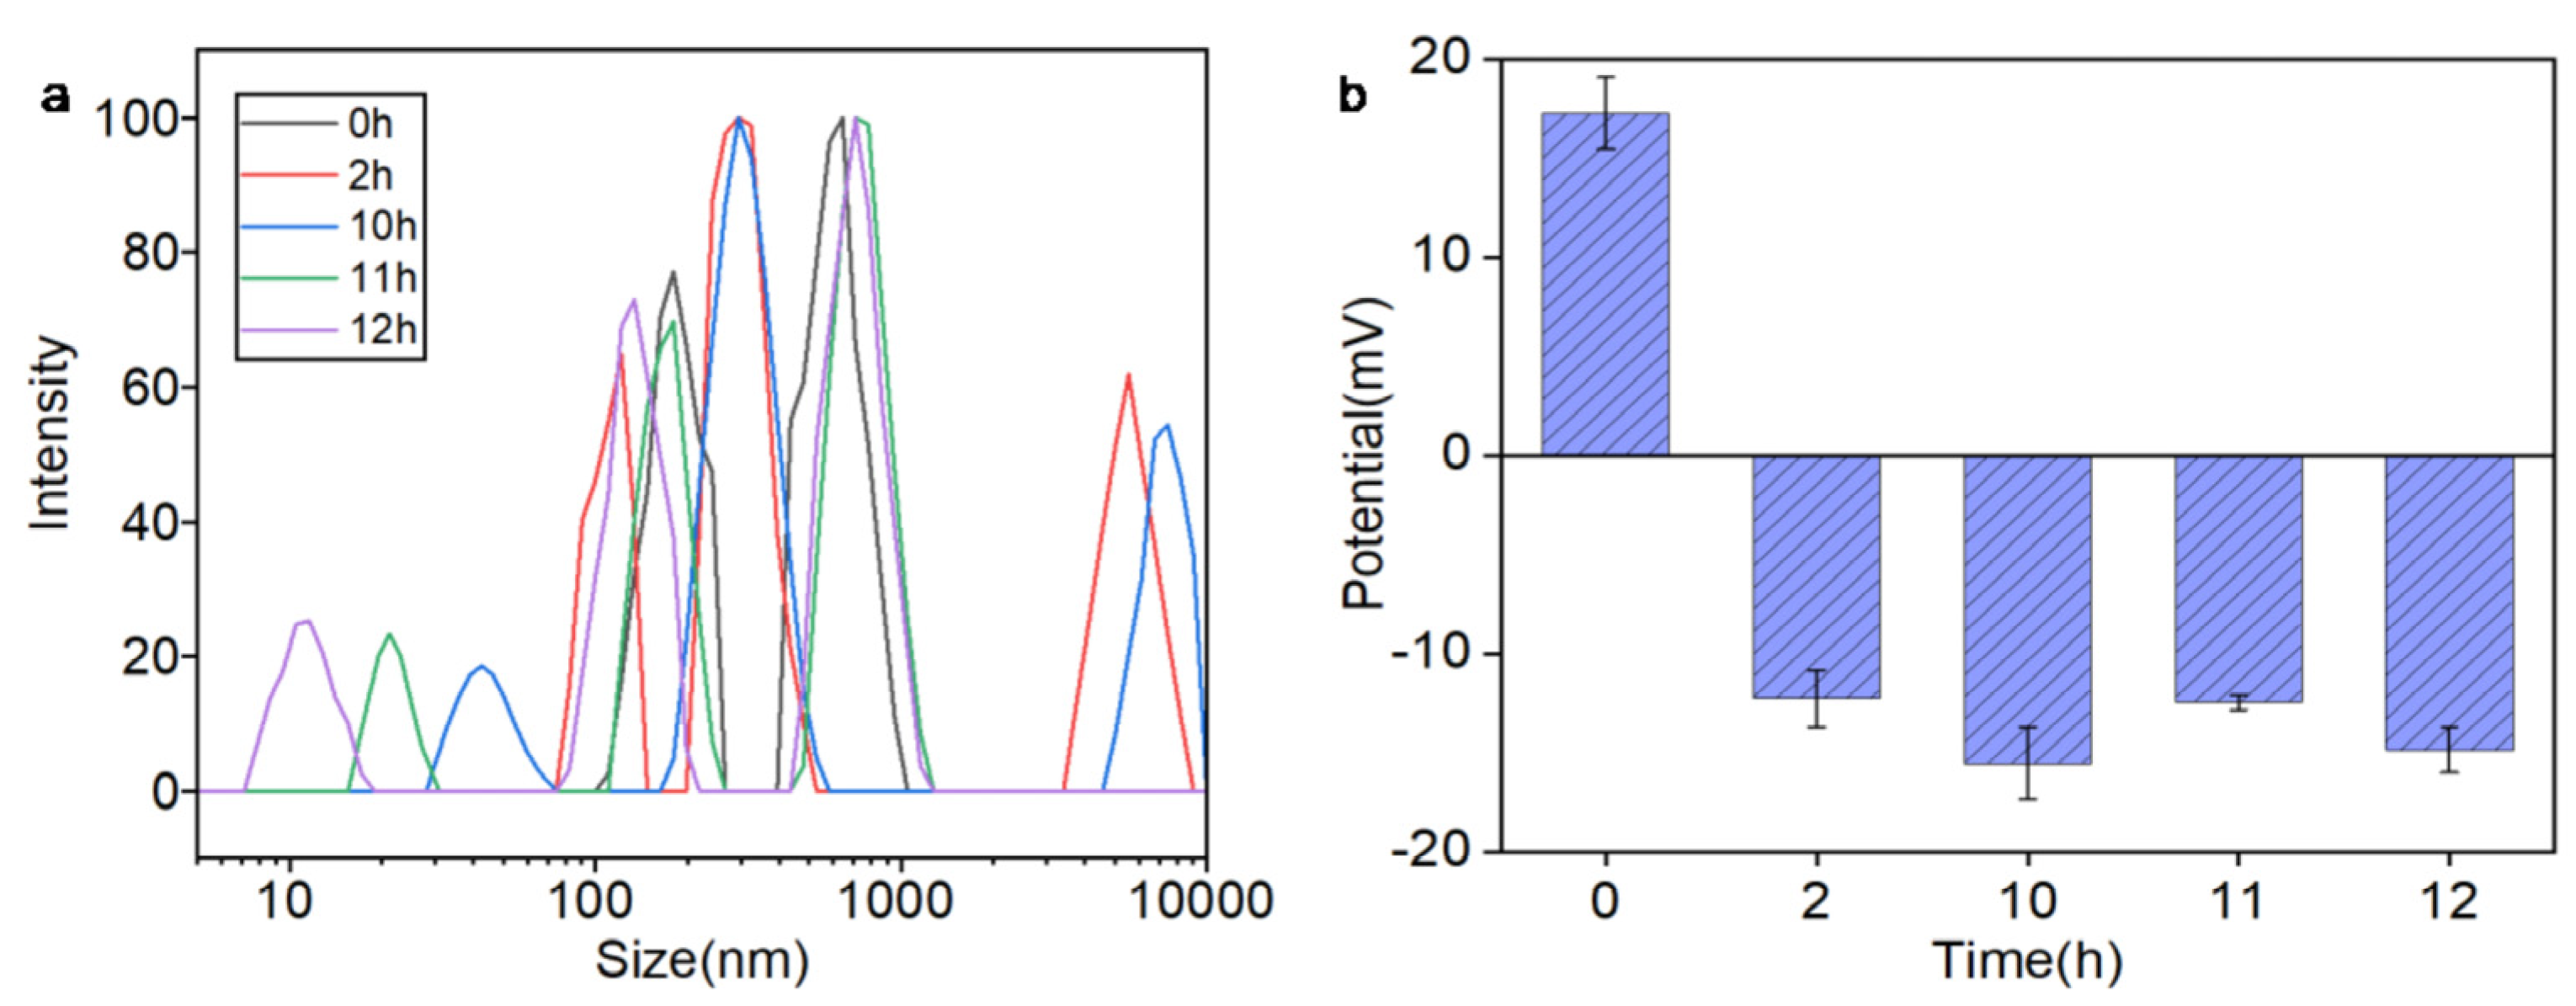
DLS and zeta potential analyses in
Figure 4 revealed a time-dependent stability profile of Ag@CeO
2–3 nanoparticles in biological media. Initially, the nanoparticles exhibited a positive zeta potential (+17 mV) and moderate hydrodynamic size (~140 nm), favoring electrostatic interactions with negatively charged cell membranes and facilitating early cellular uptake (0–2 h). However, within 2 h, the zeta potential shifts to negative values (−15 mV) due to protein corona formation, coinciding with a gradual increase in particle size (reaching ~200 nm by 12 h). This transition confirmed progressive aggregation, consistent with colloidal instability at low absolute zeta potentials (<30 mV). Critically, the nanoparticles maintained partial dispersion and bioactivity during the first 10 h in
Figure 4a, providing a sufficient temporal window for cellular internalization in our biological assays (conducted within 24 h). The initial positive charge and nanoscale size (30–60 nm) enabled selective tumor cell targeting in
Figure 5,
Figure 6 and
Figure 7, while subsequent aggregation limits long-term stability but did not preclude therapeutic efficacy in short-term treatments. These findings underscore the importance of timing in nanoparticle-based therapies, where early cellular uptake precedes significant aggregation-mediated loss of function.
The observed differential cytotoxicity between tumor and normal cells suggests time-dependent selective effects mediated by the initial nanoparticle properties (0–10 h window), though material stability limitations must be acknowledged. While the initial positive zeta potential (+17 mV) may facilitate tumor cell interactions, the aggregation behavior precludes definitive conclusions about long-term targeting specificity. This selective targeting is further supported by the nanoparticles’ ability to maintain moderate dispersion in the medium for up to 10 h, allowing sufficient time for tumor cell interaction before aggregation occurs. The progressive aggregation and charge reversal observed after 11 h may reduce the nanoparticles’ targeting efficacy, highlighting the importance of optimizing the time frame for their application in biological environments to maximize therapeutic benefits while minimizing off-target effects. Additionally, the nanoparticles’ antioxidant properties and their ability to modulate the tumor microenvironment could contribute to their selective effects on tumor cells, as they may protect normal cells from oxidative damage while exerting cytotoxic effects on tumor cells through mechanisms such as H2O2 accumulation and Ce4+ ion release in the acidic tumor microenvironment.
Figure 4.
Stability profile of Ag@CeO2-3 nanoparticles in DMEM + 10% FBS: (a) The relationship between size and intensity; (b) Zeta potential transition from +17 mV (0 h) to −15 mV (2–12 h) due to protein corona formation. The shaded region (0–10 h) indicates the optimal window for cellular uptake, during which nanoparticles maintain sufficient dispersion for biological activity. All cellular experiments were conducted within 24 h to ensure nanoparticle functionality.
3.3. Antioxidant and Cytotoxicity of CeO2 and Ag@CeO2
Although the role of antioxidants in tumor treatment remains controversial, they can serve as adjuvant therapies to alleviate oxidative stress damage during treatment, thereby enhancing treatment efficacy. For instance, by modulating the redox status in the tumor microenvironment, the effectiveness of chemotherapy and radiotherapy can be augmented. Future tumor treatments could be personalized based on the stage of the tumor, the redox status of tumor cells, and the individual immune function of patients. This personalized approach can help maximize the potential benefits of antioxidants while mitigating their potential risks. Peroxidase, a well-known free radical scavenger, is one of the most traditional antioxidant marker enzymes. Therefore, the ABTS-H
2O
2 system was employed to evaluate the antioxidant activity of CeO
2 and Ag@CeO
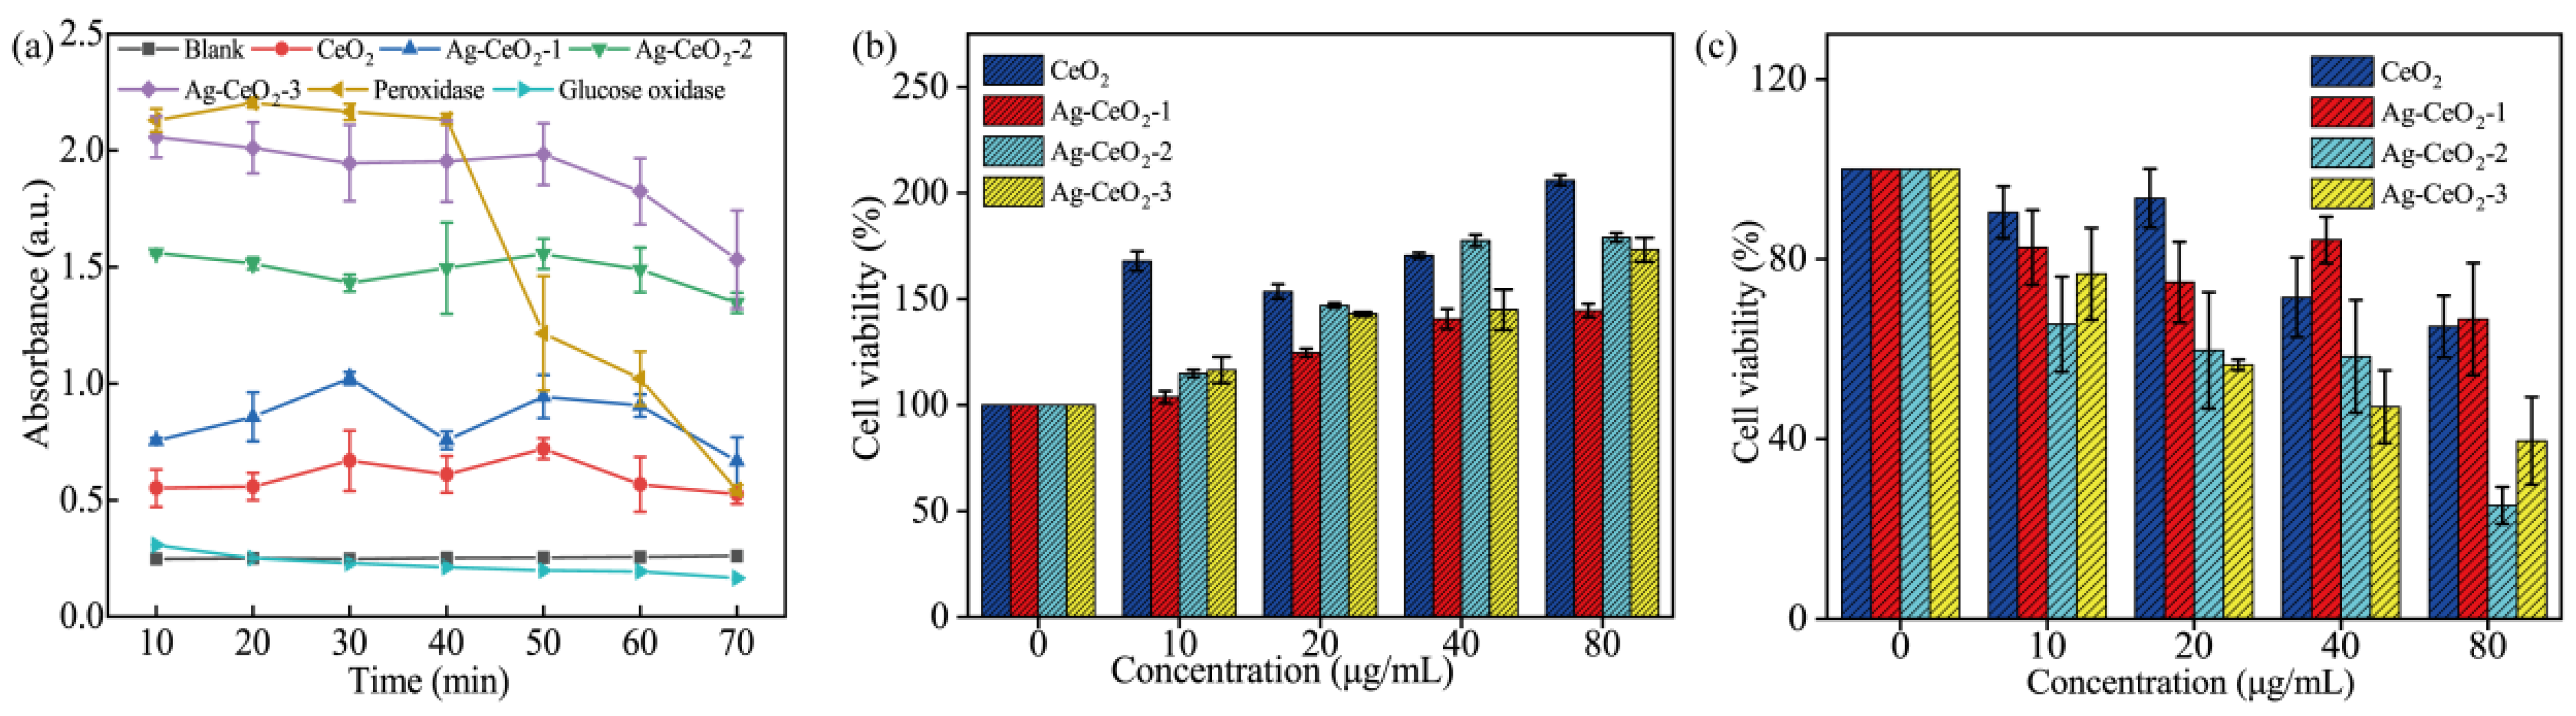
2. As shown in
Figure 5a, both CeO
2 and Ag@CeO
2 exhibit peroxidase activity and possess high antioxidant stability, making them promising candidates for sustained drug release. Notably, Ag@CeO
2-3 demonstrates the highest peroxidase activity [
26], showing the strongest antioxidant activity, comparable to that of peroxidase and with a longer-lasting effect, suggesting its potential use in free radical scavenging drugs and tumor antioxidant therapy. These results are consistent with the XPS and EIS analysis results that Ag@CeO
2-3 has highest antioxidant abilities. Furthermore, antioxidants are typically used to neutralize free radicals, which are harmful to cells. Therefore, antioxidant materials may help reduce cell damage and lower cytotoxicity. In this work, Ag@CeO
2 materials are composite materials composed of silver and CeO
2. CeO
2 itself is a commonly used antioxidant material, especially nano-cerium dioxide, because it has a Ce
3+/Ce
4+ redox cycle, which can eliminate free radicals. Ag nanoparticles have antibacterial properties, but they may also have cytotoxicity. The combination of the two may produce synergistic or antagonistic effects. Hence, the cytotoxicity of both CeO
2 and Ag@CeO
2 is investigated, and they are expected to act as sustained-release drugs, which were evaluated using the CCK-8 kit in the exposure of MCF-7 cancer cells as well as normal HUVEC cells for 24 h. As illustrated in
Figure 5b,c, Ag@CeO
2-3 demonstrated time-dependent selective cytotoxicity, with >60% cell death in MCF-7 versus <20% in HUVECs at 80 μg/mL during the 24 h treatment window (
Figure 5b,c), suggesting differential cellular responses under these experimental conditions, which promotes tumor cell death but has little effect on normal endothelial cells. This is due to the sizes of the prepared material being between 30 and 60 nm. Of this size, normal cells have less endocytosis, reduce non-specific uptake, and reduce toxicity. Moreover, consider the differences between tumor cells and normal cells. MCF-7 cells typically have higher basal levels of ROS, making them more sensitive to oxidative stress. HUVEC cells have lower ROS levels and a well-balanced antioxidant defense system. Therefore, the antioxidant effect of Ag@CeO
2 may help maintain oxidative balance in HUVEC cells, while in MCF-7 cells, it may promote cell death by further regulating ROS levels. Ag@CeO
2-3 have the highest antioxidant activity, modulating the redox system in the tumor microenvironment, thus enhanced antitumor activity.
Figure 5.
Characterization of CeO2 and Ag@CeO2: (a) antioxidant activity, (b) differential cytotoxicity observed between HUVEC (b) and MCF-7cells (c) after 24 h exposure.
Figure 5.
Characterization of CeO2 and Ag@CeO2: (a) antioxidant activity, (b) differential cytotoxicity observed between HUVEC (b) and MCF-7cells (c) after 24 h exposure.
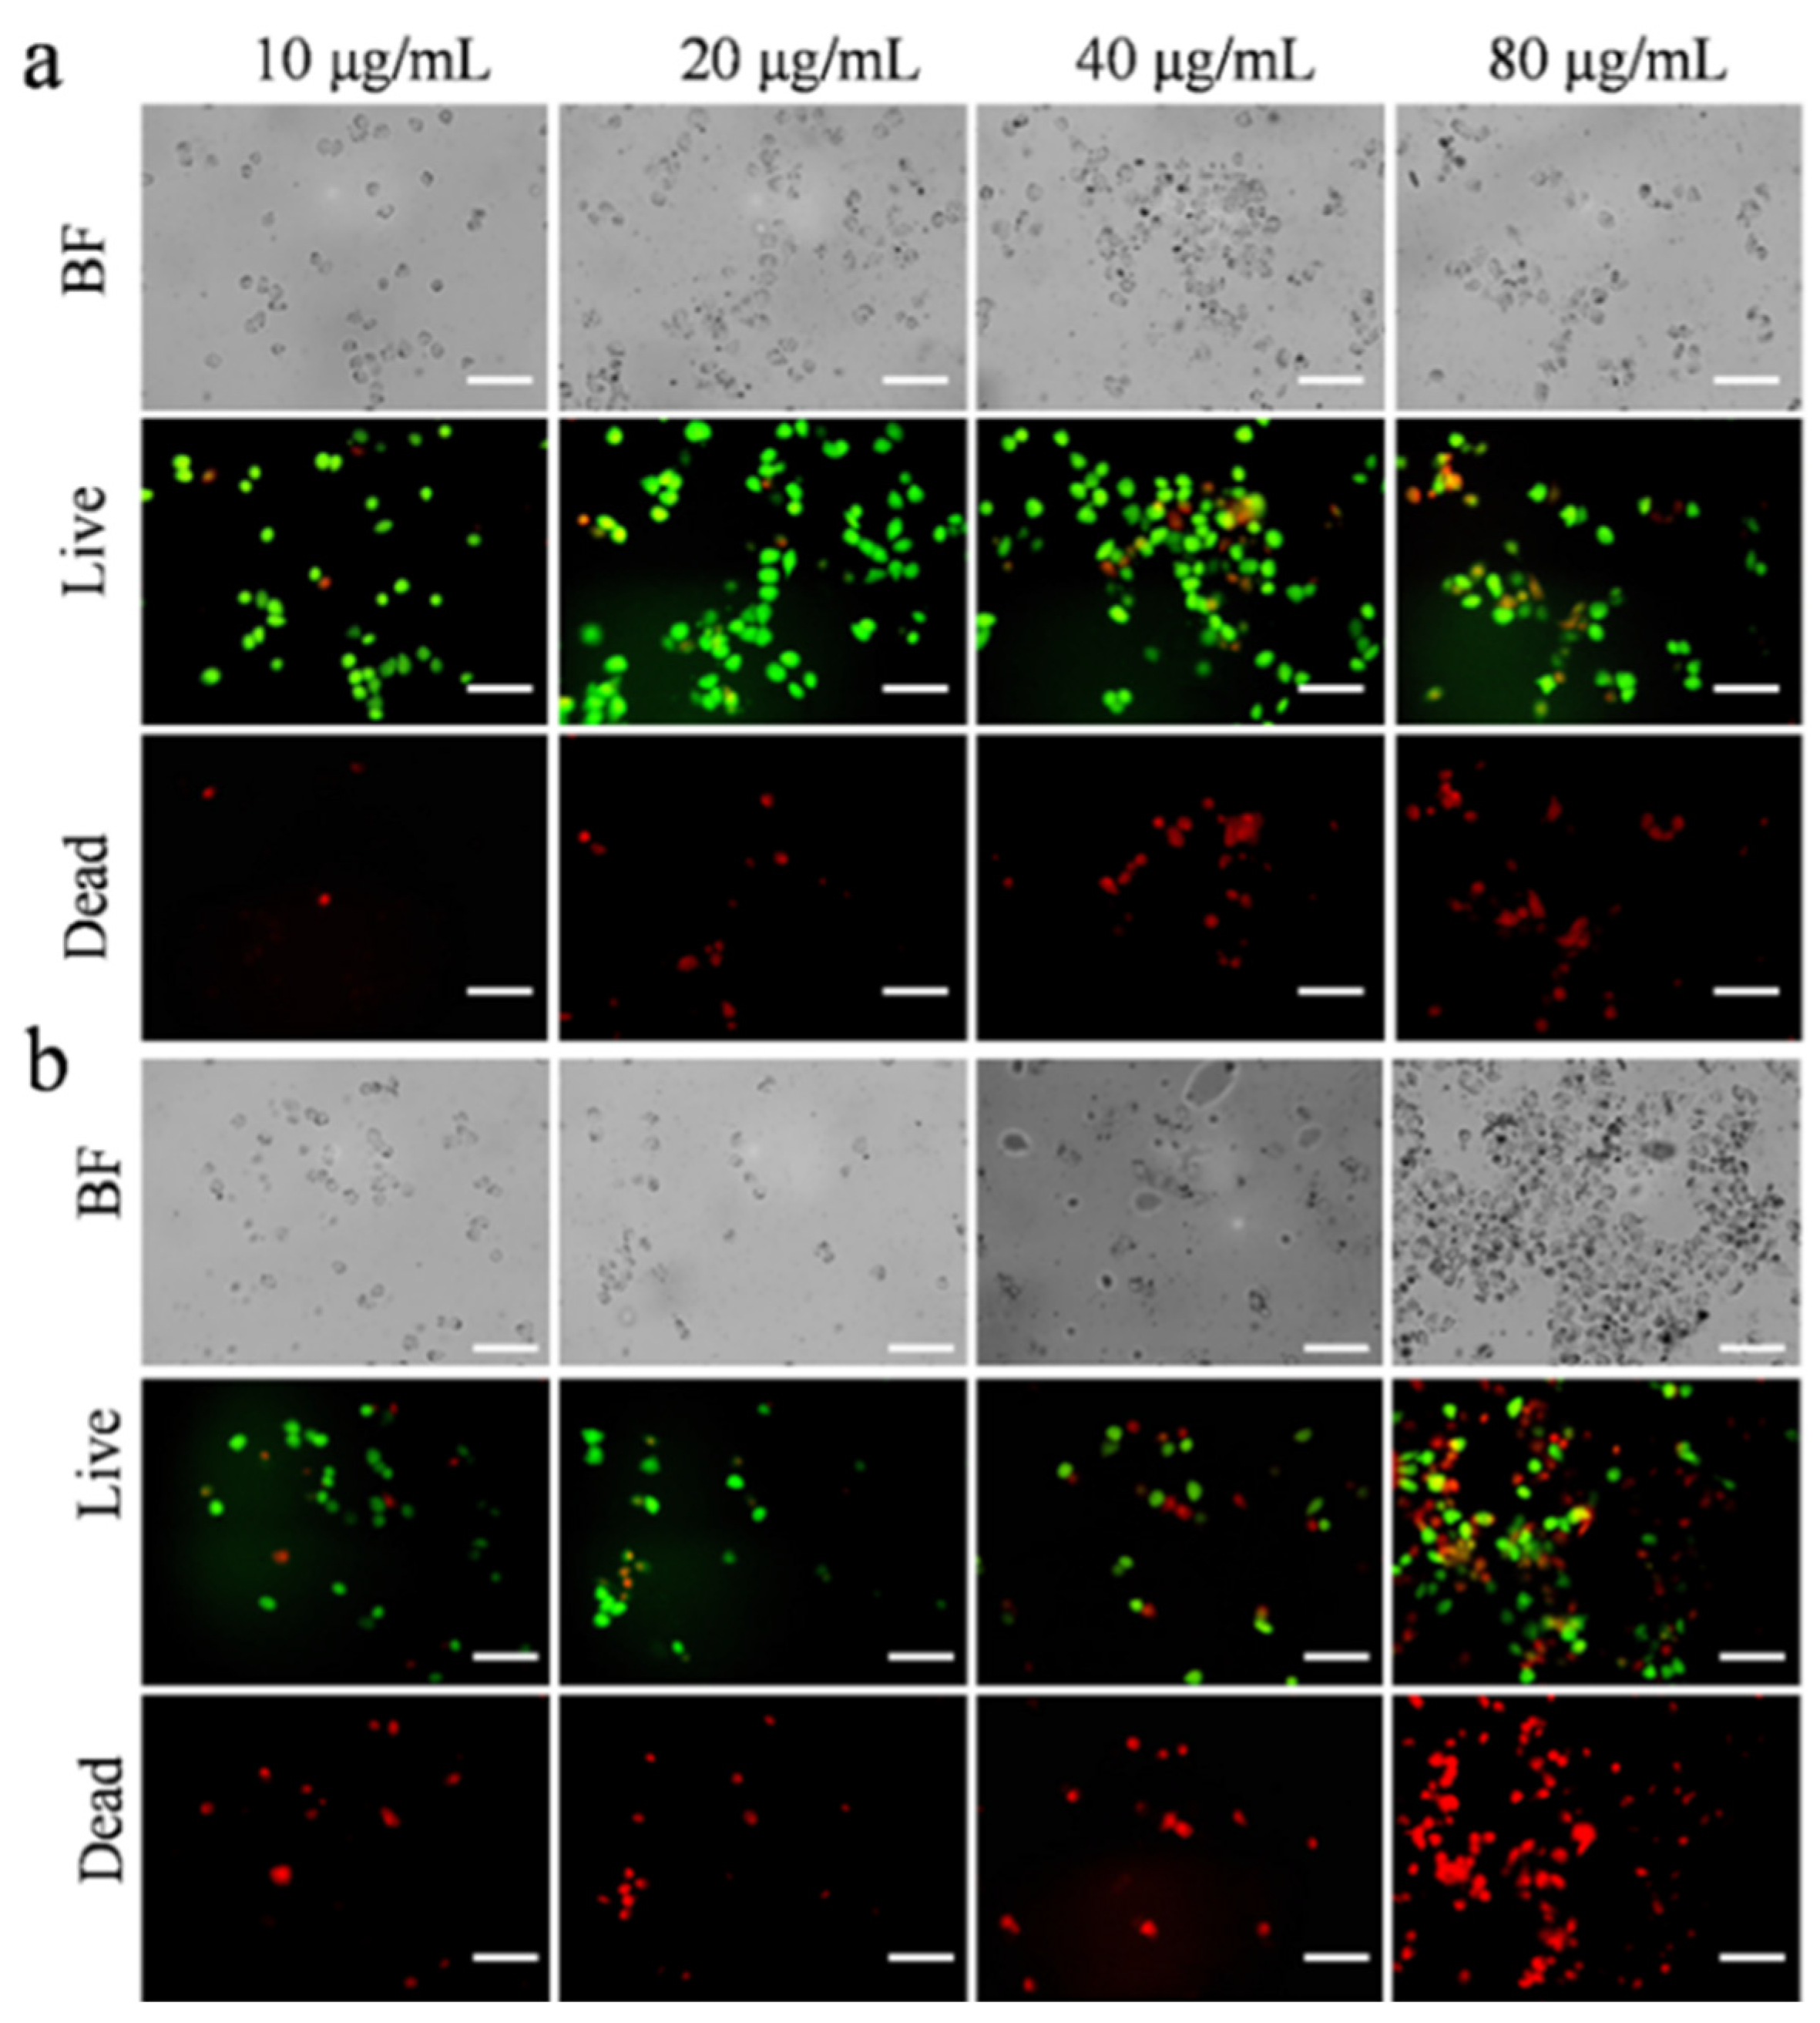
To further understand the high cytotoxicity of Ag@CeO
2 on tumor cells but little effect on HUVEC cells, cell viability after exposure on the synthesized cerium-based nanomaterials was investigated by using a live/dead cell double staining kit (Calcein-AM and PI kit) (Beyotime Biotechnology, Shanghai, China). Viable cells appeared green, while dead cells displayed red fluorescence. MCF-7 cells treated with Ag@CeO
2 demonstrated increased red fluorescence indicative of higher levels of cell death. In addition, cell apoptosis was enhanced along with cellular shrinkage. Bright field imaging revealed that the introduced Ag@CeO
2 nanoparticles either entered or adhered more readily to the surface of tumor cells, providing preliminary evidence that Ag@CeO
2 nanoparticles are preferentially internalized by tumor cells, leading to substantial accumulation within them. Ag@CeO
2 includes reversible Ce
3+/Ce
4+ redox pairs in the lattice of CeO
2, which can clear ROS such as superoxide radicals (O
2−) and hydroxyl radicals (OH
−), through surface oxygen vacancies. This finding offers valuable insights for subsequent applications in drug treatment or electrochemotherapy. As depicted in
Figure 6, CeO
2 induced tumor cell death in a small fraction of treated cells. Concurrently, it was observed that as concentrations of Ag@CeO
2 increased, there was a corresponding rise in dead cell proportions of MCF-7 cells. In comparison to CeO
2 alone, the presence of Ag@CeO
2 resulted in markedly greater cytotoxicity, culminating in extensive cell death—particularly pronounced when sample concentrations reached 80 μg/mL. These findings further substantiate that while CeO
2 composition exhibits lower toxicity towards cancerous tissues, Ag@CeO
2 exhibits higher toxicity towards cancerous tissues. These findings demonstrate that the antioxidant properties of Ag@CeO
2 compete dynamically with its cytotoxicity, regulated by the amount of silver loading. At low concentrations, protective effects are observed: Ag@CeO
2 neutralizes ROS through the redox cycle of CeO
2, alleviating oxidative stress and protecting cells from DNA damage and apoptosis. Low concentrations of Ag
+ inhibit the growth of pathogens, reducing inflammation caused by infection and indirectly lowering cell toxicity. At high concentrations of Ag@CeO
2, excessive Ag
+ release would lead to mitochondrial membrane potential collapse, inhibition of ATP synthesis, and activation of the pathway, causing cell apoptosis or necrosis. Moreover, ROS clearance ability of CeO
2 may be exhausted in high ROS environments, leading to Ag’s toxicity becoming dominant.
Figure 6.
The distribution of live/dead MCF-7 cells after 24 h treatment by (a) different concentrations of CeO2, (b) by different concentrations of Ag@CeO2. Scale bar is 100 μm.
Figure 6.
The distribution of live/dead MCF-7 cells after 24 h treatment by (a) different concentrations of CeO2, (b) by different concentrations of Ag@CeO2. Scale bar is 100 μm.


