
MRI Detection and Therapeutic Enhancement of Ferumoxytol Internalization in Glioblastoma Cells

 , and
, and 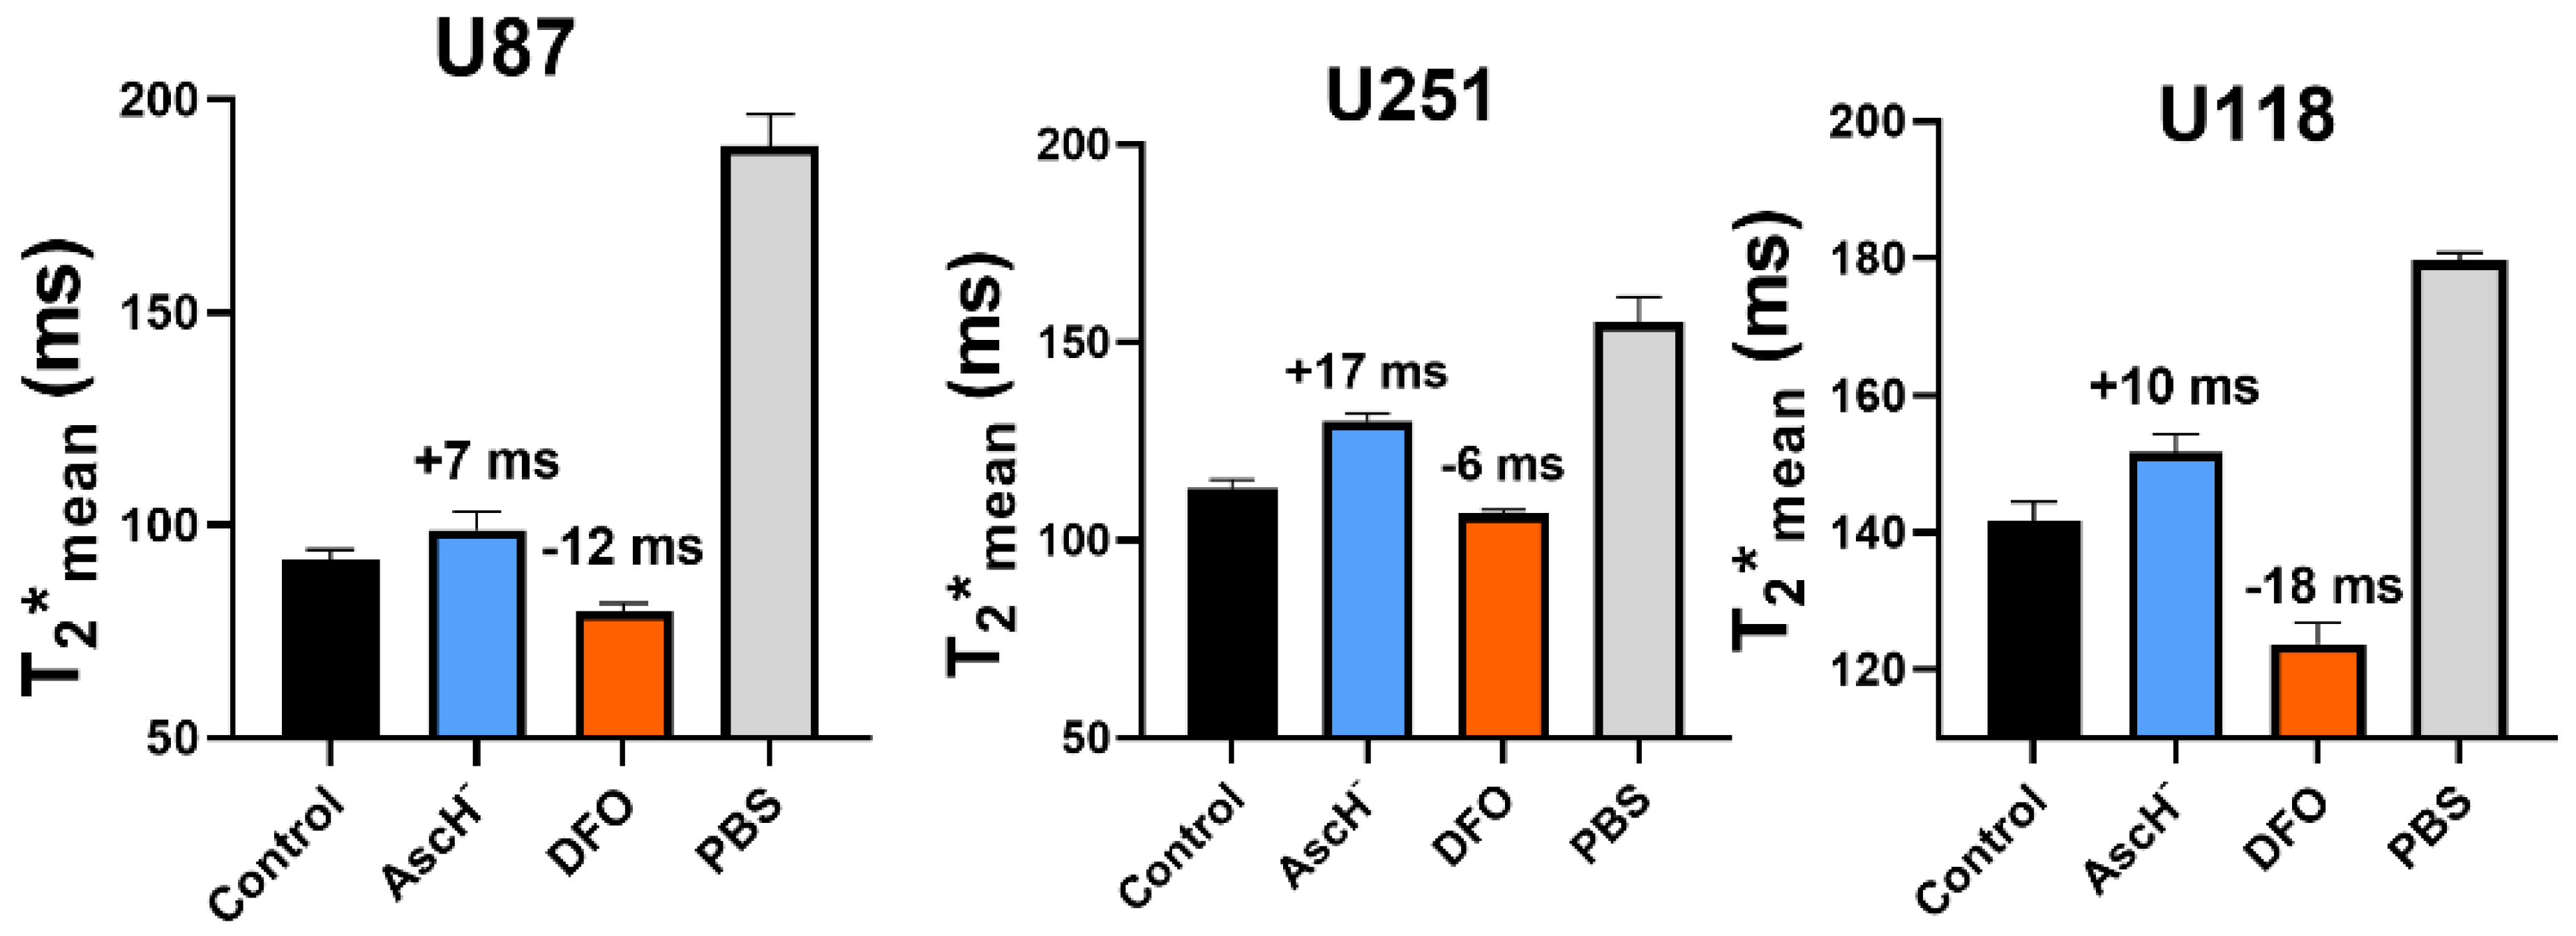
Abstract
1. Introduction
2. Materials and Methods
2.1. Cell Culture
2.2. In Vitro MRI Studies
2.3. FMX Internalization with Lipofectamine
2.4. Quantitation of Intracellular Iron
2.5. Cellular Iron Staining
2.6. Electron Paramagnetic Resonance Evaluation of FMX Concentrations in Cell Culture Media
3. Results
3.1. In Vitro Oxidation State Specificity of T2* Mapping
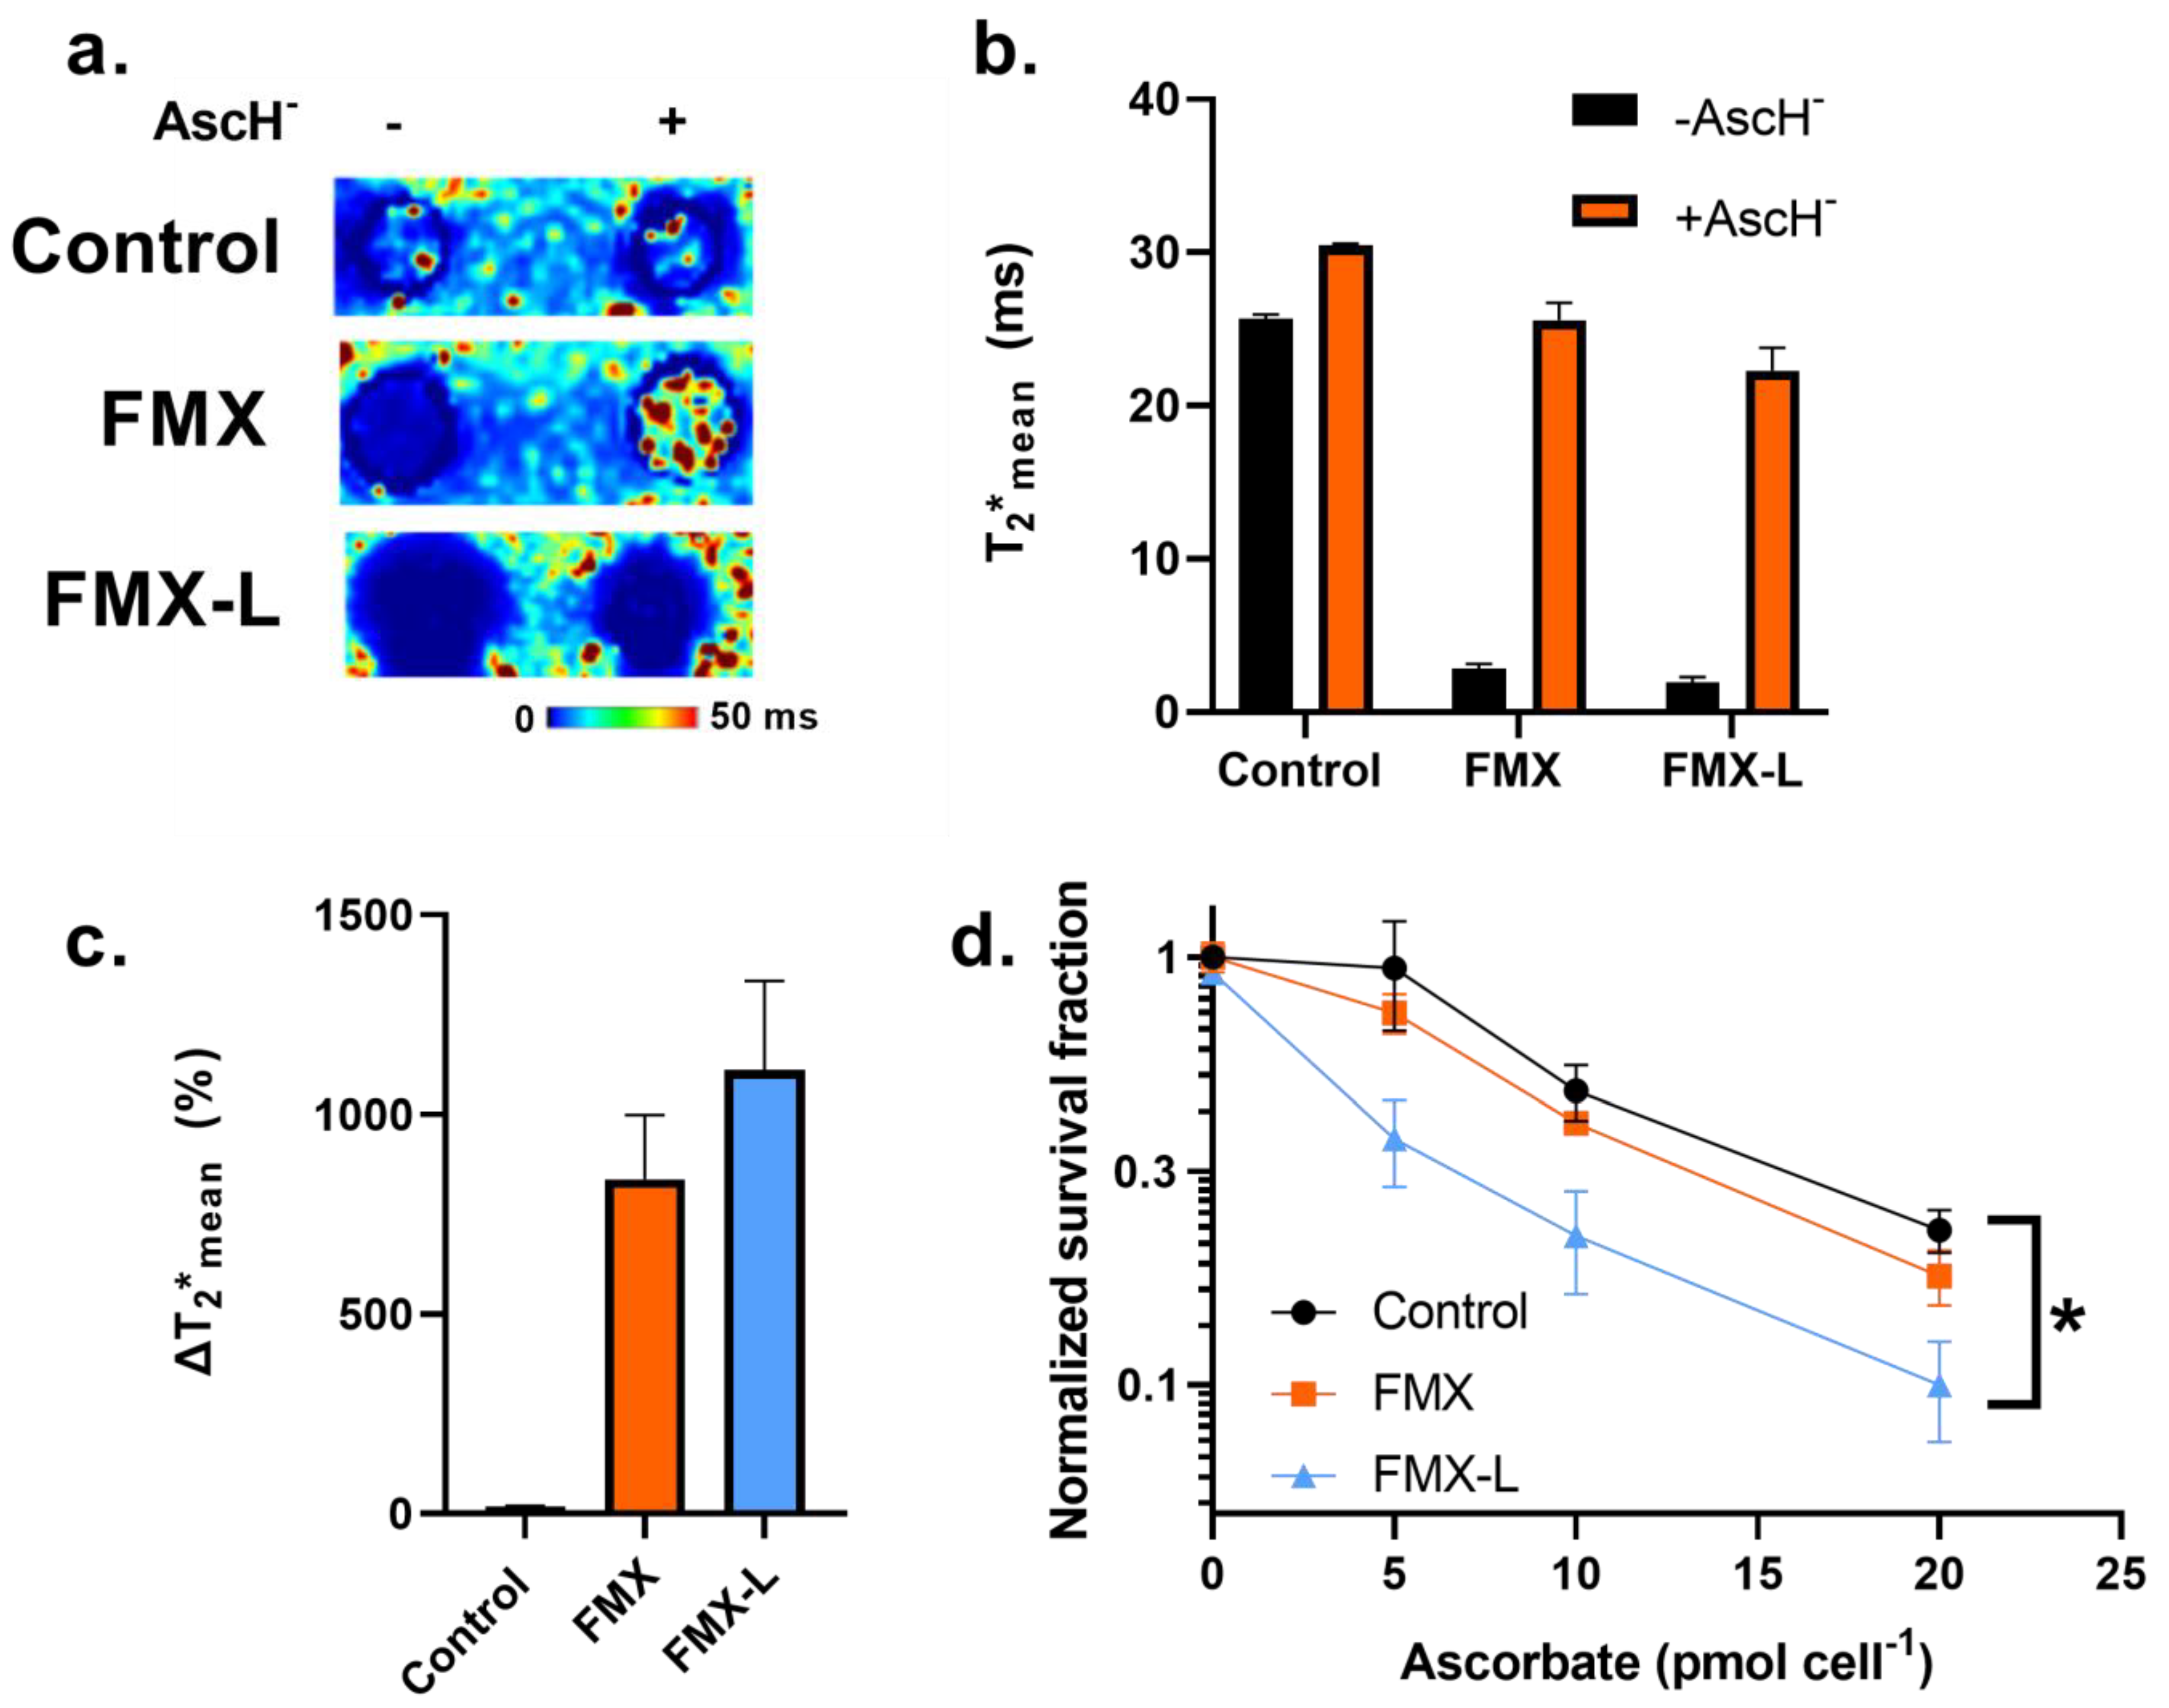
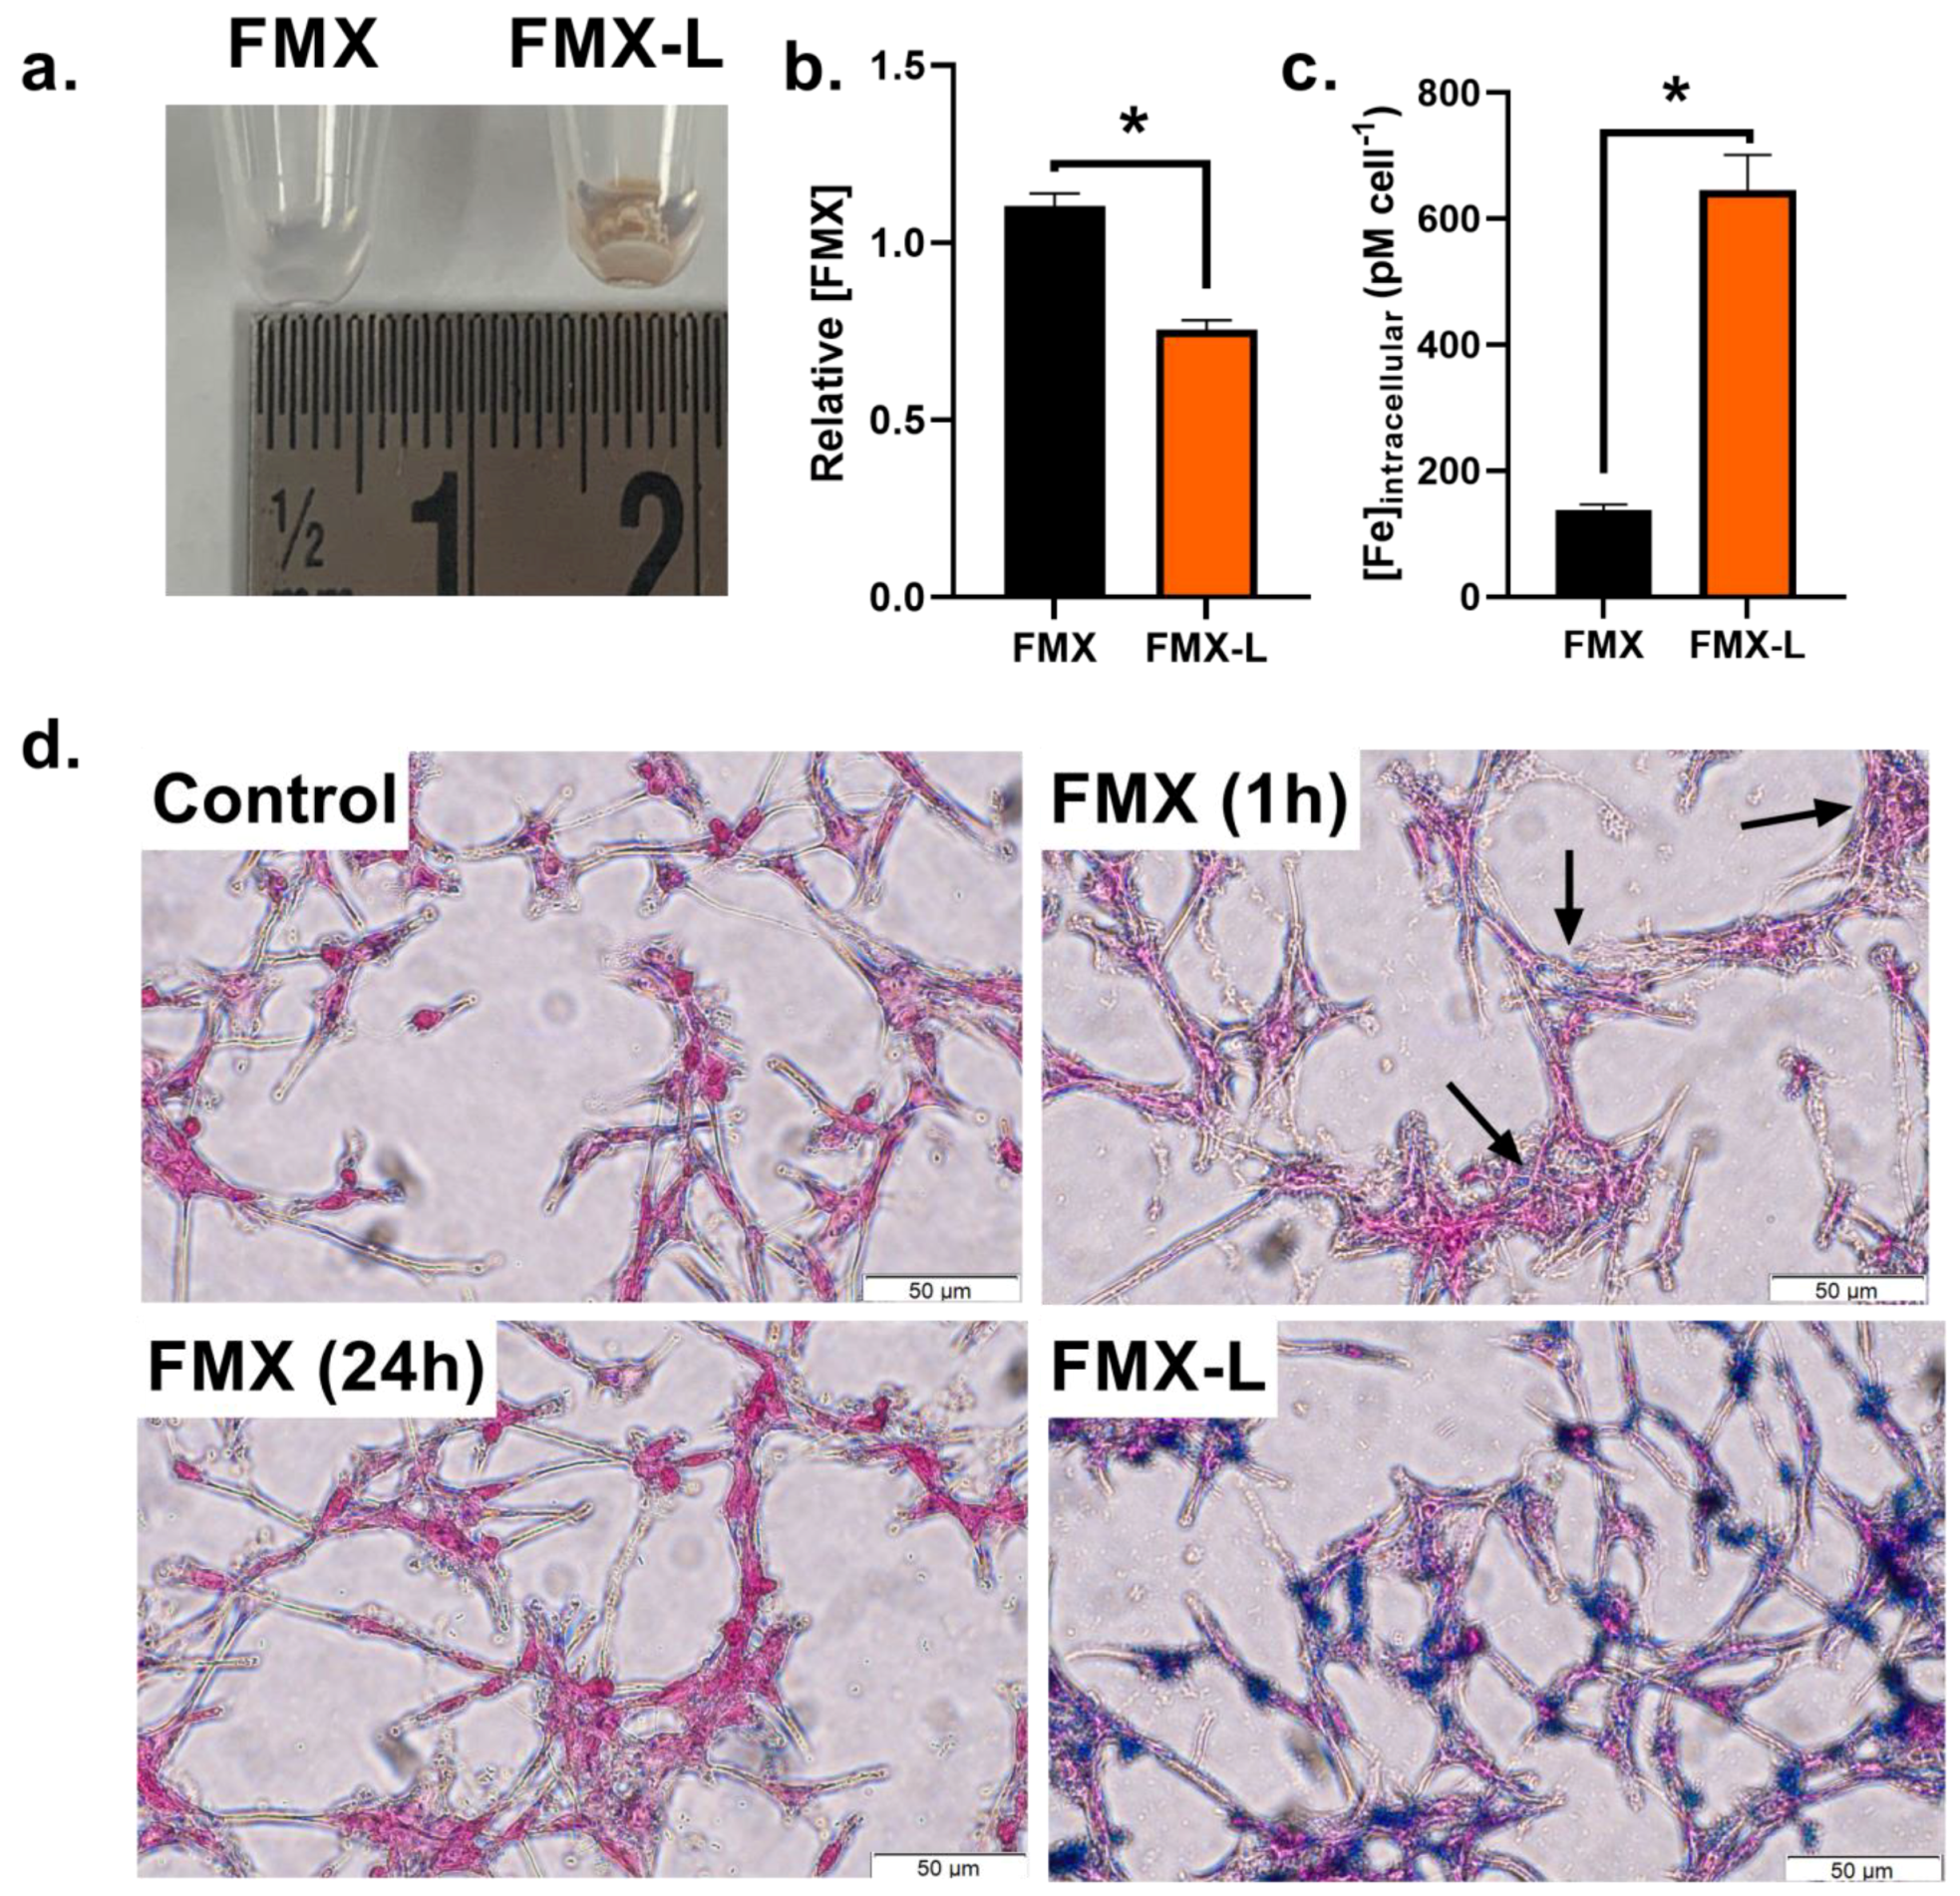
3.2. Lipofectamine Enhances FMX Internalization
3.3. FMX Internalization Enhances AscH− Cytotoxicity
4. Discussion
5. Conclusions
Author Contributions
Funding
Data Availability Statement
Acknowledgments
Conflicts of Interest
References
- Macdougall, I.C.; Strauss, W.E.; Dahl, N.V.; Bernard, K.; Li, Z. Ferumoxytol for Iron Deficiency Anemia in Patients Undergoing Hemodialysis. The FACT Randomized Controlled Trial. Clin. Nephrol. 2019, 91, 237–245. [Google Scholar] [CrossRef] [PubMed]
- Rosner, M.; Bolton, W. Ferumoxytol for the Treatment of Anemia in Chronic Kidney Disease. Drugs Today 2009, 45, 779–786. [Google Scholar] [CrossRef]
- Rosner, M.H.; Auerbach, M. Ferumoxytol for the Treatment of Iron Deficiency. Expert. Rev. Hematol. 2011, 4, 399–406. [Google Scholar] [CrossRef] [PubMed]
- Auerbach, M.; Chertow, G.M.; Rosner, M. Ferumoxytol for the Treatment of Iron Deficiency Anemia. Expert Rev. Hematol. 2018, 11, 829–834. [Google Scholar] [CrossRef]
- Bullivant, J.P.; Zhao, S.; Willenberg, B.J.; Kozissnik, B.; Batich, C.D.; Dobson, J. Materials Characterization of Feraheme/Ferumoxytol and Preliminary Evaluation of Its Potential for Magnetic Fluid Hyperthermia. Int. J. Mol. Sci. 2013, 14, 17501–17510. [Google Scholar] [CrossRef]
- Balakrishnan, V.S.; Rao, M.; Kausz, A.T.; Brenner, L.; Pereira, B.J.G.; Frigo, T.B.; Lewis, J.M. Physicochemical Properties of Ferumoxytol, a New Intravenous Iron Preparation. Eur. J. Clin. Investig. 2009, 39, 489–496. [Google Scholar] [CrossRef]
- Toth, G.B.; Varallyay, C.G.; Horvath, A.; Bashir, M.R.; Choyke, P.L.; Daldrup-Link, H.E.; Dosa, E.; Finn, J.P.; Gahramanov, S.; Harisinghani, M.; et al. Current and Potential Imaging Applications of Ferumoxytol for Magnetic Resonance Imaging. Kidney Int. 2017, 92, 47–66. [Google Scholar] [CrossRef]
- Manning, P.; Daghighi, S.; Rajaratnam, M.K.; Parthiban, S.; Bahrami, N.; Dale, A.M.; Bolar, D.; Piccioni, D.E.; McDonald, C.R.; Farid, N. Differentiation of Progressive Disease from Pseudoprogression Using 3D PCASL and DSC Perfusion MRI in Patients with Glioblastoma. J. Neuro-Oncol. 2020, 147, 681–690. [Google Scholar] [CrossRef]
- Iv, M.; Samghabadi, P.; Holdsworth, S.; Gentles, A.; Rezaii, P.; Harsh, G.; Li, G.; Thomas, R.; Moseley, M.; Daldrup-Link, H.E.; et al. Quantification of Macrophages in High-Grade Gliomas by Using Ferumoxytol-Enhanced MRI: A Pilot Study. Radiology 2019, 290, 198–206. [Google Scholar] [CrossRef]
- McCullough, B.J.; Kolokythas, O.; Maki, J.H.; Green, D.E. Ferumoxytol in Clinical Practice: Implications for MRI. J. Magn. Reson. Imaging 2013, 37, 1476–1479. [Google Scholar] [CrossRef]
- Weinstein, J.S.; Varallyay, C.G.; Dosa, E.; Gahramanov, S.; Hamilton, B.; Rooney, W.D.; Muldoon, L.L.; Neuwelt, E.A. Superparamagnetic Iron Oxide Nanoparticles: Diagnostic Magnetic Resonance Imaging and Potential Therapeutic Applications in Neurooncology and Central Nervous System Inflammatory Pathologies, a Review. J. Cereb. Blood Flow. Metab. 2010, 30, 15–35. [Google Scholar] [CrossRef] [PubMed]
- Trujillo-Alonso, V.; Pratt, E.C.; Zong, H.; Lara-Martinez, A.; Kaittanis, C.; Rabie, M.O.; Longo, V.; Becker, M.W.; Roboz, G.J.; Grimm, J.; et al. FDA-Approved Ferumoxytol Displays Anti-Leukaemia Efficacy against Cells with Low Ferroportin Levels. Nat. Nanotechnol. 2019, 14, 616–622. [Google Scholar] [CrossRef] [PubMed]
- Zanganeh, S.; Hutter, G.; Spitler, R.; Lenkov, O.; Mahmoudi, M.; Shaw, A.; Pajarinen, J.S.; Nejadnik, H.; Goodman, S.; Moseley, M.; et al. Iron Oxide Nanoparticles Inhibit Tumour Growth by Inducing Pro-Inflammatory Macrophage Polarization in Tumour Tissues. Nat. Nanotechnol. 2016, 11, 986–994. [Google Scholar] [CrossRef] [PubMed]
- Petronek, M.S.; Spitz, D.R.; Buettner, G.R.; Allen, B.G. Oxidation of Ferumoxytol by Ionizing Radiation Releases Iron. An Electron Paramagnetic Resonance Study. J. Radiat. Res. 2022, 63, 378–384. [Google Scholar] [CrossRef]
- Buettner, G.; Anne Jurkiewicz, B. Catalytic Metals, Ascorbate and Free Radicals: Combinations to Avoid. Radiat. Res. 1996, 145, 532–541. [Google Scholar] [CrossRef] [PubMed]
- Badu-Boateng, C.; Naftalin, R.J. Ascorbate and Ferritin Interactions: Consequences for Iron Release in Vitro and in Vivo and Implications for Inflammation. Free. Radic. Biol. Med. 2019, 133, 75–87. [Google Scholar] [CrossRef]
- Badu-Boateng, C.; Pardalaki, S.; Wolf, C.; Lajnef, S.; Peyrot, F.; Naftalin, R.J. Labile Iron Potentiates Ascorbate-Dependent Reduction and Mobilization of Ferritin Iron. Free. Radic. Biol. Med. 2017, 108, 94–109. [Google Scholar] [CrossRef]
- Harrison, P.M.; Arosio, P. The Ferritins: Molecular Properties, Iron Storage Function and Cellular Regulation. Biochim. Biophys. Acta Bioenerg. 1996, 1275, 161–203. [Google Scholar] [CrossRef]
- Petronek, M.S.; Teferi, N.; Caster, J.M.; Stolwijk, J.M.; Zaher, A.; Buatti, J.M.; Hasan, D.; Wafa, E.I.; Salem, A.K.; Gillan, E.G.; et al. Magnetite Nanoparticles as a Kinetically Favorable Source of Iron to Enhance GBM Response to Chemoradiosensitization with Pharmacological Ascorbate. Redox Biol. 2023, 62, 102651. [Google Scholar] [CrossRef]
- Chavhan, G.B.; Babyn, P.S.; Thomas, B.; Shroff, M.M.; Haacke, E.M. Principles, Techniques, and Applications of T2*-Based MR Imaging and Its Special Applications. Radiographics 2009, 29, 1433–1449. [Google Scholar] [CrossRef]
- Anderson, L.; Holden, S.; Davis, B.; Prescott, E.; Charrier, C.; Bunce, N.; Firmin, D.; Wonke, B.; Porter, J.; Walker, J.; et al. Cardiovascular T2-Star (T2*) Magnetic Resonance for the Early Diagnosis of Myocardial Iron Overload. Eur. Heart J. Cardiovasc. Imaging 2001, 22, 2171–2179. [Google Scholar] [CrossRef] [PubMed]
- Pepe, A.; Pistoia, L.; Martini, N.; De Marchi, D.; Barison, A.; Maggio, A.; Giovangrossi, P.; Bulgarelli, S.; Pasin, F.M.; Sarli, R.; et al. Detection of Myocardial Iron Overload with Magnetic Resonance By Native T1 and T2* Mapping Using a Segmental Approach. Blood 2018, 132, 2346. [Google Scholar] [CrossRef]
- Henninger, B.; Kremser, C.; Rauch, S.; Eder, R.; Zoller, H.; Finkenstedt, A.; Michaely, H.J.; Schocke, M. Evaluation of MR Imaging with T1 and T2* Mapping for the Determination of Hepatic Iron Overload. Eur. Radiol. 2012, 22, 2478–2486. [Google Scholar] [CrossRef]
- Wood, J.C. Magnetic Resonance Imaging Measurement of Iron Overload. Curr. Opin. Hematol. 2007, 14, 183–190. [Google Scholar] [CrossRef]
- Wood, J.C.; Enriquez, C.; Ghugre, N.; Tyzka, J.M.; Carson, S.; Nelson, M.D.; Coates, T.D. MRI R2 and R2* Mapping Accurately Estimates Hepatic Iron Concentration in Transfusion-Dependent Thalassemia and Sickle Cell Disease Patients. Blood 2005, 106, 1460–1465. [Google Scholar] [CrossRef] [PubMed]
- Ghugre, N.R.; Enriquez, C.M.; Gonzalez, I.; Nelson, M.D., Jr.; Coates, T.D.; Wood, J.C. MRI Detects Myocardial Iron in the Human Heart. Magn. Reson. Med. 2006, 56, 681–686. [Google Scholar] [CrossRef] [PubMed]
- Cushing, C.M.; Petronek, M.S.; Bodeker, K.L.; Vollstedt, S.; Brown, H.A.; Opat, E.; Hollenbeck, N.J.; Shanks, T.; Berg, D.J.; Smith, B.J.; et al. Magnetic Resonance Imaging (MRI) of Pharmacological Ascorbate-Induced Iron Redox State as a Biomarker in Subjects Undergoing Radio-Chemotherapy. Redox Biol. 2021, 38, 101804. [Google Scholar] [CrossRef]
- Birkl, C.; Birkl-Toeglhofer, A.M.; Kames, C.; Goessler, W.; Haybaeck, J.; Fazekas, F.; Ropele, S.; Rauscher, A. The Influence of Iron Oxidation State on Quantitative MRI Parameters in Post Mortem Human Brain. NeuroImage 2020, 220, 117080. [Google Scholar] [CrossRef]
- Petronek, M.S.; St-Aubin, J.J.; Lee, C.Y.; Spitz, D.R.; Gillan, E.G.; Allen, B.G.; Magnotta, V.A. Quantum Chemical Insight into the Effects of the Local Electron Environment on T2*-Based MRI. Sci. Rep. 2021, 11, 20817. [Google Scholar] [CrossRef]
- Petronek, M.S.; Monga, V.; Bodeker, K.L.; Kwofie, M.; Lee, C.-Y.; Mapuskar, K.A.; Stolwijk, J.M.; Zaher, A.; Wagner, B.A.; Smith, M.C.; et al. Magnetic Resonance Imaging of Iron Metabolism with T2* Mapping Predicts an Enhanced Clinical Response to Pharmacological Ascorbate in Patients with GBM. Clin. Cancer Res. 2023. [Google Scholar] [CrossRef]
- Fedorov, A.; Beichel, R.; Kalpathy-Cramer, J.; Finet, J.; Fillion-Robin, J.-C.; Pujol, S.; Bauer, C.; Jennings, D.; Fennessy, F.; Sonka, M.; et al. 3D Slicer as an Image Computing Platform for the Quantitative Imaging Network. Magn. Reson. Imaging 2012, 30, 1323–1341. [Google Scholar] [CrossRef] [PubMed]
- Stookey, L. Ferrozine-A New Spectrophotometric Reagent for Iron. Anal. Chem. 1970, 42, 779–781. [Google Scholar] [CrossRef]
- Abbasi, U.; Abbina, S.; Gill, A.; Bhagat, V.; Kizhakkedathu, J.N. A Facile Colorimetric Method for the Quantification of Labile Iron Pool and Total Iron in Cells and Tissue Specimens. Sci. Rep. 2021, 11, 6008. [Google Scholar] [CrossRef] [PubMed]
- Kiss, T.; Farkas, E. Metal-Binding Ability of Desferrioxamine B. J. Incl. Phenom. Mol. Recognit. Chem. 1998, 32, 385–403. [Google Scholar] [CrossRef]
- McConnell, H.L.; Schwartz, D.L.; Richardson, B.E.; Woltjer, R.L.; Muldoon, L.L.; Neuwelt, E.A. Ferumoxytol Nanoparticle Uptake in Brain during Acute Neuroinflammation Is Cell-Specific. Nanomedicine 2016, 12, 1535–1542. [Google Scholar] [CrossRef]
- Vasanawala, S.S.; Nguyen, K.-L.; Hope, M.D.; Bridges, M.D.; Hope, T.A.; Reeder, S.B.; Bashir, M.R. Safety and Technique of Ferumoxytol Administration for MRI. Magn. Reson. Med. 2016, 75, 2107–2111. [Google Scholar] [CrossRef] [PubMed]
- Neuwelt, E.A.; Várallyay, C.G.; Manninger, S.; Solymosi, D.; Haluska, M.; Hunt, M.A.; Nesbit, G.; Stevens, A.; Jerosch-Herold, M.; Jacobs, P.M.; et al. The Potential of Ferumoxytol Nanoparticle Magnetic Resonance Imaging, Perfusion, and Angiography in Central Nervous System Malignancy: A Pilot Study. Neurosurgery 2007, 60, 601–611, discussion 611–612. [Google Scholar] [CrossRef]
- Stirrat, C.G.; Alam, S.R.; MacGillivray, T.J.; Gray, C.D.; Forsythe, R.; Dweck, M.R.; Payne, J.R.; Prasad, S.K.; Petrie, M.C.; Gardner, R.S.; et al. Ferumoxytol-Enhanced Magnetic Resonance Imaging Methodology and Normal Values at 1.5 and 3T. J. Cardiovasc. Magn. Reason. 2016, 18, 46. [Google Scholar] [CrossRef]
- Petronek, M.S.; Wagner, B.A.; Hollenbeck, N.J.; Caster, J.M.; Spitz, D.R.; Cullen, J.J.; Buettner, G.R.; Allen, B.G. Assessment of the Stability of Supraphysiological Ascorbate in Human Blood: Appropriate Handling of Samples from Clinical Trials for Measurements of Pharmacological Ascorbate. Radiat. Res. 2019, 191, 491–496. [Google Scholar] [CrossRef]
- Allen, B.G.; Bodeker, K.L.; Smith, M.C.; Monga, V.; Sandhu, S.; Hohl, R.; Carlisle, T.; Brown, H.; Hollenbeck, N.; Vollstedt, S.; et al. First-in-Human Phase I Clinical Trial of Pharmacologic Ascorbate Combined with Radiation and Temozolomide for Newly Diagnosed Glioblastoma. Clin. Cancer Res. 2019, 25, 6590–6597. [Google Scholar] [CrossRef]
- Marashdeh, M.W.; Ababneh, B.; Lemine, O.M.; Alsadig, A.; Omri, K.; El Mir, L.; Sulieman, A.; Mattar, E. The Significant Effect of Size and Concentrations of Iron Oxide Nanoparticles on Magnetic Resonance Imaging Contrast Enhancement. Results Phys. 2019, 15, 102651. [Google Scholar] [CrossRef]
- Hong, W.; He, Q.; Fan, S.; Carl, M.; Shao, H.; Chen, J.; Chang, E.Y.; Du, J. Imaging and Quantification of Iron-Oxide Nanoparticles (IONP) Using MP-RAGE and UTE Based Sequences. Magn. Reson. Med. 2017, 78, 226–232. [Google Scholar] [CrossRef] [PubMed]
- Zhao, J.; Zhang, Z.; Xue, Y.; Wang, G.; Cheng, Y.; Pan, Y.; Zhao, S.; Hou, Y. Anti-Tumor Macrophages Activated by Ferumoxytol Combined or Surface-Functionalized with the TLR3 Agonist Poly (I:C) Promote Melanoma Regression. Theranostics 2018, 8, 6307–6321. [Google Scholar] [CrossRef] [PubMed]
- Brandt, K.E.; Falls, K.C.; Schoenfeld, J.D.; Rodman, S.N.; Gu, Z.; Zhan, F.; Cullen, J.J.; Wagner, B.A.; Buettner, G.R.; Allen, B.G.; et al. Augmentation of Intracellular Iron Using Iron Sucrose Enhances the Toxicity of Pharmacological Ascorbate in Colon Cancer Cells. Redox Biol. 2018, 14, 82–87. [Google Scholar] [CrossRef]
- Burgess, E.R.; Crake, R.L.I.; Phillips, E.; Morrin, H.R.; Royds, J.A.; Slatter, T.L.; Wiggins, G.A.R.; Vissers, M.C.M.; Robinson, B.A.; Dachs, G.U. Increased Ascorbate Content of Glioblastoma Is Associated With a Suppressed Hypoxic Response and Improved Patient Survival. Front. Oncol. 2022, 12, 829524. [Google Scholar] [CrossRef]


Disclaimer/Publisher’s Note: The statements, opinions and data contained in all publications are solely those of the individual author(s) and contributor(s) and not of MDPI and/or the editor(s). MDPI and/or the editor(s) disclaim responsibility for any injury to people or property resulting from any ideas, methods, instructions or products referred to in the content. |
© 2024 by the authors. Licensee MDPI, Basel, Switzerland. This article is an open access article distributed under the terms and conditions of the Creative Commons Attribution (CC BY) license (https://creativecommons.org/licenses/by/4.0/).
Share and Cite
Petronek, M.S.; Teferi, N.; Lee, C.-Y.; Magnotta, V.A.; Allen, B.G. MRI Detection and Therapeutic Enhancement of Ferumoxytol Internalization in Glioblastoma Cells. Nanomaterials 2024, 14, 189. https://doi.org/10.3390/nano14020189
Petronek MS, Teferi N, Lee C-Y, Magnotta VA, Allen BG. MRI Detection and Therapeutic Enhancement of Ferumoxytol Internalization in Glioblastoma Cells. Nanomaterials. 2024; 14(2):189. https://doi.org/10.3390/nano14020189
Chicago/Turabian StylePetronek, Michael S., Nahom Teferi, Chu-Yu Lee, Vincent A. Magnotta, and Bryan G. Allen. 2024. "MRI Detection and Therapeutic Enhancement of Ferumoxytol Internalization in Glioblastoma Cells" Nanomaterials 14, no. 2: 189. https://doi.org/10.3390/nano14020189
APA StylePetronek, M. S., Teferi, N., Lee, C.-Y., Magnotta, V. A., & Allen, B. G. (2024). MRI Detection and Therapeutic Enhancement of Ferumoxytol Internalization in Glioblastoma Cells. Nanomaterials, 14(2), 189. https://doi.org/10.3390/nano14020189