Article

Elaboration of Nanostructured Levan-Based Colloid System as a Biological Alternative with Antimicrobial Activity for Applications in the Management of Pathogenic Microorganisms

by
Vitalijs Radenkovs
1,2,*,
Anda Valdovska
2,3,
Daiga Galina
2,3,
Stefan Cairns
4,
Dmitrijs Jakovlevs
2,
Sergejs Gaidukovs
5,
Ingmars Cinkmanis
6 and
Karina Juhnevica-Radenkova
1
1
Processing and Biochemistry Department, Institute of Horticulture, LV-3701 Dobele, Latvia
2
Research Laboratory of Biotechnology, Latvia University of Life Sciences and Technologies, LV-3004 Jelgava, Latvia
3
Faculty of Veterinary Medicine, Latvia University of Life Sciences and Technologies, LV-3004 Jelgava, Latvia
4
Malvern Panalytical Ltd., Worcestershire, Malvern WR14 1XZ, UK
5
Institute of Polymer Materials, Faculty of Materials Science and Applied Chemistry, Riga Technical University, LV-1048 Riga, Latvia
6
Faculty of Agriculture and Food Technology, Latvia University of Life Sciences and Technologies, LV-3004 Jelgava, Latvia
*
Author to whom correspondence should be addressed.
Nanomaterials 2023, 13(22), 2969; https://doi.org/10.3390/nano13222969
Submission received: 29 September 2023 / Revised: 5 November 2023 / Accepted: 15 November 2023 / Published: 17 November 2023
(This article belongs to the Special Issue Advances in Nanomedicine Biotechnologies)

Abstract

:
Considering the documented health benefits of bacterial exopolysaccharides (EPSs), specifically of bacterial levan (BL), including its intrinsic antimicrobial activity against certain pathogenic species, the current study concentrated on the development of active pharmaceutical ingredients (APIs) in the form of colloid systems (CoSs) containing silver nanoparticles (AgNPs) employing in-house biosynthesized BL as a reducing and capping agent. The established protocol of fermentation conditions implicating two species of lactic acid bacteria (LAB), i.e., Streptococcus salivarius K12 and Leuconostoc mesenteroides DSM 20343, ensured a yield of up to 25.7 and 13.7 g L−1 of BL within 72 h, respectively. An analytical approach accomplished by Fourier-transform infrared (FT-IR) spectroscopy allowed for the verification of structural features attributed to biosynthesized BL. Furthermore, scanning electron microscopy (SEM) revealed the crystalline morphology of biosynthesized BL with a smooth and glossy surface and highly porous structure. Molecular weight (Mw) estimated by multi-detector size-exclusion chromatography (SEC) indicated that BL biosynthesized using S. salivarius K12 has an impressively high Mw, corresponding to 15.435 × 10⁴ kilodaltons (kDa). In turn, BL isolated from L. mesenteroides DSM 20343 was found to have an Mw of only 26.6 kDa. Polydispersity index estimation (PD = Mw/Mn) of produced BL displayed a monodispersed molecule isolated from S. salivarius K12, corresponding to 1.08, while this was 2.17 for L. mesenteroides DSM 20343 isolate. The presence of fructose as the main backbone and, to a lesser extent, glucose and galactose as side chain molecules in EPS hydrolysates was supported by HPLC-RID detection. In producing CoS-BL@AgNPs within green biosynthesis, the presence of nanostructured objects with a size distribution from 12.67 ± 5.56 nm to 46.97 ± 20.23 was confirmed by SEM and energy-dispersive X-ray spectroscopy (EDX). The prominent inhibitory potency of elaborated CoS-BL@AgNPs against both reference test cultures, i.e., Pseudomonas aeruginosa, Escherichia coli, Enterobacter aerogenes, and Staphylococcus aureus and those of clinical origin with multi-drug resistance (MDR), was confirmed by disc and well diffusion tests and supported by the values of the minimum inhibitory and bactericidal concentrations. CoS-BL@AgNPs can be treated as APIs suitable for designing new antimicrobial agents and modifying therapies in controlling MDR pathogens.

1. Introduction

Chronic wounds are an immense burden for the individual patient and society [1]. The impact of wounds is referred to as “the silent epidemics” as it is felt on many levels, starting from lost work days to permanent disability (amputation) to death of the patient, and the economic implications of chronic wound care are alarming [2,3]. Among global threats in this century, the relevance of controlling and suppressing the spread of microbial infections has become the number one challenge. Overuse of antibiotics, which is a primary driver leading to the development of antimicrobial resistance (AMR) [4], along with governmental intentions outlined in the new European Commission (EC)’s Regulation No. 2019/6 [5], make investigators from around the world seek alternative strategies to reduce this need both in human and veterinary medicine [6]. Despite the success of the last decades in the treatment of hard-to-heal wounds (H–HW) both in human [7] and veterinary patients [8], there is a need for designing new antimicrobial agents and modifying treatments feasible in combating multi-drug-resistant (MDR) pathogens [9,10]. In non-healing wounds, wound chronicity is associated with the ability of bacteria to form a biofilm composed of bacterial aggregates by producing a polymer-based matrix of a polysaccharide/protein nature [11]. The film-forming capabilities of bacteria make them more resistant to topical antibiotics and biocides within therapeutic maneuvers [12]. Repeated attacks on a regular basis after 48–96 h of biofilm formation by applying disruptive strategies such as debridement force the biofilm to reattach and reform, making it sensitive to antibiotics and host defenses [13]. The advancement in molecular biology, genetics, and diagnostics allows for the routine performance of robust identification and differentiation of pathogenic bacteria and infectious diseases, giving a chance to appoint effective antibiotic therapy without running the risk of biofilm formation [14,15]. However, the development of MDR pathogens and chronic inflammation due to the lack of equipment available in its place, along with health issues attached to long-distance travel, lead to delayed wound healing, particularly in canine and equine limbs. The transition of a wound from an acute into a chronic form is accompanied by a high level of inflammatory cytokines, pronounced protease activity, increased levels of reactive oxygen species, degraded and nonfunctional extracellular matrix (ECM) reorganization, and aged cells with low mitogenic activity [16]. In wound management, the presence of these factors, along with drug implications such as corticosteroids, chemotherapeutics, immunosuppressive agents, and nonsteroidal anti-inflammatory drugs (NSAIDs), make the wound healing process long-lasting [17,18]. Meanwhile, the biofilm formation that was identified in ≤60% of chronic wound cases of cattle and horses, mainly due to multiple bacterial contributions, makes antibiotic therapy less effective [19,20].
To date, efficient biological solutions for treating H–HW and ensuring a prolonged antibacterial activity are still limited. Although, such solutions can become quite realistic if they involve microbial exopolysaccharides (EPSs). EPSs are metabolites of polysaccharides produced and secreted by a variety of microorganisms, including lactic acid bacteria (LAB) [21]. Findings in the area of biotechnology driven in recent years have the prospect of conceiving plenty of EPSs alone or in combination with APIs or antimicrobial agents, benefitting multiple functionalities and a range of applicability [17,18], and this field has attracted steadily growing interest among researchers and inventors worldwide [22]. The interest in EPSs, to a greater extent, is conditioned by their amphiphilic nature and ability to interact with bacterial membranes, leading to the alteration of glycoproteins and lipids on the cytomembrane of microorganisms, thus affecting ion exchange and reducing ATF synthesis. This statement can be reinforced by an observation made by Goy et al. [23] for chitosan and, recently, by Aullybux et al. [24] for EPSs isolated from marine bacteria Mauritius seawater. Antimicrobial and antibiofilm efficiency of bacterial cellulose has been constantly documented [25,26]. However, of the many existing EPSs, bacterial levan (BL) is another EPS representative that demonstrates unique intrinsic antimicrobial activity against pathogenic microorganisms, as reported by Zainulabdeen et al. [27] and Hamada et al. [28]. However, Gökmen et al. [29] emphasized the opacity of BL antimicrobial activity against certain bacterial species, such as Salmonella typhimurium, assumed to be the cause of insufficient purity of BL and the presence of other less active metabolites extracted along with BL. Regardless, the authors proposed using BL as an adjuvant to other active molecules to promote antimicrobial activity. BL is a natural β-D-fructofuranose polymer cross-linked by β-(2→6) glycosidic linkages at the C-1 position of the fructose ring [30,31]. BL is a water-soluble, strongly adhesive, and film-forming homopolysaccharide, and it differs from other EPSs in its unique properties, such as its low viscosity, high oil solubility, compatibility with salts and surfactants, thermo-, acid, and alkaline resistance, and high water retention capacity [31]. To achieve augmentation benefits in combating MDR and persistent pathogens along with the wound repair process, González-Garcinuño et al. [32] proposed using BL in preparing nanostructured BL@AgNP hydrogel with remarkable inhibitory activity against Escherichia coli and Bacillus subtilis. Using BL in the green biosynthesis of Ag nano-objects as a reducing agent ensured the formation of BL@AgNPs with particles of about 30 nm. Although Khan et al. [33] elaborated upon functionalized gold (Au) and AgNPs with biomedically active functional groups inherited from Clerodendrum inerme, ensuring superior antibacterial and antimycotic activities against seven species of pathogenic microorganisms along with biofilm inhibition capability, it is worth noting, though, that the use of crude extracts in metal NP biosynthesis could lead to the appearance of undesirable complexes in the final products resulting in limiting the range of AgNP applicability [8]. Therefore, more attention has recently been paid to synthesizing nano-scale objects using individual components. In this way, encouraging results have been obtained by Ahmed [34], demonstrating the potential utilization of BL as a sole reducing agent in the biosynthesis of AgNPs with remarkable catalytic activity in the reduction of 4-nitrophenol to methylene blue. Choi et al. [35] revealed an injectable, non-cytotoxic, and cell-proliferative BL-based hydrogel as a dermal filler for soft tissue. Observations made by the researchers provide a platform to combating E. faecium, S. aureus, K. pneumoniae, A. baumannii, P. aeruginosa, and Enterobacter spp. (ESKAPE) in the era of AMR [36,37,38].
Considering the health-promoting evidence about BL and already established protocol for BL production via a fermentation process utilizing LAB, i.e., S. salivarius K12 and L. mesenteroides DSM 20343 cultures developed by a group from LatHort, the current research will address the chromatographic characterization of obtained BL and elucidation of its potential contribution to the formation of AgNPs during green biosynthesis. As a complement, the antimicrobial activity of prepared CoS-BL@AgNPs will be probed against certain pathogenic bacteria with multi-drug resistance.

2. Materials and Methods

2.1. Chemicals, Reagents, Standards

A commercial standard of dextran (DEX) derived from L. mesenteroides with an average molecular weight, Mw, of 1500–2800 kilodaltons (kDa), sodium hydroxide, citric acid, and absolute ethanol (purity ≥ 99.5%) were purchased from Merck KGaA (Darmstadt, Germany). An acetonitrile (MeCN) and methanol (MeOH) gradient grade for liquid chromatography (HPLC) was purchased from the same producer. Standards of mono- and disaccharides, dipotassium hydrogen phosphate, manganese sulfate, magnesium sulfate, and Tween® 80 were purchased from Sigma-Aldrich (Steinheim, Germany). Sucrose and sodium acetate were obtained from MilliporeSigma (Rockville, MD, USA). The diammonium citrate used was from Scharlab S.L., (Barcelona, Spain). Dimethyl sulfoxide (DMSO) of a liquid chromatography–mass spectrometry (LC–MS) grade (purity ≥ 99.7%) was obtained from Thermo Fisher Scientific (Rockford, IL, USA). Silver nitrate (AgNO3) (purity ≥ 99.9%) and ammonium hydroxide solution (25% v/v) were obtained from Chempur (Piekary Śląskie, Silesia, Poland). Streptococcus salivarius K12 test culture was isolated from the oral cavity and successfully identified using standard morphological and biochemical analysis and PCR technique, while L. mesenteroides DSM 20343 was obtained from the collection of the UK Health Security Agency (UKHSA) upon request. Mueller–Hinton broth (MHB) was purchased from Oxoid, Inc., Thermo Fisher Scientific (Hampshire, UK). De Man, Rogosa, and Sharpe (MRS) agar supplemented with Tween® 80 and Mueller–Hinton Agar (MHA) II were acquired from Biolife Italiana S.r.l. (Milan, Italy). Bacteriological peptone (pH 6.5–7.5) and yeast extract (pH 6.8–7.2) were purchased from Laboratorios Conda S.A (Madrid, Spain) and beef extract (pH 7.0 ± 0.5) was obtained from Liofilchem® S.r.l (Roseto, Italy). The deionized water (DeW) was obtained from the reverse osmosis of the “PureLab Flex Elga” purification system (Veolia Water Technologies, Paris, France).

2.2. Biosynthesis of Bacterial Levan In Vitro Using Streptococcus salivarius K12 and Leuconostoc mesenteroides DSM 20343

Pure LAB test cultures were cultivated aerobically at 37 ± 1 °C for 48 h on non-selective MRS agar containing the following (in g L−1): bacteriological peptone, 20.0; beef extract, 10.0; yeast extract, 5.0; D-glucose, 20.0; K2HPO4, 2.0; C2H3NaO2, 5.0; C6H14N2O7, 2.0; MgSO4, 0.2; MnSO4 0.05; and C64H124O26, 1.0, pH adjusted to 6.9, when appropriate media was solidified with 15.0 g L−1 agar. Production of BL was implemented following the protocol (ME.PL.011.2021) developed by a group at LatHort. Briefly, 27.6 g L−1 of modified MRS broth (Table 1) was suspended in 500 mL of deionized water (DW) in 2 L autoclavable reagent bottles with a screw cap (VWR International, GmbH, Darmstadt, Germany) and the bottles’ content was subjected to autoclaving using a “Raypa, AES 110” (Barcelona, Spain) digital autoclave with counter-pressure of 2.0 Pa for 15 min at 121 ± 1 °C. After the prepared broth had reached ambient temperature, a 5 mL suspension containing the reactivated microorganism culture with a final turbidity of 3.0–4.0 McFarland units (108–109 CFU mL−1) was introduced to the broth. In parallel, inoculation (using MRS agar) with the subsequent plate counting technique was performed to confirm the concentration of the pure culture in the suspension inoculated to the broth for the biosynthesis of BL. The fermentation lasted 72 h at 37 ± 1 °C and 60 rpm. The reaction was terminated by subjecting the obtained fraction to thermal processing for 10 min at 99 ± 1 °C.
To separate the biomass and eliminate bacterial remains, the obtained fraction rich in BL was centrifuged at 10,280× g for 10 min at 0 ± 1 °C, using a laboratory-refrigerated centrifuge, “Hermle Z 36 HK” (Hermle Labortechnik, GmbH, Wehingen, Germany). The obtained top layer was collected in 2 L autoclavable reagent bottles with a screw cap. Afterwards, the chemical precipitation of BL was performed using cooled absolute ethanol 99.5% (EtOH) (BL levan fraction:EtOH ratio 1:3 v/v) for 48 h at 4 ± 1 °C. The precipitation of BL diluted in DeW was repeated 3 times to achieve the desired purity of produced BL. Afterwards, the recovered sediment fraction was subjected to centrifugation at 10,280× g for 10 min at 0 ± 1 °C and freeze-drying using a “HyperCOOL, HC3110” freeze-drying system (Hanil Scientific Inc., Gimpo, Republic of Korea) at −50 ± 1 °C under a vacuum of 0.056–0.070 mBar for 24 h. The obtained dry BL was ground to reach a Ø 0.2 mm particle size using a laboratory ball mill, “Anton Paar BM500” (Anton Paar GmbH, Graz, Austria), at a frequency of 15 Hz for 2 min. A schematic representation of the BL production steps is depicted in Figure 1.

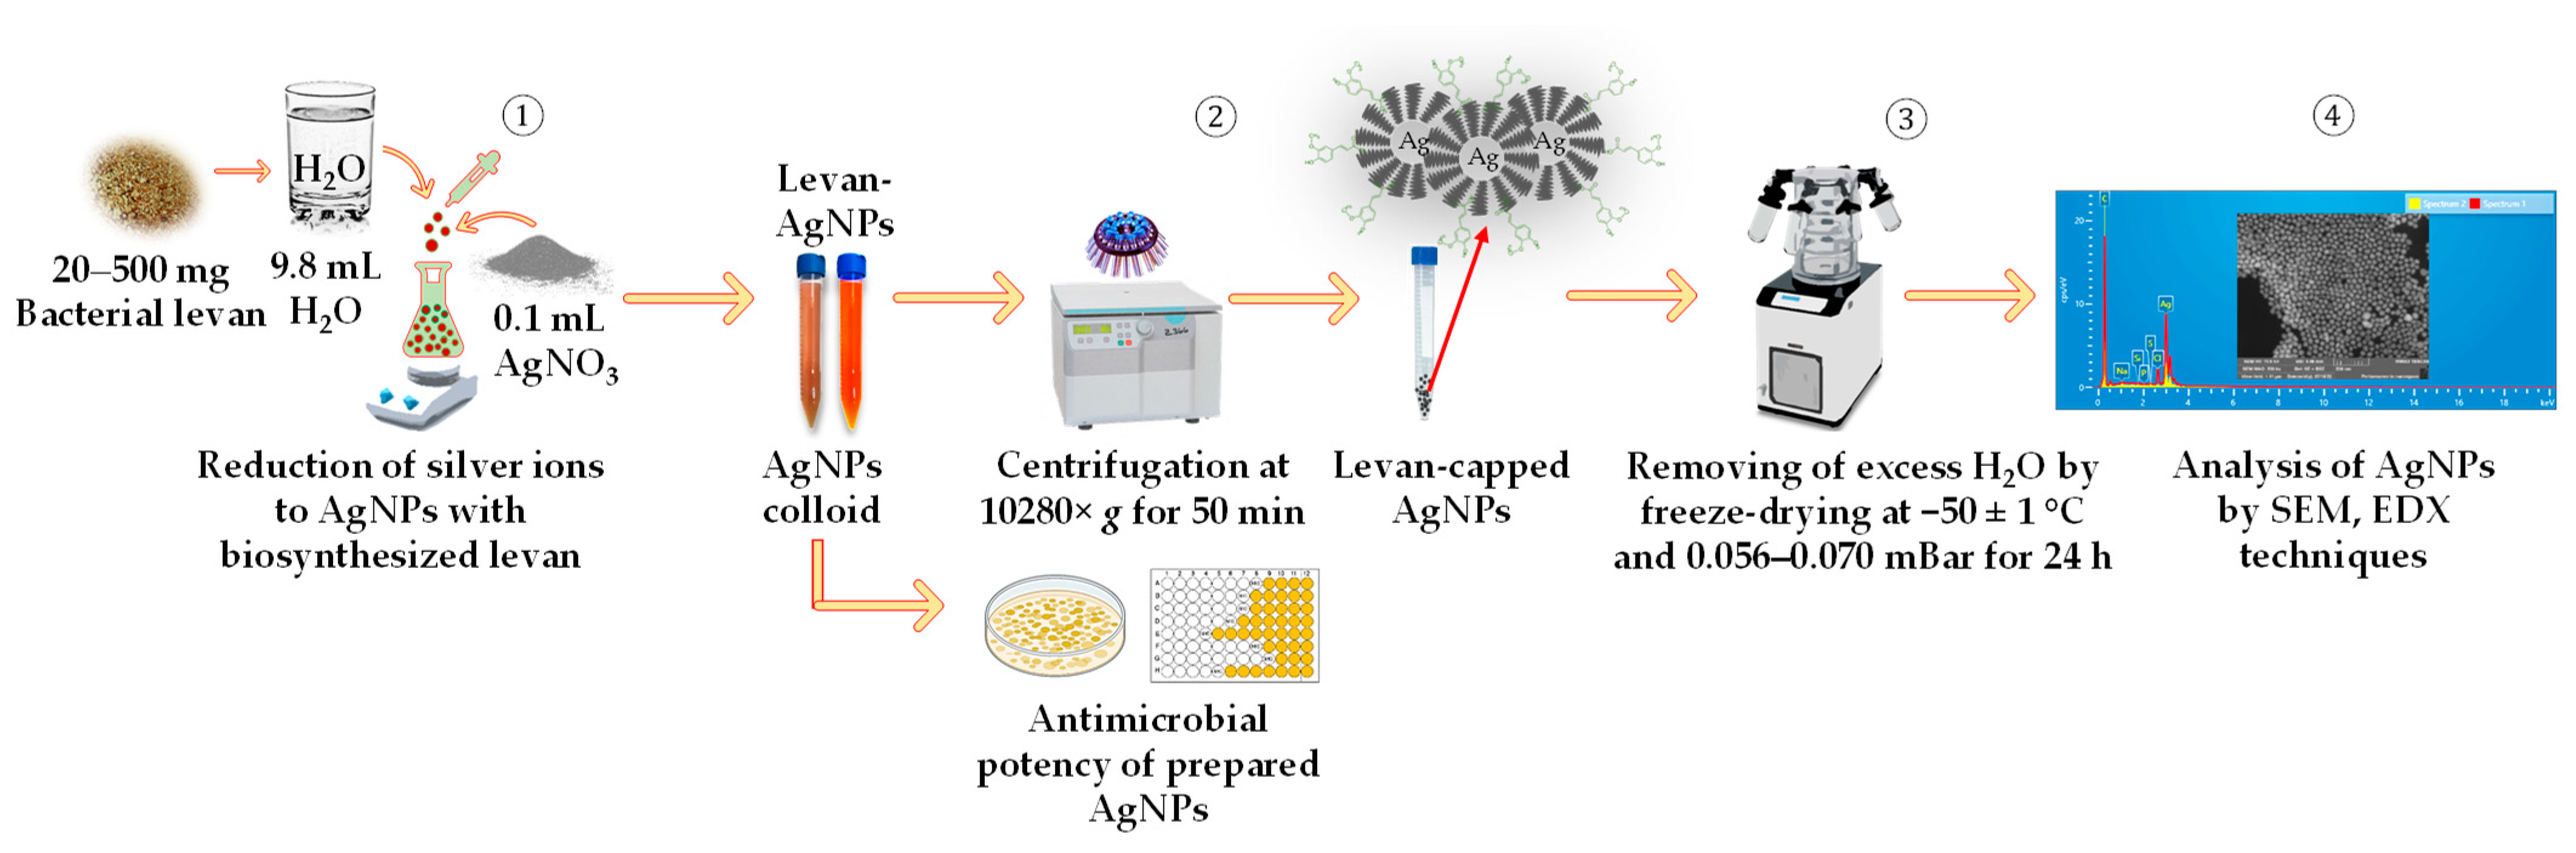
2.3. Preparation of Silver Nanoparticles Using Bacterial Levan Produced by Streptococcus salivarius K12 and Leuconostoc mesenteroides DSM 20343

The stock solution with a molarity of 100 mM AgNO3 was applied as the source of Ag. For the preparation of AgNPs using synthetic DEX (control), 50.0 and 500.0 mg of commercially available DEX with molecular weights, Mw, of 1500–2800 kilodaltons (kDa) were placed in 50.0 mL reagent bottles with a screw cap and heated for 5 min at 80 ± 1 °C with continuous agitation at 500 rpm using a magnetic stirrer, “Arex-6 Digital Pro” (Velp® Scientifica, Usmate Velate, Italy). Subsequently, 100.0 µL of 1.0 M NaOH was introduced through the upper opening, and the solution was allowed to mix well. Later, 100.0 µL of 100 mM AgNO3 solution was introduced drop-wise, thus providing 1 mM AgNO3 in the final solution. In this research, NaOH was employed as an accelerator in the green biosynthesis of BL@AgNPs, as reported by Radenkovs et al. [39]. Since fructose and fructose-type EPS BL are considered to be non-reducing sugar, their application in the green biosynthesis of AgNPs has not been reported so far. However, according to Lobry de Bruyn–Alberda van Ekenstein transformation [40], fructose can be converted into epimers of D-glucose and D-mannose under alkaline conditions within enediol rearrangements and epimerization, and the final products may react with AgNOs as reducing agents. Following the Lobry de Bruyn–Alberda van Ekenstein transformation [40], the first step in glucose conversion is the removal of the proton alpha in ketone under alkaline conditions. During the second step, the resulting enolate is subjected to protonation on oxygen, leading to enediol formation with two hydroxyl (–OH) groups. Further steps involving the enediol rearrangement and deprotonation of a stereocenter carbon atom at two faces lead to the formation of either D-glucose or epimer D-mannose (not shown). However, the final reaction products could be considered a mixture of D-glucose, D-fructose, and D-mannose. In the subsequent reaction, glucose and mannose, as reducing sugars containing a free aldehyde group at the C-1 position, react with Ag+, reducing it to Ag0. In this process, BL restricts the formation of large, irregular NPs acting as capping/anticoagulation agents similar to those reported for DEX [41].
To elucidate the concentration and the type of BL used as a reducing agent on NP geometry and particle size distribution, the biosynthesis of BL-AgNPs was appraised, varying in the concentration and source of BL (from 20.0 to 500.0 mg). The reaction mixtures were heated for 1 h at 80 ± 1 °C, ensuring constant stirring at 500 rpm. The mixture gradually shifted from light yellow to reddish brown color during thermal exposure over 1 h. The whole reaction was carried out in the dark, covering the vessel with foil to preserve the AgNO3 from aggregation. For antimicrobial analysis, part of the obtained BL-AgNP CoS was delivered to the Faculty of Veterinary Medicine, Latvia University of Life Sciences and Technologies. In contrast, the second part was centrifuged at 10,280× g for 50 min at 20 ± 1 °C to obtain dry BL@AgNPs for morphological, elemental, and structural analyses by scanning electron microscopy (SEM), energy-dispersive X-ray (EDX) spectroscopy, and Fourier-transform infrared (FT-IR) spectroscopy, respectively. Before freeze-drying, the pellet containing BL@AgNPs was washed 3–4 times with DeW to remove free silver ions. Freeze-drying of BL@AgNPs was conducted at −50 ± 1 °C under a vacuum of 0.056–0.070 mBar for 24 h. Freeze-dried NPs were stored in a cool, dry, and dark place and further used for their characterization. A schematic representation of the CoS-BL@AgNP biosynthesis steps following green chemistry principles is shown in Figure 2.

2.4. Preparation of Bacterial Levan for Free and Total Saccharide Analysis

Extraction of free mono- and disaccharides from a dry and ground matrix of BL was carried out by subjecting the sample to gentle heating at a temperature of 60.0 °C for 30 min with further ultrasonic treatment at 50 kHz, an output power of 360 W for 30 min, and a temperature of 25.0 ± 1 °C using an “Ultrasons” ultrasonic bath (J.P. Selecta®, Barcelona, Spain). For the extraction of saccharides, the sample (100.0 mg ± 1.0) was mixed with 1.0 mL 50% MeCN (H2O:CH3CN, v/v), and the extraction was carried out in 15.0 mL conical plastic tubes (Sarstedt AG & Co. KG, Numbrecht, Germany). After treatment, the resulting mixture was intensively vortexed with a “ZX3” vortex mixer (Velp® Scientifica, Usmate Velate, Italy). For the separation of fractions, the prepared samples were centrifuged at 3169× g for 10 min−1 and a temperature of 19.0 ± 1 °C using a “Sigma, 2-16KC” centrifuge (Osterode near Harz, Germany). Before HPLC-RID analysis, the collected supernatant was filtered through a 0.45 µm polytetrafluoroethylene (CHROMAFIL® Xtra H-PTFE) hydrophilized membrane filter (Macherey-Nagel GmbH & Co. KG, Düren, Germany).
To specify the composition of BL, the produced EPSs were subjected to mild acidic hydrolysis utilizing hydrochloric (HCl, 0.1, 0.2, 0.5 M), trichloroacetic (TCA, 1.0 M), and oxalic (0.05 M) acids, as proposed by Semjonovs et al. [30]. For this purpose, the sample (100.0 mg ± 1.0) was mixed with 2.0 mL of acid, whose molarities of which are mentioned above, in a 22.0 mL glass Headspace (PerkinElmer, Inc., Waltham, MA, USA) with screw caps and silicone seals and vortex mixing for 1 min. Then, the prepared mixture was subjected to thermal processing in a drying cabinet, “Pol-Eko Aparatura” SP.J. (Wodzisław Śląski, Poland), at a temperature of 90 ± 2 °C either for 3 or 6 h. After hydrolysis, the volume of hydrolysate was brought to 4.0 mL with MeCN, and the pH was adjusted to 6.5–6.8 using 25% NH4OH solution if necessary. The final volume was 5.0 mL. Subsequent steps of the sample preparation are identical to those indicated above.

2.5. The HPLC-RID Conditions for Carbohydrate Analysis

Quantitative analysis of free and bound mono- and disaccharides in dried BL was performed using a “Waters Alliance” HPLC system (Model No. e2695) coupled to a 2414 RI detector and a 2998 column heater (Waters Corporation, Milford, MA, USA) following the methodology described by Radenkovs et al. [42].

2.6. Preparation of Bacterial Levan for Determination of Molecular Weight and Rheological Features

SEC is a solution-based technique in which dissolved macromolecules are separated by size; dissolution studies were carried out to determine with which solvent to undertake the analysis. Sample solutions were prepared using three solvents, i.e., 0.1 M aqueous NaNO3 solution, 0.1 M LiBr in dimethyl sulfoxide (DMSO), and 0.1 M LiBr in dimethyl formamide (DMF). The sample solutions were stirred and heated at 80 ± 2 °C overnight for 16 h. It was noted that the samples dissolved more easily in DMSO, as high turbidity in the case of NaNO3 and particulates in the case of DMF were observed after mixing solvents with obtained EPSs. The DMSO sample solutions were filtered through a 0.45 µm PTFE membrane before being analyzed using the “OMNISEC” system (Malvern Panalytical Ltd., Malvern, UK).

2.7. The Analytical Multi-Detector Gel Permeation Chromatography/Size-Exclusion Chromatography–Liquid Chromatography (GPC/SEC–HPLC) System Conditions for Bacterial Levan Analysis

The analyses of weight average molecular weight (Mw), number average molecular weight (Mn), dispersity (Ð), hydrodynamic radius (Rh), intrinsic viscosity (IV), and recovery of BL were carried out using an “OMNISEC” multi-detection size-exclusion chromatographic (SEC) system (Malvern Panalytical Ltd.). The detectors utilized for these studies were the static light scattering, differential refractive index (RI), and viscometer (Malvern Panalytical Ltd.). Two observation angles, i.e., a right angle (90°) and low angle (7°), were used to acquire the sample chromatograms within the static light-scattering detector. A sample of 100.0 μL was injected onto a styrene-divinyl benzene gel permeation analytical column (GPC) (T6000Ms, 10.0 μm, 300 × 8.0 mm; Malvern Panalytical Ltd.) operating at 50 °C and a flow rate of 0.6 mL min−1. Chromatographic separation of analytes was achieved using an isocratic flow rate of a mobile phase composed of DMSO (LiBr 0.1 M). During this work, the autosampler and flow cell temperature were maintained at a constant 25 °C. Data were acquired and processed using “OMNISEC” V11.30+. Detector constants, detector offsets, and band broadening were determined using a pullulan standard (Malvern Panalytical Ltd.). Commercial DEX with a molecular mass ranging from 6 to 2560 kDa (Sigma, St. Louis, MO, USA) was used as the standard.

2.8. Scanning Electron Microscope (SEM) and Energy-Dispersive X-ray Spectroscope (EDX)

The morphology of two BLs biosynthesized by S. salivarius K12 and L. mesenteroides DSM 20343 and engineered into BL@AgNPs in CoSs were observed using a “Mira3” scanning electron microscope (SEM) by “Tescan Orsay Holding”, a.s. (Brno-Kohoutovice, Czech Republic). Freeze-dried BL and BL@AgNPs were mounted in a thin layer onto SEM pin stubs using double-sided adhesive carbon discs, and non-fixed particles were blown by a gentle stream of N2. Before SEM observation, BL was coated with a gold–palladium alloy using the sputter coater “Leica EM ACE600” (Leica Microsystems, Wien, Austria). The conditions were adjusted to work under a high vacuum mode utilizing a back-scattered electron (BSE) and secondary electron (SE) detector mixer. The BLs were analyzed by increasing magnification up to 5.0 kx, while BL@AgNPs, by 250.0 kx, for precise dimensional measurement and elemental composition analysis operating at a 15 kV acceleration voltage. Elemental composition analysis of the BL@AgNPs was carried out using an energy-dispersive X-ray spectrometer (EDX) equipped with an “INCA x-act LN2-free Analytical Silicon Drift Detector” with PentaFET® Precision by Oxford Instruments Inc. (Bognor Regis, UK), operating from a 4 to 15 mm working distance for energy spectrum accumulation.

2.9. Fourier-Transform Infrared Spectroscopy (FT-IR)

The functional groups of dry BLs biosynthesized by S. salivarius K12 and L. mesenteroides DSM 20343 and prepared into CoS-BL@AgNPs using BL as a natural reducing and capping agent were analyzed using an “IR-Tracer-100” Fourier-transform infrared spectrophotometer (Shimadzu Corporation, Tokyo, Japan). This technique was reported to be helpful by allowing for the identification of BL due to the peculiar absorption band maxima in the mid-infrared region, which could be distinguished [30]. The 1 mg of dry powder was mixed with 100 mg of potassium bromide (KBr) and pressed to obtain a metal mold. The spectrum was acquired within the infrared region of 400–4000 cm−1 with a resolution of 4 cm−1. Data were acquired using LabSolutions IR software (Tokyo, Japan), which was also used for instrument control and data processing.

2.10. In Vitro Susceptibility Tests

2.10.1. Minimum Inhibitory Concentration (MIC)

The minimum inhibitory concentration (MIC) of CoSs containing either BL@AgNPs or DEX@AgNPs was determined using the microdilution method in 96-well plates and utilizing four reference test cultures, including Pseudomonas aeruginosa ATCC101 45, Staphylococcus aureus ATCC6538, Escherichia coli ATCC25922, and Enterococcus aerogenes ATCC 13048, and four bacterial isolates from clinical samples with MDR, including P. aeruginosa, S. epidermidis, E. coli, and E. faecium, following protocol reported by Radenkovs et al. [42]. Pathogenic microorganisms were cultivated on nutrient agar (NA; Oxoid, Inc., Thermo Fisher Scientific, Hampshire, UK) for 20 ± 2 h at 36 ± 1 °C and re-suspended in MHB. The suspension turbidity was adjusted to 0.5 McFarland units (108 colony-forming units (CFU) mL−1) by applying a “DEN-1B McFarland Tube Densitometer” (Grant Instruments Ltd., Cambridge, UK). The suspension was subsequently diluted to a concentration of approx. 1.5 × 10⁶ CFU mL−1 (bacterial inoculum). Afterwards, a serial two-fold dilution method was used to determine the concentration-dependent antimicrobial potency. For this purpose, the concentration of each CoS in the first well was adjusted to 25% (83.3 µL mL) by mixing 100 µL of either BL@AgNPs or DEX@AgNPs with 100.0 µL of MHB and 100 µL of prepared bacterial inoculum. Afterwards, 100 µL of the first well was diluted with 50 µL of MHB and 50 µL of prepared bacterial inoculum and was introduced to the second well. The negative control consisted of MHB, while the positive control, of MHB and bacterial inoculum with test cultures. To calculate MBC, 1 µL of each positive control aliquot before incubation of the microplate was inoculated into two Mueller–Hinton Agar II plates for the baseline concentration of the tested bacteria. After incubation for 24 h at 36 ± 1 °C, the MIC was defined as the lowest concentration that inhibited bacterial growth based on the absence of visible turbidity [42].

2.10.2. Minimum Bactericidal Concentration (MBC)

The MBC was complementary to the MIC assay to identify the lowest concentration of produced CoS-BL@AgNPs leading to death by bacteria. For this purpose, an aliquot of 1 µL from all the wells showing no visible bacterial growth was subcultured into MHA and incubated for 24 h at 36 ± 1 °C. Subsequently, the CFUs were enumerated, and the MBC was specified as the lowest concentration of BL@AgNPs, leading to 95% bacterial death.

2.10.3. Agar Disc Diffusion Method

The antibacterial activity of elaborated CoSs containing either BL@AgNPs or DEX@AgNPs was probed against selected reference test cultures and clinical isolates with MDR using the Kirby–Bauer disc diffusion test following the protocol provided by Radenkovs et al. [42] with modifications. Briefly, a sterile cotton swab spread the bacteria strains in a concentration of 0.5 McFarland units on the MHA. Then, the sterile paper discs with a diameter of 6 mm were placed on the agar plate and soaked with 50 μL of prepared CoSs composed of either BL@AgNPs or DEX@AgNPs. The plates were incubated for 24 h at 36 ± 1 °C, and the zone of inhibition was observed and measured in mm.

2.10.4. Agar Well Diffusion Method

Due to the negligible diffusivity of certain NPs through the culture media, as reported by Kourmouli et al. [43], under a separate trial, the agar well diffusion method was used to elucidate the antimicrobial potency of the prepared CoS. For this purpose, wells with a diameter of 6 mm were punched in the agar and filled with the same antimicrobials described above. The zone of inhibition was observed and measured in mm after incubation for 24 h at 36 ± 1 °C.

2.11. Statistical Analysis

The data acquired are shown as the means ± standard deviations of three replicates (n = 3). A p-value of ≤0.05 was used to indicate significant differences between mean values established by one-way analysis of variance (ANOVA) and Duncan’s multiple range test conducted using IBM® SPSS® Statistics version 20.0 (SPSS Inc., Chicago, IL, USA).

3. Results and Discussion

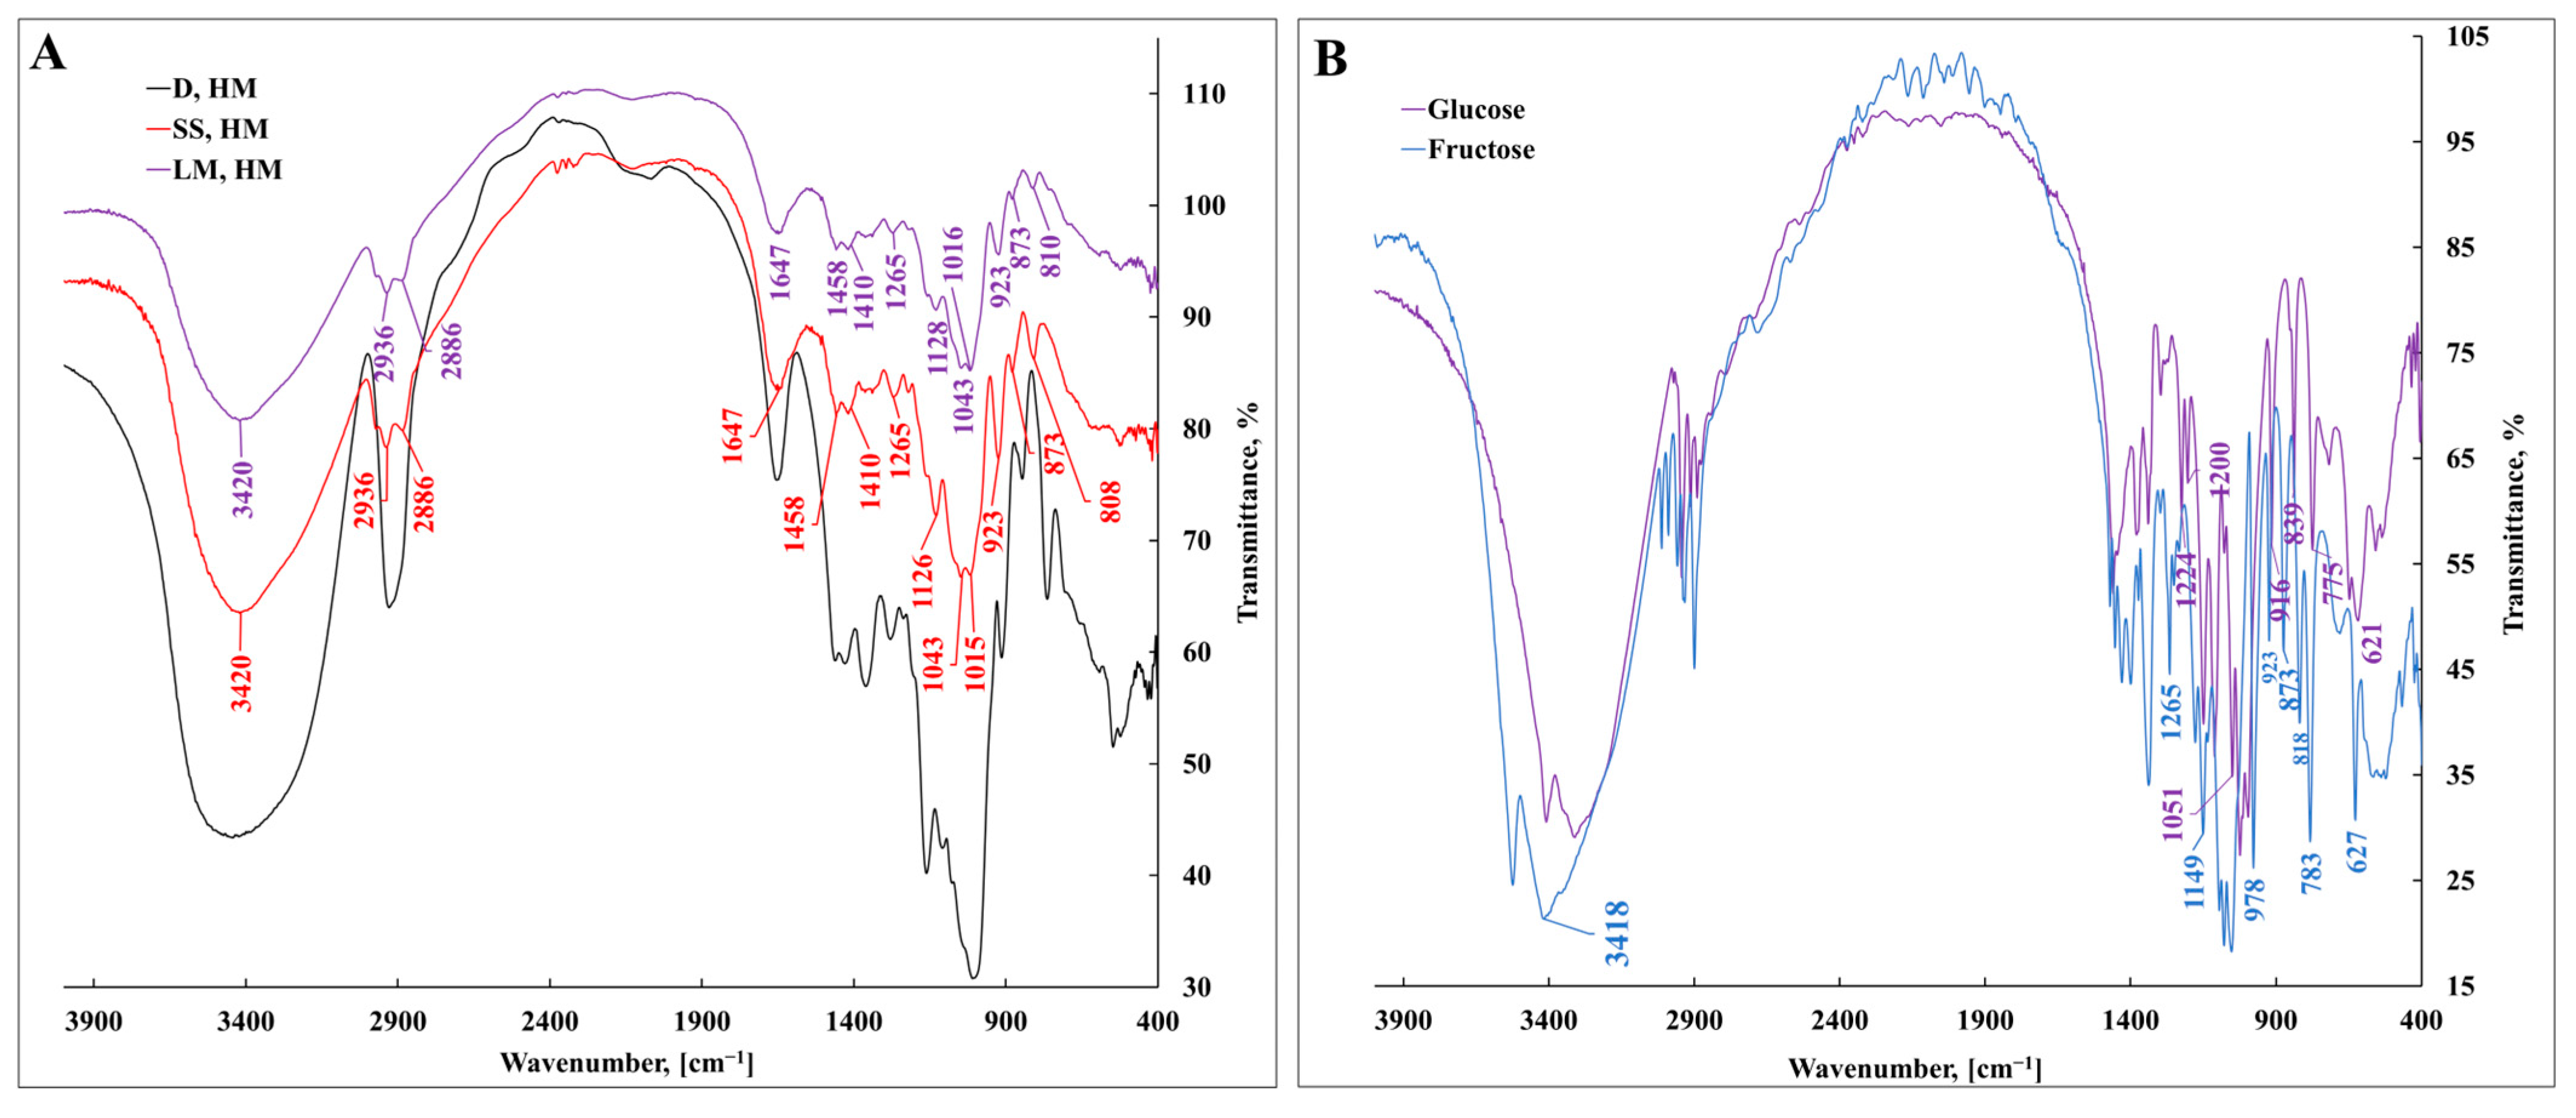
3.1. Characterization of Bacterial Levan Biosynthesized by Streptococcus salivarius K12 and Leuconostoc mesenteroides DSM 20343 Using Fourier-Transform Infrared Spectroscopy

FT-IR analysis was executed to clarify the deposition of functional groups in BL produced by the S. salivarius K12 and L. mesenteroides DSM 20343 test cultures. Figure 3 shows the FT-IR spectra of EPSs, while Table 2 summarizes the absorption band assignments. The ring and stretching vibrations were recorded in transmittance mode from the wavenumber of 4.000 to 400 cm−1 and compared with the commercially available high-molecular-weight DEX and with spectra of BL available in the literature. Figure 3A represents a broad and strong peak at 3600–3200 cm−1, specifically, at 3419 cm−1 in S. salivarius K12 and L. mesenteroides DSM 20343 attributed to the νO–H stretching vibration due to intermolecular hydrogen bonding [44]. The same stretching vibration of νO–H was observed for fructose (Figure 3B) and supported by Ibrahim et al. [45]. The deposition of νO–H group in DEX was observed at 3404 cm−1 and is consistent with data reported by Glišić et al. [46]. The broad asymmetric νC–H stretching peaks at 2935 cm−1 and symmetric peaks at 2885  cm−1 in S. salivarius K12 and L. mesenteroides DSM 20343 correspond to the methylene group CH2 [47,48]. A broad νC–H stretching absorption band with an asymmetric peak at 2927.94 cm−1 was distinguished in the DEX spectrum [49,50]. The stretching vibration of the existence of νC–H and the broad band at 1647 cm−1 in all EPSs analyzed specify residual water presence [48,51]. The appearance of a δC–O–H bending vibration at 1380–1340 cm−1 was also observed and could serve as a feature of the fructose oligomers and polymers [52].
The bands at 1458 cm−1 and 1410 cm−1 in the BL produced by S. salivarius K12 and L. mesenteroides DSM 20343 represent bending vibrations of CH2 and CH3, respectively [53,54,55]. Broad and intense absorption bands due to C–O stretching vibrations were observed at 1126.43 cm−1 and 1014.56 cm−1, indicating the presence of pyranose or furanose units in the produced EPSs with C–OH or C–O–C vibrations, which are a carbohydrate fingerprint [44]. Characteristic absorption at 923, 873, and 809 cm−1 in the BL of S. salivarius K12 and L. mesenteroides DSM 20343 was also observed, corresponding to the furanose ring of the sugar units [44,56]. The acquired spectra confirm the molecular fingerprint attributed to the basic skeleton and functional groups of EPSs, particularly BL. Both EPSs shared similar structures. The values are consistent with those of commercial BL reported by [57,58,59].

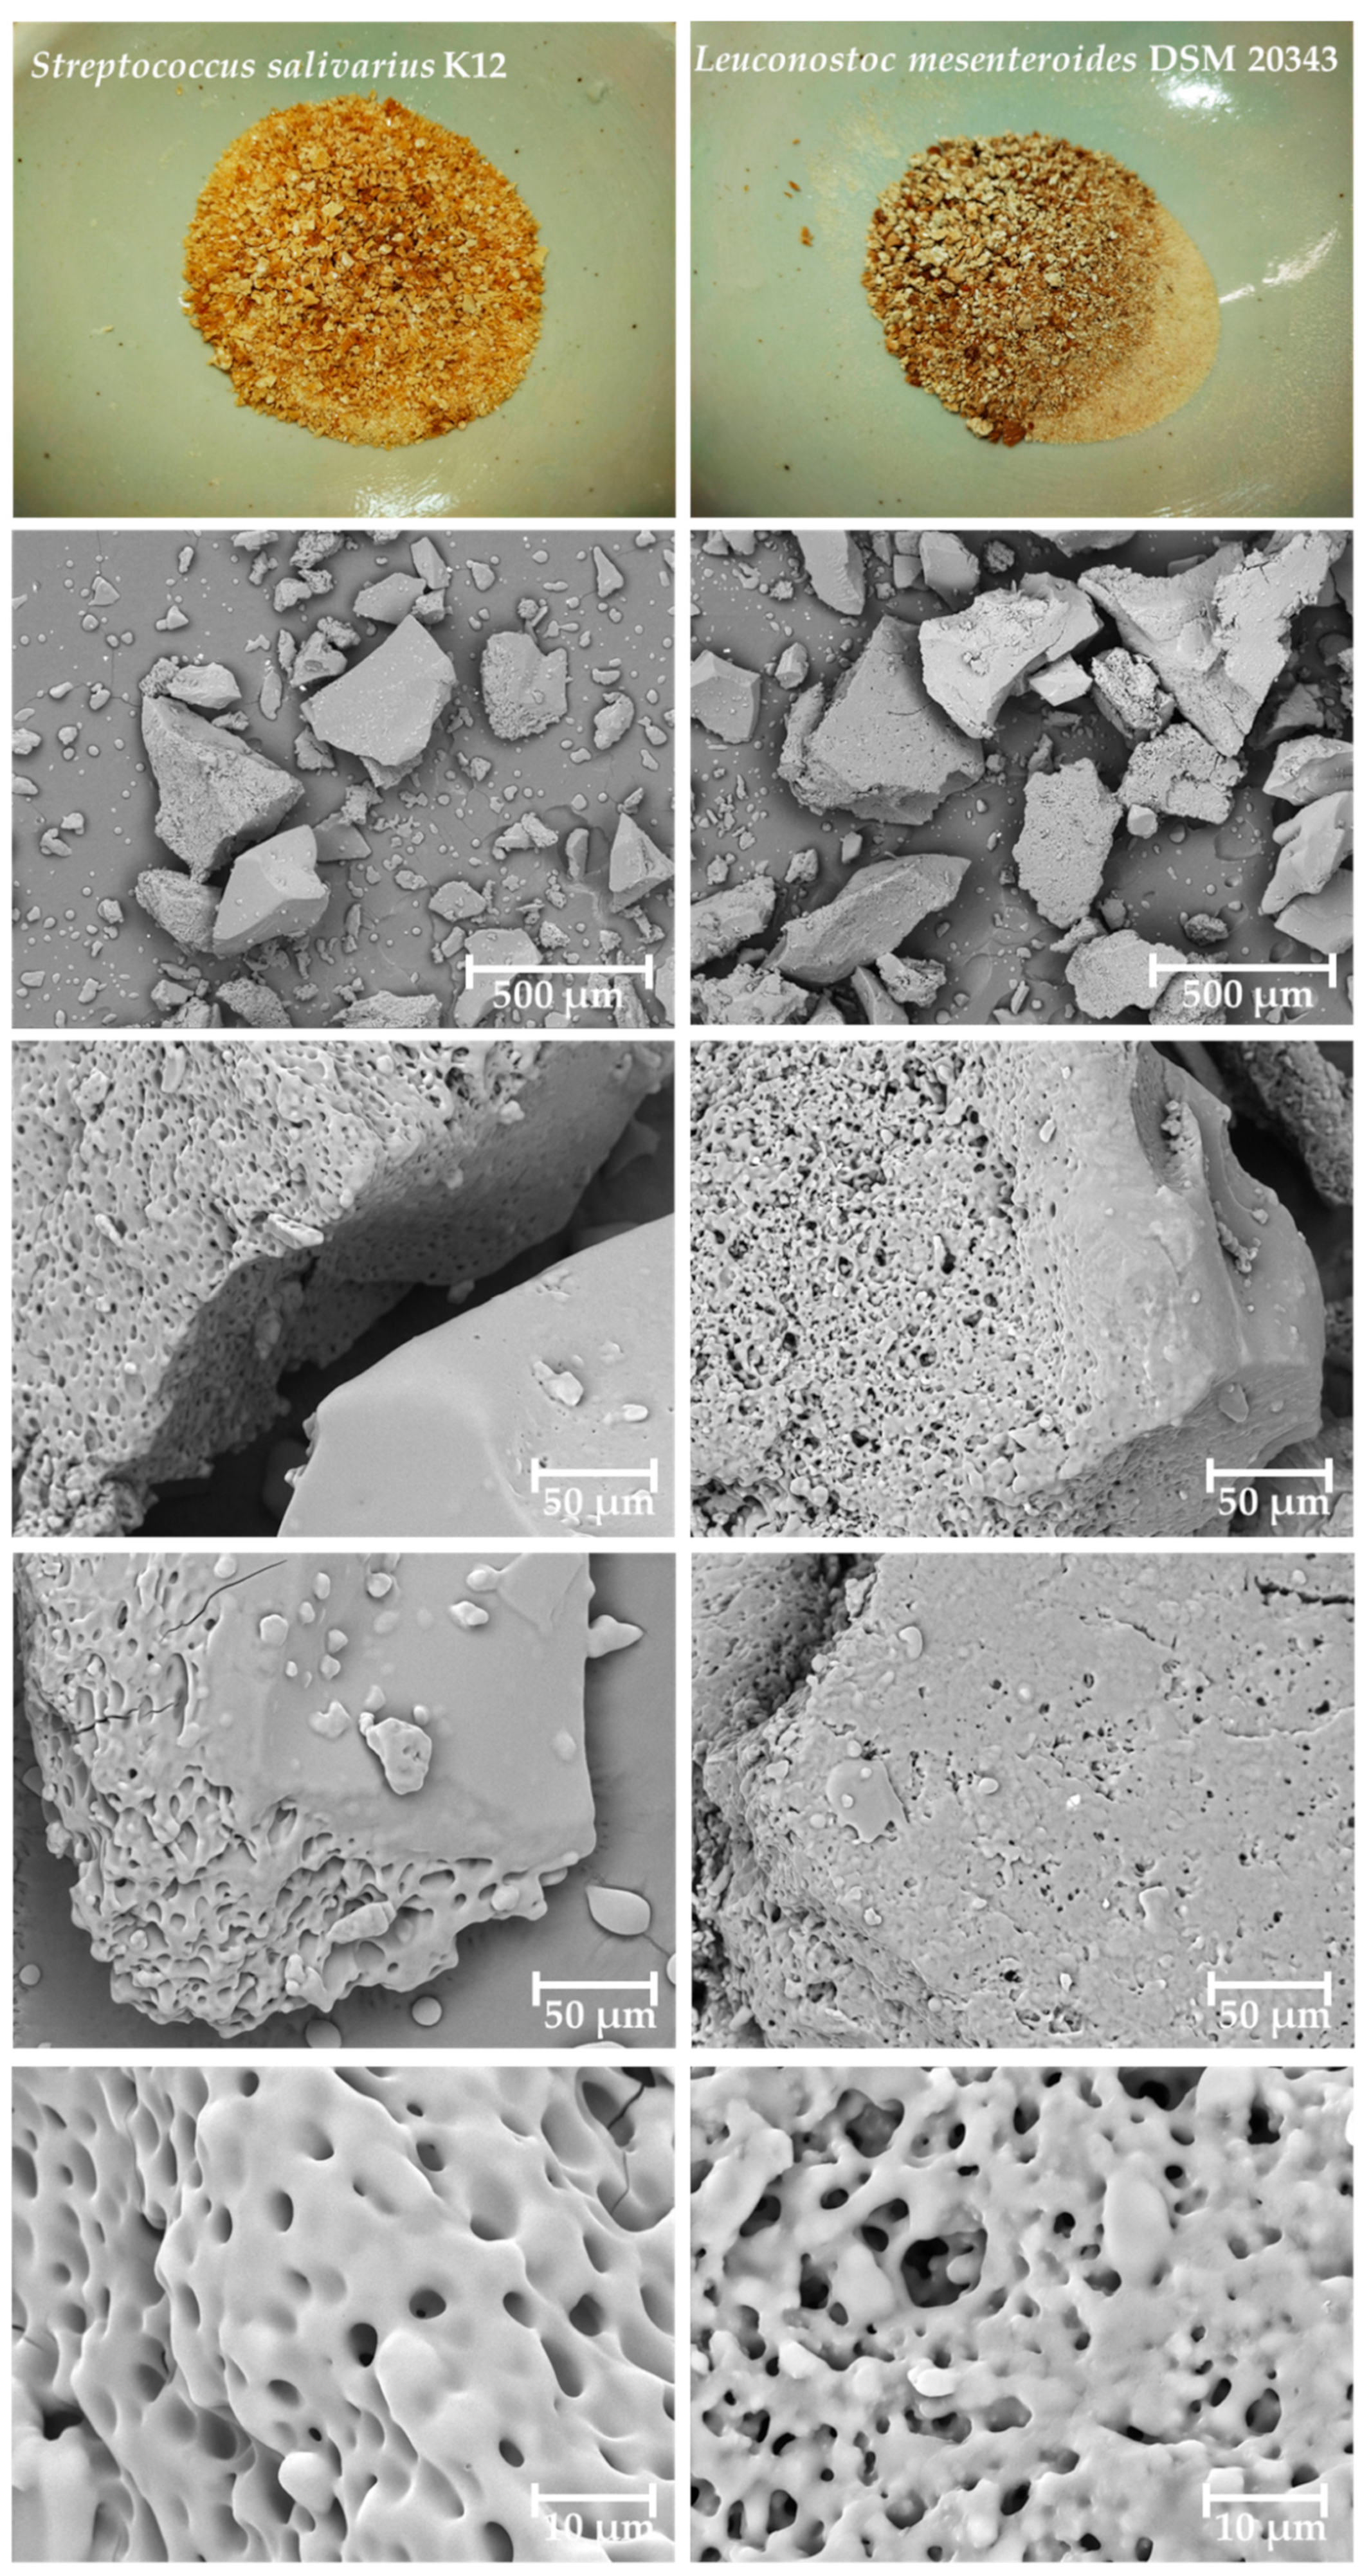
3.2. Surface Morphology and Microstructural Feature Analysis of Bacterial Levan Synthesized by Streptococcus salivarius K12 and Leuconostoc mesenteroides DSM 20343 Using Scanning Electron Microscopy

According to an observation made by Qin et al. [60], a microstructure serves as an indicator allowing for the prediction of physical properties of unknown polymers and defining their further applicability within the industry. For instance, the highly branched and microporous structure of BLs and the availability of hydroxyl groups explain its ability to form rigid hydrogels with multiple applicability within the food and pharmaceutical industries [61,62,63]. The surface morphology and microstructure of freeze-dried and ground BL produced by S. salivarius K12 (B) and L. mesenteroides DSM 20343 were acquired by taking advantage of SEM and are depicted in Figure 4. Both BLs show a crystalline morphology with a smooth and glossy surface at the splitting site, forming sharp edges. Similar surface features were reported by Shimizu et al. [64] and Pei et al. [65] for BLs isolated from Erwinia herbicola and Bacillus megaterium PFY-147, respectively. A cross-section of specimens revealed a poroid, concrete-like network structure with less than 3 μm diameter of pores within matrices of BL isolated from S. salivarius K12 (B) and L. mesenteroides DSM 20343. However, the former BL demonstrated the most uniform pore distribution. The observed microstructure of BLs does not resemble morphological features of high-molecular-weight BL isolated from S. salivarius, as documented by Xu et al. [66], presumably due to differences in biosynthesis, extraction, and purification conditions. The observed microstructural features, as well as the available literature, allow for the speculation that BLs produced by two LAB species would find their applicability within the food, pharmaceutical, and cosmetic industries. However, additional experiments elucidating structural–mechanical analysis are necessary.

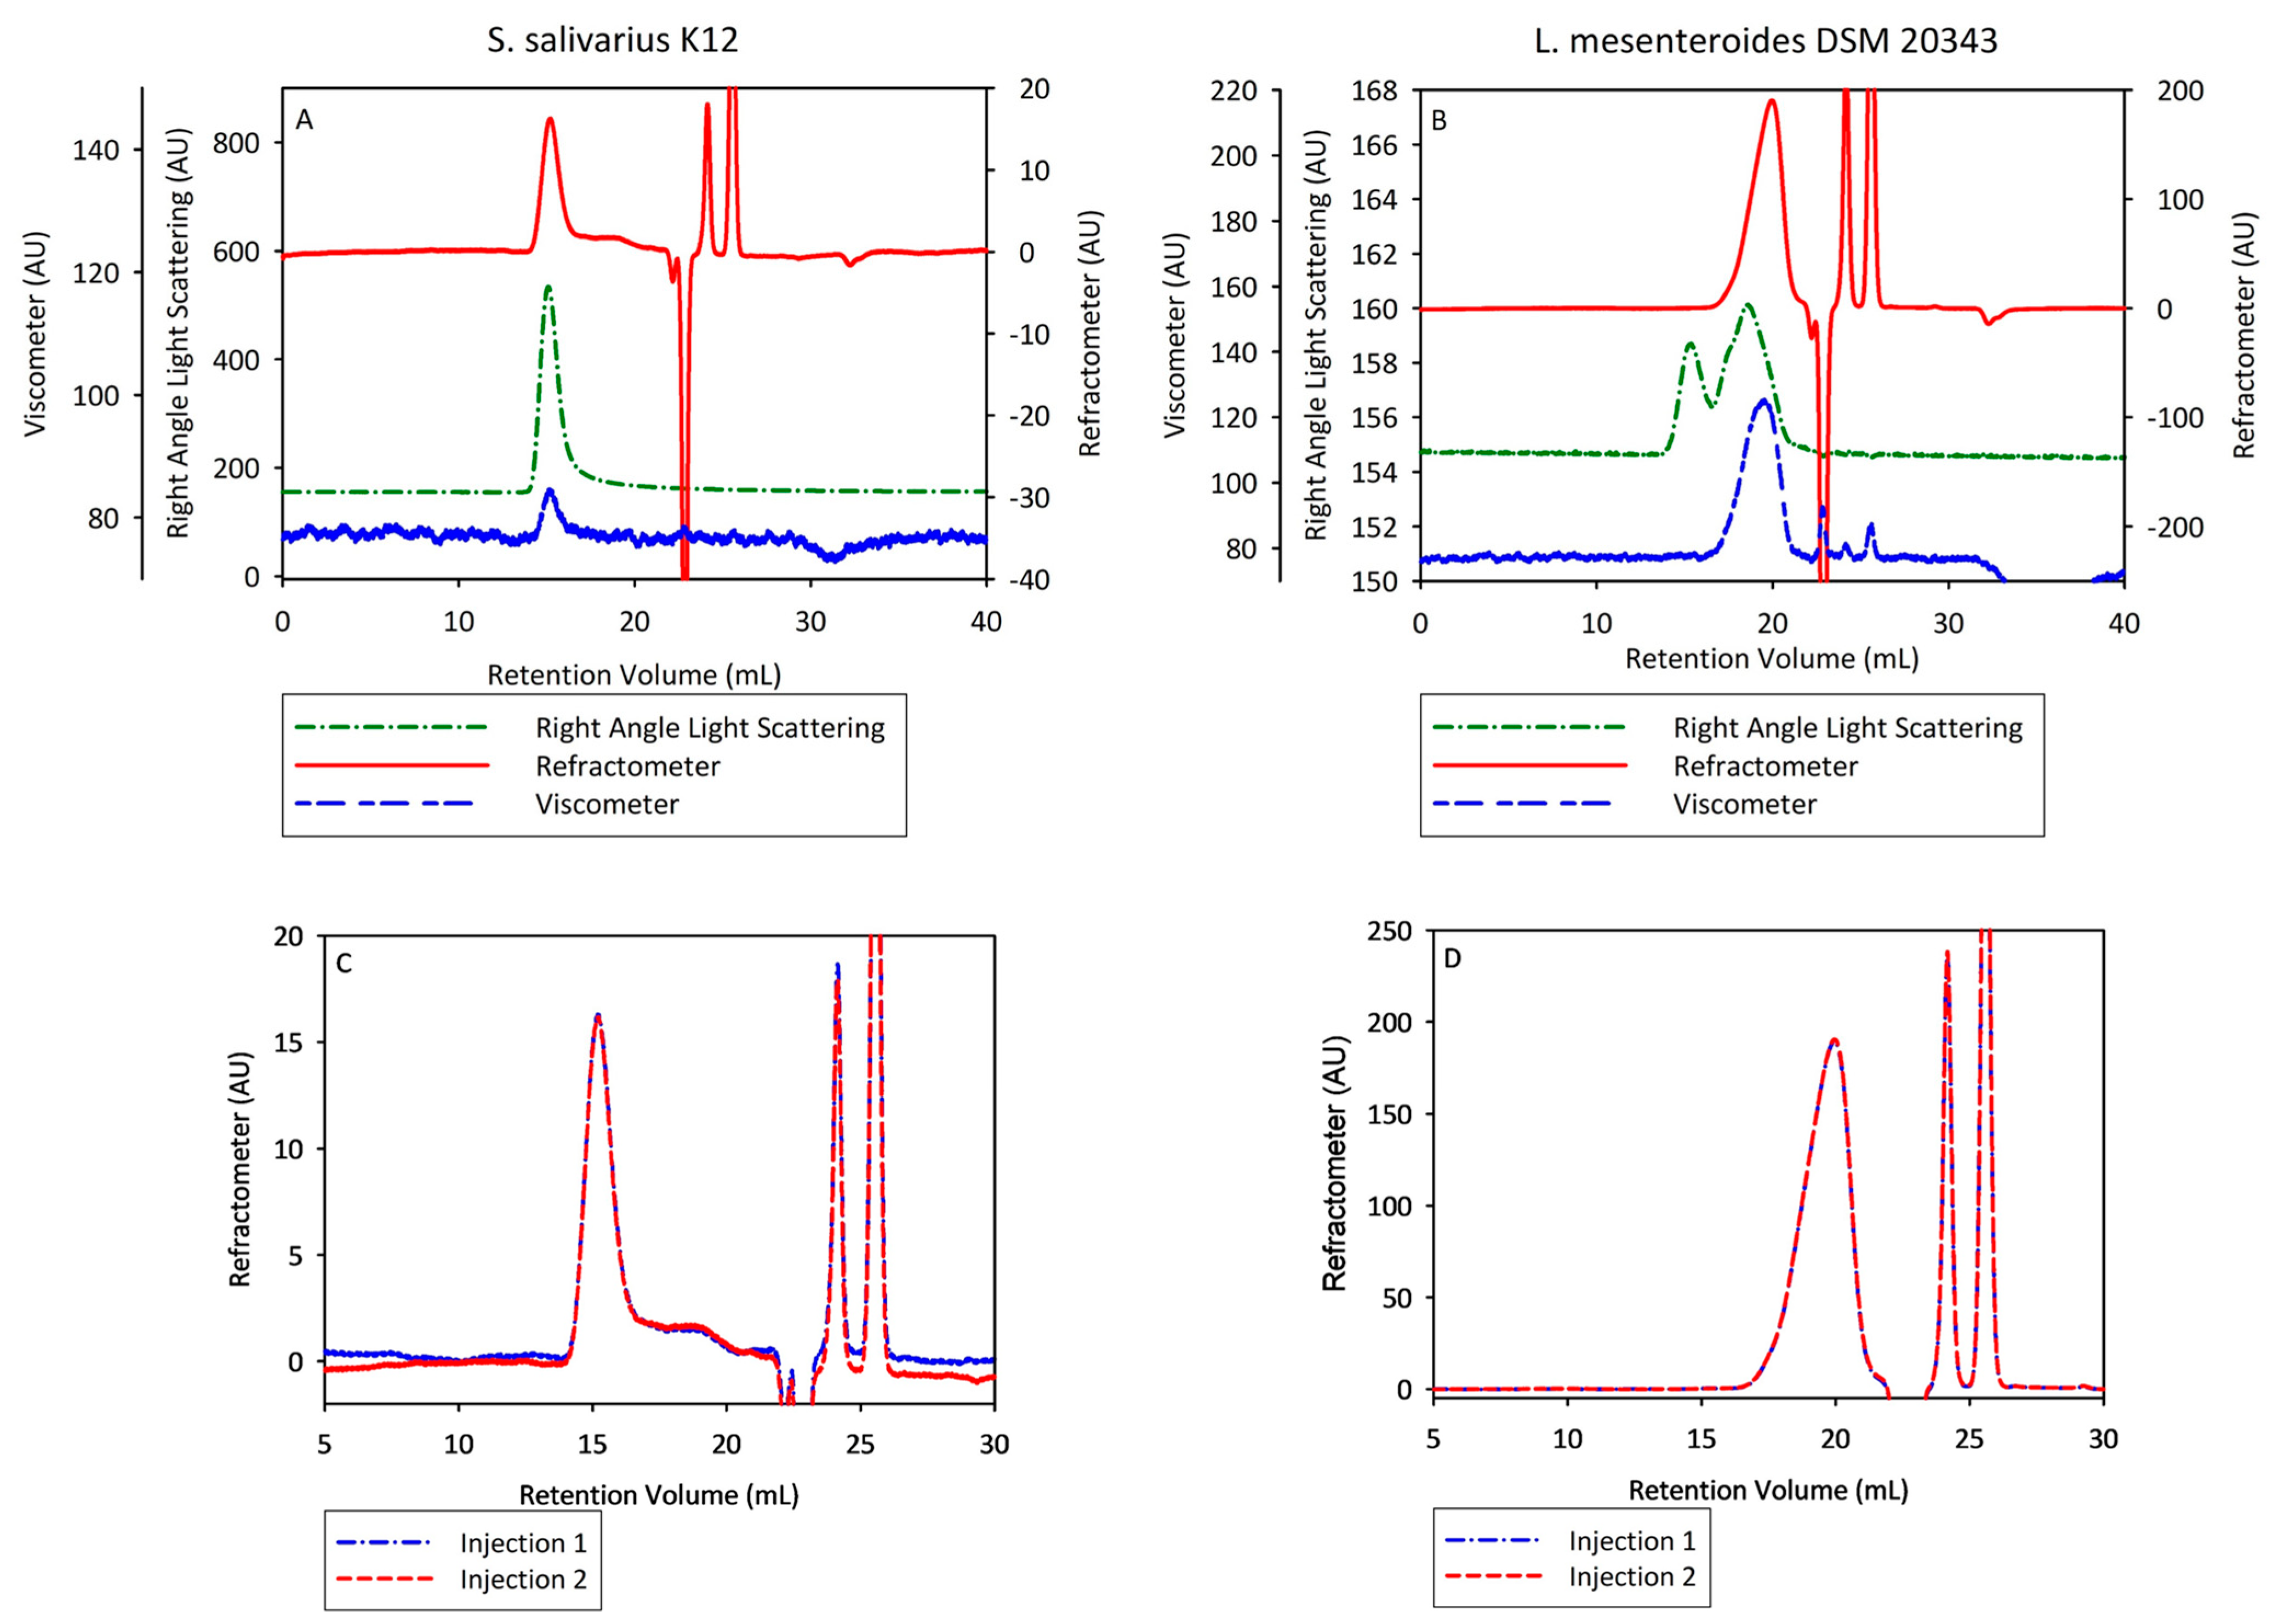
3.3. Characterization of Bacterial Levan Biosynthesized by Streptococcus salivarius K12 and Leuconostoc mesenteroides DSM 20343 by Multi-Detector Gel Permeation Chromatography/Size-Exclusion Chromatography–Liquid Chromatography

The molecular structure and physical properties of BL biosynthesized by S. salivarius K12 and Leuconostoc mesenteroides DSM 20343 were determined by the GPC/SEC–HPLC system. The multi-detection chromatograms of the BL indicate that good signal-to-noise ratios were obtained, and therefore, absolute molecular weight and intrinsic viscosity calculations could be estimated (Figure 5A,B).
The RI detector in red shows the sample’s concentration and thus reveals that the two samples eluted at different times. Following the RI detector, the BL biosynthesized by L. mesenteroides DSM 20343 eluted much later (17–21 mL) than that biosynthesized by S. salivarius K12 (14–20), indicating that it is much smaller in Mw. The right-angle (RALS) and left-angle (LALS) scattering detectors show that the BL biosynthesized by L. mesenteroides also had a peak around 14–16 mL, but this was in such a low concentration that the RI detector did not detect it. This phenomenon is typical for particles with an extremely high molecular weight; following the Rayleigh–Gans–Debye theory of static light scattering, they scatter light proportionately to their molecular weight and change their solution refractive index proportionally to the sample’s concentration [67]. The appearance of an additional peak may have indicated the presence of a component of lower molecular weight in the biopolymer fraction. Santos-Moriano et al. [68] made a reasonably similar observation, highlighting that the production of BL by the levansucrase of Zymomonas mobilis at lower operational temperatures contributes to the formation of longer polysaccharides. Figure 5C,D show that the duplicate injections of the samples overlayed well, indicating that the samples were stable in-solution. A lack of intermolecular interactions with the column packing material and the filter materials illustrates that the chosen conditions for SEC were suitable. The numerical values of BL are summarized in Table 3, indicating that BL biosynthesized using S. salivarius K12 had an Mw 500 times larger than BL obtained by L. mesenteroides DSM 20343, whose values corresponded to 15.435 × 10⁴ and 26.6 kDa, respectively. The obtained data reveal that BL produced by L. mesenteroides DSM 20343 is classified as a low-molecular-weight polymer, according to Hou et al. [69]. However, this is the first report demonstrating the ability of S. salivarius K12 to produce BL over 15 million Da under standardized processing and operational conditions. The observed Mw of BL of S. salivarius K12 is in agreement with that reported by Newbrun and Baker [70] for BL derived from the reference test culture S. salivarius ATCC 13419, corresponding to 16–23 million Da. This degree of polymerization of levan makes it possible to use it as both a capping and reducing agent in the green biosynthesis of metallic NPs due to its intrinsic immunomodulatory activity and its physical–chemical properties [63]. Its unique features such as water solubility, strong adhesiveness, film-forming ability, low viscosity, high oil solubility, compatibility with salts and surfactants, thermo-, acid and alkaline resistance, and high water retention capacity make BL useful in the preparation of hydrogels and CoSs containing metallic NPs suitable for wound dressing applications [71]. Polydispersity estimation (PD = Mw/Mn) of the produced BL displayed a monodispersed molecule isolated from S. salivarius K12, corresponding to 1.08 and 2.17 for the L. mesenteroides DSM 20343 isolate (Table 3). The estimated PD value of BL derived from S. salivarius K12 is consistent with that of Ua-Arak et al. [72] for BL isolated from Gluconobacter albidus TMW 2.1191, revealing narrow molar mass distribution among molecules within BL. However, the polydispersity value of BL produced by L. mesenteroides DSM 20343 was relatively higher than that of BL from S. salivarius K12. The presence of tails on chromatograms presumably suggests the branching structure of BL produced by L. mesenteroides DSM 20343 [72]. The hydrodynamic radius (Rh), which reflects the shape of molecules, estimated for the BLs of S. salivarius K12 and L. mesenteroides DSM 20343, was found to be, on average, 35.7 and 3.5 nm, respectively.
The observed Rh value of BLs produced by S. salivarius K12 aligns with that reported by Zhang et al. [73] for EPS derived from yoghurt fermented with a high-EPS-producing strain S. thermophilus AR333. The unusually low intrinsic viscosity of BL produced by S. salivarius K12 and L. mesenteroides DSM 20343 revealed a compact spherical molecular structure [74]. The observed values are consistent with those reported by Semjonovs et al. [30] and Arvidson et al. [75]. The recovery of BLs produced, which was estimated between the injected and detected concentrations of BL, corresponded to 54.7 and 81.2%. A reduced recovery for the BL produced by S. salivarius K12 was conditioned by a relatively larger Mw of the EPS molecule and difficulties associated with complete dissolution by selected solvents used for sample preparation during GPC/SEC–HPLC analysis.

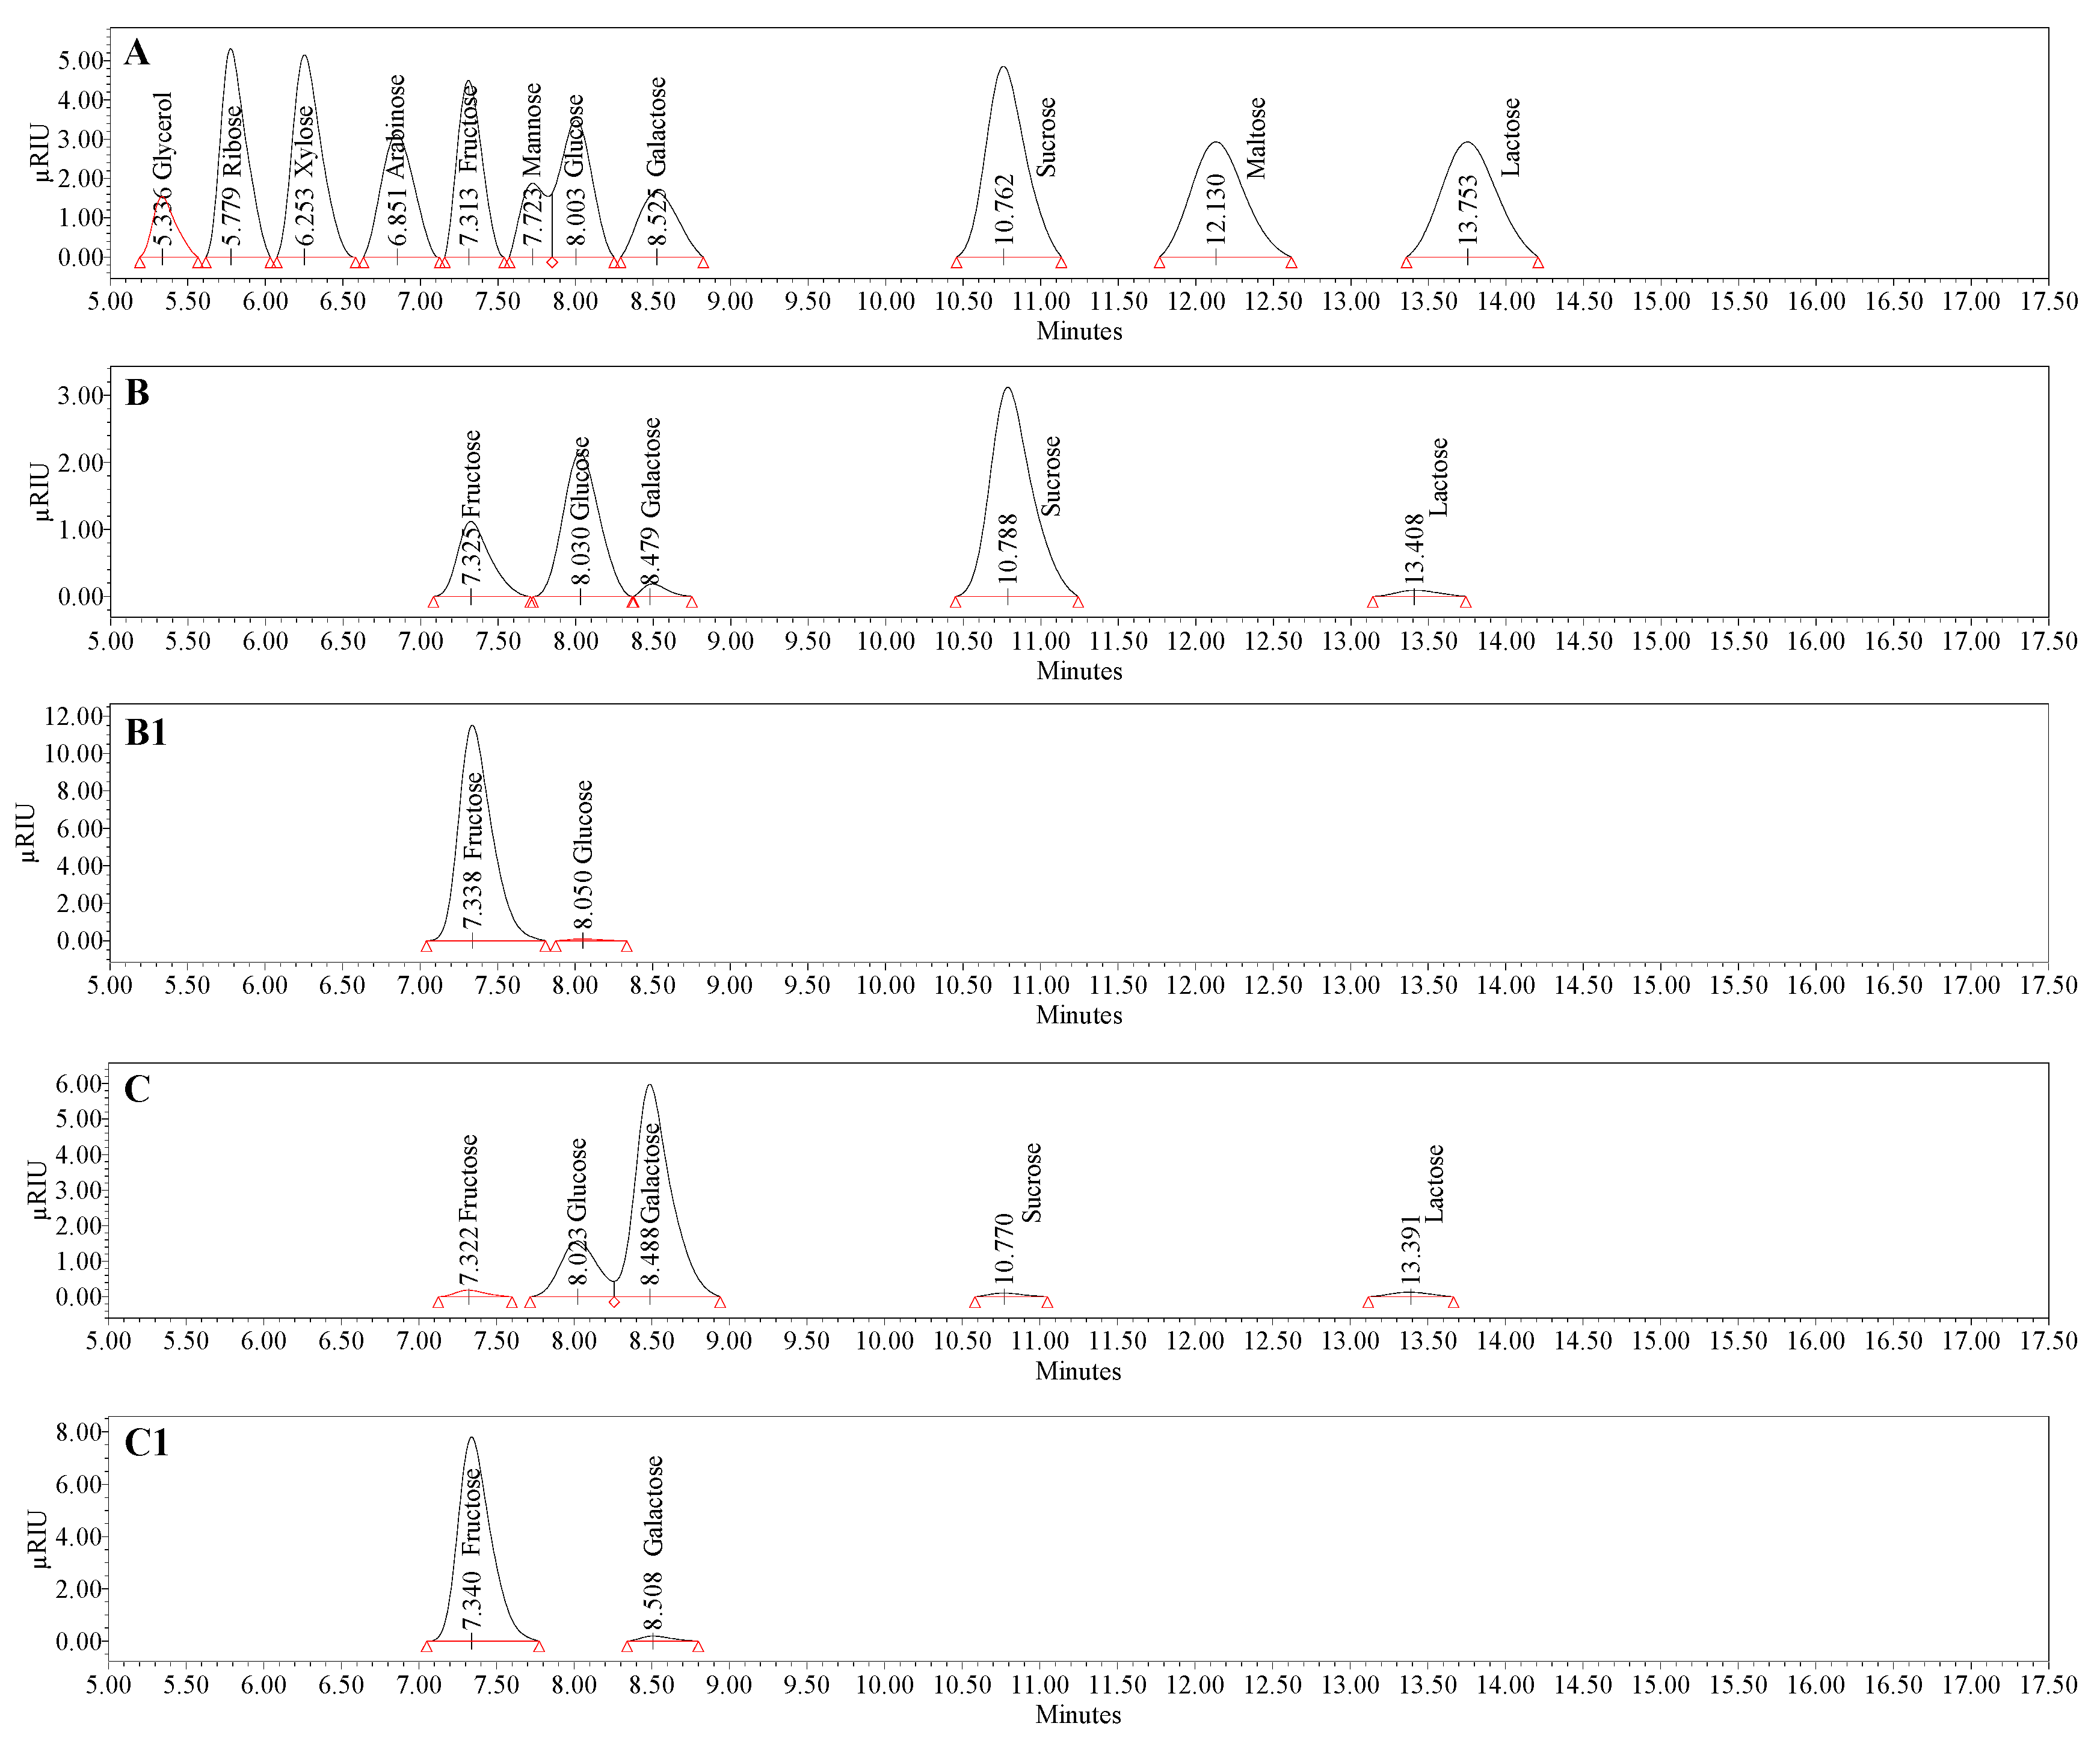
3.4. Compositional Analysis of Bacterial Levan Produced by Streptococcus salivarius K12 and Leuconostoc mesenteroides DSM 20343

According to the available literature, BL is a homopolysaccharide of fructose produced extracellularly by a variety of bacterial species [76]. The structure of BL is well characterized, indicating the presence of D-fructofuranosyl backbone residues linked by β-(2→6) glycosidic linkages at the C-1 position of the fructose ring [30,31]. Moreover, β-(2→6) linkages make up 70% of the total linkages, while the remaining 30% represent β-(2→1) branches [77]. Since the initial molecule in BL formation is sucrose, either internal or terminal glucose moiety can be aperient as a by-product of BL biosynthesis by levansucrase (EC 2.4.1.10), responsible for the catalysis of sucrose [78]. A detailed profile of individual carbohydrates of BL is depicted in Figure 6 and Table 4.
The presence of sucrose, glucose, fructose, galactose, and lactose as free carbohydrate representatives was confirmed chromatographically in both produced BLs. Sucrose and galactose were the main sugars found in the BL derived from S. salivarius K12 and L. mesenteroides DSM 20343, corresponding to 1.2 and 2.5 g 100 g−1, respectively. The presence of the above free/soluble sugars was conditioned by the composition of the nutrient medium used for growing bacteria. The observed values revealed that the principal component of produced BLs is fructose, the concentration of which varied in range from 56.9 to 92.0 g 100 g−1 and from 38.4 to 62.3 g 100 g−1 in S. salivarius K12 and L. mesenteroides DSM 20343, respectively. As seen, hydrolysis of BL with oxalic acid in both cases was found to be the most efficient, as 100 g of BL delivered roughly 92% and 62.3% of fructose, respectively. This observation can be supported by an early study by Murphy [79], indicating 100% fructose recovery after 9 h of BL hydrolysis with 0.1 M oxalic acid at 100 °C. A relatively lower but still relevant fructose yield was obtained by applying aqueous HCl solutions of various molarities. The highest yield of fructose was reached after 3 h of hydrolysis with 0.1 M HCl at 90 °C in the case of BL from S. salivarius K12. In comparison, a higher degree of hydrolysis for L. mesenteroides DSM 20343 was found after 6 h. It was observed that with increasing molarity of the HCl solution, there was a noticeable decrease in the fructose content, possibly due to fructose dehydration to hydroxymethylfurfural [80]. Moreover, the non-selectivity of HCl as a catalyst in cleavage of glycosidic linkages and weak fructose release from BL produced by Zymomonas mobilis was highlighted by Bekers et al. [81] and Kennedy et al. [82] as a high amount of fructooligosaccharides was observed in the final products. The same trend of increase as a function of HCl molarity was observed for acid-treated BL produced by S. salivarius K12. As seen, the highest glucose yield was reached after hydrolysis of BL with 0.5 M HCl for 6 h, corresponding to 5.8 g 100 g−1. Generally, the ratio of fructose to glucose in BL of S. salivarius K12 was found to be 94.8:4.3, which is reasonably close to the ratio reported by Matulová et al. [83] for BL produced by Bacillus sp. 3B6. It is worth noting that the composition of BL produced by L. mesenteroides along with fructose was represented by the relatively high amount of galactose rather than glucose. The exact mechanism of galactose formation remains unclear. However, the contribution of both α- and β-galactosidases of L. mesenteroides DSM 20343 in the hydrolysis of lactose, which originated from the nutrient medium, may have explained the abundancy of galactose, and only a trace level of lactose detected in the final hydrolysates of BL [84].

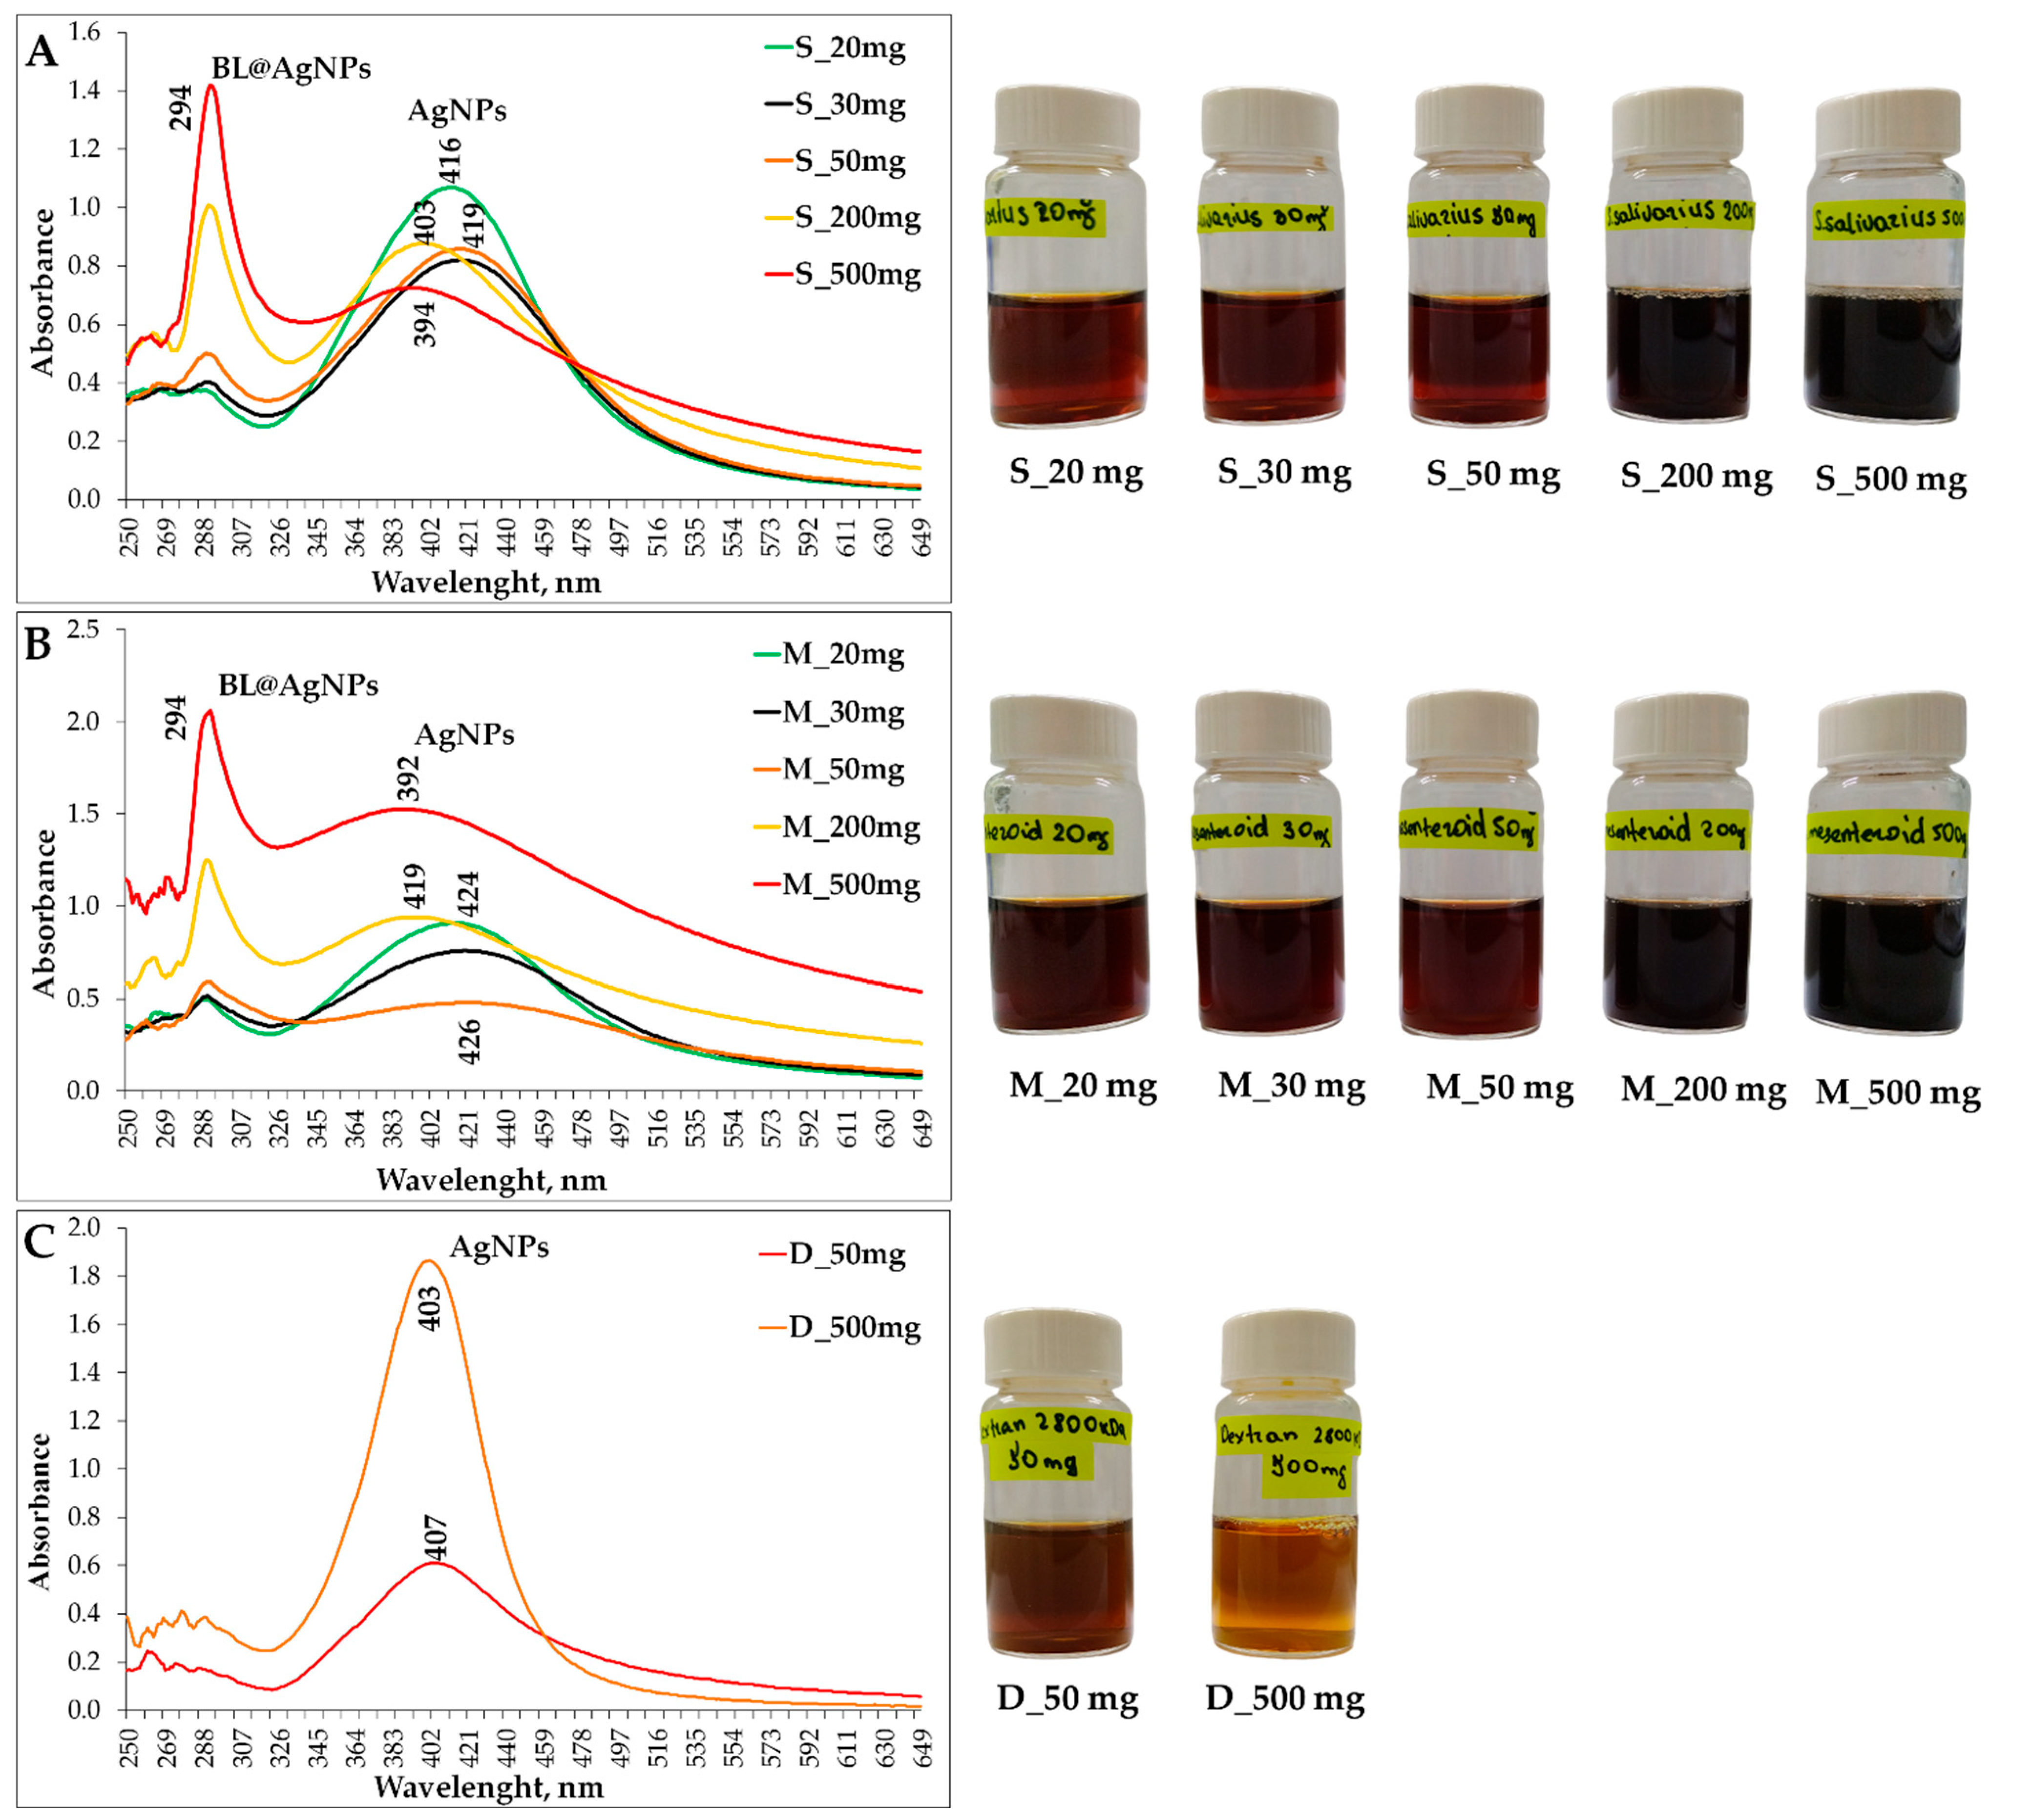
3.5. Spectrophotometric Analysis of Elaborated Colloid Systems Based on Bacterial Levan and Silver Nanoparticles by UV–Vis Spectroscopy

A preliminary experiment for confirming AgNP formation during green biosynthesis using BL as a reducing and capping agent at different concentrations was monitored by UV–Vis absorption spectra. Under alkaline circumstances, reached by adding 50.0 µL 1.0 M NaOH to the working solution, a gradual color change from light yellow to reddish brown and dark blue occurred during thermal exposure for 1 h, revealing the formation of BL@AgNPs (Figure 7). The absorption band near the red shift at 400 nm is surface plasmon resonance (SPR) of AgNPs, as reported by Kemala et al. [85]. The most intense peak appeared at 416 and 424 nm using 20 mg BL from S. salivarius K12 and L. mesenteroides DSM 20343, respectively (Figure 7A,B). However, as the concentration of BL increased, the formation of a band at 294 nm began to appear, which reached its maximum intensity when 500 mg BL was applied. The band at 294 may correspond to the absorption of a raw component, the BL itself, used in the biosynthesis of AgNPs [86]. It has been observed that with the increase in the band at 294 nm as a function of BL concentration, a substantial decrease of the main band at 400 nm became apparent. The observation can be attributed to the lower conversion of silver ions Ag+ to AgNPs due to the process termination caused by EPSs and a possible change in size/shape and/or concentration of BL@AgNPs in the medium after an increase in EPSs in the biosynthesis mixture [87]. A credible explanation for this multilayer adsorption was provided by Jeong et al. [88], attributing this phenomenon to the photoluminescence of photoexcited material when it starts to release its energy as light.
This statement allows for the speculation of the possible formation of a rigid, dense coating of the EPS molecules in the AgNP surface and the changing of Ag nanostructures from NPs to nanofilms due to the increasing thickness of Ag in the CoS. This is reinforced by an observation made by Rosa et al. [89] and also by Varghese et al. [90], highlighting the cross-linking of polyvinylpyrrolidone (PVP) nanofibers and high-molecular-weight compounds (proteins in particular) present in plant extracts and AgNPs, respectively, and the formation of a new resonance peak at 290 nm in the UV–Vis spectrum from the Ag shell after the Ag shell reached a certain thickness. However, in the case of commercial high-molecular-weight DEX, neither 50 mg nor 500 mg of raw material contributed to forming a band at 290 nm, indicating the presence of solely DEX-capped AgNPs in the developed CoS. Indeed, the most intense, sharp, and symmetric band appeared at 403 nm using 500 mg of DEX as a reducing and capping agent. This observation allows for the assumption of forming more uniform in shape and size AgNPs, as conveyed by [41,91].

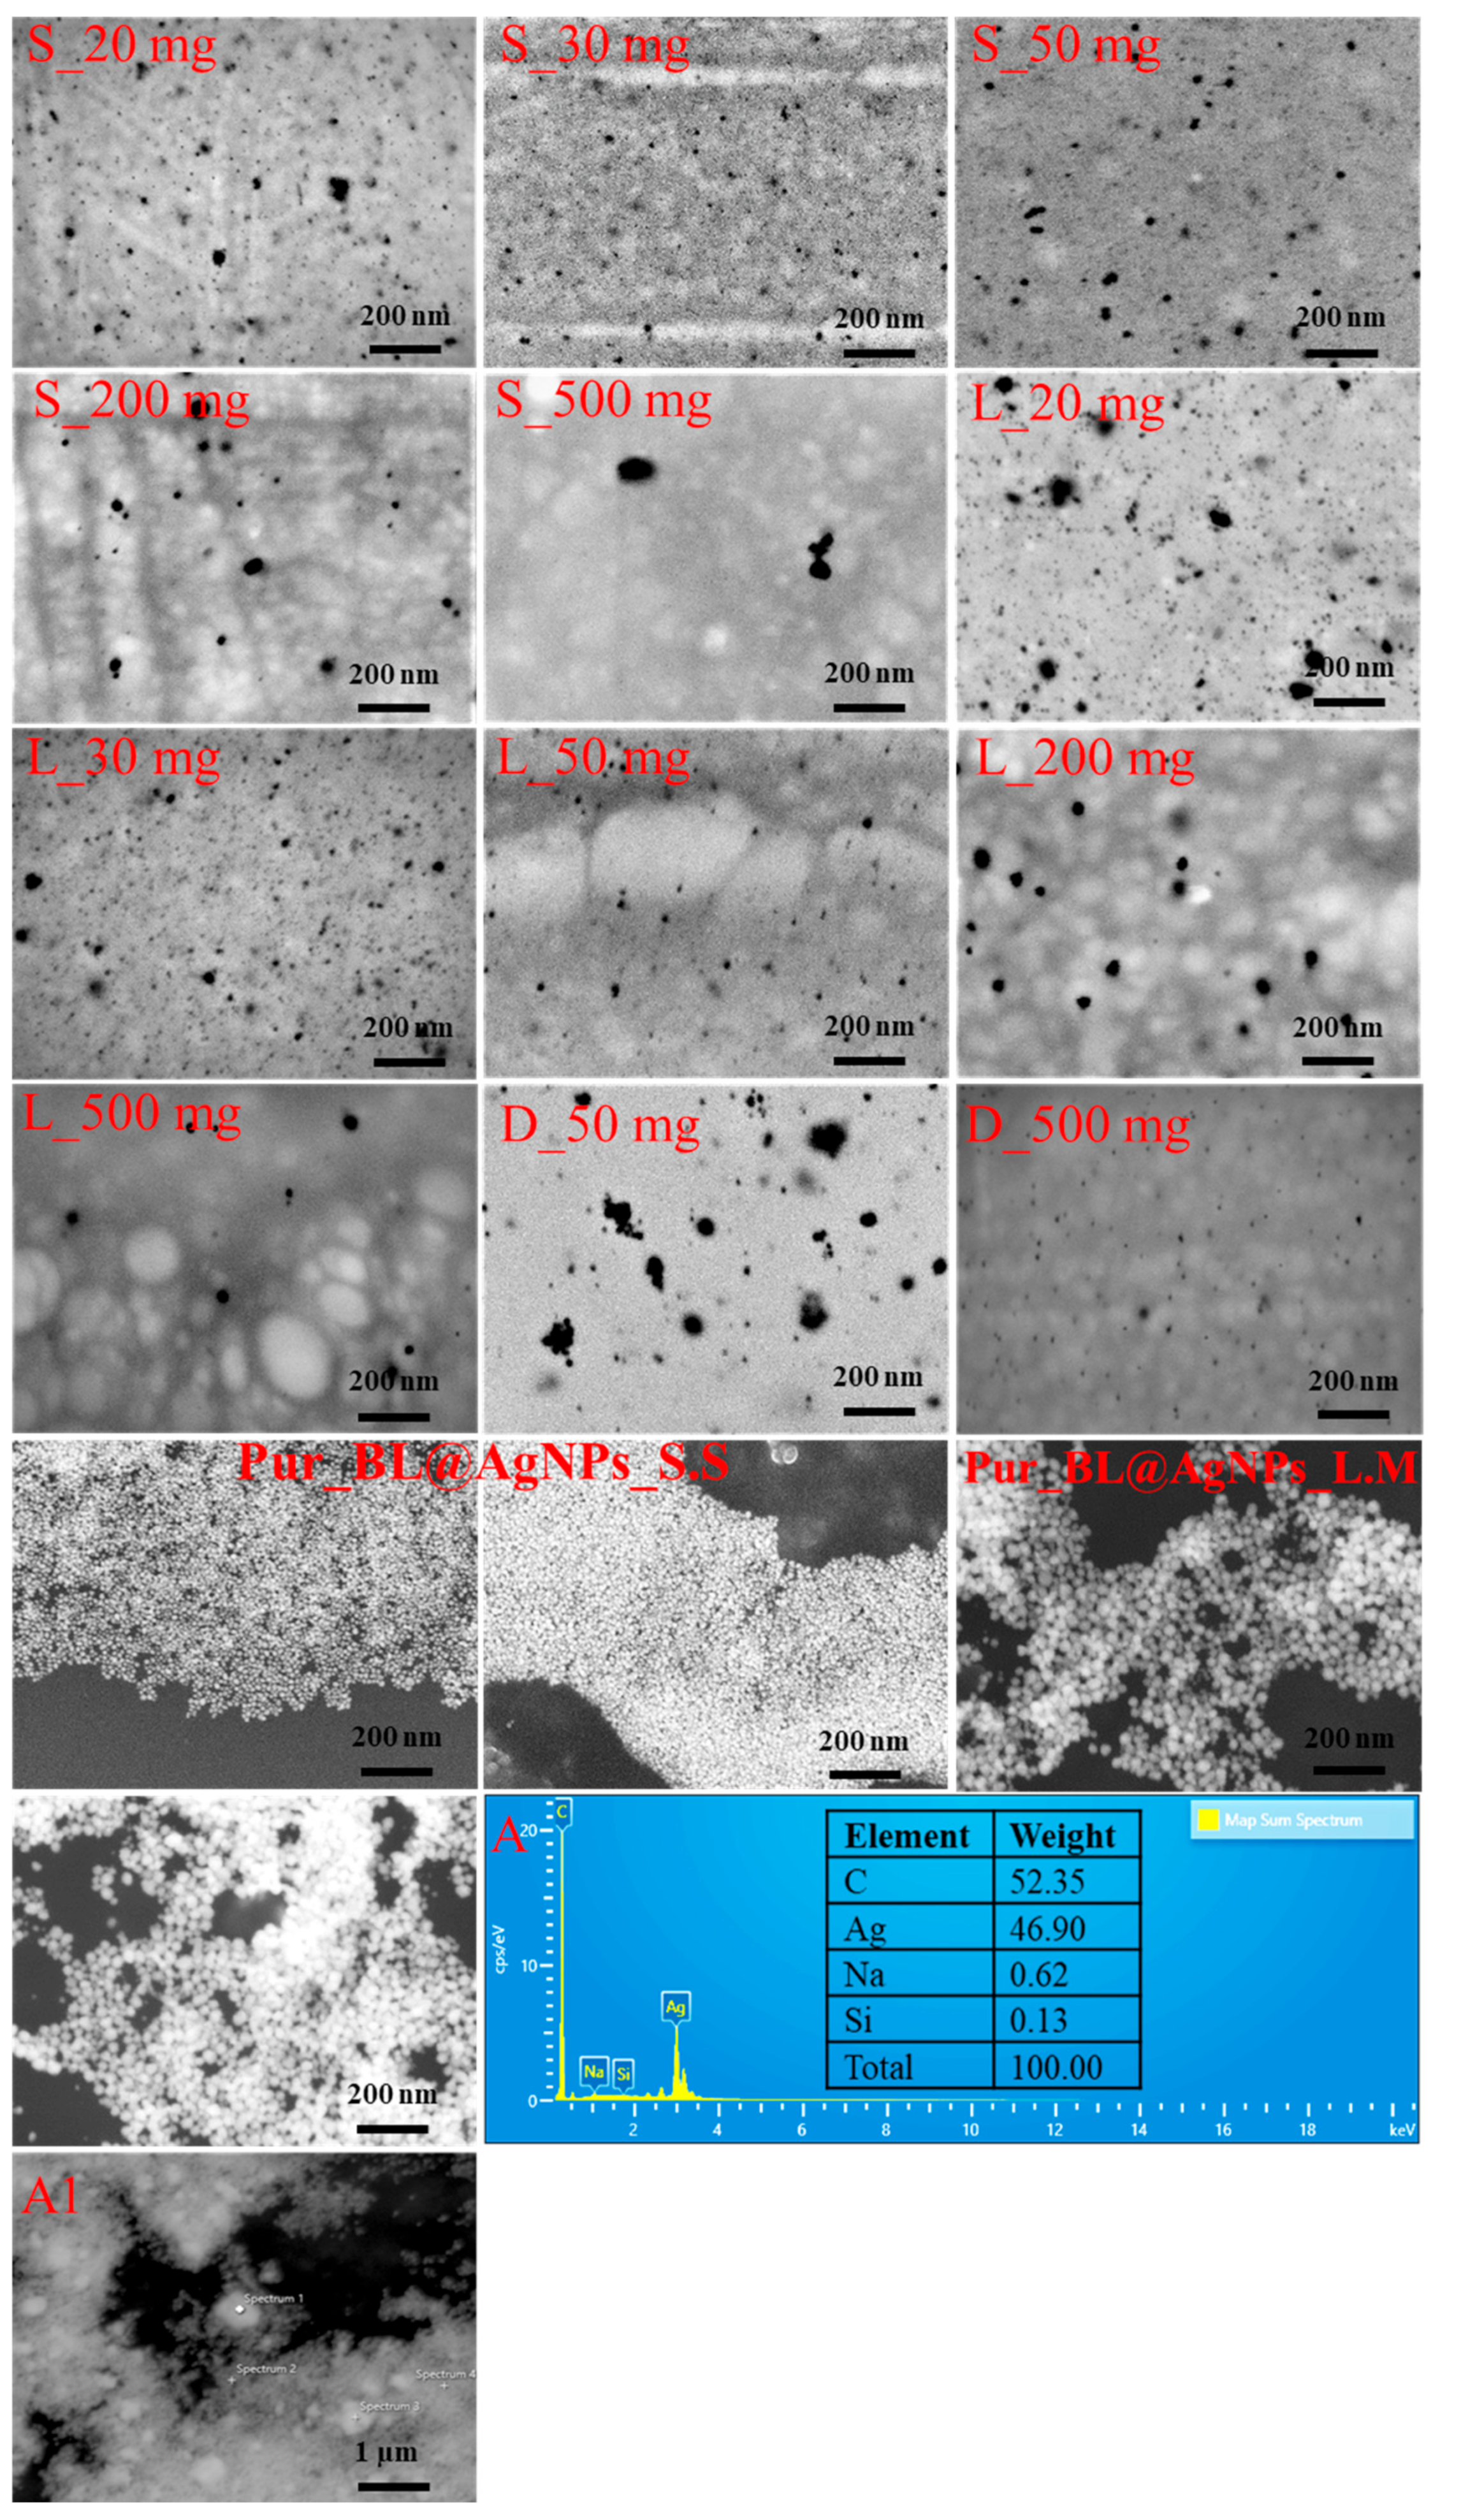
3.6. Structural Analysis of Bacterial Levan-Capped Silver Nanoparticles

The examination of biosynthesized BL@AgNP microstructures established NP formation, as shown in Figure 8. The micrographs revealed the availability mainly of monodispersed and uniformly distributed sphere-shaped BL@AgNPs in CoS engineered through the utilization of 20 (S_20 mg, L_20 mg) and 30 mg (S_30 mg, L_30 mg) of BL from S. salivarius K12 and L. mesenteroides DSM 20343, respectively. However, an insignificant part of agglomerating BL@AgNPs in these CoSs was observed due to the “depletion flocculation” phenomenon, as highlighted by Saravanan et al. [92], caused by the elevated concentration of PVP in the solution. According to measurements completed by SEM, the average sizes of the BL@AgNPs corresponded to 12.67 ± 5.56 and 12.58 ± 4.58 nm for NPs biosynthesized by 20 and 30 mg of BL from S. salivarius K12 and to 14.96 ± 10.25 and 15.16 ± 6.15 nm for NPs biosynthesized by 20 and 30 mg of BL from L. mesenteroides DSM 20343, respectively. As the BL concentration in the reaction mixture increased, a substantial increase in NP size was noted in the case of BL from S. salivarius K12, while it did not exceed 46.97 ± 20.23 nm, even though it had a broad distribution. As revealed by González-Garcinuño et al. [32], the size of BL-capped AgNPs was 36.9 ± 11.8 nm using 20 mg of BL as a reducing and stabilizing agent, and no apparent aggregation phenomenon was observed due to significant repulsive forces ensured by the negative surface charge of NPs. In the case of AgNPs produced using BL from L. mesenteroides DSM 20343, the size varied from 13.17 ± 2.76 to 28.11 ± 9.27 nm for 50 mg and 500 mg of a reducing and capping agent, respectively. The presence of additional free functional groups in the branched chains of amphiphilic BL from L. mesenteroides DSM 20343 due to glucose and galactose residues and better solubility in water due to lower molecular weight perhaps were the main factors that promoted the formation of smaller in size BL@AgNPs with a narrow distribution. Superior distribution and smaller in size AgNPs were biosynthesized by commercial DEX as a reducing and capping agent, which was conditioned by the presence of glucose as the main component of DEX and its readiness rather than fructose to act as a reducing agent after aldehyde group oxidation under alkaline conditions [93]. The average size of DEX@AgNPs corresponded to 24.31 ± 13.88 and 12.99 ± 3.84 nm using 50 and 500 mg of DEX, respectively. The biosynthesis of AgNPs from DEX required a more reducing agent to yield nano-object quantities comparable to 20 mg of S. salivarius K12 and L mesenteroides DSM 20343. Encouraging results were reported by Carré-Rangel et al. [91], highlighting the formation of spherical and more diminutively sized AgNPs using DEX of different molecular weights as a reducing and capping agent. The presence of AgNPs in the CoSs was confirmed by EDX analysis, displaying distinctive signal peaks within the 3.0–3.4 keV range due to SPR [94]. The EDX pattern at four randomly selected regions revealed the presence of Si (silicon) and Na (sodium) elements due to the Si wafer used as a substrate during SEM analysis and NaOH as an accelerator in the formation of AgNPs in the green biosynthesis, respectively (Figure 8A). The contribution of the above elements to the total weight was below 1% of the weight, indicating the relative purity of the obtained AgNPs. The presence of BL in the CoSs manifested in the form of an intense C (carbon) peak, which was found to be the second prevalent element observed along with Ag.

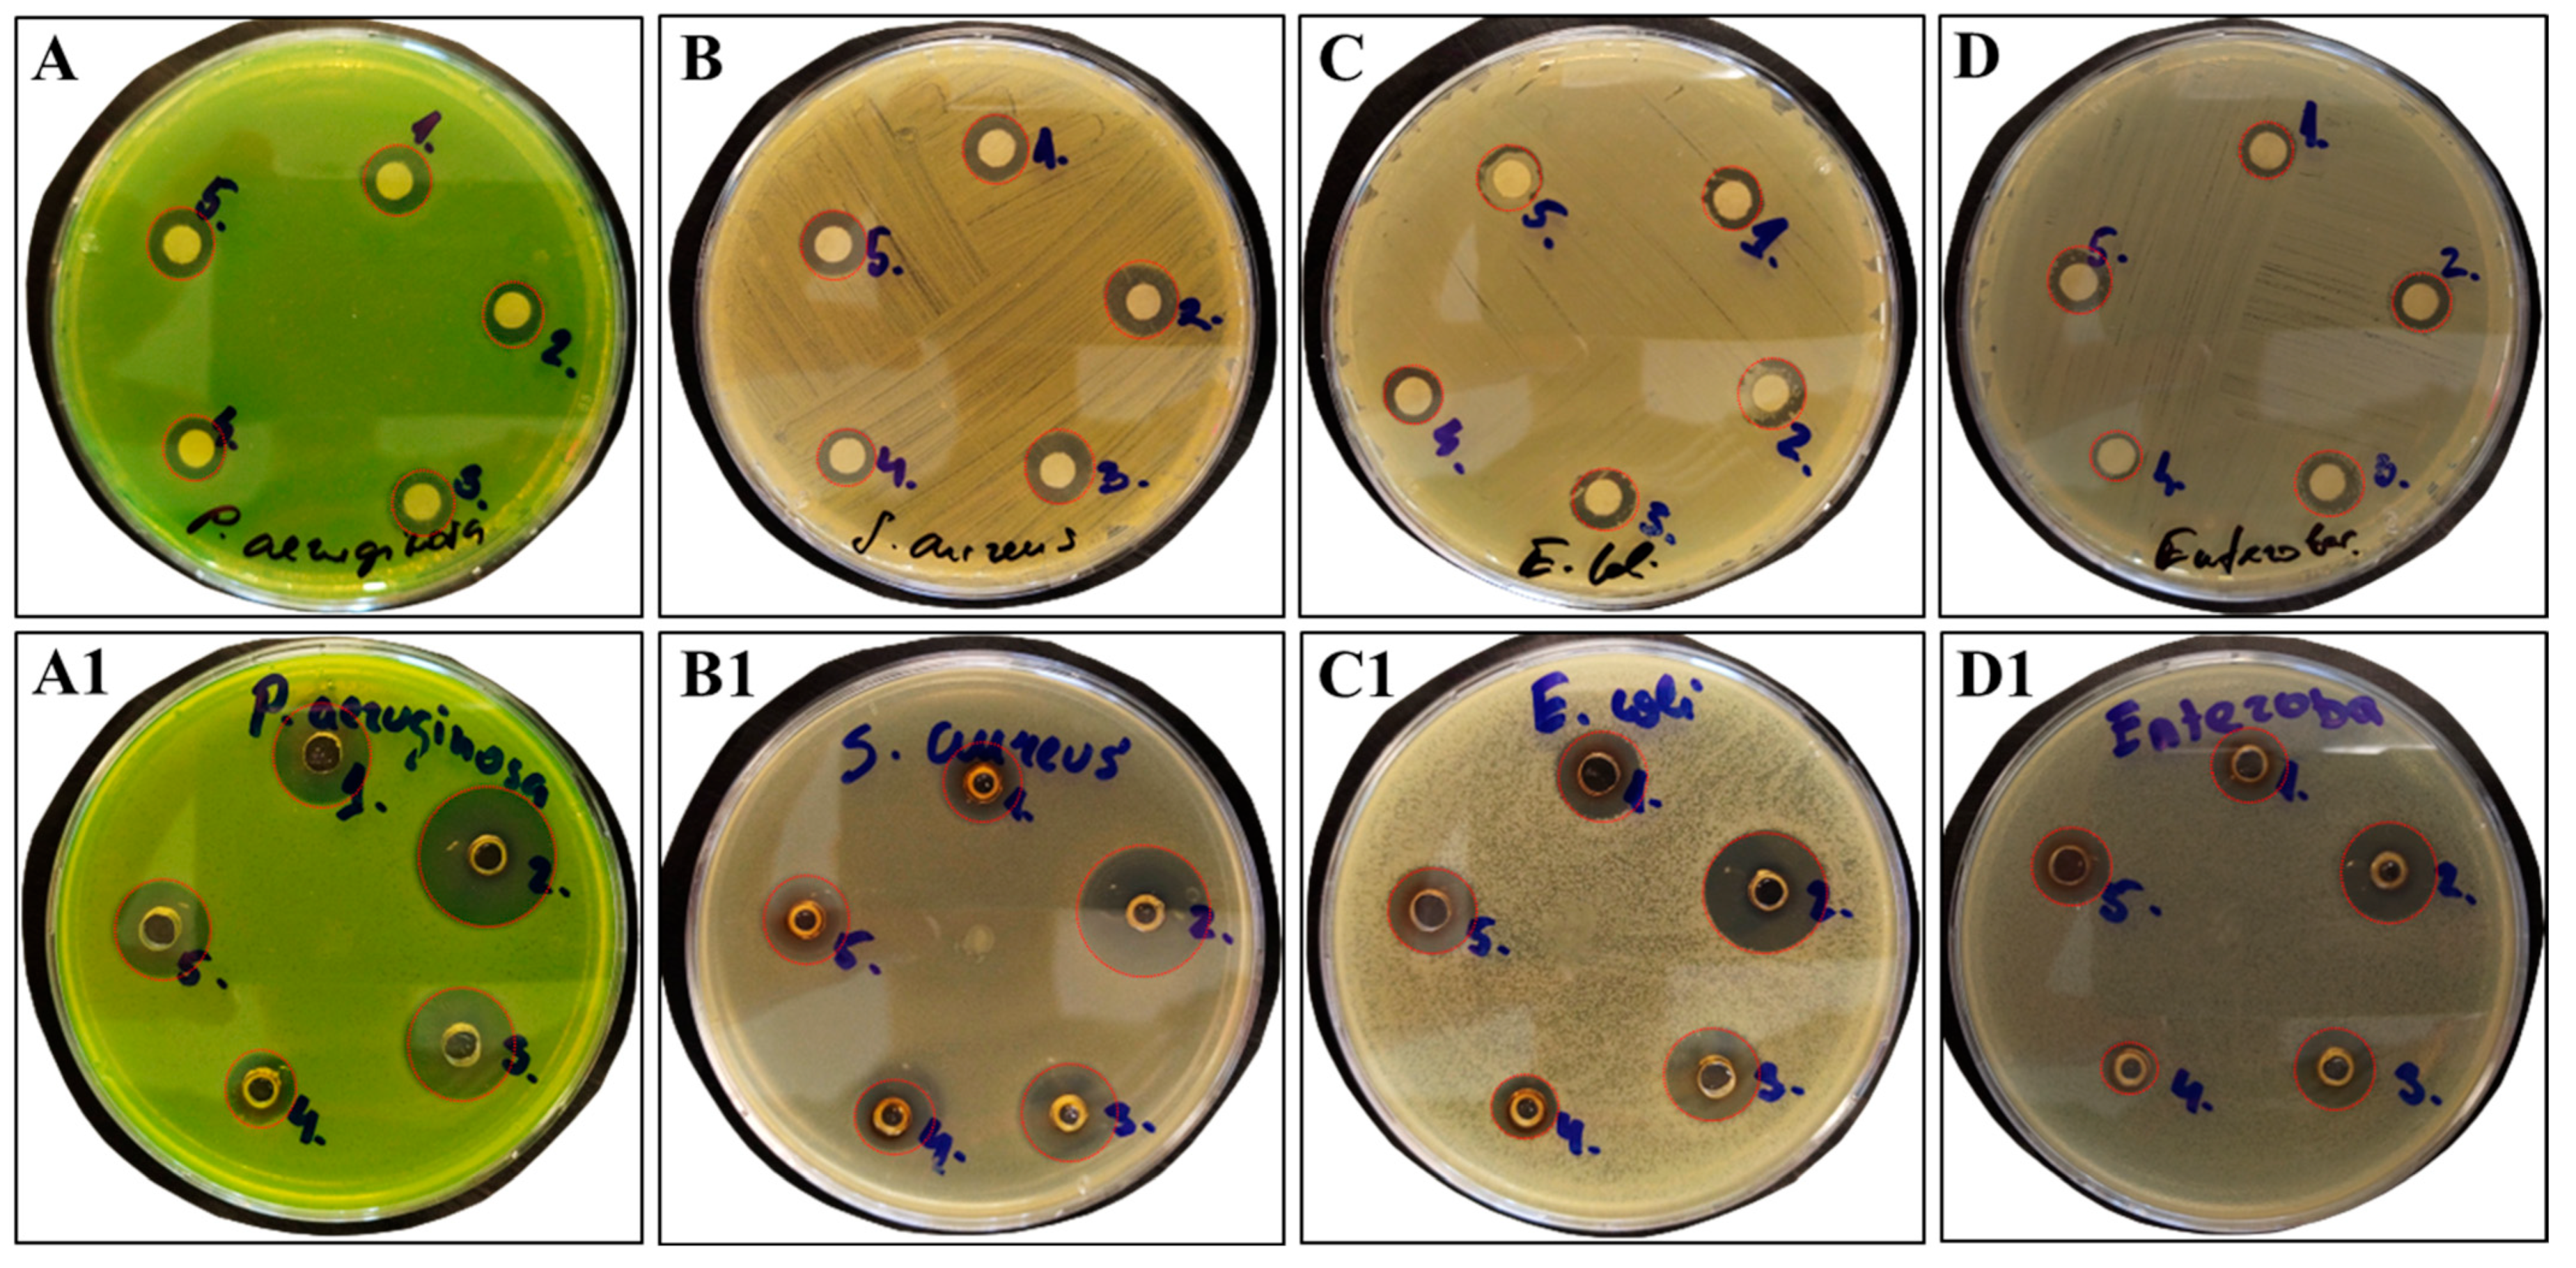
3.7. Antimicrobial Activity of Bacterial Levan and Colloid Systems Containing Silver Nanoparticles According to Diameter of Inhibition Zone Values

In the following experiments, the antimicrobial activity of obtained CoSs containing AgNPs was assessed using either disc or well diffusion approaches. The selection of two antimicrobial activity evaluation methods was based on evidence regarding the lack of direct interconnection of NPs deposited on the disc with bacteria distributed over the media. Due to the relatively lower diffusivity magnitude of NPs, the Kirby–Bauer method gave only a vague representation of the antimicrobial activity of AgNPs and no direct comparison with topical antibiotics could be made [39]. Therefore, for comparative purposes, antimicrobial activity probing was conducted by the direct contact of AgNPs with microorganisms, taking advantage of agar well diffusion approach. The disc and well diffusion test results show substantially different inhibition zones between the two antimicrobial probing methods (Figure 9 and Table 5). As seen, the most remarkable inhibition of selected bacteria was observed by the well diffusion test. The obtained results support the finding made by Bubonja-Šonje et al. [95], indicating that agar well diffusion is a more sensitive and convenient approach than that of disc diffusion, especially suitable for cationic compounds or their mixtures. The pronounced zone of inhibition was highlighted for the CoS containing AgNPs biosynthesized by 500 mg BL BLss@AgNPs 500, as the growth of the selected bacteria was inhibited the most. The most susceptible bacterium to elaborated CoS was found to be negatively charged P. aeruginosa ATCC 27853, followed by E. coli ATCC 25922; their zones of inhibition corresponded to 21.2 and 19.3 mm, respectively. It is worth noting that these observed inhibition zones are more extensive than those reported by [96,97,98]. However, based on the results from both diffusion tests, it turned out that the elaborated CoSs, regardless of the size of AgNPs they contained, were found to be less effective against clinical isolates with MDR, for P. aeruginosa in particular. The resistance of P. aeruginosa is conditioned by its ability to produce a biofilm that protects it from environmental threats, as reported by Maurice et al. [99]. The observed data are reinforced by El Din et al. [100], revealing a low susceptibility of the clinical MDR isolate P. aeruginosa to the AgNPs with calculated MIC and MBC values as high as 8.0 mg mL−1. The elaborated CoS with 500 mg of BL BLss@AgNPs 500 showed exceptional inhibitory activity against clinical isolates with MDR, i.e., S. epidermidis, E. coli, and E. faecium, corresponding to 16.2, 14.4, and 14.3 mm zones of inhibition, respectively. The observed values are consistent with those reported by Abeer et al. [101] for AgNP conjugates with such antibiotics as ciprofloxacin, cefotaxime, and cefazolin. It is worth noting that exactly the BL BLss@AgNPs 500 CoS with an average of 46.97 ± 20.23 nm NPs which showed the presence of a new resonance peak at 290 nm in the UV–Vis spectrum and hypothetically belongs to the conjugates of AgNPs and BL in the form of a rigid nanofilm, demonstrated antimicrobial activity the most. The elaborated matrix allowed for the extension of the release of Ag+ ions during the entire incubation period, thus extending the antimicrobial effect. The elaborated CoS with 50 mg of BL BLss@AgNPs 50 with a size of NPs 16.37 ± 3.91 nm ensured almost equal antimicrobial contribution to suppressing the growth of the selected reference bacteria and clinical isolate. As for the reference test cultures, the zone of inhibition varied from 12.4 to 17.4 mm, while for clinical isolates, from 11.3 to 15.1 mm. The most susceptible bacterium to BLss@AgNPs 50, as in the case of BLss@AgNPs 500, was P. aeruginosa ATCC 27853, followed by E. coli ATCC 25922 and the clinical isolate S. epidermidis. Considering this circumstance, the designed CoSs as nanocomposites with the sustained release of Ag+ ions and long-lasting bactericidal effects may find applicability in wound management. The proposed nanocomposite as a non-toxic and cost-effective API is of potential interest as an alternative to other antiseptics and topical antibiotics that can be incorporated into hydrogels and used locally [102].
The MIC and MBC values were estimated to complement the abovementioned tests (Table 6). The prominent antimicrobial activity of elaborated CoS-BL@AgNPs against selected reference test cultures was noticed for those mediated by either 20 or 50 mg of BL derived from S. salivarius K12 and Leuconostoc mesenteroides DSM 20343. The MIC values of CoS-BL@AgNPs introduced to the wells varied in a range from 2.6 to 20.8 µL mL−1, respectively. The most substantial contribution of CoSs to the inhibition of bacteria was noticed for AgNPs, with their size ranging from 12.58 to 16.37 nm, thus reinforcing the importance of NP size during direct interaction with cell membranes [103]. P. aeruginosa ATCC 27853 was the most susceptible to elaborated CoS. The values of MIC and MBC were found as follows: 2.6 and 5.2 µL mL−1 for BLss@AgNPs 20, respectively. At the same time, the other CoSs were found to be equally effective against this bacterial species. Outstanding antimicrobial activity of BLss@AgNPs 50 was highlighted against E. coli ATCC 25922, with MIC and MBC values corresponding to 2.6 µL mL−1 of elaborated CoS. However, it took 10.4 µL mL−1 of CoS-BL@AgNPs mediated by 20 mg BL to induce the death of this bacterial species. From the list of reference test cultures selected, S. aureus ATCC 6538P was found to be the most resistant bacterium as 20.8 µL mL−1 of elaborated CoSs needed to suppress the growth of this bacterium and 41.7 µL mL−1 to cause irreversible consequences that resulted in death. The observed MIC value is consistent with those reported by Ansar et al. [104] and Ashour et al. [105] for AgNPs mediated by Brassica oleracea- and Vaccinium macrocarpon-derived extracts, respectively. The relatively better resistance of S. aureus ATCC 6538P to CoSs is conditioned by its superior film-forming ability and antibiotic-resistant spontaneous generation of small-colony variants (SCVs) [106].
Similar to the reference test culture, the clinical isolate of P. aeruginosa exhibited relatively lower resistance to CoS, as only 5.2 µL mL−1 of elaborated CoSs was necessary to cause irreversible consequences resulting in death. The observed values required to inhibit the growth of MDR P. aeruginosa were found to be substantially lower than those reported by [107,108]. Interestingly, S. epidermidis, which is described as a biofilm-producing MDR [109], was found to be less resistant to elaborated CoS than that of the reference test culture, as only 20.8 µL mL−1 of elaborated CoS was found to be the lower concentration that led to the death of this bacterial species. It follows that timely treatment with elaborated CoS can prevent the development of biofilm-producing MDR pathogen, thereby contributing to the reduction of inflammatory processes. Swolana et al. [110] observed almost equal effectiveness of engineered AgNPs in suppressing S. epidermidis with biofilm-forming ability. The effectiveness of engineered CoS with a size of AgNPs ranging from 12.58 to 16.37 nm in relation to E. coli inhibition should be pointed out, as only 5.0 µL mL−1 was necessary for inhibition and complete death of this clinical isolate with MDR. The remarkable antimicrobial potency of commercially available AgNPs has been reported by Dove et. al. [111], revealing the ability of pure AgNPs in the amount of 3.1 µL mL−1 and AgNPs in conjunction with ribosome-targeting antibiotics such as aminoglycosides to cause defects in the electron transport chain of E. coli with the new resistance gene mcr-1. Overall, the elaborated CoS-BL@AgNPs can be treated as APIs suitable for designing new antimicrobial agents and modifying therapies in controlling multi-drug-resistant (MDR) pathogens.

4. Conclusions

Due to the narrow availability of evidence on the elaboration of CoS-AgNPs using the biotechnologically produced exopolysaccharide levan as a reducing agent, and given the need to develop antimicrobials with long-lasting effects against bacteria with multi-drug resistance and biocompatibility with the human body, this study demonstrated a potential utilization of bacterial levan produced by two species of lactic acid bacteria, i.e., Streptococcus salivarius K12 and Leuconostoc mesenteroides DSM 20343, as non-toxic reducing agents. The molecular fingerprinting performed by multi-detector size-exclusion chromatography revealed that the Mw of BL biosynthesized by S. salivarius K12 made up 15.435 × 10⁴ kDa, making it attainable to use as a capping agent and hydrogel-based wound dressing. In producing CoS-BL@AgNPs following green biosynthesis, the presence of nanostructured objects with size distributions from 12.67 ± 5.56 nm to 46.97 ± 20.23 nm was confirmed by SEM. Due to the cationic nature of the elaborated CoSs, two independent diffusion tests displayed substantially different inhibition zones. The well diffusion test underlined the most remarkable inhibition of reference test cultures and those of clinical origin. The foremost inhibitory potency of the designed CoSs was reinforced by minimum inhibitory and bactericidal concentrations, demonstrating its conceivable utilization as an active pharmaceutical ingredient for producing antimicrobials that could effectively contribute to controlling bacteria with multi-drug resistance.

Author Contributions

Conceptualization, V.R. and K.J.-R.; data curation, V.R., S.G., I.C. and K.J.-R.; formal analysis, V.R., A.V., D.G., D.J. and S.C.; investigation, V.R., A.V., D.G., S.C., D.J. and K.J.-R.; methodology, V.R., A.V., S.C. and D.J.; resources, V.R. and A.V.; software, V.R.; visualization, V.R. and D.J.; writing—original draft, V.R.; writing—review and editing, V.R. and K.J.-R. All authors have read and agreed to the published version of the manuscript.

Funding

The authors received no financial support for the research, authorship, and/or publication of this article.

Institutional Review Board Statement

Not applicable.

Informed Consent Statement

Not applicable.

Data Availability Statement

The datasets and analysis of this study are available from the corresponding author upon reasonable request.

Acknowledgments

The experiments were implemented as a continuation of the study initiated within the projects: 19–00-A01612-000004; 1.1.1.2/VIAA/1/16/201; Z-68.

Conflicts of Interest

Stefan Cairns was employed by the company Malvern Panalytical Ltd. The remaining authors declare that the research was conducted in the absence of any commercial or financial relationships that could be construed as a potential conflict of interest.

Abbreviations

Agargentum
AMRantimicrobial resistance
APIactive pharmaceutical ingredient
ATCCAmerican-type culture collection
ATFadenosine triphosphate
Auaurum
BLbacterial levan
BLQbelow limit of quantification
BSEback-scattered electron
CFUcolony-forming unit
CoScolloid system
CoS-BL@AgNPscolloid system containing silver nanoparticles mediated by bacterial levan
Ðdispersity
DeWdeionized water
DEXdextran
DEX@AgNPsdextran-mediated silver nanoparticles
dLdeciliter
DMFdimethylformamide
DMSOdimethyl sulfoxide
DWdry weight basis
ECEuropean Commission
ECMextracellular matrix
EDXenergy-dispersive X-ray spectroscopy
EPSexopolysaccharide
FT-IRFourier-transform infrared spectroscopy
GPCgel permeation chromatography
H–HWhard-to-heal wound
HPLChigh-performance liquid chromatography
IRinfrared radiation
IVintrinsic viscosity
kDakilodalton
LABlactic acid bacteria
LALSleft-angle light-scattering detector
LC–MSliquid chromatography–mass spectrometry
Mmole
MBCminimum bactericidal concentration
MDRmulti-drug resistance
MeCNacetonitrile
MeOHmethanol
MHAMueller–Hinton agar
MHBMueller–Hinton broth
MICminimum inhibitory concentration
mMmillimole
Mnnumber average molecular weight
MRSDe Man, Rogosa, and Sharpe
Mwweight average molecular weight
NPnanoparticle
NSAIDnonsteroidal anti-inflammatory drug
PCRpolymerase chain reaction
PDpolydispersity
PTFEpolytetrafluoroethylene
PVPpolyvinylpyrrolidone
RALSright-angle light-scattering detector
Rhhydrodynamic radius
RIDrefractive index detection
rpmrevolutions per minute
SEsecondary electron
SECsize-exclusion chromatography
SEMscanning electron microscope
spp.species
SPRsurface plasmon resonance
TCAtrichloroacetic acid
UV–Visultraviolet–visible spectroscopy

References

  1. Järbrink, K.; Ni, G.; Sönnergren, H.; Schmidtchen, A.; Pang, C.; Bajpai, R.; Car, J. The humanistic and economic burden of chronic wounds: A protocol for a systematic review. Syst. Rev. 2017, 6, 15. [Google Scholar] [CrossRef]
  2. Lindholm, C.; Searle, R. Wound management for the 21st century: Combining effectiveness and efficiency. Int. Wound J. 2016, 13, 5–15. [Google Scholar] [CrossRef]
  3. Frykberg, R.G.; Banks, J. Challenges in the Treatment of Chronic Wounds. Adv. Wound Care 2015, 4, 560–582. [Google Scholar] [CrossRef]
  4. Gāliņa, D.; Radenkovs, V.; Kviesis, J.; Valdovska, A. Effect of Essential Oils Supplemented with Caprylic Acid and Sodium Chloride against Faecal ESBL-Producing Escherichia coli Isolated from Pigs. Antibiotics 2022, 11, 461. [Google Scholar] [CrossRef]
  5. European Commission. European Commission Regulation (EU) 2019/6 of the European Parliament and of the Council of 11 December 2018 on veterinary medicinal products and repealing Directive 2001/82/EC. Off. J. Eur. Union 2019, L4, 43–167. [Google Scholar]
  6. Olofsson, T.C.; Butler, É.; Lindholm, C.; Nilson, B.; Michanek, P.; Vásquez, A. Fighting Off Wound Pathogens in Horses with Honeybee Lactic Acid Bacteria. Curr. Microbiol. 2016, 73, 463–473. [Google Scholar] [CrossRef]
  7. Verdú-Soriano, J.; de Cristino-Espinar, M.; Luna-Morales, S.; Dios-Guerra, C.; Caballero-Villarraso, J.; Moreno-Moreno, P.; Casado-Díaz, A.; Berenguer-Pérez, M.; Guler-Caamaño, I.; Laosa-Zafra, O.; et al. Superiority of a Novel Multifunctional Amorphous Hydrogel Containing Olea europaea Leaf Extract (EHO-85) for the Treatment of Skin Ulcers: A Randomized, Active-Controlled Clinical Trial. J. Clin. Med. 2022, 11, 1260. [Google Scholar] [CrossRef]
  8. O’Dwyer, L. Hard to heal wounds: Dealing with the problematic wound. Vet. Nurse 2015, 6, 316–329. [Google Scholar] [CrossRef]
  9. Wang, L.; Hu, C.; Shao, L. The antimicrobial activity of nanoparticles: Present situation and prospects for the future. Int. J. Nanomed. 2017, 12, 1227–1249. [Google Scholar] [CrossRef]
  10. Baetke, S.C.; Lammers, T.; Kiessling, F. Applications of nanoparticles for diagnosis and therapy of cancer. Br. J. Radiol. 2015, 88, 20150207. [Google Scholar] [CrossRef]
  11. Høiby, N.; Ciofu, O.; Johansen, H.K.; Song, Z.-J.; Moser, C.; Jensen, P.Ø.; Molin, S.; Givskov, M.; Tolker-Nielsen, T.; Bjarnsholt, T. The clinical impact of bacterial biofilms. Int. J. Oral Sci. 2011, 3, 55–65. [Google Scholar] [CrossRef]
  12. Gurung, J.; Khyriem, A.B.; Banik, A.; Lyngdoh, W.V.; Choudhury, B.; Bhattacharyya, P. Association of biofilm production with multidrug resistance among clinical isolates of Acinetobacter baumannii and Pseudomonas aeruginosa from intensive care unit. Indian J. Crit. Care Med. 2013, 17, 214–218. [Google Scholar] [CrossRef]
  13. Attinger, C.; Wolcott, R. Clinically Addressing Biofilm in Chronic Wounds. Adv. Wound Care 2012, 1, 127–132. [Google Scholar] [CrossRef]
  14. Adzitey, F.; Huda, N.; Ali, G.R.R. Molecular techniques for detecting and typing of bacteria, advantages and application to foodborne pathogens isolated from ducks. 3 Biotech 2013, 3, 97–107. [Google Scholar] [CrossRef]
  15. Roy, R.; Tiwari, M.; Donelli, G.; Tiwari, V. Strategies for combating bacterial biofilms: A focus on anti-biofilm agents and their mechanisms of action. Virulence 2018, 9, 522–554. [Google Scholar] [CrossRef]
  16. Lux, C.N. Wound healing in animals: A review of physiology and clinical evaluation. Vet. Dermatol. 2021, 33, 91-e27. [Google Scholar] [CrossRef]
  17. Gallaher, H.M.; Butler, J.R.; Wills, R.W.; Priddy, L.B.; Elder, S.H.; Heller, S.M.; Brinkman, E.; Baumgartner, W. Effects of short- and long-term administration of nonsteroidal anti-inflammatory drugs on osteotomy healing in dogs. Vet. Surg. 2019, 48, 1318–1329. [Google Scholar] [CrossRef]
  18. Barry, S. Non-steroidal anti-inflammatory drugs inhibit bone healing: A review. Vet. Comp. Orthop. Traumatol. 2010, 23, 385–392. [Google Scholar] [CrossRef]
  19. Simova, V.; Voslarova, E.; Vecerek, V.; Passantino, A.; Bedanova, I. Effects of travel distance and season of the year on transport-related mortality in cattle. Anim. Sci. J. 2017, 88, 526–532. [Google Scholar] [CrossRef]
  20. Ghosh, S.; Lahiri, D.; Nag, M.; Dey, A.; Sarkar, T.; Pathak, S.K.; Edinur, H.A.; Pati, S.; Ray, R.R. Bacterial Biopolymer: Its Role in Pathogenesis to Effective Biomaterials. Polymers 2021, 13, 1242. [Google Scholar] [CrossRef]
  21. Abdalla, A.K.; Ayyash, M.M.; Olaimat, A.N.; Osaili, T.M.; Al-Nabulsi, A.A.; Shah, N.P.; Holley, R. Exopolysaccharides as Antimicrobial Agents: Mechanism and Spectrum of Activity. Front. Microbiol. 2021, 12, 664395. [Google Scholar] [CrossRef] [PubMed]
  22. Baranwal, J.; Barse, B.; Fais, A.; Delogu, G.L.; Kumar, A. Biopolymer: A Sustainable Material for Food and Medical Applications. Polymers 2022, 14, 983. [Google Scholar] [CrossRef] [PubMed]
  23. Goy, R.C.; De Britto, D.; Assis, O.B.G. A review of the antimicrobial activity of chitosan. Polímeros 2009, 19, 241–247. [Google Scholar] [CrossRef]
  24. Aullybux, A.A.; Puchooa, D.; Bahorun, T.; Jeewon, R. Correction to: Phylogenetics and antibacterial properties of exopolysaccharides from marine bacteria isolated from Mauritius seawater. Ann. Microbiol. 2019, 69, 973–974. [Google Scholar] [CrossRef]
  25. Lahiri, D.; Nag, M.; Dutta, B.; Dey, A.; Sarkar, T.; Pati, S.; Edinur, H.A.; Kari, Z.A.; Noor, N.H.M.; Ray, R.R. Bacterial Cellulose: Production, Characterization, and Application as Antimicrobial Agent. Int. J. Mol. Sci. 2021, 22, 12984. [Google Scholar] [CrossRef]
  26. Augimeri, R.V.; Varley, A.J.; Strap, J.L. Establishing a Role for Bacterial Cellulose in Environmental Interactions: Lessons Learned from Diverse Biofilm-Producing Proteobacteria. Front. Microbiol. 2015, 6, 1282. [Google Scholar] [CrossRef]
  27. Zainulabdeen, S.M.S.; Abdul, J.; Salmanand, S.; Khalaf, K. Purification and characterization of levan from Lactobacillus gasseri and its effect against Pseudomonas aeruginosa. Nat. Volatiles Essent. Oils 2021, 8, 5788–5808. [Google Scholar]
  28. Hamada, M.A.; Hassan, R.A.; Abdou, A.M.; Elsaba, Y.M.; Aloufi, A.S.; Sonbol, H.; Korany, S.M. Bio_fabricated levan polymer from Bacillus subtilis healing properties. Appl. Sci. 2022, 12, 6413. [Google Scholar] [CrossRef]
  29. Gokmen, G.G.; Silbir, S.; Goksungur, Y.; Kisla, D. The effect of microbial levan on the growth of microorganisms: Inhibitory or stimulatory? Fresenius Environ. Bull. 2020, 29, 1648–1654. [Google Scholar]
  30. Semjonovs, P.; Shakirova, L.; Treimane, R.; Shvirksts, K.; Auzina, L.; Cleenwerck, I.; Zikmanis, P. Production of extracellular fructans by Gluconobacter nephelii P1464. Lett. Appl. Microbiol. 2016, 62, 145–152. [Google Scholar] [CrossRef]
  31. Sima, F.; Mutlu, E.C.; Eroglu, M.S.; Sima, L.E.; Serban, N.; Ristoscu, C.; Petrescu, S.M.; Oner, E.T.; Mihailescu, I.N. Levan Nanostructured Thin Films by MAPLE Assembling. Biomacromolecules 2011, 12, 2251–2256. [Google Scholar] [CrossRef]
  32. González-Garcinuño, Á.; Masa, R.; Hernández, M.; Domínguez, Á.; Tabernero, A.; del Valle, E.M. Levan-Capped Silver Nanoparticles for Bactericidal Formulations: Release and Activity Modelling. Int. J. Mol. Sci. 2019, 20, 1502. [Google Scholar] [CrossRef] [PubMed]
  33. Khan, S.A.; Shahid, S.; Lee, C.-S. Green Synthesis of Gold and Silver Nanoparticles Using Leaf Extract of Clerodendrum inerme; Characterization, Antimicrobial, and Antioxidant Activities. Biomolecules 2020, 10, 835. [Google Scholar] [CrossRef] [PubMed]
  34. Ahmed, K.B.A.; Kalla, D.; Uppuluri, K.B.; Anbazhagan, V. Green synthesis of silver and gold nanoparticles employing levan, a biopolymer from Acetobacter xylinum NCIM 2526, as a reducing agent and capping agent. Carbohydr. Polym. 2014, 112, 539–545. [Google Scholar] [CrossRef] [PubMed]
  35. Choi, W.I.; Hwang, Y.; Sahu, A.; Min, K.; Sung, D.; Tae, G.; Chang, J.H. An injectable and physical levan-based hydrogel as a dermal filler for soft tissue augmentation. Biomater. Sci. 2018, 6, 2627–2638. [Google Scholar] [CrossRef] [PubMed]
  36. Byun, B.Y.; Lee, S.J.; Mah, J.H. Antipathogenic activity and preservative effect of levan (β-2,6-fructan), a multifunctional polysaccharide. Int. J. Food Sci. Technol. 2014, 49, 238–245. [Google Scholar] [CrossRef]
  37. Zheng, L.; Li, S.; Luo, J.; Wang, X. Latest Advances on Bacterial Cellulose-Based Antibacterial Materials as Wound Dressings. Front. Bioeng. Biotechnol. 2020, 8, 593768. [Google Scholar] [CrossRef] [PubMed]
  38. Ansari, M.A.; Albetran, H.M.; Alheshibri, M.H.; Timoumi, A.; Algarou, N.A.; Akhtar, S.; Slimani, Y.; Almessiere, M.A.; Alahmari, F.S.; Baykal, A.; et al. Synthesis of Electrospun TiO2 Nanofibers and Characterization of Their Antibacterial and Antibiofilm Potential against Gram-Positive and Gram-Negative Bacteria. Antibiotics 2020, 9, 572. [Google Scholar] [CrossRef] [PubMed]
  39. Radenkovs, V.; Juhnevica-Radenkova, K.; Jakovlevs, D.; Zikmanis, P.; Galina, D.; Valdovska, A. The Release of Non-Extractable Ferulic Acid from Cereal By-Products by Enzyme-Assisted Hydrolysis for Possible Utilization in Green Synthesis of Silver Nanoparticles. Nanomaterials 2022, 12, 3053. [Google Scholar] [CrossRef]
  40. Speck, J.C. The Lobry De Bruyn-Alberda Van Ekenstein Transformation. In Advances in Carbohydrate Chemistry; Wolfrom, M.L., Tipson, R.S., Eds.; Academic Press: Cambridge, MA, USA, 1958; Volume 13, pp. 63–103. [Google Scholar]
  41. Yang, G.; Lin, Q.; Wang, C.; Li, J.; Wang, J.; Zhou, J.; Wang, Y.; Wang, C. Synthesis and characterization of dextran-capped silver nanoparticles with enhanced antibacterial activity. J. Nanosci. Nanotechnol. 2012, 12, 3766–3774. [Google Scholar] [CrossRef]
  42. Radenkovs, V.; Juhnevica-Radenkova, K.; Kviesis, J.; Lazdina, D.; Valdovska, A.; Vallejo, F.; Lacis, G. Lignocellulose-Degrading Enzymes: A Biotechnology Platform for Ferulic Acid Production from Agro-Industrial Side Streams. Foods 2021, 10, 3056. [Google Scholar] [CrossRef]
  43. Kourmouli, A.; Valenti, M.; van Rijn, E.; Beaumont, H.J.E.; Kalantzi, O.-I.; Schmidt-Ott, A.; Biskos, G. Can disc diffusion susceptibility tests assess the antimicrobial activity of engineered nanoparticles? J. Nanopart. Res. 2018, 20, 62. [Google Scholar] [CrossRef]
  44. Jathore, N.R.; Bule, M.V.; Tilay, A.V.; Annapure, U.S. Microbial levan from Pseudomonas fluorescens: Characterization and medium optimization for enhanced production. Food Sci. Biotechnol. 2012, 21, 1045–1053. [Google Scholar] [CrossRef]
  45. Ibrahim, M.; Alaam, M.; El-Haes, H.; Jalbout, A.F.; de Leon, A. Analysis of the structure and vibrational spectra of glucose and fructose. Eclet. Quim. 2006, 31, 15–21. [Google Scholar] [CrossRef]
  46. Glišić, S.; Nikolić, G.; Cakić, M.; Trutić, N. Spectroscopic study of copper(II) complexes with carboxymethyl dextran and dextran sulfate. Russ. J. Phys. Chem. A 2015, 89, 1254–1262. [Google Scholar] [CrossRef]
  47. Lu, R.; Gan, W.; Wu, B.-H.; Zhang, Z.; Guo, Y.; Wang, H.-F. C−H Stretching Vibrations of Methyl, Methylene and Methine Groups at the Vapor/Alcohol (n = 1−8) Interfaces. J. Phys. Chem. B 2005, 109, 14118–14129. [Google Scholar] [CrossRef] [PubMed]
  48. Al-Qaysi, S.A.S.; Al-Haideri, H.; Al-Shimmary, S.M.; Abdulhameed, J.M.; Alajrawy, O.I.; Al-Halbosiy, M.M.; Moussa, T.A.A.; Farahat, M.G. Bioactive Levan-Type Exopolysaccharide Produced by Pantoea agglomerans ZMR7: Characterization and Optimization for Enhanced Production. J. Microbiol. Biotechnol. 2021, 31, 696–704. [Google Scholar] [CrossRef] [PubMed]
  49. Herrera, A.; Rodríguez, H.; Torres-Lugo, M.; Rinaldi, C. Functionalization of magnetite (Fe 3O 4) nanoparticles for cancer treatment. In Proceedings of the 2006 NSTI Nanotechnology Conference Trade Show—NSTI Nanotech 2006 Technical Proceedings, Boston, MA, USA, 7–11 May 2006; Volume 2, pp. 75–78. [Google Scholar]
  50. Nikolić, G.S.; Cakić, M.D.; Glišić, S.; Cvetković, D.J.; Mitić, Ž.J.; Marković, D.Z. Study of green nanoparticles and biocom-plexes based on exopolysaccharide by modern Fourier transform spectroscopy. In Fourier Transforms—High-Tech Application and Current Trends; Nikolić, G., Cvetković, D., Cakić, M., Eds.; IntechOpen Limited: London, UK, 2017; pp. 149–174. ISBN 978-953-51-2894-6. [Google Scholar]
  51. Mummaleti, G.; Sarma, C.; Kalakandan, S.; Sivanandham, V.; Rawson, A.; Anandharaj, A. Optimization and extraction of edible microbial polysaccharide from fresh coconut inflorescence sap: An alternative substrate. LWT 2021, 138, 110619. [Google Scholar] [CrossRef]
  52. Nastase, R.; Tatibouët, J.-M.; Fourré, E. Depolymerization of inulin in the highly reactive gas phase of a non thermal plasma at atmospheric pressure. Plasma Process. Polym. 2018, 15, 1800067. [Google Scholar] [CrossRef]
  53. Mamay; Wahyuningrum, D.; Hertadi, R. Isolation and Characterization of Levan from Moderate Halophilic Bacteria Bacillus licheniformis BK AG21. Procedia Chem. 2015, 16, 292–298. [Google Scholar] [CrossRef]
  54. Zhang, L.; Yi, H. Potential antitumor and anti-inflammatory activities of an extracellular polymeric substance (EPS) from Bacillus subtilis isolated from a housefly. Sci. Rep. 2022, 12, 1383. [Google Scholar] [CrossRef] [PubMed]
  55. Ramezani, M.; Amoozegar, M.A.; Ventosa, A. Screening and comparative assay of poly-hydroxyalkanoates produced by bacteria isolated from the Gavkhooni Wetland in Iran and evaluation of poly-β-hydroxybutyrate production by halotolerant bacterium Oceanimonas sp. GK1. Ann. Microbiol. 2015, 65, 517–526. [Google Scholar] [CrossRef]
  56. Liu, C.; Lu, J.; Lu, L.; Liu, Y.; Wang, F.; Xiao, M. Isolation, structural characterization and immunological activity of an exopolysaccharide produced by Bacillus licheniformis 8-37-0-1. Bioresour. Technol. 2010, 101, 5528–5533. [Google Scholar] [CrossRef] [PubMed]
  57. Hertadi, R.; Amari, M.M.S.; Ratnaningsih, E. Enhancement of antioxidant activity of levan through the formation of nanoparticle systems with metal ions. Heliyon 2020, 6, e04111. [Google Scholar] [CrossRef] [PubMed]
  58. Thakham, N.; Thaweesak, S.; Teerakulkittipong, N.; Traiosot, N.; Kaikaew, A.; Lirio, G.A.; Jangiam, W. Structural Characterization of Functional Ingredient Levan Synthesized by Bacillus siamensis Isolated from Traditional Fermented Food in Thailand. Int. J. Food Sci. 2020, 2020, 7352484. [Google Scholar] [CrossRef]
  59. Permatasari, N.U.; Ratnaningsih, E.; Hertadi, R. The Use of Response Surface Method in Optimization of Levan Production by Heterologous Expressed Levansucrase from Halophilic Bacteria Bacillus licheniformis BK2. IOP Conf. Ser. Earth Environ. Sci. 2018, 209, 012015. [Google Scholar] [CrossRef]
  60. Qin, Q.Q.; Xia, B.S.; Xiong, Y.; Zhang, S.X.; Luo, Y.B.; Hao, Y.L. Structural Characterization of the Exopolysaccharide Produced by Streptococcus thermophilus 05-34 and Its In Situ Application in Yogurt. J. Food Sci. 2011, 76, C1226–C1230. [Google Scholar] [CrossRef]
  61. Omar, M.M.; Awda, J.M. Production of levansucrase from local isolate Bacillus lichniformans MJ8 and enzymic synthesis and characterization of levan. Appl. Microbiol. Open Access 2022, 8, 1–9. [Google Scholar]
  62. Demirci, T.; Hasköylü, M.E.; Eroğlu, M.S.; Hemberger, J.; Öner, E.T. Levan-based hydrogels for controlled release of Amphotericin B for dermal local antifungal therapy of Candidiasis. Eur. J. Pharm. Sci. 2020, 145, 105255. [Google Scholar] [CrossRef]
  63. de Siqueira, E.C.; Rebouças, J.d.S.; Pinheiro, I.O.; Formiga, F.R. Levan-based nanostructured systems: An overview. Int. J. Pharm. 2020, 580, 119242. [Google Scholar] [CrossRef]
  64. Shimizu, N.; Abea, A.; Ushiyama, T.; Öner, E.T. Effect of temperature on the hydrolysis of levan treated with compressed hot water fluids. Food Sci. Nutr. 2020, 8, 2004–2014. [Google Scholar] [CrossRef]
  65. Pei, F.; Ma, Y.; Chen, X.; Liu, H. Purification and structural characterization and antioxidant activity of levan from Bacillus megaterium PFY-147. Int. J. Biol. Macromol. 2020, 161, 1181–1188. [Google Scholar] [CrossRef]
  66. Xu, W.; Liu, Q.; Bai, Y.; Yu, S.; Zhang, T.; Jiang, B.; Mu, W. Physicochemical properties of a high molecular weight levan from Brenneria sp. EniD312. Int. J. Biol. Macromol. 2018, 109, 810–818. [Google Scholar] [CrossRef]
  67. Chu, B. Laser Light Scattering Basic Principles and Practice, 2nd ed.; Academic Press: Cambridge, MA, USA, 1991; ISBN 9780323161886. [Google Scholar]
  68. Santos-Moriano, P.; Fernandez-Arrojo, L.; Poveda, A.; Jimenez-Barbero, J.; Ballesteros, A.O.; Plou, F.J. Levan versus fructooligosaccharide synthesis using the levansucrase from Zymomonas mobilis: Effect of reaction conditions. J. Mol. Catal. B Enzym. 2015, 119, 18–25. [Google Scholar] [CrossRef]
  69. Hou, Y.; Huang, F.; Yang, H.; Cong, H.; Zhang, X.; Xie, X.; Yang, H.; Tong, Q.; Luo, N.; Zhu, P.; et al. Factors affecting the production and molecular weight of levan in enzymatic synthesis by recombinant Bacillus subtilis levansucrase SacB-T305A. Polym. Int. 2021, 70, 185–192. [Google Scholar] [CrossRef]
  70. Newbrun, E.; Baker, S. Physico-chemical characteristics of the levan produced by Streptococcus salivarius. Carbohydr. Res. 1968, 6, 165–170. [Google Scholar] [CrossRef]
  71. Osman, A.; Lin, E.; Hwang, D.S. A sticky carbohydrate meets a mussel adhesive: Catechol-conjugated levan for hemostatic and wound healing applications. Carbohydr. Polym. 2023, 299, 120172. [Google Scholar] [CrossRef]
  72. Ua-Arak, T.; Jakob, F.; Vogel, R.F. Fermentation pH Modulates the Size Distributions and Functional Properties of Gluconobacter albidus TMW 2.1191 Levan. Front. Microbiol. 2017, 8, 807. [Google Scholar] [CrossRef]
  73. Zhang, H.; Ren, W.; Guo, Q.; Xiong, Z.; Wang, G.; Xia, Y.; Lai, P.; Yin, B.; Ai, L. Characterization of a yogurt-quality improving exopolysaccharide from Streptococcus thermophilus AR333. Food Hydrocoll. 2018, 81, 220–228. [Google Scholar] [CrossRef]
  74. Hundschell, C.S.; Jakob, F.; Wagemans, A.M. Molecular Weight Dependent Structure and Polymer Density of the Exopoly-Saccharide Levan. arXiv 2019, arXiv:1909.07737. [Google Scholar]
  75. Arvidson, S.A.; Rinehart, B.T.; Gadala-Maria, F. Concentration regimes of solutions of levan polysaccharide from Bacillus sp. Carbohydr. Polym. 2006, 65, 144–149. [Google Scholar] [CrossRef]
  76. Zhang, W.; Zhang, X.; Cai, L.; Chen, R.; Zhang, Q.; Wang, X. Determination of Levan from Bacillus licheniformis by Ultraviolet Spectrophotometry. Trop. J. Pharm. Res. 2015, 14, 679–685. [Google Scholar] [CrossRef]
  77. Simms, P.J.; Boyko, W.J.; Edwards, J.R. The structural analysis of a levan produced by Streptococcus salivarius SS2. Carbohydr. Res. 1990, 208, 193–198. [Google Scholar] [CrossRef]
  78. Joaquim, E.O.; Hayashi, A.H.; Torres, L.M.B.; Figueiredo-Ribeiro, R.C.L.; Shiomi, N.; de Sousa, F.S.; Lago, J.H.G.; Carvalho, M.A.M. Chemical Structure and Localization of Levan, the Predominant Fructan Type in Underground Systems of Gomphrena marginata (Amaranthaceae). Front. Plant Sci. 2018, 9, 1745. [Google Scholar] [CrossRef]
  79. Murphy, D. Structure of a levan produced by Bacillus polymyxa. Can. J. Chem. 1952, 30, 872–878. [Google Scholar] [CrossRef]
  80. Lima, J.P.V.; Campos, P.T.A.; Paiva, M.F.; Linares, J.J.; Dias, S.C.L.; Dias, J.A. Dehydration of Fructose to 5-Hydroxymethylfurfural: Effects of Acidity and Porosity of Different Catalysts in the Conversion, Selectivity, and Yield. Chemistry 2021, 3, 1189–1202. [Google Scholar] [CrossRef]
  81. Bekers, M.; Upite, D.; Kaminska, E.; Laukevics, J.; Grube, M.; Vigants, A.; Linde, R. Stability of levan produced by Zymomonas mobilis. Process. Biochem. 2005, 40, 1535–1539. [Google Scholar] [CrossRef]
  82. Kennedy, J.F.; Stevenson, D.L.; White, C.A.; Viikari, L. The chromatographic behaviour of a series of fructo-oligosaccharides derived from levan produced by the fermentation of sucrose by Zymomonas mobilis. Carbohydr. Polym. 1989, 10, 103–113. [Google Scholar] [CrossRef]
  83. Matulová, M.; Husárová, S.; Capek, P.; Sancelme, M.; Delort, A.-M. NMR structural study of fructans produced by Bacillus sp. 3B6, bacterium isolated in cloud water. Carbohydr. Res. 2011, 346, 501–507. [Google Scholar] [CrossRef]
  84. Xu, Y.; Coda, R.; Shi, Q.; Tuomainen, P.; Katina, K.; Tenkanen, M. Exopolysaccharides Production during the Fermentation of Soybean and Fava Bean Flours by Leuconostoc mesenteroides DSM 20343. J. Agric. Food Chem. 2017, 65, 2805–2815. [Google Scholar] [CrossRef]
  85. Kemala, P.; Idroes, R.; Khairan, K.; Ramli, M.; Jalil, Z.; Idroes, G.M.; Tallei, T.E.; Helwani, Z.; Safitri, E.; Iqhrammullah, M.; et al. Green Synthesis and Antimicrobial Activities of Silver Nanoparticles Using Calotropis gigantea from Ie Seu-Um Geothermal Area, Aceh Province, Indonesia. Molecules 2022, 27, 5310. [Google Scholar] [CrossRef]
  86. Li, J.; Tian, X.; Habasi, M.; Chen, K.; Pang, N.; Hu, P.; Aisa, H.A. A phytoreduction route for selective synthesis of highly stable Ag and Ag:AgCl hybrid nanocolloids. CrystEngComm 2012, 14, 7621–7625. [Google Scholar] [CrossRef]
  87. Hussein, E.A.M.; Mohammad, A.A.-H.; Harraz, F.A.; Ahsan, M.F. Biologically Synthesized Silver Nanoparticles for Enhancing Tetracycline Activity Against Staphylococcus aureus and Klebsiella pneumoniae. Braz. Arch. Biol. Technol. 2019, 62, e19180266. [Google Scholar] [CrossRef]
  88. Jeong, S.-H.; Choi, H.; Kim, J.Y.; Lee, T.-W. Silver-Based Nanoparticles for Surface Plasmon Resonance in Organic Optoelectronics. Part. Part. Syst. Charact. 2015, 32, 164–175. [Google Scholar] [CrossRef]
  89. Rosa, R.M.; Silva, J.C.; Sanches, I.S.; Henriques, C. Simultaneous photo-induced cross-linking and silver nanoparticle formation in a PVP electrospun wound dressing. Mater. Lett. 2017, 207, 145–148. [Google Scholar] [CrossRef]
  90. Alex, K.V.; Pavai, P.T.; Rugmini, R.; Prasad, M.S.; Kamakshi, K.; Sekhar, K.C. Green Synthesized Ag Nanoparticles for Bio-Sensing and Photocatalytic Applications. ACS Omega 2020, 5, 13123–13129. [Google Scholar] [CrossRef]
  91. Carré-Rangel, L.; Alonso-Nuñez, G.; Espinoza-Gómez, H.; Flores-López, L.Z. Green Synthesis of Silver Nanoparticles: Effect of Dextran Molecular Weight Used as Stabilizing-Reducing Agent. J. Nanosci. Nanotechnol. 2015, 15, 9849–9855. [Google Scholar] [CrossRef]
  92. Saravanan, L.; Diwakar, S.; Mohankumar, R.; Pandurangan, A.; Jayavel, R. Synthesis, Structural and Optical Properties of PVP Encapsulated CdS Nanoparticles. Nanomater. Nanotechnol. 2011, 1, 1. [Google Scholar] [CrossRef]
  93. Kutsevol, N.; Chumachenko, V.; Rawiso, M.; Shyichuk, A. Green synthesis of silver nanoparticles using dextran-graft-polyacrylamide as template. Micro Nano Lett. 2016, 11, 256–259. [Google Scholar] [CrossRef]
  94. Cakić, M.; Glišić, S.; Nikolić, G.; Nikolić, G.M.; Cakić, K.; Cvetinov, M. Synthesis, characterization and antimicrobial activity of dextran sulphate stabilized silver nanoparticles. J. Mol. Struct. 2016, 1110, 156–161. [Google Scholar] [CrossRef]
  95. Bubonja-Šonje, M.; Knežević, S.; Abram, M. Challenges to antimicrobial susceptibility testing of plant-derived polyphenolic compounds. Arh. Hig. Rada Toksikol. 2020, 71, 300–311. [Google Scholar] [CrossRef]
  96. Biliuta, G.; Bostănaru-Iliescu, A.-C.; Mareș, M.; Pavlov-Enescu, C.; Năstasă, V.; Burduniuc, O.; Coseri, S. Antibacterial and Antifungal Silver Nanoparticles with Tunable Size Embedded in Various Cellulose-Based Matrices. Molecules 2022, 27, 6680. [Google Scholar] [CrossRef]
  97. Malik, M.; Iqbal, M.A.; Malik, M.; Raza, M.A.; Shahid, W.; Choi, J.R.; Pham, P.V. Biosynthesis and Characterizations of Silver Nanoparticles from Annona squamosa Leaf and Fruit Extracts for Size-Dependent Biomedical Applications. Nanomaterials 2022, 12, 616. [Google Scholar] [CrossRef] [PubMed]
  98. Sahu, N.; Soni, D.; Chandrashekhar, B.; Satpute, D.B.; Saravanadevi, S.; Sarangi, B.K.; Pandey, R.A. Synthesis of silver nanoparticles using flavonoids: Hesperidin, naringin and diosmin, and their antibacterial effects and cytotoxicity. Int. Nano Lett. 2016, 6, 173–181. [Google Scholar] [CrossRef]
  99. Maurice, N.M.; Bedi, B.; Sadikot, R.T. Pseudomonas aeruginosa Biofilms: Host Response and Clinical Implications in Lung Infections. Am. J. Respir. Cell Mol. Biol. 2018, 58, 428–439. [Google Scholar] [CrossRef] [PubMed]
  100. El Din, S.N.; El-Tayeb, T.A.; Abou-Aisha, K.; El-Azizi, M. In vitro and in vivo antimicrobial activity of combined therapy of silver nanoparticles and visible blue light against Pseudomonas aeruginosa. Int. J. Nanomed. 2016, 11, 1749–1758. [Google Scholar] [CrossRef]
  101. Abeer Mohammed, A.B.; Abd Elhamid, M.M.; Khalil, M.K.M.; Ali, A.S.; Abbas, R.N. The potential activity of biosynthesized silver nanoparticles of Pseudomonas aeruginosa as an antibacterial agent against multidrug-resistant isolates from intensive care unit and anticancer agent. Environ. Sci. Eur. 2022, 34, 109. [Google Scholar] [CrossRef]
  102. Edwards-Jones, V. Silver nanoparticles: An overview of scientific toxicity and safety data and introduction of a new dressing, Venus Ag. Wounds UK 2022, 18, 22–29. [Google Scholar]
  103. Vinicius de Oliveira Brisola Maciel, M.; da Rosa Almeida, A.; Machado, M.H.; Elias, W.C.; Gonçalves da Rosa, C.; Teixeira, G.L.; Noronha, C.M.; Bertoldi, F.C.; Nunes, M.R.; Dutra de Armas, R.; et al. Green synthesis, characteristics and antimicrobial activity of silver nanoparticles mediated by essential oils as reducing agents. Biocatal. Agric. Biotechnol. 2020, 28, 101746. [Google Scholar] [CrossRef]
  104. Ansar, S.; Tabassum, H.; Aladwan, N.S.M.; Ali, M.N.; Almaarik, B.; AlMahrouqi, S.; Abudawood, M.; Banu, N.; Alsubki, R. Eco friendly silver nanoparticles synthesis by Brassica oleracea and its antibacterial, anticancer and antioxidant properties. Sci. Rep. 2020, 10, 18564. [Google Scholar] [CrossRef]
  105. Ashour, A.A.; Raafat, D.; El-Gowelli, H.M.; El-Kamel, A.H. Green synthesis of silver nanoparticles using cranberry powder aqueous extract: Characterization and antimicrobial properties. Int. J. Nanomed. 2015, 10, 7207–7221. [Google Scholar] [CrossRef]
  106. Latimer, J.; Forbes, S.; McBain, A.J. Attenuated Virulence and Biofilm Formation in Staphylococcus aureus following Sublethal Exposure to Triclosan. Antimicrob. Agents Chemother. 2012, 56, 3092–3100. [Google Scholar] [CrossRef]
  107. Najafi, M.; Moghaddam, M.N.; Yousefi, E. The Effect of Silver Nanoparticles on Pyocyanin Production of Pseudomonas aeruginosa Isolated from Clinical Specimens. Avicenna J. Med. Biotechnol. 2021, 13, 98–103. [Google Scholar] [CrossRef]
  108. Qureshi, R.; Qamar, M.U.; Shafique, M.; Muzammil, S.; Rasool, M.H.; Ahmad, I.; Ejaz, H. Antibacterial efficacy of silver nanoparticles against metallo-beta-lactamase (bla(NDM), bla(VIM), bla(OXA)) producing clinically isolated Pseudomonas aeruginosa. Pak. J. Pharm. Sci. 2021, 34, 237–243. [Google Scholar] [CrossRef] [PubMed]
  109. Fey, P.D.; Olson, M.E. Current concepts in biofilm formation of Staphylococcus epidermidis. Futur. Microbiol. 2010, 5, 917–933. [Google Scholar] [CrossRef] [PubMed]
  110. Swolana, D.; Kępa, M.; Idzik, D.; Dziedzic, A.; Kabała-Dzik, A.; Wąsik, T.J.; Wojtyczka, R.D. The Antibacterial Effect of Silver Nanoparticles on Staphylococcus epidermidis Strains with Different Biofilm-Forming Ability. Nanomaterials 2020, 10, 1010. [Google Scholar] [CrossRef]
  111. Dove, A.S.; Dzurny, D.I.; Dees, W.R.; Qin, N.; Nunez Rodriguez, C.C.; Alt, L.A.; Ellward, G.L.; Best, J.A.; Rudawski, N.G.; Fujii, K.; et al. Silver nanoparticles enhance the efficacy of aminoglycosides against antibiotic-resistant bacteria. Front. Microbiol. 2023, 13, 1064095. [Google Scholar] [CrossRef]
Figure 1. A schematic representation of major steps undertaken to prepare bacterial levan by two lactic acid bacteria species, i.e., Streptococcus salivarius K12 and Leuconostoc mesenteroides DSM 20343 with subsequent purification by chemical precipitation.
Nanomaterials 13 02969 g001
Figure 2. A schematic representation of major steps undertaken to prepare silver nanoparticle colloids and purified nanoparticles following the green synthesis principle using bacterial levan recovered from Streptococcus salivarius K12 and Leuconostoc mesenteroides DSM 20343.
Nanomaterials 13 02969 g002
Figure 3. Comparison of the FT-IR spectrum for produced bacterial levan by two species of lactic acid bacteria: (A) Streptococcus salivarius K12—SS, HM and Leuconostoc mesenteroides DSM 20343—LM, HH, and standard dextran (control) from Leuconostoc mesenteroides—D, HM. The vibrational FT-IR spectrum is compared with α-D-glucose and β-D-fructose commercial standards (B).
Nanomaterials 13 02969 g003
Figure 4. Representative scanning electron microscope micrographs of bacterial levan biosynthesized by Streptococcus salivarius K12 (B) and Leuconostoc mesenteroides DSM 20343 acquired under 150 x, 1.0 kx, and 5.0 kx times magnification.
Nanomaterials 13 02969 g004
Figure 5. Multi-detector size-exclusion chromatograms of bacterial levan isolated from Streptococcus salivarius K12 (A) and Leuconostoc mesenteroides DSM 20343 (B) with 100 µL injection at concentrations of 6.2 and 6.6 mg mL−1, respectively. The overlay of the refractive index chromatograms for the bacterial levan isolated from Streptococcus salivarius K12 (C) and Leuconostoc mesenteroides DSM 20343 (D) samples, respectively, shows a relatively small deviation between permeation peaks of 2 injections during detection by refractive index. Note: refractive index (red); right-angle light scattering (green); low-angle light scattering (black); viscometer (blue).
Nanomaterials 13 02969 g005
Figure 6. HPLC-RID chromatogram representing the separation of carbohydrates of a standard mixture (A), bacterial levan biosynthesized by Streptococcus salivarius K12 (B), and Leuconostoc mesenteroides DSM 20343 (C). Note: The profiles of saccharides in the (B1) and (C1) chromatograms refer to released monomers recovered after complete hydrolysis of bacterial levan biosynthesized by Streptococcus salivarius K12 and Leuconostoc mesenteroides DSM 20343 with 0.05 M oxalic acid for 3 h at 90 °C, respectively.
Nanomaterials 13 02969 g006
Figure 7. UV–Vis spectrum of colloid systems containing silver nanoparticles reduced with different concentrations of bacterial levan biosynthesized by Streptococcus salivarius K12 (A), Leuconostoc mesenteroides DSM 20343 (B), and high-molecular-weight dextran as the control (C), representing absorption peaks within a range of 392–426 nm. Representative color change in colloid systems as a function of reduction agent concentration applied during green biosynthesis of silver nanoparticles. Note: Capital letters S and M refer to bacterial levan used for the biosynthesis of AgNPs, i.e., Streptococcus salivarius K12 and Leuconostoc mesenteroides DSM 20343, respectively. The capital letter D refers to the commercial high-molecular-weight dextran used for the biosynthesis of AgNPs. The numbers indicate the amount of exopolysaccharide used as a reducing and capping agent.
Nanomaterials 13 02969 g007
Figure 8. Scanning electron microscopy (SEM) images of biosynthesized bacterial levan-capped silver nanoparticles in colloid systems produced by green biosynthesis. Energy-dispersive X-ray spectroscopy (EDX) pattern (A) of silver nanoparticles produced by bacterial levan captured in four randomly selected regions (A1) for EDX spectroscopy analysis. Note: SEM micrographs: capital letters S and L refer to the bacterial levan used for the biosynthesis of AgNPs, i.e., Streptococcus salivarius K12 and Leuconostoc mesenteroides DSM 20343, respectively. The capital letter D refers to the commercial high-molecular-weight dextran used for the biosynthesis of AgNPs. The numbers indicate the amount of exopolysaccharide used as a reducing and capping agent. Pur-BL@AgNPs_S.s and Pur-BL@AgNPs_L.M represent monolayers of bacterial levan-capped silver nanoparticles after purification.
Nanomaterials 13 02969 g008
Figure 9. Disc (upper row) and well diffusion (lower row) tests for colloid systems contained silver nanoparticles produced within green biosynthesis by bacterial levan derived from Streptococcus salivarius K12 and Leuconostoc mesenteroides DSM 20343 and commercial high-molecular-weight dextran against Pseudomonas aeruginosa ATCC 27853 (A,A1), Staphylococcus aureus ATCC 6538P (B,B1), Escherichia coli ATCC 25922 (C,C1), and Enterococcus aerogenes ATCC 13048 (D,D1). Note: 1—colloid system containing silver nanoparticles biosynthesized using 20 mg of bacterial levan from Streptococcus salivarius K12 (BLss@AgNPs 20); 2—colloid system containing silver nanoparticles biosynthesized using 500 mg of bacterial levan from Streptococcus salivarius K12 (BLss@AgNPs 500); 3—colloid system containing silver nanoparticles biosynthesized using 50 mg of bacterial levan from Streptococcus salivarius K12 (BLss@AgNPs 50); 4—colloid system containing silver nanoparticles biosynthesized using 500 mg of high-molecular-weight dextran (Sigma-Aldrich) (BLdex@AgNPs 500); 5—colloid system containing silver nanoparticles biosynthesized using 20 mg of bacterial levan from Leuconostoc mesenteroides DSM 20343 (BLlm@AgNPs 20).
Nanomaterials 13 02969 g009
Table 1. The composition of the De Man, Rogosa, and Sharpe modified broth used for the biosynthesis of bacterial levan by lactic acid bacteria Streptococcus salivarius K12 and Leuconostoc mesenteroides DSM 20343.
ComponentChemical FormulaAmount, g L−1
Bacteriological peptone10.0
Beef extract10.0
Yeast extract5.0
SucroseC12H22O1150.0
Dipotassium hydrogen phosphateK2HPO42.0
Sodium acetateC2H3NaO25.0
Diammonium citrateC6H14N2O72.0
Magnesium sulfateMgSO40.2
Manganous sulfateMnSO40.05
Tween® 80C64H124O261.0
Table 2. FT-IR band assignments for bacterial levan produced by Streptococcus salivarius K12 and Leuconostoc mesenteroides DSM 20343.
Wavenumber, cm−1Assignment
IR
3524–3314νOH
3015–2870νCH symmetric/asymmetric
1647νCH
1637δC=O
1458δCH2 + δOCH + δCCH
1410δCH3
1380–1430δOCH + δCOH + δCCH
1340δCCH + δOCH
1265Fructose δOH in plane, δCCO
1224, 1200Glucose δCH + δOH in plane
1149–995νCO + νCC + δCCC
977νCO + δCCO
923–916νCO + νCCH + νs ring of pyranose
873νCC + δCCH + δCH fructose
818–839 δCH
783,775 δCCH + δCCO
627CH2 + CH
621CH2
Note: ν—stretching; as—asymmetric; s—symmetric; β—in-plane bending.
Table 3. Detailed description of exopolysaccharide bacterial levan biosynthesized by Streptococcus salivarius K12 and Leuconostoc mesenteroides DSM 20343.
ReplicateMw, g moL−1Mn, g moL−1PDRh, nmIV, dL g−1Recovery, %
Bacterial levan biosynthesized by Streptococcus salivarius K12
115.14600014.1270001.0736.30.2154.3
215.72400014.5080001.0835.30.1955.0
Average15.43500014.3175001.0835.80.2054.7
STDEV0.4090.2690.0070.7070.0140.495
Bacterial levan biosynthesized by Leuconostoc mesenteroides DSM 20343
126.70012.5002.143.50.1481.8
226.40012.0002.203.50.1480.6
Average26.60012.3002.173.50.1481.2
STDEV0.2120.3540.0420.0000.0000.849
Note: Mw—weight average molecular weight; Mn—number average molecular weight; PD—polydispersity; Rh—hydrodynamic radius; IV—intrinsic viscosity; dL—deciliters. Recovery was estimated based on obtained values between the detected concentration and input concentration.
Table 4. The concentration of free and bound mono- and disaccharides in bacterial levan produced by Streptococcus salivarius K12 and Leuconostoc mesenteroides DSM 20343 after hydrolysis for 3 and 6 h and 90 °C with three types of aqueous acid solutions, g 100 g−1 DW.
CarbBL_S. salivarius K12 BL_L. mesenteroides DSM 20343
FreeBound,
0.1 M HCl
3 h
Bound,
0.1 M HCl
6 h
Bound,
0.2 M HCl 6 h
Bound,
0.5 M HCl
6 h
Bound,
1.0 M TCA 6 h
Bound,
0.05 M oxalic acid 3 h
FreeBound,
0.1 M HCl 3 h
Bound,
0.1 M HCl
6 h
Bound,
0.2 M HCl 6 h
Bound,
0.5 M HCl
6 h
Bound,
1.0 M TCA
6 h
Bound,
0.05 M Oxalic Acid 3 h
Glyn.d.n.d.n.d.n.d.n.d.n.d.n.d.n.d.n.d.n.d.n.d.n.d.n.d.n.d.
Xyln.d.n.d.n.d.n.d.n.d.n.d.n.d.n.d.n.d.n.d.n.d.n.d.n.d.n.d.
Aran.d.n.d.n.d.n.d.n.d.n.d.n.d.n.d.n.d.n.d.n.d.n.d.n.d.n.d.
Fru0.4 ± 0.0 f85.7 ± 0.1 b84.9 ± 0.1 b77.1 ± 0.1 d56.9 ± 0.1 e80.2 ± 0.1 b92.0 ± 0.0 a0.1 ± 0.0 g58.1 ± 0.0 c60.6 ± 0.00 b53.1 ± 0.1 e38.4 ± 0.0 f55.0 ± 0.0 d62.3 ± 0.0 a
Glu0.7 ± 0.0 e2.5 ± 0.0 d4.7 ± 0.1 b4.8 ± 0.0 b5.8 ± 0.0 a4.9 ± 0.1 b4.2 ± 0.1 c0.4 ± 0.0 cBLQBLQ5.3 ± 0.0 b10.3 ± 0.0 a5.0 ± 0.1 bBLQ
Gala0.3 ± 0.0n.d.n.d.n.d.n.d.n.d.n.d.2.5 ± 0.0 d7.3 ± 0.1 c12.7 ± 0.1 a12.2 ± 0.1 ab11.9 ± 0.0 b12.2 ± 0.0 a12.6 ± 0.0 a
Suc1.2 ± 0.0n.d.n.d.n.d.n.d.n.d.n.d.0.05 ± 0.0n.d.n.d.n.d.n.d.n.d.n.d.
Maln.d.n.d.n.d.n.d.n.d.n.d.n.d.n.d.n.d.n.d.n.d.n.d.n.d.n.d.
Lac0.1 ± 0.0n.d.n.d.n.d.n.d.n.d.n.d.0.05 ± 0.0n.d.n.d.n.d.n.d.n.d.n.d.
Tot2.7 ± 0.0 f88.2 ± 0.2 b89.6 ± 0.2 b81.9 ± 0.1 d62.7 ± 0.1 e85.1 ± 0.2 c96.2 ± 0.1 a3.1 ± 0.0 f65.4 ± 0.1 e73.3 ± 0.1 a70.6 ± 0.2 b60.6 ± 0.0 d72.2 ± 0.1 c74.9 ± 0.1 a
Note: Values are means ± SD of triplicates (n = 3). Gly—glycerol; Xyl—xylose; Ara—arabinose; Fru–fructose; Glu—glucose; Gala—galactose; Suc—sucrose; Mal—maltose; Lac—lactose; Carb—carbohydrate; Tot—total sugars content; BLQ—observed concentration is below limit of quantification; 3 and 6 h—acid hydrolysis of bacterial levan lasted for 3 and 6 h, respectively; DW—the concentration expressed on a dry weight basis; n.d.—not detected. The concentration of carbohydrates in the bacterial levan sample was expressed as g 100 g−1 on a dry weight basis. Means within the same carbohydrate and source of exopolysaccharide with different superscript letters (a, b, c, d, e, f, and g) are significantly different at p < 0.05.
Table 5. Antimicrobial activity of colloid systems containing silver nanoparticles according to their diameter of the inhibition zone values.
Test CultureAverage Zone of Inhibition, mm
BLss@AgNPs 20BLlm@AgNPs 20BLss@AgNPs 50BLss@AgNPs 500BLdex@AgNPs 500
DWDWDWDWDW
Pseudomonas aeruginosa ATCC 2785310.1 ± 0.0 a14.1 ± 0.2 c10.1 ± 0.1 a14.3 ± 0.1 c9.2 ± 0.0 ab17.4 ± 0.2 b8.1 ± 0.0 b21.2 ± 0.2 a9.3 ± 0.1 ab10.1 ± 0.1 d
Staphylococcus aureus ATCC 6538P10.2 ± 0.0 ab11.2 ± 0.1 b10.3 ± 0.1 ab11.4 ± 0.1 b11.1 ± 0.1 a14.2 ± 0.1 a10.1 ± 0.1 ab15.5 ± 0.3 a9.1 ± 0.0 b12.2 ± 0.2 b
Escherichia coli ATCC 259229.3 ± 0.0 bc13.1 ± 0.1 c10.2 ± 0.0 ab13.4 ± 0.1 c10.3 ± 0.1 ab15.4 ± 0.1 b11.1 ± 0.1 a19.3 ± 0.1 a8.1 ± 0.0 c10.3 ± 0.2 d
Enterococcus aerogenes ATCC 130488.1 ± 0.0 ab12.4 ± 0.0 b9.1 ± 0.0 a12.4 ± 0.0 b8.2 ± 0.0 ab12.4 ± 0.0 b9.2 ± 0.0 a15.1 ± 0.2 a7.2 ± 0.0 b6.1 ± 0.0 c
Pseudomonas aeruginosa *9.4 ± 0.0 a6.1 ± 0.0 a9.1 ± 0.0 a6.2 ± 0.0 a9.3 ± 0.0 a6.1 ± 0.0 a9.4 ± 0.0 a6.2 ± 0.0 a9.4 ± 0.1 a6.2 ± 0.0 a
Staphylococcus epidermidis *9.1 ± 0.1 b11 ± 0.0 c10.2 ± 0.2 ab13.3 ± 0.1 b11.1 ± 0.1 a15.1 ± 0.1 a10.2 ± 0.0 ab16.2 ± 0.1 a9.3 ± 0.1 b11.1 ± 0.1 c
Escherichia coli *10.2 ± 0.1 a6.2 ± 0.0 d10.1 ± 0.2 a9.2 ± 0.2 c11.1 ± 0.0 a11.3 ± 0.1 b11.2 ± 0.1 a14.4 ± 0.2 a10.1 ± 0.1 a6.1 ± 0.0 d
Enterococcus faecium *9.3 ± 0 b8.2 ± 0.0 c9.2 ± 0.0 b11.2 ± 0.0 b11.3 ± 0.1 a13.1 ± 0.0 a8.1 ± 0.0 b14.3 ± 0.1 a9.4 ± 0.0 b8.1 ± 0.0 c
Note: Values are expressed as means ± SD values of duplicates (n = 2). Means within the same test culture and testing method with different superscript letters (a, b, c, and d) are significantly different at p ≤ 0.05. * Isolate from clinical samples. The capital letter D refers to antimicrobial susceptibility testing by the disc diffusion method. The capital letter W refers to antimicrobial susceptibility testing agar by the well diffusion method. Disc diameter of 5 mm; agar well diameter of 6 mm; BLss@AgNPs 20—colloid system containing silver nanoparticles biosynthesized using 20 mg of bacterial levan from Streptococcus salivarius K12; BLss@AgNPs 50—colloid system containing silver nanoparticles biosynthesized using 50 mg of bacterial levan from Streptococcus salivarius K12; BLss@AgNPs 500—colloid system containing silver nanoparticles biosynthesized using 500 mg of bacterial levan from Streptococcus salivarius K12; BLlm@AgNPs 20—colloid system containing silver nanoparticles biosynthesized using 20 mg of bacterial levan from Leuconostoc mesenteroides DSM 20343; BLdex@AgNPs 500—colloid system containing silver nanoparticles biosynthesized using 500 mg of high-molecular-weight dextran (Sigma-Aldrich).
Table 6. Minimal inhibitory (MIC) and bactericidal (MBC) concentration values of colloid systems containing silver nanoparticles (µL from stock) against selected pathogenic bacteria.
Test CultureAverage MBC and MIC, µL mL−1 AgNPs
BLss@AgNPs 20BLlm@AgNPs 20BLss@AgNPs 50BLss@AgNPs 500BLdex@AgNPs 500
MBC (95%)MICMBC (95%)MICMBC (95%)MICMBC (95%)MICMBC (95%)MIC
Pseudomonas aeruginosa ATCC 278535.2 ± 0.1 a2.6 ± 0.0 b5.2 ± 0.1 a5.2 ± 0.0 a5.2 ± 0.0 a5.2 ± 0.0 a5.2 ± 0.0 a5.2 ± 0.4 a2.6 ± 0.1 b2.6 ± 0.0 b
Staphylococcus aureus ATCC 6538P41.7 ± 0.3 b20.8 ± 0.3 b41.7 ± 0.7 b20.8 ± 0.1 b20.8 ± 0.3 c20.8 ± 0.4 b83.3 ± 2.4 a83.3 ± 2.1 a41.7 ± 0.6 b20.8 ± 0.8 b
Escherichia coli ATCC 259225.2 ± 0.0 b5.2 ± 0.0 a10.4 ± 0.1 a2.6 ± 0.0 b2.6 ± 0.0 c2.6 ± 0.0 b10.4 ± 0.4 a5.2 ± 0.3 a2.6 ± 0.0 c2.6 ± 0.0 b
Enterococcus aerogenes ATCC 1304820.8 ± 0.4 a10.4 ± 0.1 b10.4 ± 0.0 b10.4 ± 0.1 b10.4 ± 0.0 b10.4 ± 0.1 b10.4 ± 0.3 b10.4 ± 0.4 b20.8 ± 0.8 a20.8 ± 0.7 a
Pseudomonas aeruginosa *5.2 ± 0.0 a5.2 ± 0.1 a5.2 ± 0.0 a5.2 ± 0.0 a5.2 ± 0.0 a5.2 ± 0.0 a5.2 ± 0.1 a5.2 ± 0.1 a5.2 ± 0.1 a5.2 ± 0.1 a
Staphylococcus epidermidis *20.8 ± 0.2 a10.4 ± 0.2 b20.8 ± 0.2 a10.4 ± 0.1 b20.8 ± 0.4 a10.4 ± 0.2 b20.8 ± 0.9 a10.4 ± 0.5 b20.8 ± 0.9 a10.4 ± 0.3 b
Escherichia coli *5.2 ± 0.0 b5.2 ± 0.0 b5.2 ± 0.0 b5.2 ± 0.0 b5.2 ± 0.1 b5.2 ± 0.0 b10.4 ± 0.4 a10.4 ± 0.4 a5.2 ± 0.1 b5.2 ± 0.1 b
Enterococcus faecium *20.8 ± 0.1 a5.2 ± 0.0 b10.4 ± 0.1 b10.4 ± 0.1 a10.4 ± 0.2 b5.2 ± 0.0 b10.4 ± 0.6 b10.4 ± 0.4 a20.8 ± 1.4 a5.2 ± 0.1 b
Note: Values are expressed as means ± SD values of duplicates (n = 2). Means within the same test culture and testing method with different superscript letters (a, b, c) are significantly different at p ≤ 0.05. * Isolate from clinical samples. Disc diameter of 5 mm; agar well diameter of 6 mm. BLss@AgNPs 20—colloid system containing silver nanoparticles biosynthesized using 20 mg of bacterial levan from Streptococcus salivarius K12; BLss@AgNPs 50—colloid system containing silver nanoparticles biosynthesized using 50 mg of bacterial levan from Streptococcus salivarius K12; BLss@AgNPs 500—colloid system containing silver nanoparticles biosynthesized using 500 mg of bacterial levan from Streptococcus salivarius K12; BLlm@AgNPs 20—colloid system containing silver nanoparticles biosynthesized using 20 mg of bacterial levan from Leuconostoc mesenteroides DSM 20343; BLdex@AgNPs 500—colloid system containing silver nanoparticles biosynthesized using 500 mg of high-molecular-weight dextran (Sigma-Aldrich).
Disclaimer/Publisher’s Note: The statements, opinions and data contained in all publications are solely those of the individual author(s) and contributor(s) and not of MDPI and/or the editor(s). MDPI and/or the editor(s) disclaim responsibility for any injury to people or property resulting from any ideas, methods, instructions or products referred to in the content.

