
Influence of Grain Size on Dielectric Behavior in Lead-Free 0.5 Ba(Zr0.2Ti0.8)O3–0.5 (Ba0.7Ca0.3)TiO3 Ceramics

 ,
,  ,
,  ,
, 
Abstract
:1. Introduction
2. Materials and Methods
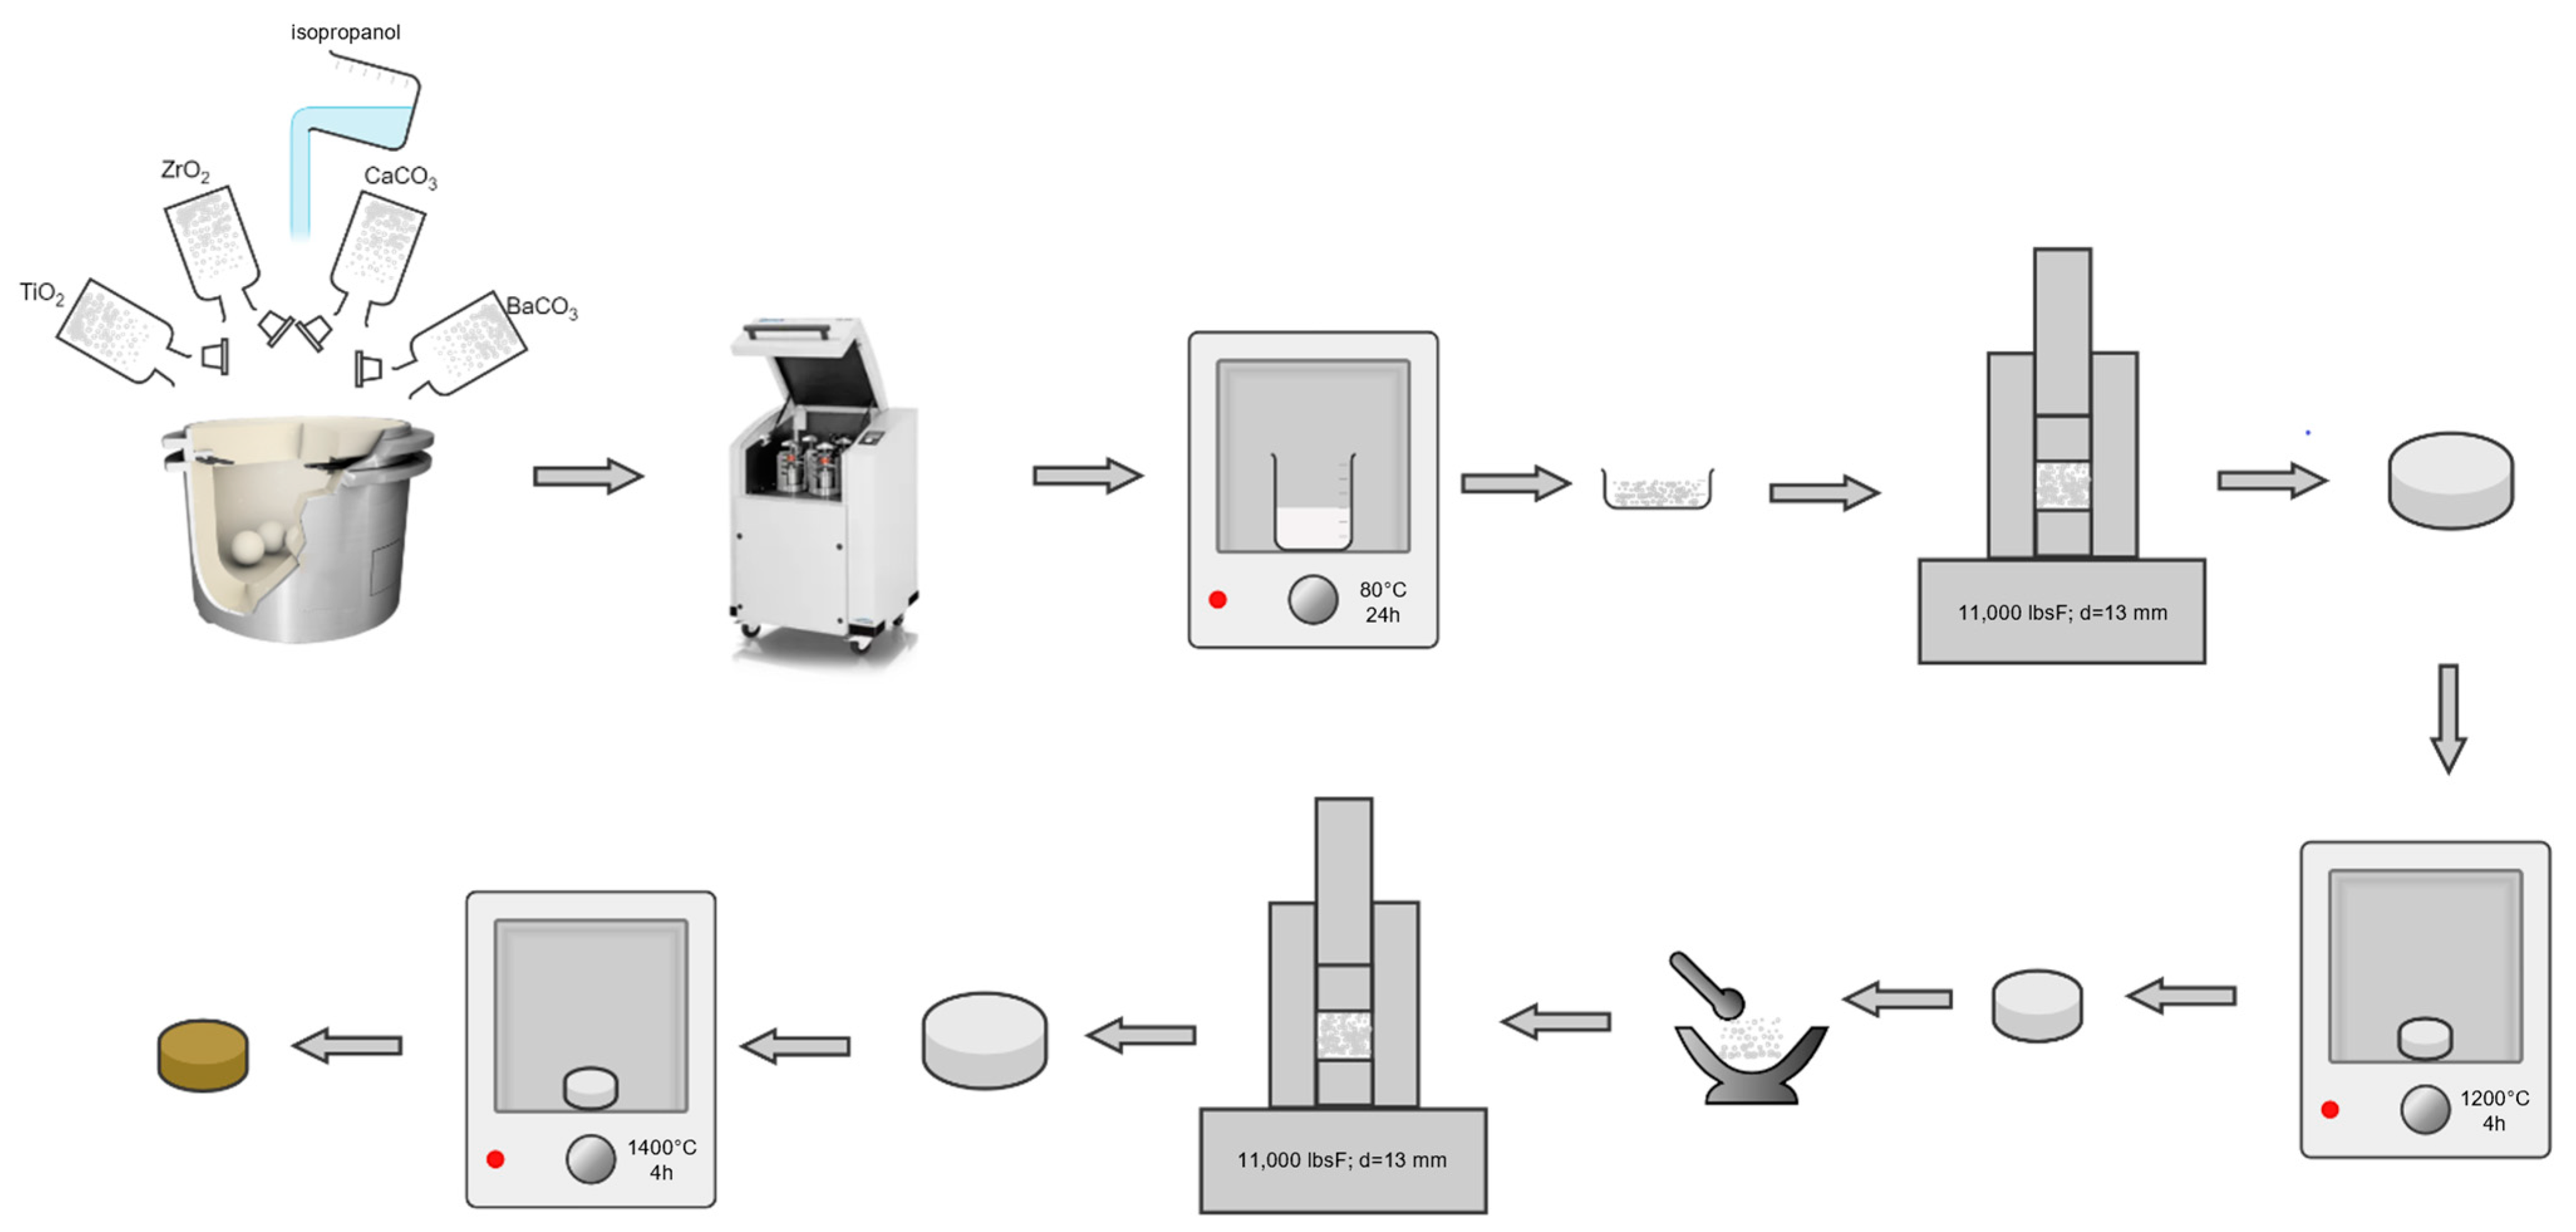
2.1. Sample Preparation by Solid-State Reaction Route
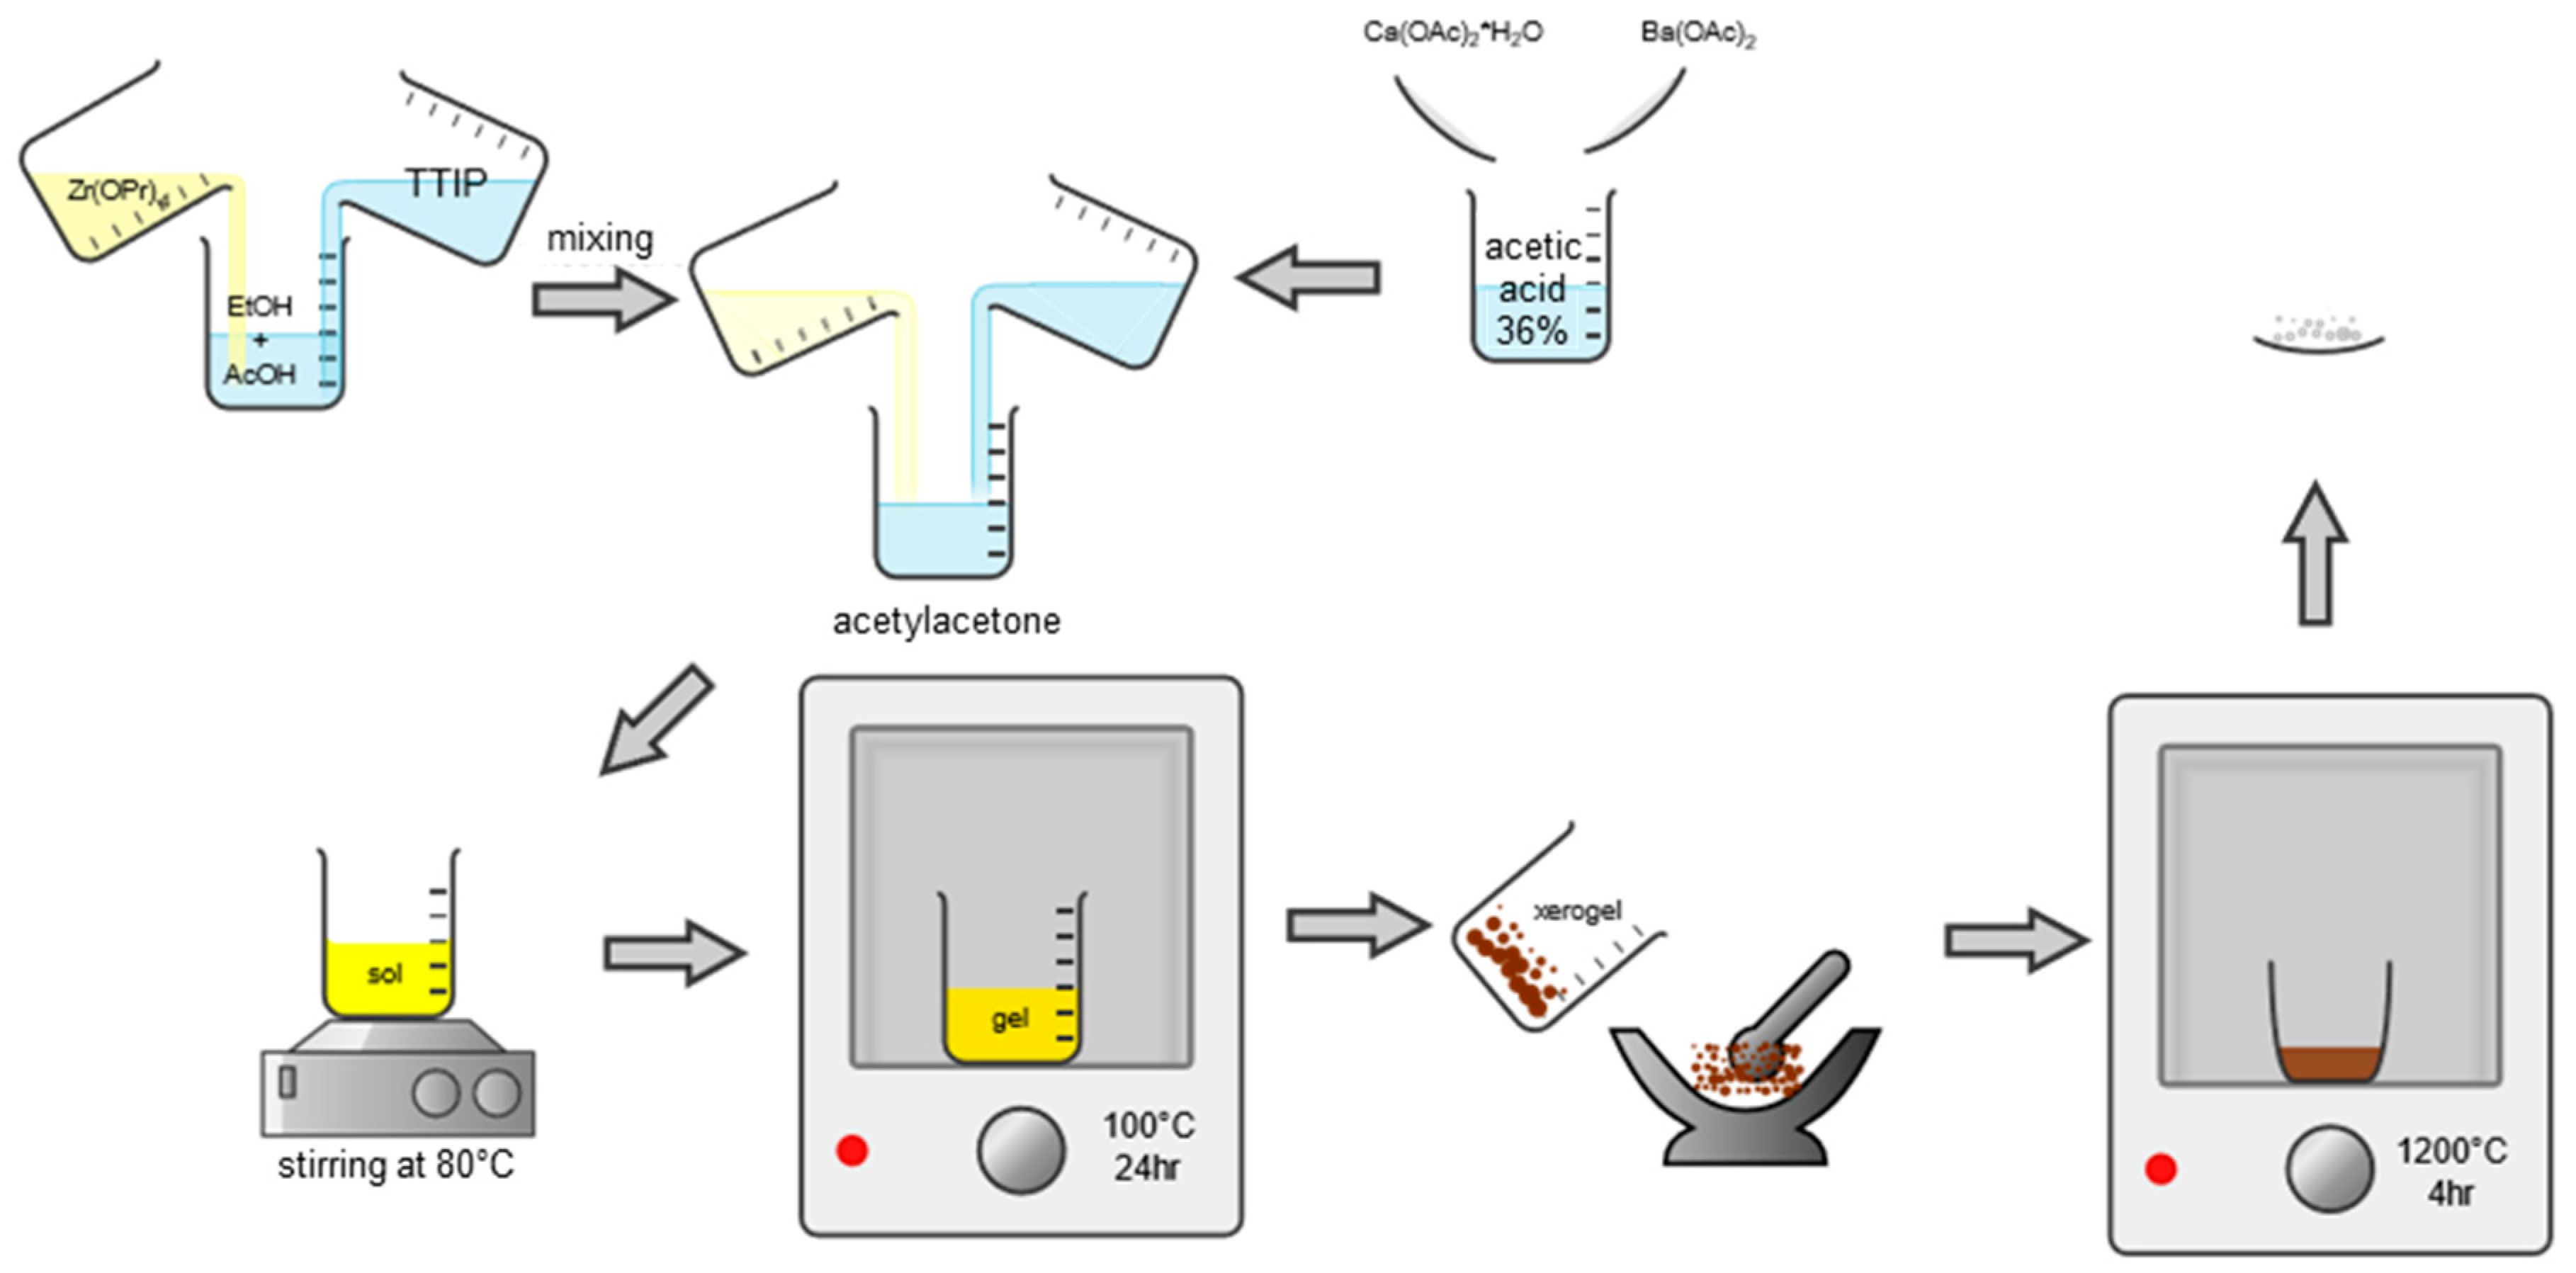
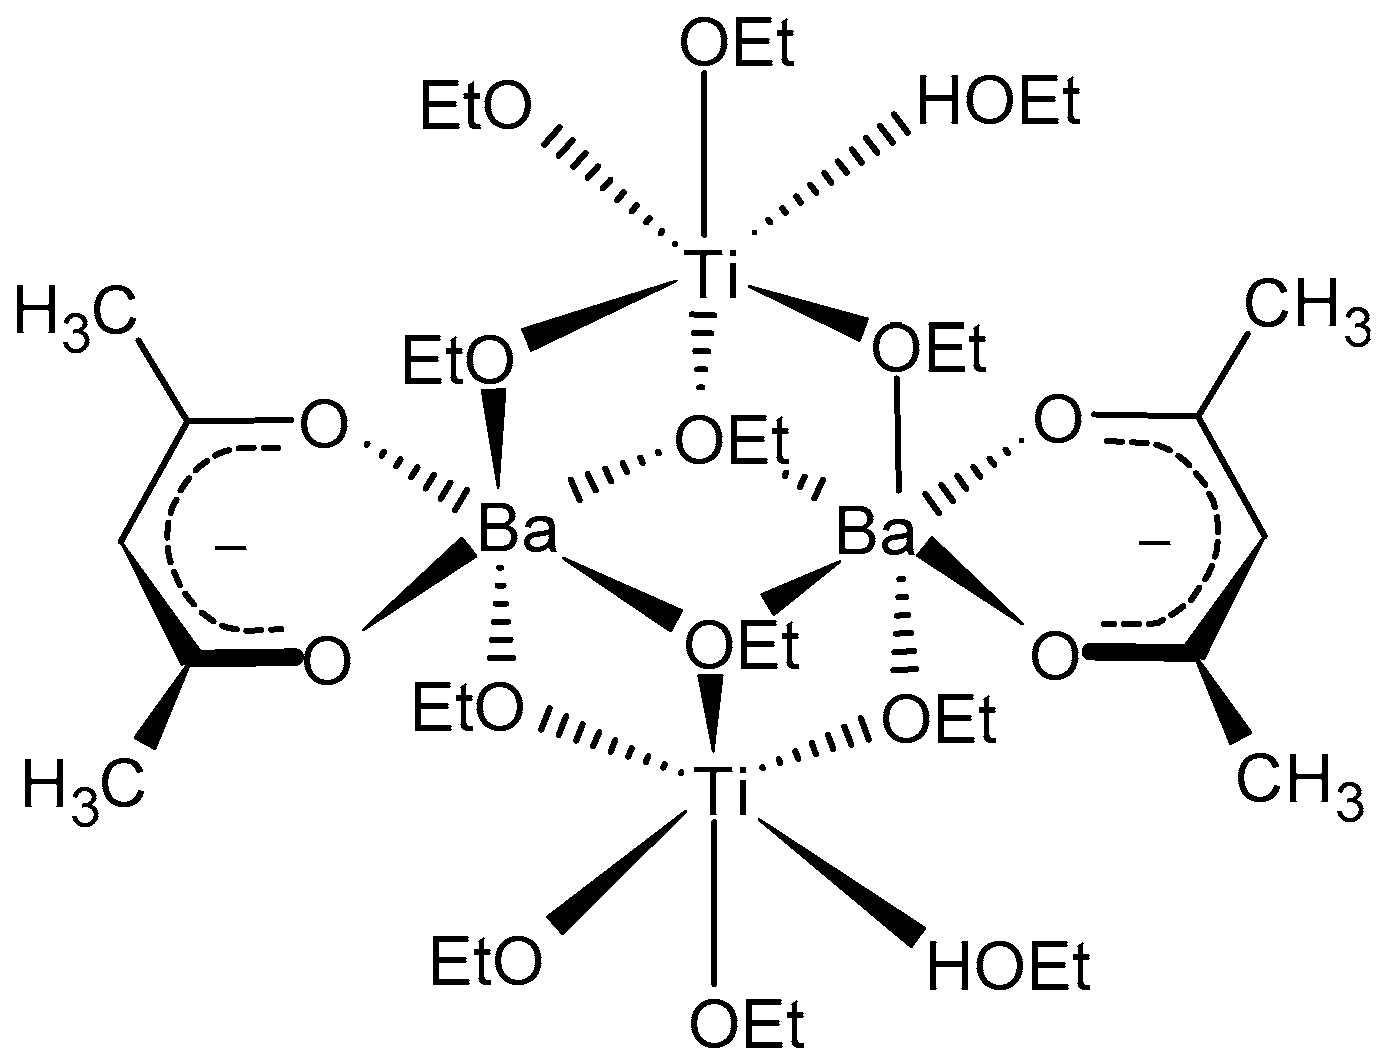
2.2. Sample Preparation by Sol-Gel Reaction Route
2.3. Samples Characterization
3. Results and Discussion
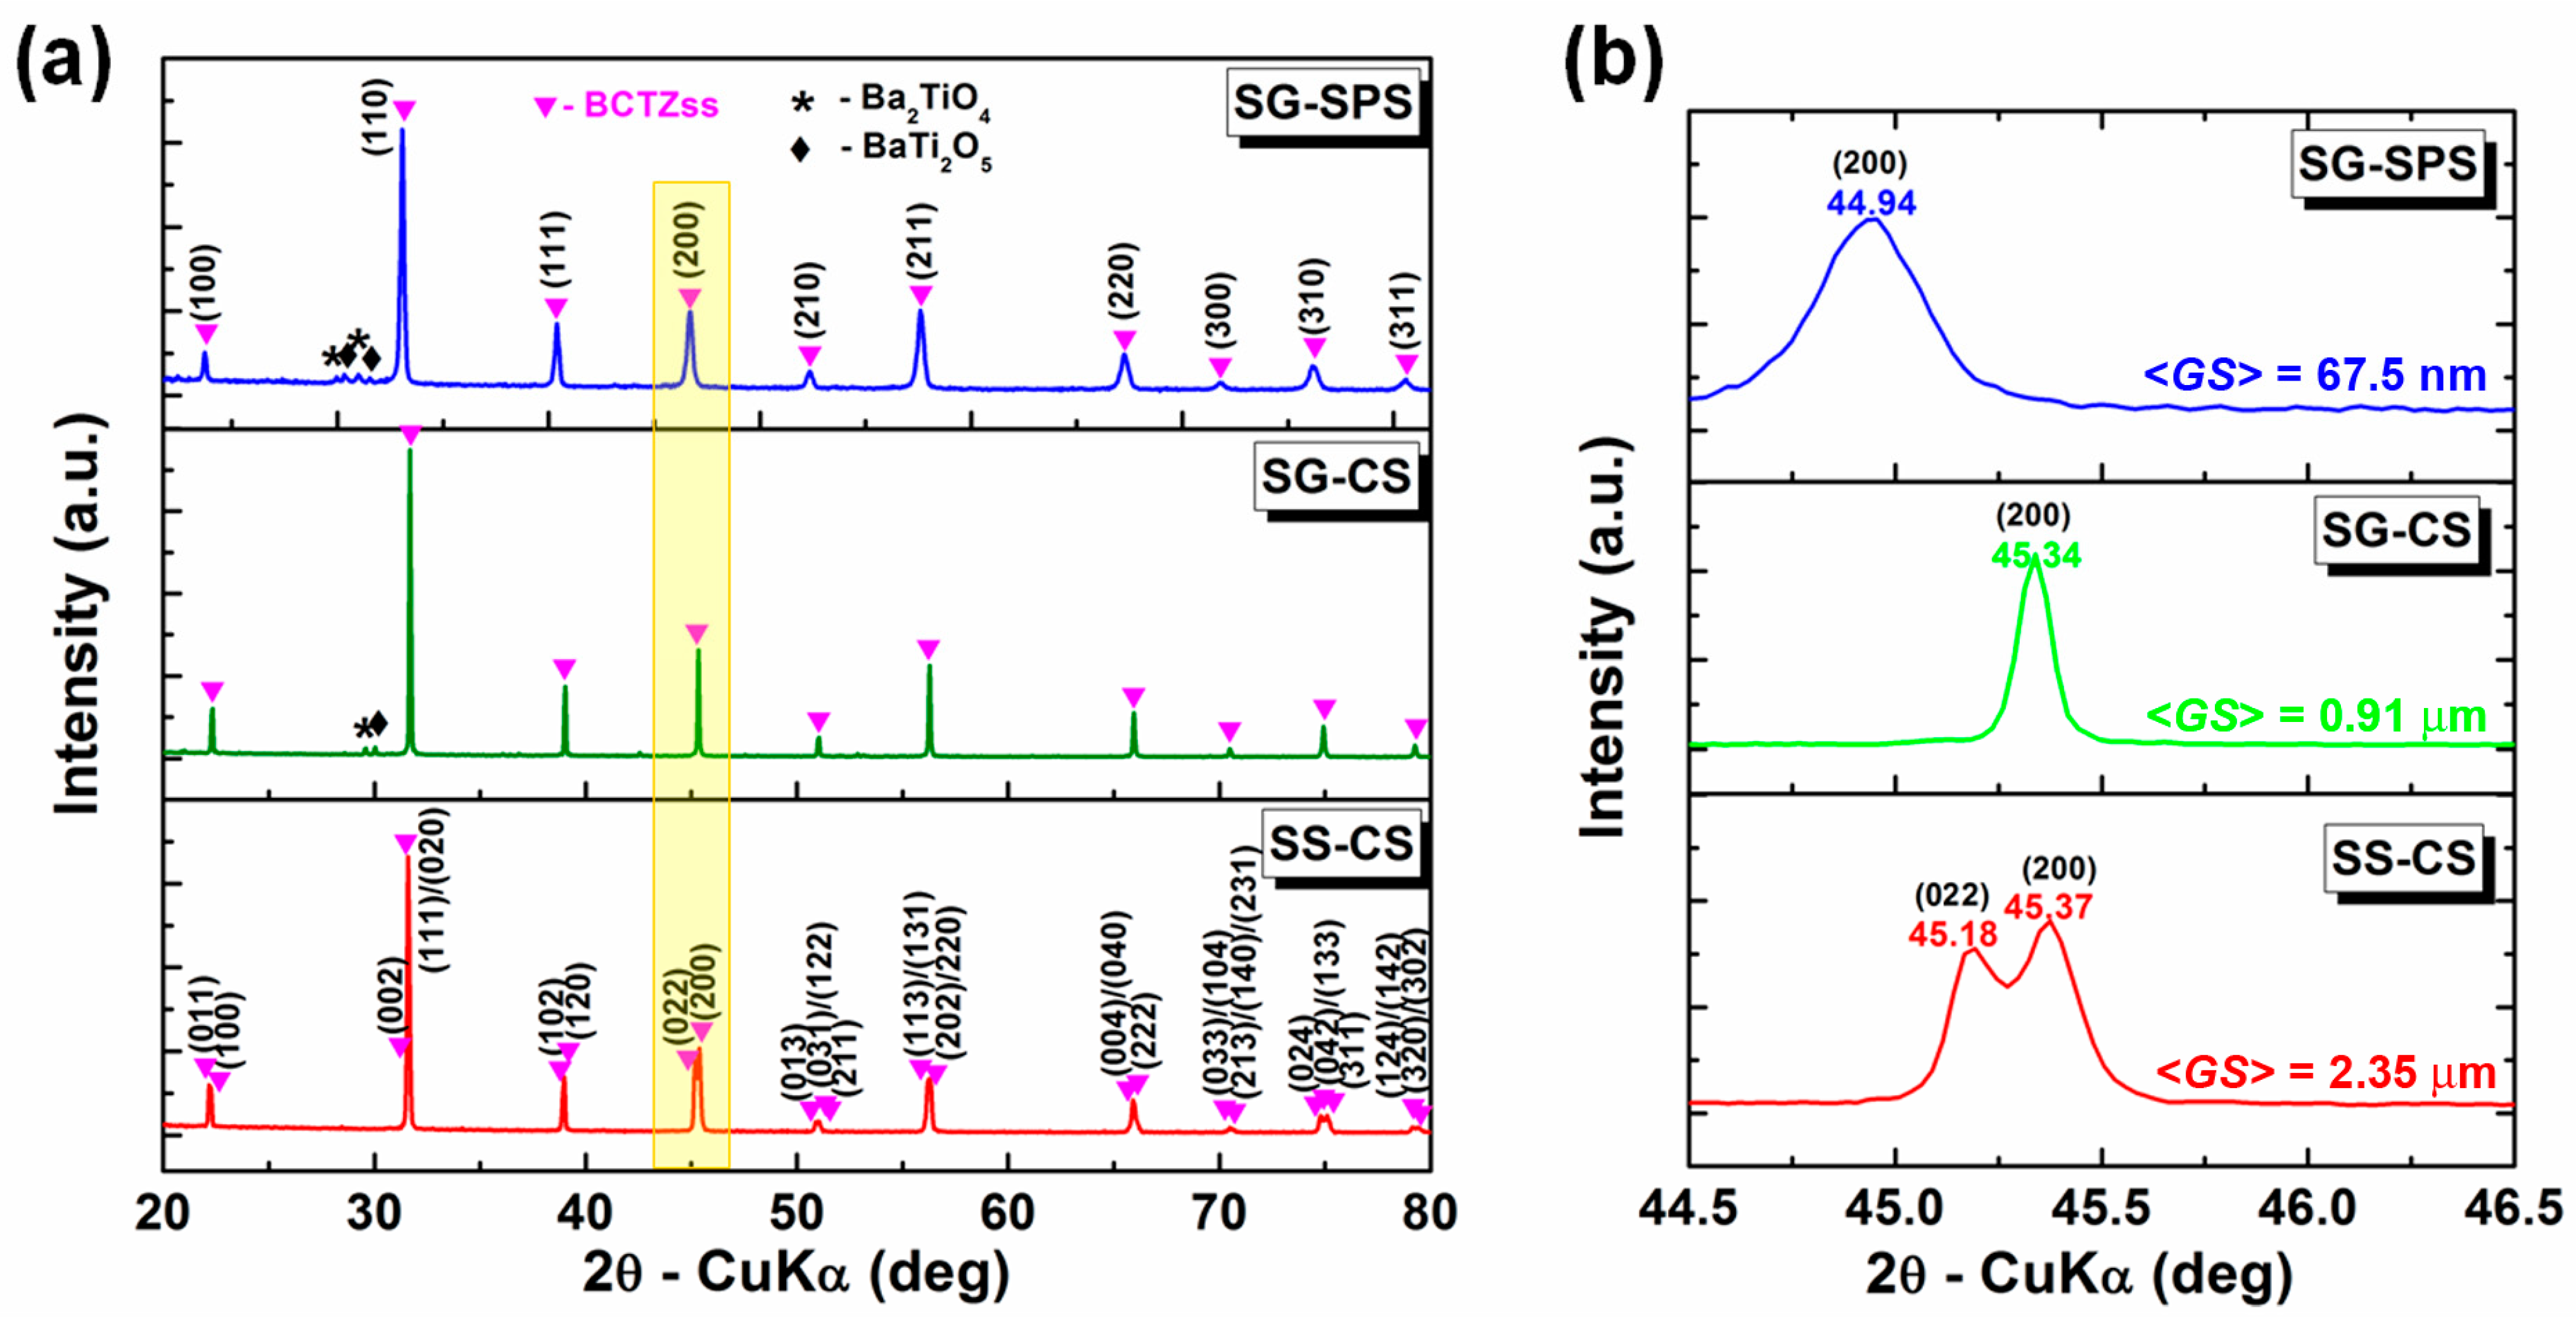
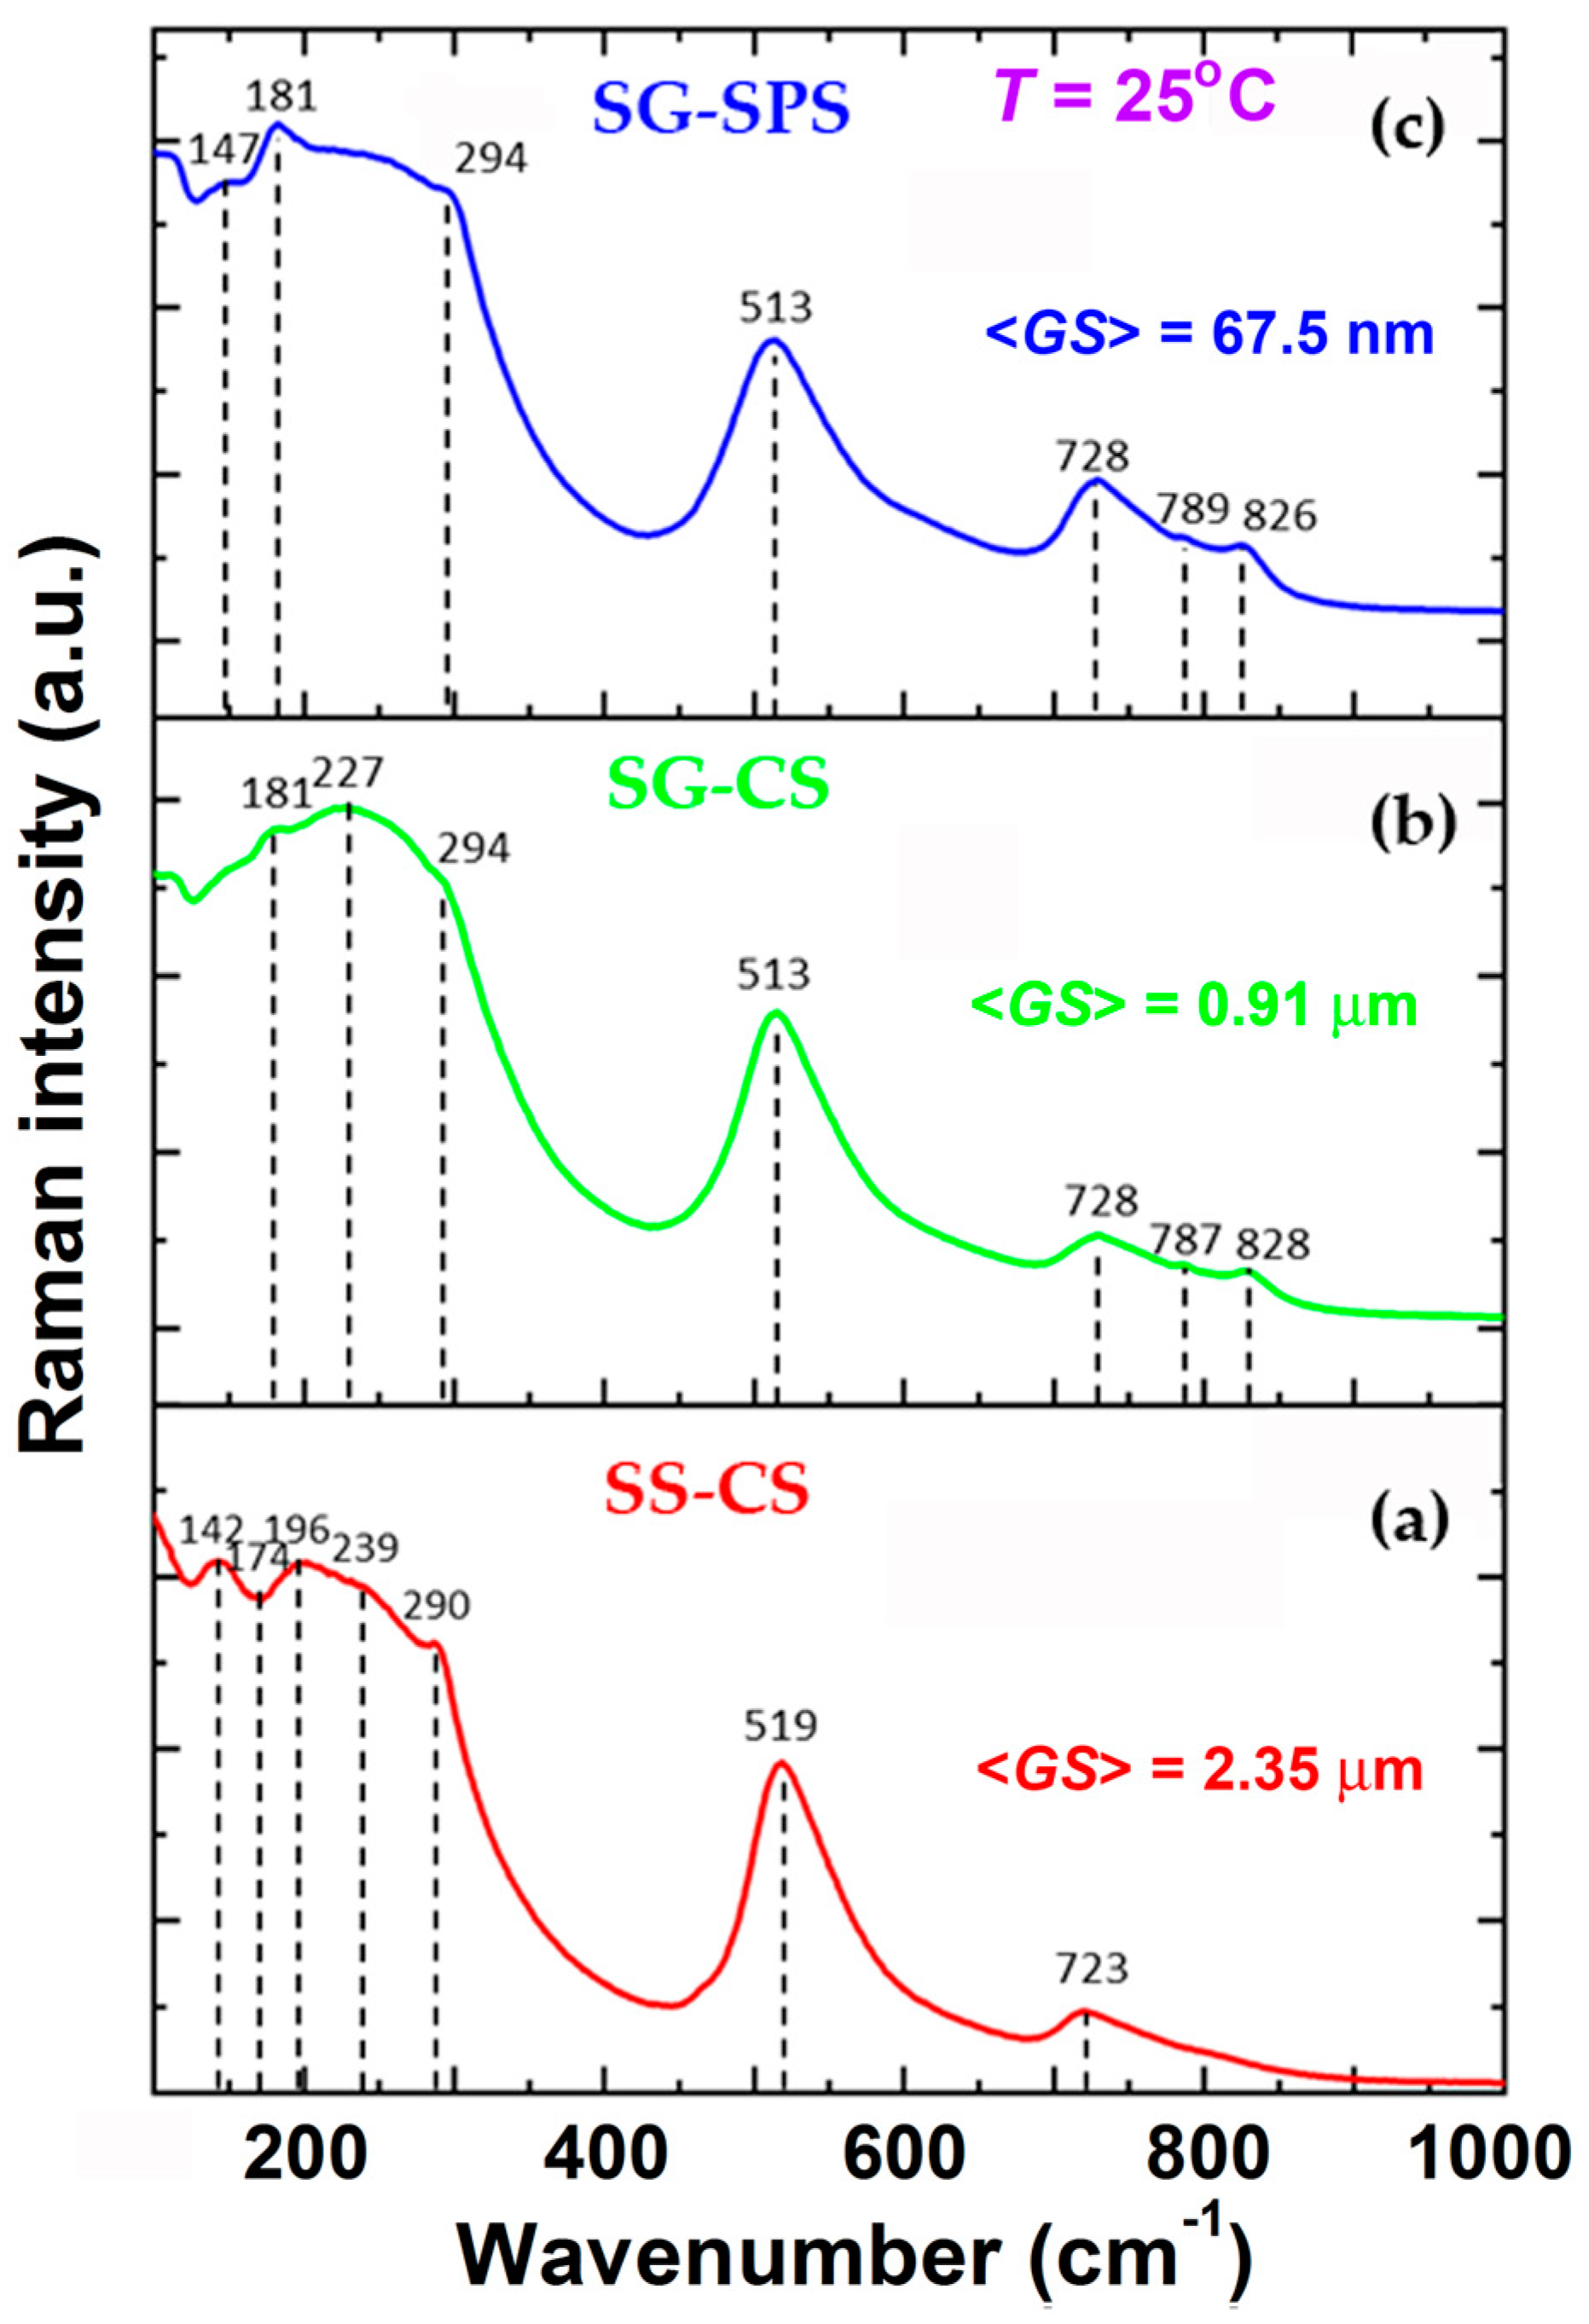
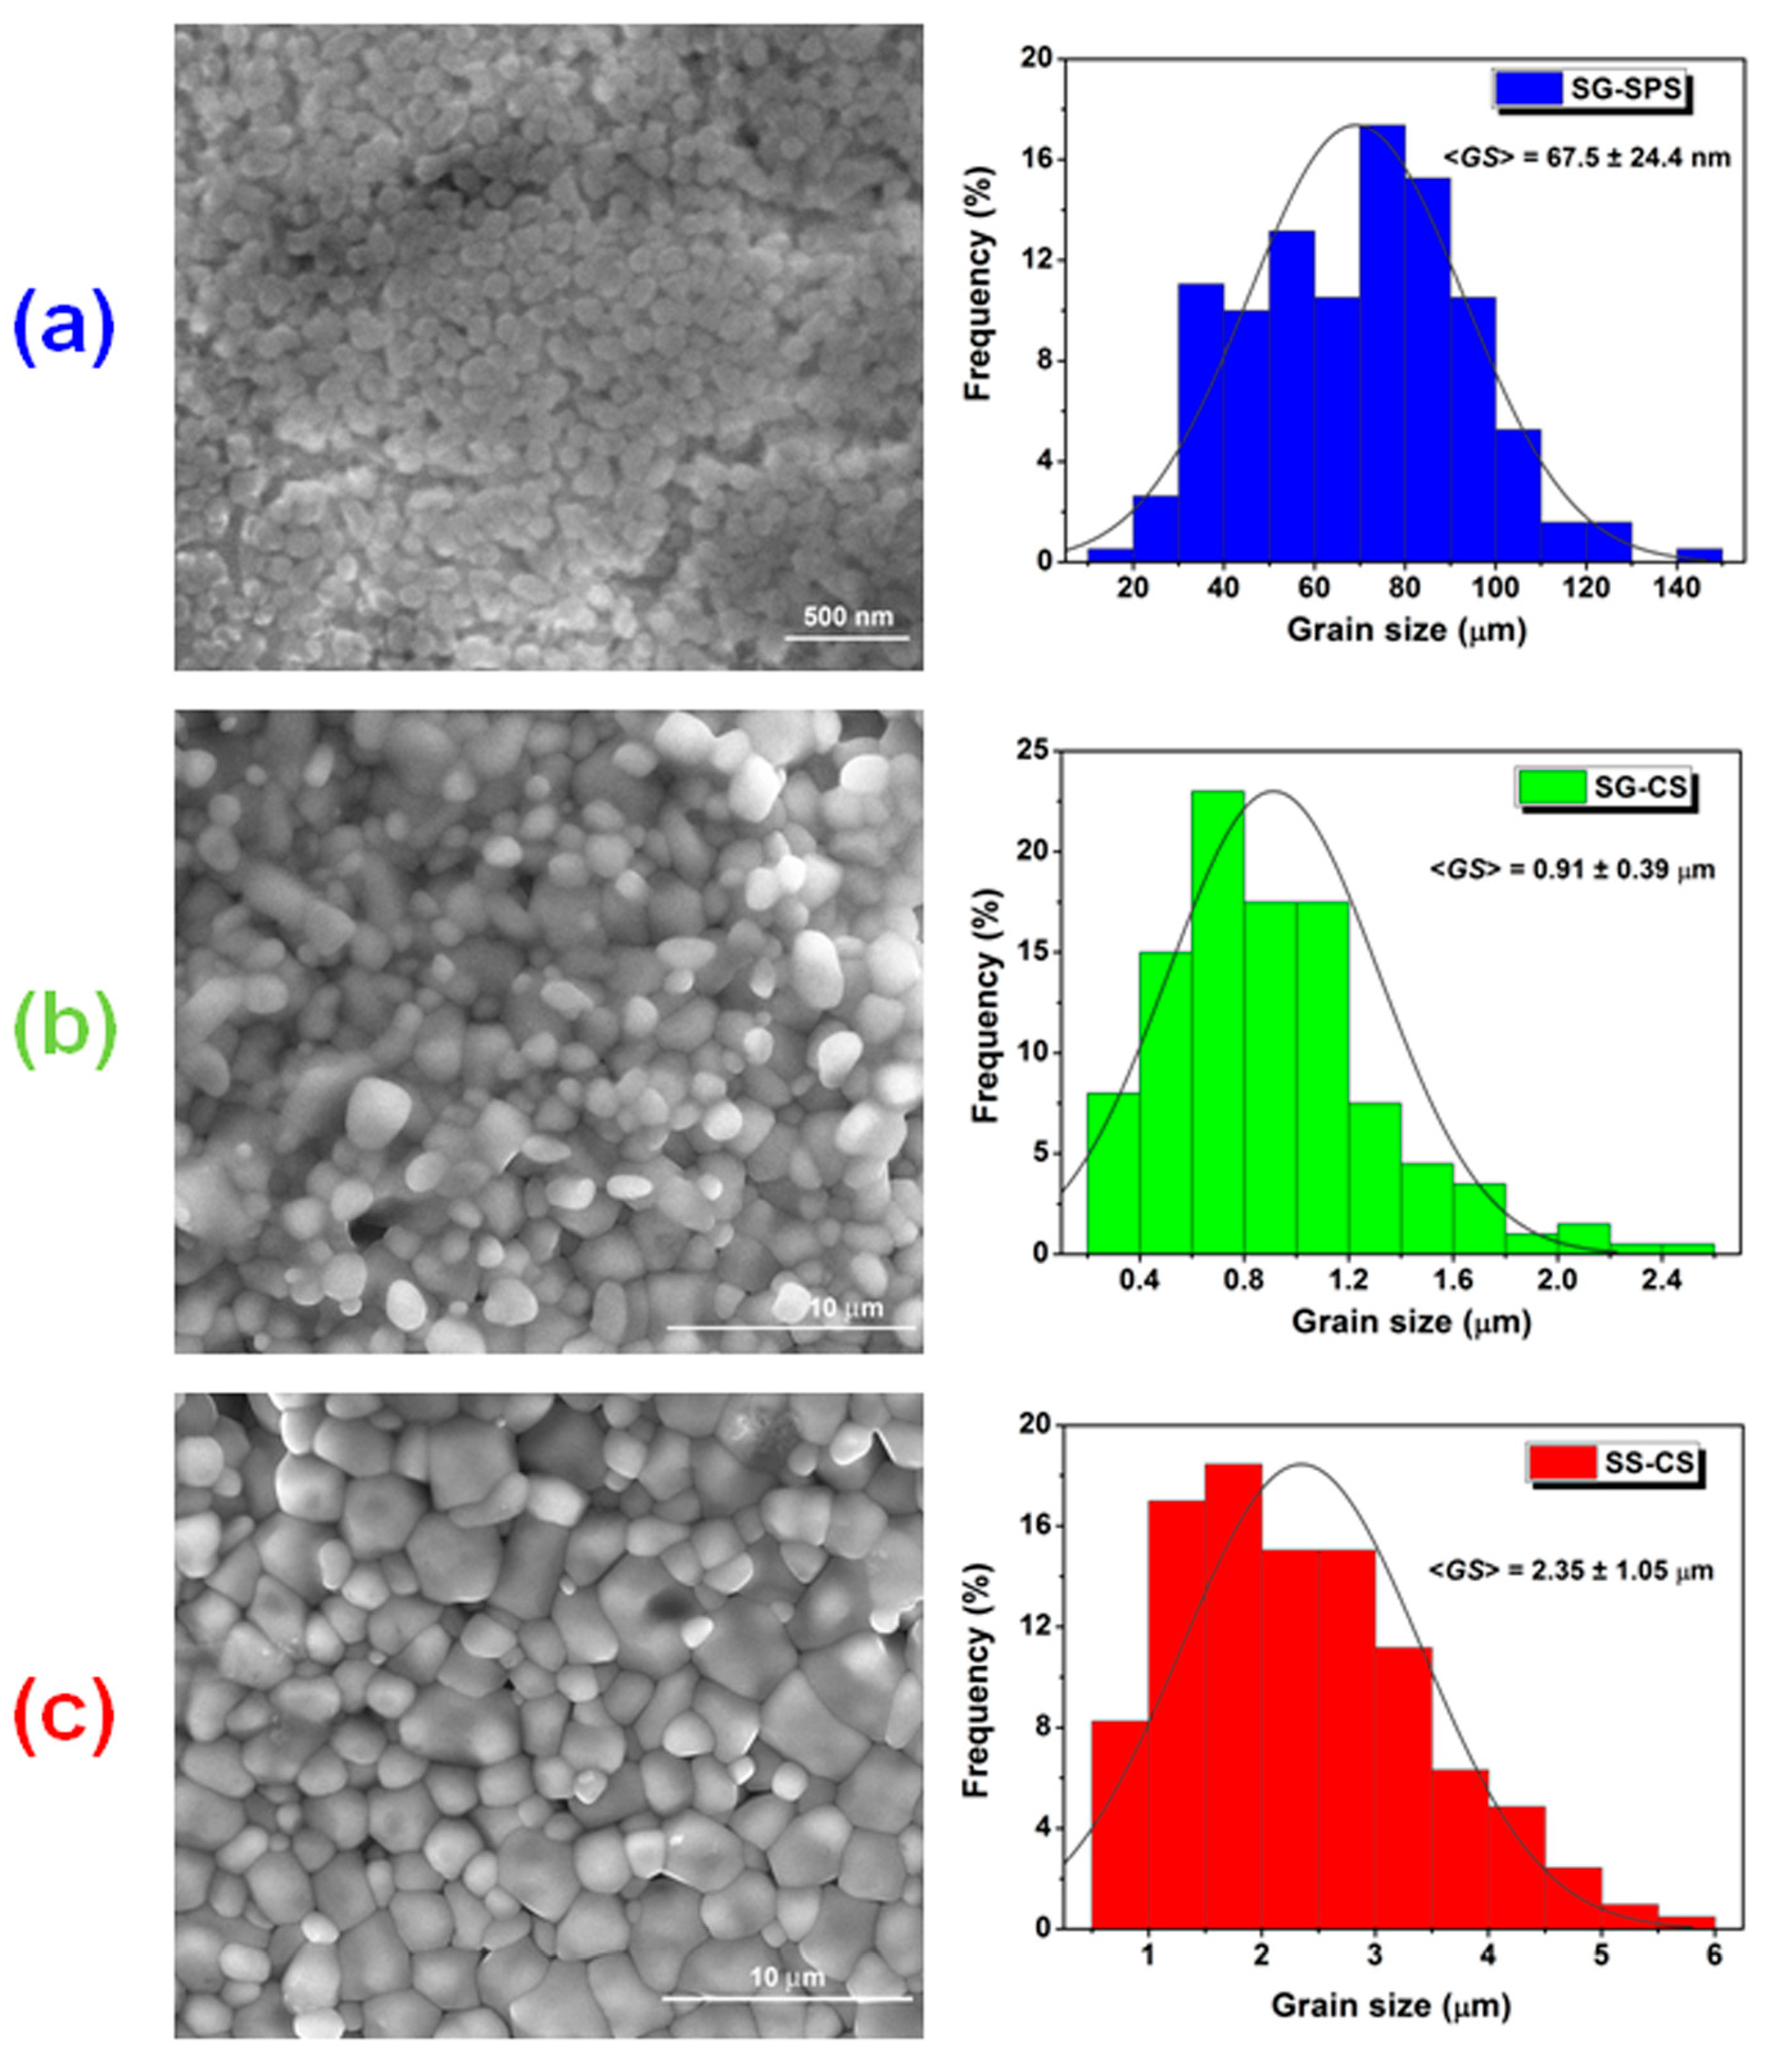
3.1. Phase Purity, Structural and Microstructural Characteristics
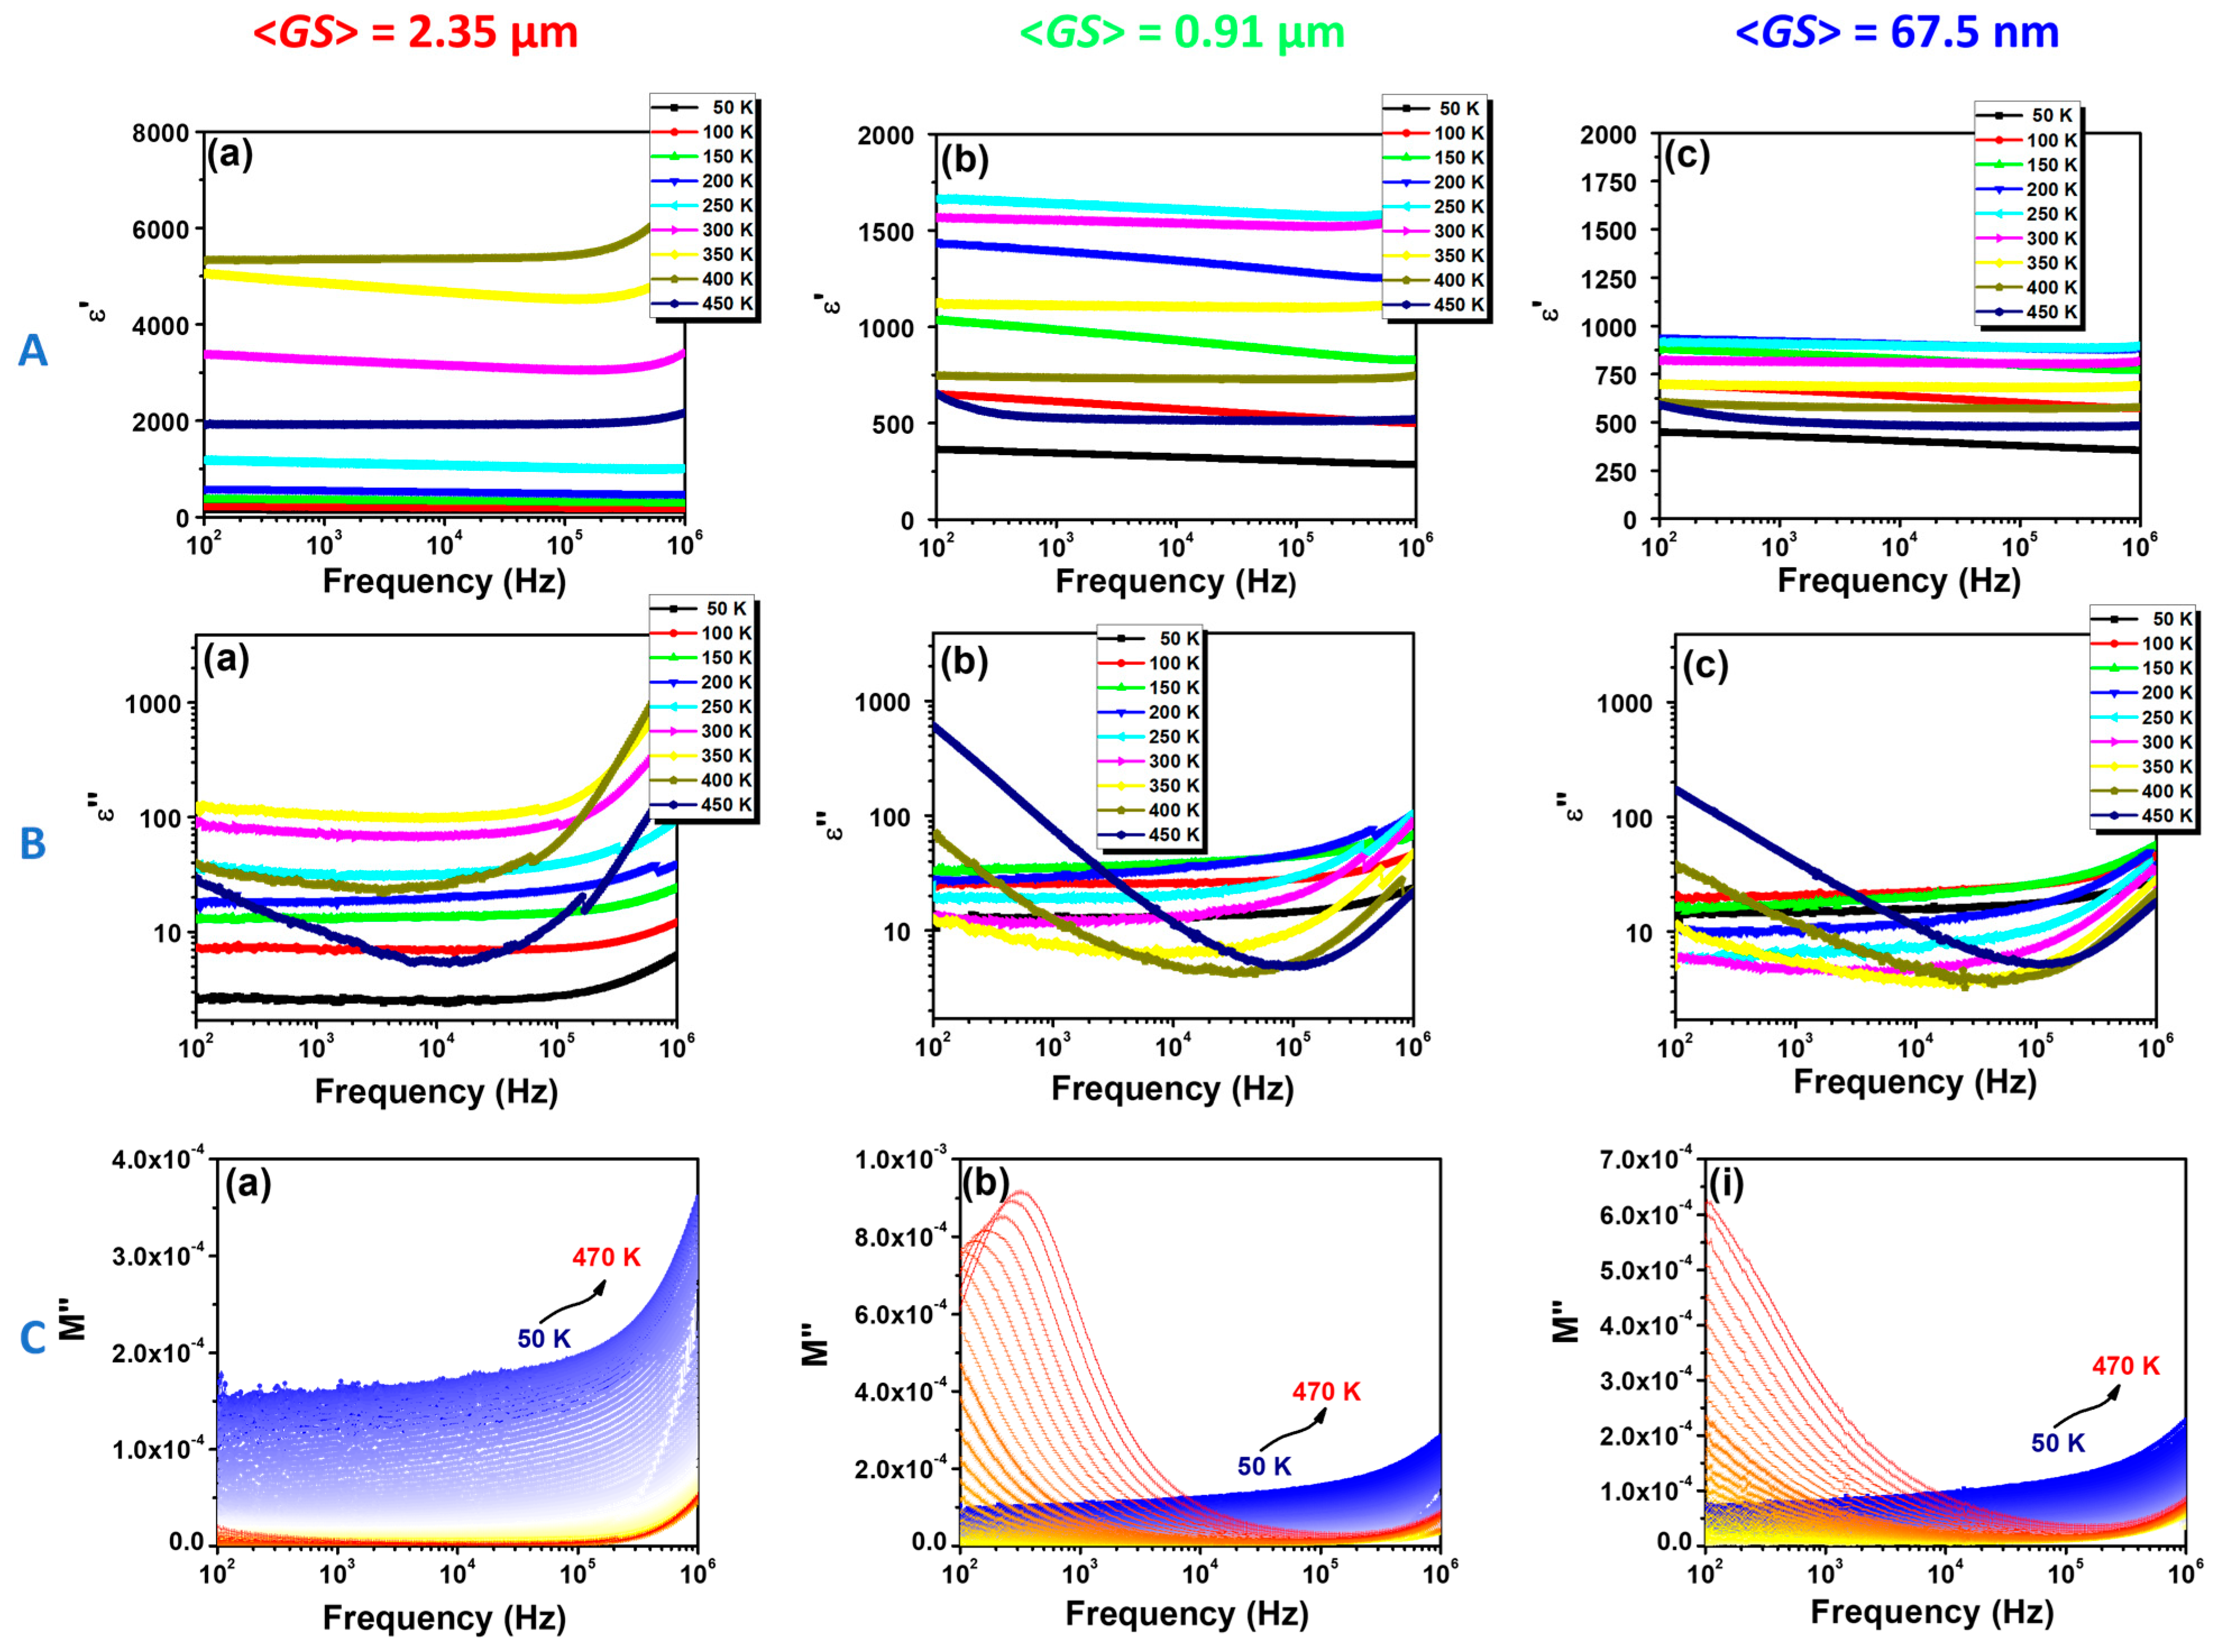
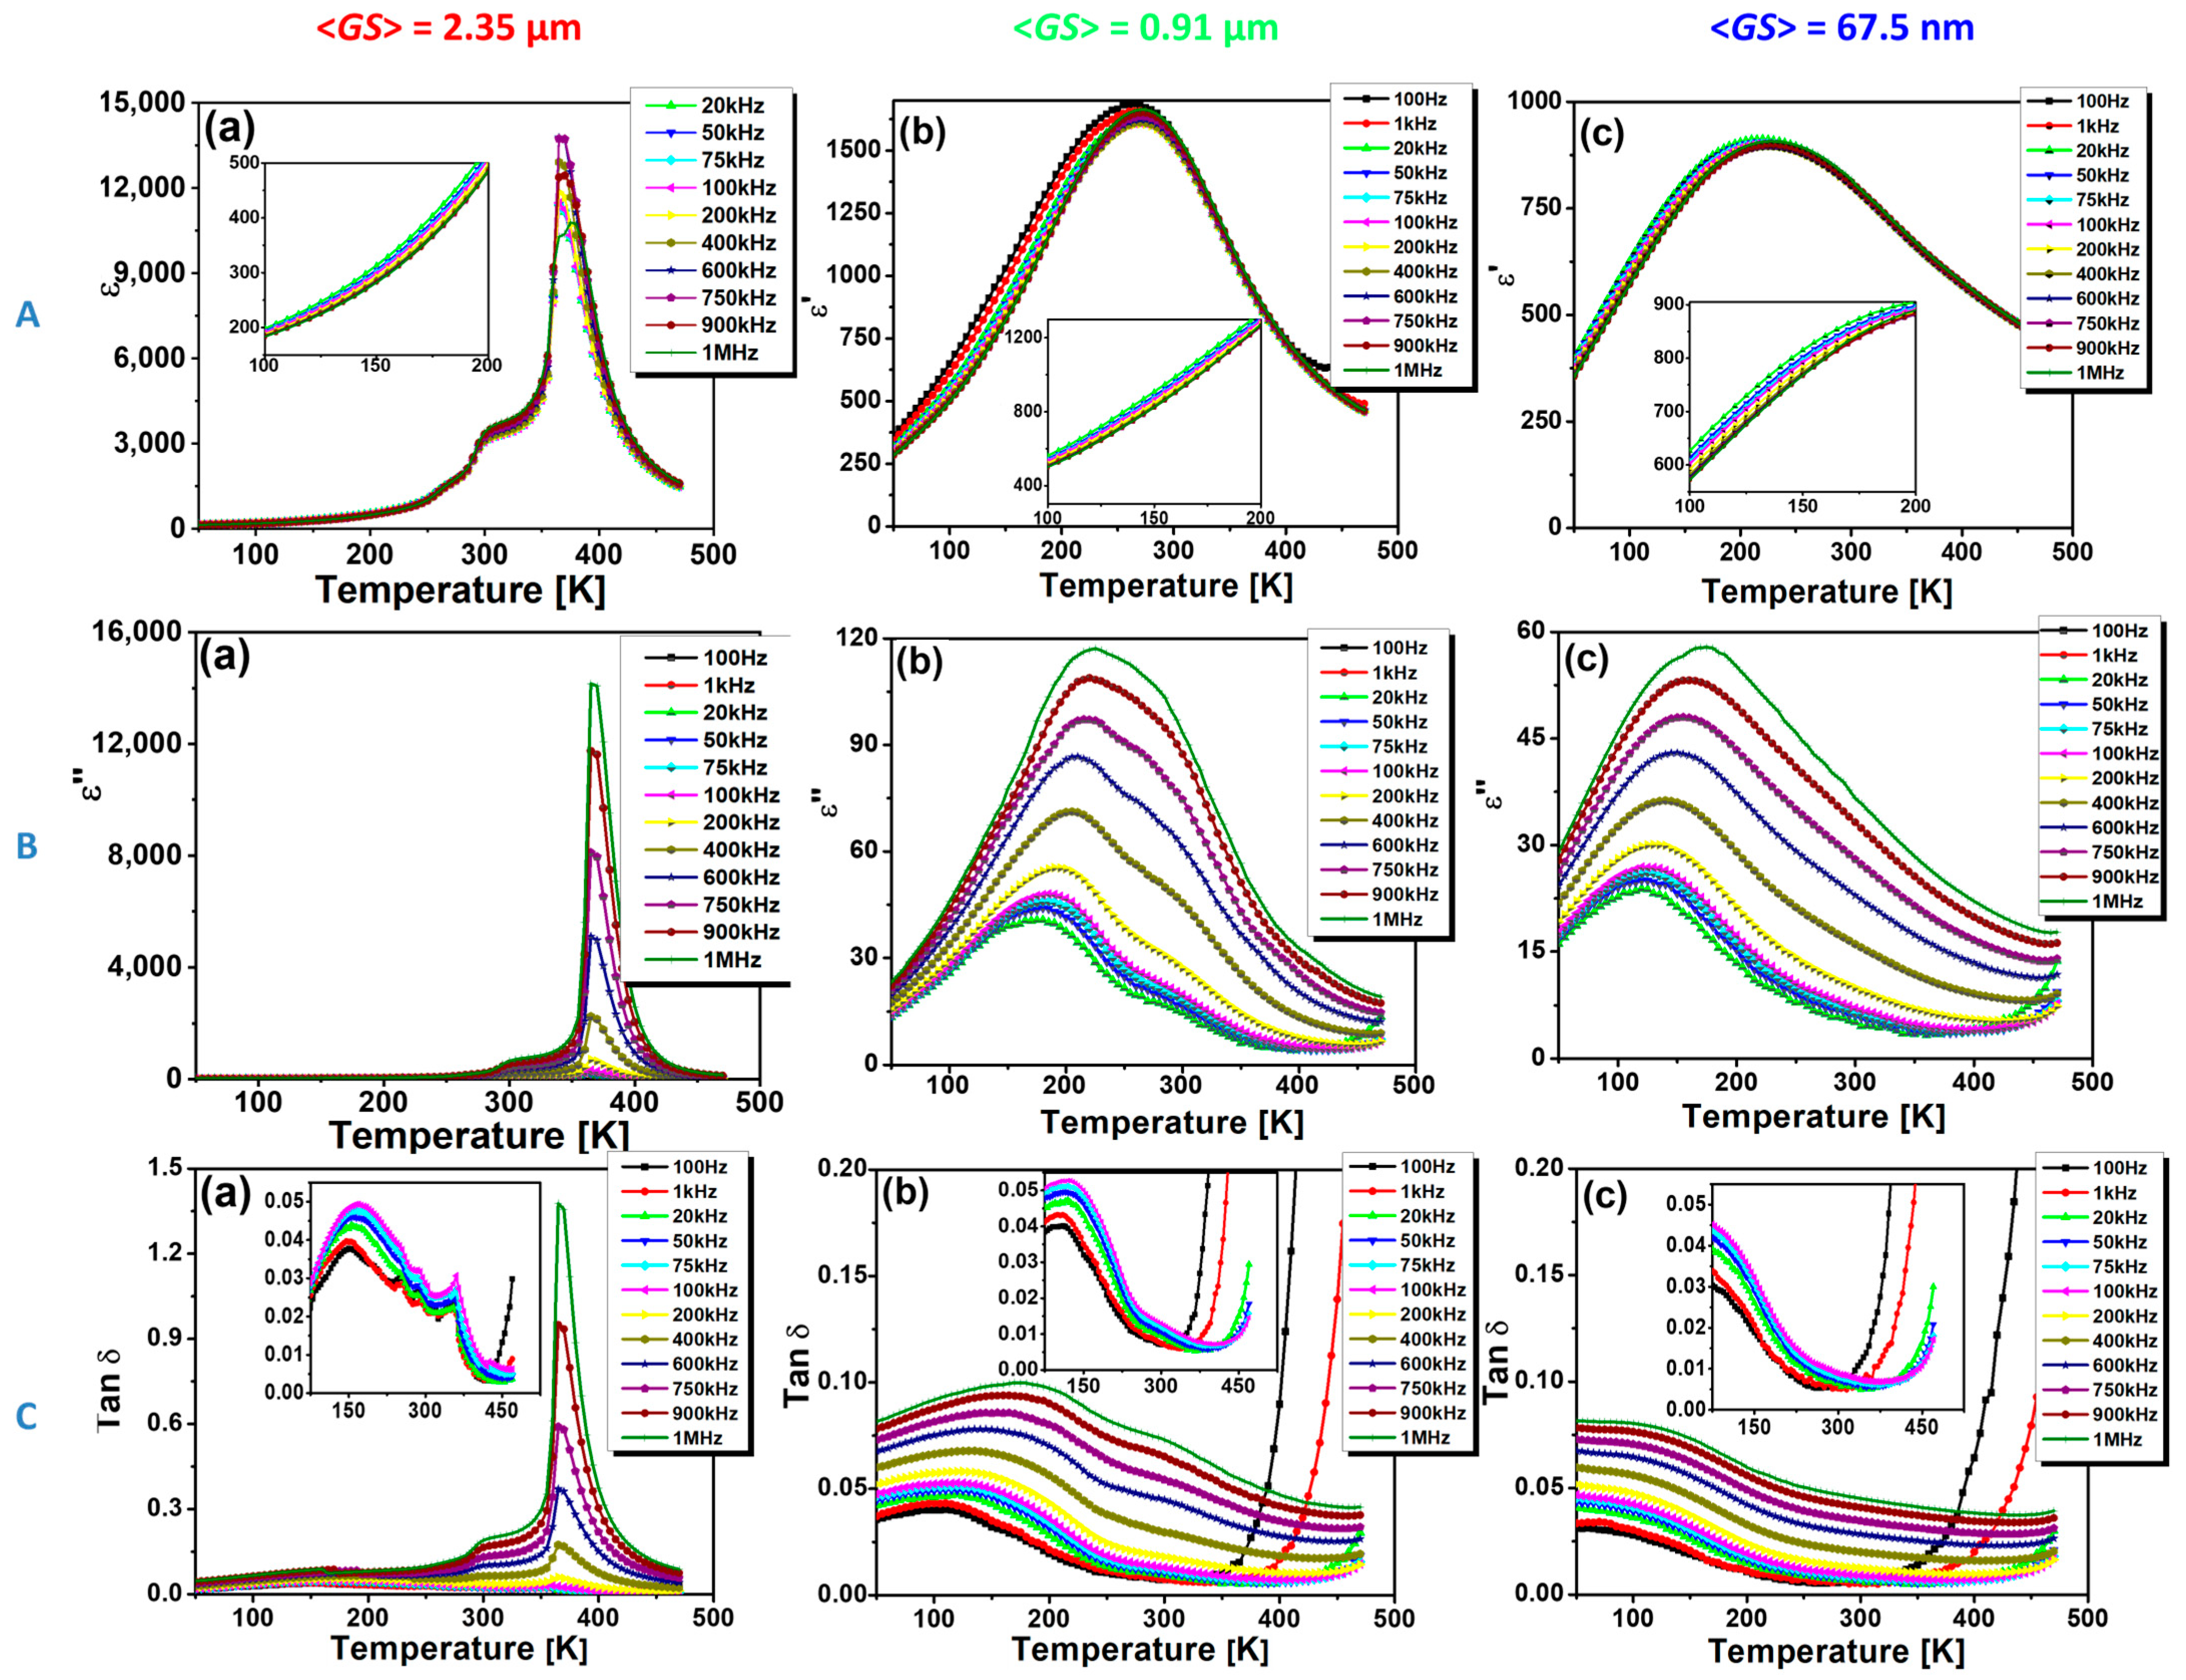
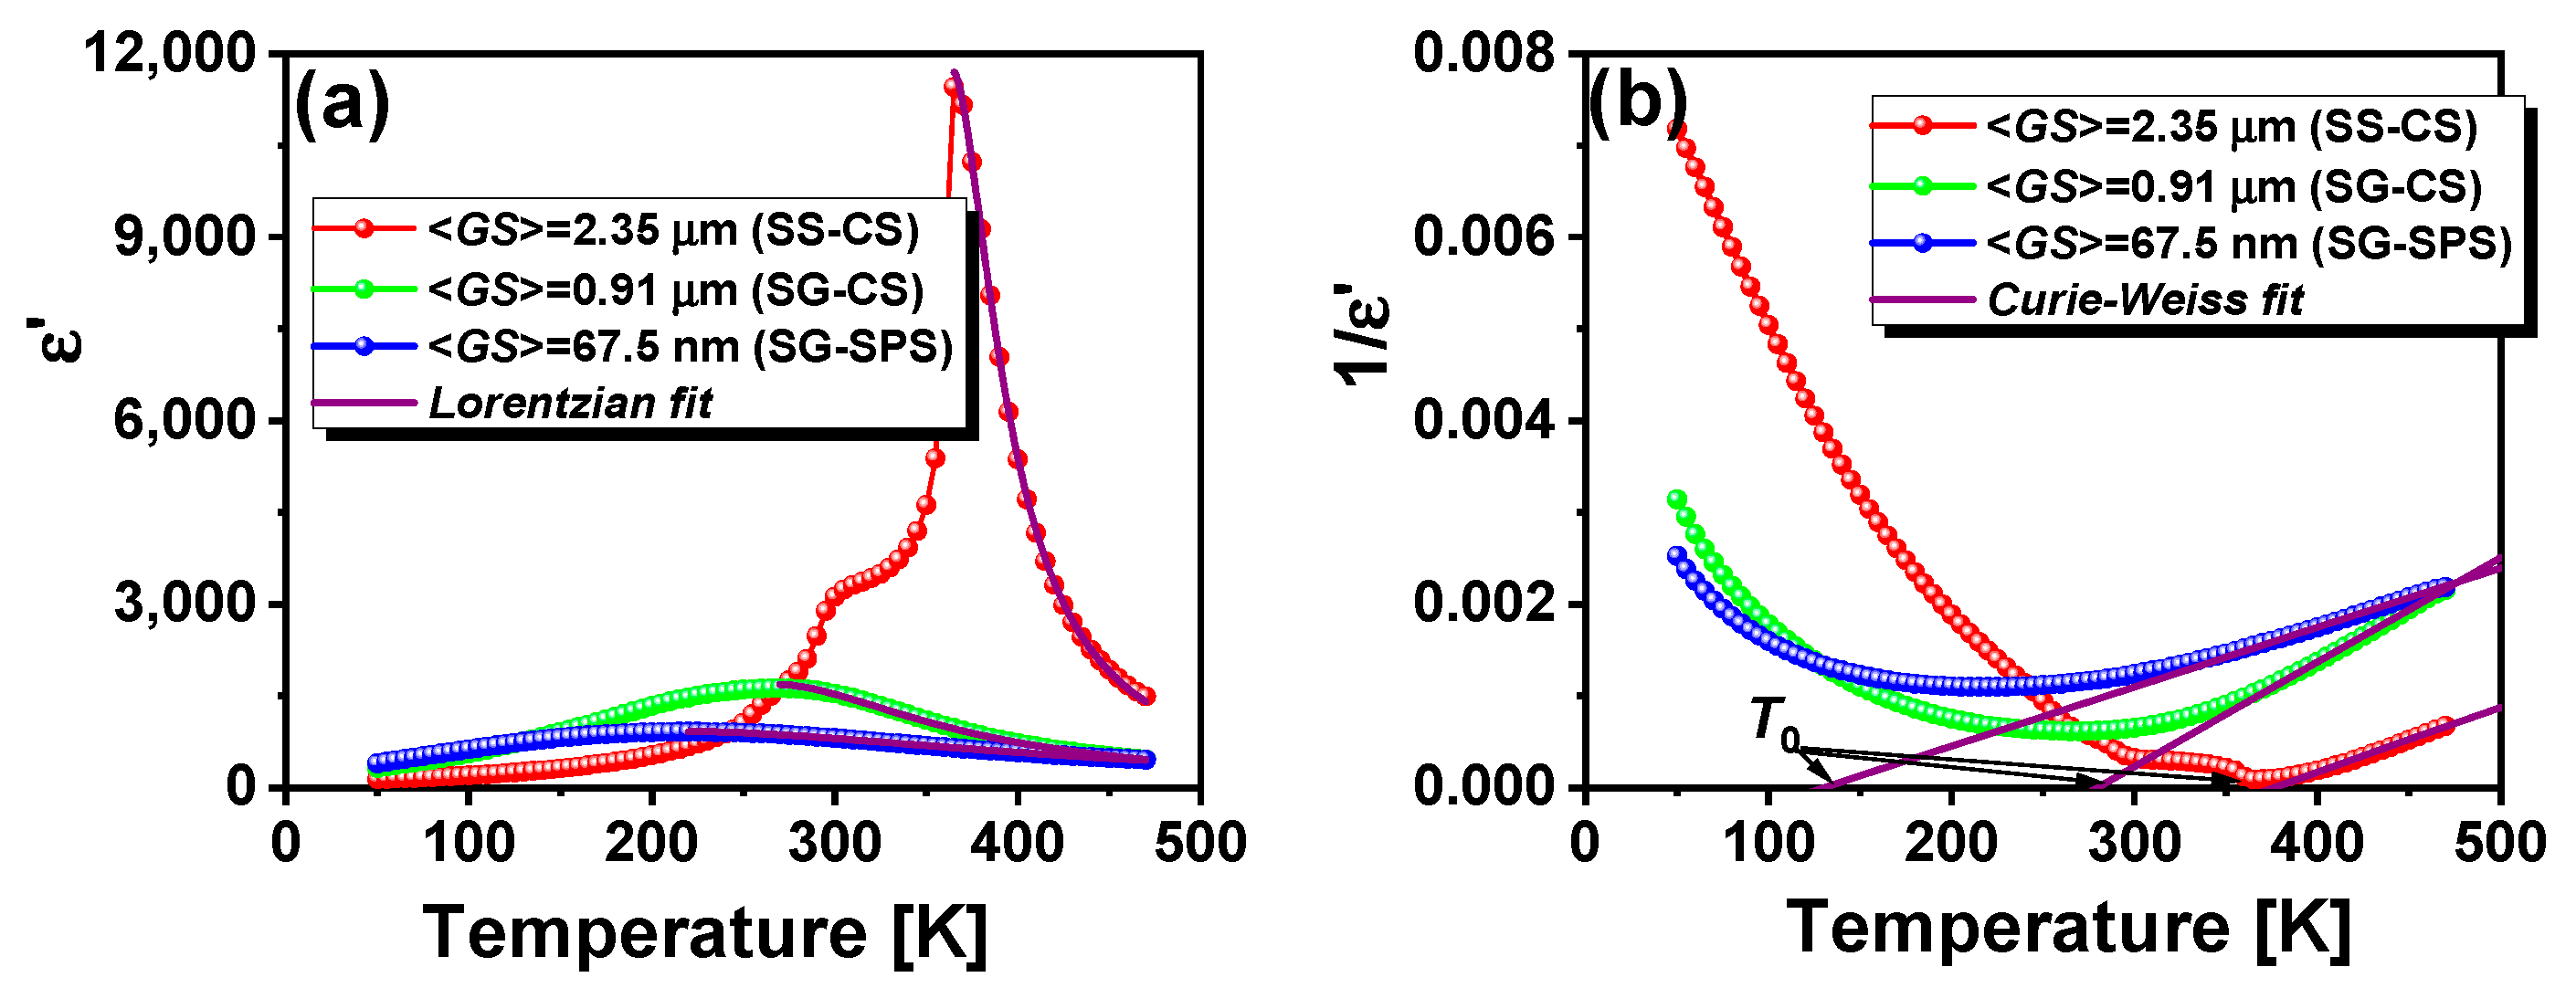
3.2. Low-Field Dielectric Properties
4. Conclusions
Author Contributions
Funding
Data Availability Statement
Acknowledgments
Conflicts of Interest
References
- Rae, A.; Chu, M.; Ganine, V. Barium titanate—Past, present and future. In Dielectric Ceramic Materials; Ceramic Transactions No. 100; Nair, K.M., Bhalla, A.S., Eds.; The American Ceramic Society: Westerville, OH, USA, 1999; pp. 1–12. [Google Scholar]
- Randall, C.A. Scientific and engineering issues of the state-of-the-art and future multilayer capacitors. J. Ceram. Soc. Jpn. 2001, 109, S2–S6. [Google Scholar] [CrossRef]
- Jain, A.; Wang, Y.G.; Shi, L.N. Recent developments in BaTiO3 based lead-free materials for energy storage applications. J. Alloys Compd. 2022, 928, 167066. [Google Scholar] [CrossRef]
- Jaffe, B.; Cook, W.R.; Jaffe, H. Piezoeletric Ceramics; Academic Press Inc.: Cambridge, MA, USA, 1971. [Google Scholar]
- Liu, W.; Ren, X. Large piezoelectric effect in Pb-free ceramics. Phys. Rev. Lett. 2009, 103, 257602. [Google Scholar] [CrossRef] [PubMed]
- Xue, D.; Gao, J.; Zhou, Y.; Ding, X.; Sun, J.; Lookman, T.; Ren, X. Phase transitions and phase diagram of Ba(Zr0.2Ti0.8)O3-x(Ba0.7Ca0.3)TiO3 Pb-free system by anelastic measurement. J. Appl. Phys. 2015, 117, 124107. [Google Scholar] [CrossRef]
- Zhang, L.; Zhang, M.; Wang, L.; Zhou, C.; Zhang, Z.; Yao, Y.; Zhang, L.; Xue, D.; Lou, X.; Ren, X. Phase transitions and the piezoelectricity around morphotropic phase boundary in Ba(Zr0.2Ti0.8)O3-x(Ba0.7Ca0.3)TiO3 lead-free solid solution. Appl. Phys. Lett. 2014, 105, 162908. [Google Scholar] [CrossRef]
- Keeble, D.S.; Benabdallah, F.; Thomas, P.A.; Maglione, M.; Kreisel, J. Revised structural phase diagram of (Ba0.7Ca 0.3TiO3)-(BaZr0.2Ti0.8O3). Appl. Phys. Lett. 2013, 102, 092903. [Google Scholar] [CrossRef]
- Xue, D.; Zhou, Y.; Bao, H.; Zhou, C.; Gao, J.; Ren, X. Elastic, piezoelectric, and dielectric properties of Ba(Zr 0.2Ti0.8)O3-50(Ba0.7Ca0.3)TiO3 Pb-free ceramic at the morphotropic phase boundary. J. Appl. Phys. 2011, 109, 054110. [Google Scholar] [CrossRef]
- Wu, J.; Xiao, D.; Wu, W.; Chen, Q.; Zhu, J.; Yang, Z.; Wang, J. Composition and poling condition-induced electrical behavior of (Ba0.85Ca0.15)(Ti1-xZrx)O 3 lead-free piezoelectric ceramics. J. Eur. Ceram. Soc. 2012, 32, 891–898. [Google Scholar] [CrossRef]
- Damjanovic, D.; Biancoli, A.; Batooli, L.; Vahabzadeh, A.; Trodahl, J. Elastic, dielectric, and piezoelectric anomalies and Raman spectroscopy of 0.5Ba(Ti0.8Zr0.2)O3-0.5(Ba0.7Ca0.3)TiO3. Appl. Phys. Lett. 2012, 100, 192907. [Google Scholar] [CrossRef]
- Tian, Y.; Wei, L.; Chao, X.; Liu, Z.; Yang, Z. Phase transition behavior and large piezoelectricity near the morphotropic phase boundary of lead-free (Ba0.85Ca0.15)(Zr0.1Ti0.9)O3 ceramics. J. Am. Ceram. Soc. 2013, 96, 496–502. [Google Scholar] [CrossRef]
- Acosta, M.; Novak, N.; Jo, W.; Rödel, J. Relationship between electromechanical properties and phase diagram in the Ba(Zr0.2Ti0.8)O3-x(Ba0.7Ca0.3)TiO3 lead-free piezoceramic. Acta Mater. 2014, 80, 48–55. [Google Scholar] [CrossRef]
- Zhang, Y.; Glaum, J.; Groh, C.; Ehmke, M.C.; Blendell, J.E.; Bowman, K.J.; Hoffman, M.J. Correlation between Piezoelectric Properties and Phase Coexistence in (Ba,Ca)(Ti,Zr)O3 Ceramics. J. Am. Ceram. Soc. 2014, 97, 2885–2891. [Google Scholar] [CrossRef]
- Bijalwan, V.; Tofel, P.; Erhart, J.; Maca, K. The complex evaluation of functional properties of nearly dense BCZT ceramics and their dependence on the grain size. Ceram. Int. 2019, 45, 317–326. [Google Scholar] [CrossRef]
- Srinivas, A.; Krishnaiah, R.V.; Niranjani, V.L.; Kamat, S.V.; Karthik, T.; Asthana, S. Ferroelectric, piezoelectric and mechanical properties in lead free (0.5)Ba(Zr0.2Ti0.8)O3-(0.5)(Ba0.7Ca0.3)TiO3 electroceramics. Ceram. Int. 2015, 41, 1980–1985. [Google Scholar] [CrossRef]
- Praveen, J.P.; Kumar, K.; James, A.R.; Karthik, T.; Asthana, S.; Das, D. Large piezoelectric strain observed in sol-gel derived BZT-BCT ceramics. Curr. Appl. Phys. 2014, 14, 396–402. [Google Scholar] [CrossRef]
- Coondoo, I.; Panwar, N.; Alikin, D.; Bdikin, I.; Islam, S.S.; Turygin, A.; Shur, V.Y.; Kholkin, A.L. A comparative study of structural and electrical properties in lead-free BCZT ceramics: Influence of the synthesis method. Acta Mater. 2018, 155, 331–342. [Google Scholar] [CrossRef]
- Puli, V.S.; Kumar, A.; Chrisey, D.B.; Tomozawa, M.; Scott, J.F.; Katiyar, R.S. Barium zirconate-titanate/barium calcium-titanate ceramics via sol-gel process: Novel high-energy-density capacitors. J. Phys. D Appl. Phys. 2011, 44, 395403. [Google Scholar] [CrossRef]
- Ji, W.; Fang, B.; Lu, X.; Zhang, S.; Yuan, N.; Ding, J. Tailoring structure and performance of BCZT ceramics prepared via hydrothermal method. Phys. B Condens. Matter 2019, 567, 65–78. [Google Scholar] [CrossRef]
- Ji, X.; Wang, C.; Harumoto, T.; Zhang, S.; Tu, R.; Shen, Q.; Shi, J. Structure and electrical properties of BCZT ceramics derived from microwave-assisted sol–gel-hydrothermal synthesized powders. Sci. Rep. 2020, 10, 20352. [Google Scholar] [CrossRef]
- Chen, X.; Peng, Z.; Chao, X.; Yang, Z. Structure, electrical properties and reaction mechanism of (Ba0.85Ca0.15)(Zr0.1Ti0.9)O3 ceramics synthesized by the molten salt method. Ceram. Int. 2017, 43, 11920–11928. [Google Scholar] [CrossRef]
- Orlik, K.; Lorgouilloux, Y.; Marchet, P.; Thuault, A.; Jean, F.; Rguiti, M.; Courtois, C. Influence of microwave sintering on electrical properties of BCTZ lead free piezoelectric ceramics. J. Eur. Ceram. Soc. 2020, 40, 1212–1216. [Google Scholar] [CrossRef]
- Li, S.B.; Wang, C.B.; Ji, X.; Shen, Q.; Zhang, L.M. Effect of composition fluctuation on structural and electrical properties of BZT-xBCT ceramics prepared by Plasma Activated Sintering. J. Eur. Ceram. Soc. 2017, 37, 2067–2072. [Google Scholar] [CrossRef]
- Li, S.B.; Zhang, L.M.; Wang, C.B.; Ji, X.; Shen, Q. Structural, dielectric and ferroelectric properties of lead-free Ba0.85Ca0.15Zr0.10Ti0.90O3 ceramics prepared by Plasma Activated Sintering. Ceram. Int. 2016, 42, 18585–18591. [Google Scholar] [CrossRef]
- Mane, S.M.; Tirmali, P.M.; Kulkarni, S.B. Hybrid microwave sintering and shifting of Tc in lead-free ferroelectric composition x(Ba0.7Ca0.3TiO3)-(1-x)(BaZr0.2Ti0.8O3). Mater. Chem. Phys. 2018, 213, 482–491. [Google Scholar] [CrossRef]
- Hao, J.; Bai, W.; Li, W.; Zhai, J. Correlation between the microstructure and electrical properties in high-performance (Ba0.85Ca0.15)(Zr0.1Ti 0.9)O3 lead-free piezoelectric ceramics. J. Am. Ceram. Soc. 2012, 95, 1998–2006. [Google Scholar] [CrossRef]
- Chen, H.; Yin, Z.; Hao, X.; Yuan, J. Microstructure and electrical properties of xY2O3-(1-x)LaCrO3 thermosensitive ceramics prepared by spark plasma sintering. Ceram. Int. 2021, 47, 26447–26454. [Google Scholar] [CrossRef]
- Zhao, Z.; Buscaglia, V.; Viviani, M.; Buscaglia, M.T.; Mitoseriu, L.; Testino, A.; Nygren, M.; Johnsson, M.; Nanni, P. Grain-size effects on the ferroelectric behavior of dense nanocrystalline BaTiO3 ceramics. Phys. Rev. B-Condens. Matter Mater. Phys. 2004, 70, 024107. [Google Scholar] [CrossRef]
- Buscaglia, M.T.; Viviani, M.; Buscaglia, V.; Mitoseriu, L.; Testino, A.; Nanni, P.; Zhao, Z.; Nygren, M.; Harnagea, C.; Piazza, D.; et al. High dielectric constant and frozen macroscopic polarization in dense nanocrystalline BaTiO3 ceramics. Phys. Rev. B-Condens. Matter Mater. Phys. 2006, 73, 064114. [Google Scholar] [CrossRef]
- Deng, X.; Wang, X.; Wen, H.; Kang, A.; Gui, Z.; Li, L. Phase transitions in nanocrystalline barium titanate ceramics prepared by spark plasma sintering. J. Am. Ceram. Soc. 2006, 89, 1059–1064. [Google Scholar] [CrossRef]
- Curecheriu, L.; Balmus, S.B.; Buscaglia, M.T.; Buscaglia, V.; Ianculescu, A.; Mitoseriu, L. Grain size-dependent properties of dense nanocrystalline barium titanate ceramics. J. Am. Ceram. Soc. 2012, 95, 3912–3921. [Google Scholar] [CrossRef]
- Buscaglia, V.; Randall, C.A. Size and scaling effects in barium titanate. An overview. J. Eur. Ceram. Soc. 2020, 40, 3744–3758. [Google Scholar] [CrossRef]
- Zhai, Y.; Xie, X.; Zhou, R.; Li, X.; Liu, X.; Liu, S. High performance room temperature ferroelectric barium strontium titanate ceramics by spark-plasma-sintering ultrafine nanocrystals. Ceram. Int. 2019, 45, 15526–15531. [Google Scholar] [CrossRef]
- Botea, M.; Pintilie, I.; Surdu, V.-A.; Stanciu, C.-A.; Truşcă, R.-D.; Vasile, B.Ş.; Patru, R.; Ianculescu, A.-C.; Pintilie, L. Structural, functional properties and enhanced thermal stability of bulk graded (Ba,Sr)TiO3 structures obtained by spark plasma sintering. J. Mater. Res. Technol. 2021, 12, 2085–2103. [Google Scholar] [CrossRef]
- Pătru, R.E.; Stanciu, C.A.; Soare, E.M.; Surdu, V.-A.; Truşcă, R.D.; Nicoară, A.I.; Vasile, B.Ş.; Boni, G.; Amarande, L.; Horchidan, N.; et al. Grain size-driven effect on the functional properties in Ba0.6Sr0.4TiO3 ceramics consolidated by spark plasma sintering. J. Eur. Ceram. Soc. 2023, 43, 3250–3265. [Google Scholar] [CrossRef]
- Maiwa, H. Structure and properties of Ba(Zr0.2Ti0.8)O3 ceramics prepared by spark plasma sintering. J. Mater. Sci. 2008, 43, 6385–6390. [Google Scholar] [CrossRef]
- Harizanov, O.A. Formation and crystallization of an acetate-acetylacetonate derived sol-gel BaTiO3. Mater. Lett. 1998, 34, 345–350. [Google Scholar] [CrossRef]
- Scalabrin, A.; Chaves, A.S.; Shim, D.S.; Porto, S.P.S. Temperature dependence of the A1 and E optical phonons in BaTiO3. Phys. Status Solidi 1977, 79, 731–742. [Google Scholar] [CrossRef]
- Takeuchi, T.; Capiglia, C.; Balakrishnan, N.; Takeda, Y.; Kageyama, H. Preparation of fine-grained BaTiO3 ceramics by spark plasma sintering. J. Mater. Res. 2002, 17, 575–581. [Google Scholar] [CrossRef]
- Frey, M.; Payne, D. Grain-size effect on structure and phase transformations for barium titanate. Phys. Rev. B-Condens. Matter Mater. Phys. 1996, 54, 3158–3168. [Google Scholar] [CrossRef]
- Didomenico, M.; Wemple, S.H.; Porto, S.P.S.; Bauman, R.P. Raman spectrum of single-domain BaTiO3. Phys. Rev. 1968, 174, 522–530. [Google Scholar] [CrossRef]
- Molak, A.; Paluch, M.; Pawlus, S.; Klimontko, J.; Ujma, Z.; Gruszka, I. Electric modulus approach to the analysis of electric relaxation in highly conducting (Na0.75Bi0.25)(Mn0.25Nb0.75)O3 ceramics. J. Phys. D Appl. Phys. 2005, 38, 1450–1460. [Google Scholar] [CrossRef]
- Zhou, Y.; Lin, Q.; Liub, W.; Wang, D. Compositional dependence of electrocaloric effect in lead-free (1−x)Ba(Zr0.2Ti0.8)O3–x(Ba0.7Ca0.3)TiO3 ceramics. RSC Adv. 2016, 6, 14084–14089. [Google Scholar] [CrossRef]
- Deluca, M.; Vasilescu, C.A.; Ianculescu, A.C.; Berger, D.C.; Ciomaga, C.E.; Curecheriu, L.P.; Stoleriu, L.; Gajovic, A.; Mitoseriu, L.; Galassi, C. Investigation of the composition-dependent properties of BaTi1-xZrxO3 ceramics prepared by the modified Pechini method. J. Eur. Ceram. Soc. 2012, 32, 3551–3566. [Google Scholar] [CrossRef]
- Ke, S.; Fan, H.; Huang, H.; Chan, H.L.W.; Yu, S. Dielectric dispersion behavior of Ba (ZrxTi1-x)O3 solid solutions with a quasiferroelectric state. J. Appl. Phys. 2008, 104, 034108. [Google Scholar] [CrossRef]
- Arlt, G.; Hennings, D.; De With, G. Dielectric properties of fine-grained barium titanate ceramics. J. Appl. Phys. 1985, 58, 1619–1625. [Google Scholar] [CrossRef]
- Zhang, L.; Zhong, W.L.; Wang, Y.G.; Zhang, P.L. The cell volume effect in barium strontium titanate. Solid State Commun. 1997, 104, 263–266. [Google Scholar] [CrossRef]
- Tang, X.G.; Wang, J.; Wang, X.X.; Chan, H.L.W. Effects of grain size on the dielectric properties and tunabilities of sol-gel derived Ba(Zr0.2Ti0.8)O3 ceramics. Solid State Commun. 2004, 131, 163–168. [Google Scholar] [CrossRef]
- Lines, M.E.; Glass, A.M. Principles and Applications of Ferroelectrics and Related Materials; Oxford University Press: Oxford, UK, 2001. [Google Scholar]
- Cross, L.E. Relaxor ferroelectrics: An overview. Ferroelectrics 1994, 151, 305–320. [Google Scholar] [CrossRef]
- Uchino, K.; Nomura, S. Critical Exponents of the Dielectric Constants in Diffused-Phase-Transition Crystals. Ferroelectr. Lett. 1982, 44, 55–61. [Google Scholar] [CrossRef]
- Santos, I.A.; Eiras, J.A. Phenomenological description of the diffuse phase transition in ferroelectrics. J. Phys. Condens. Matter 2001, 13, 11733–11740. [Google Scholar] [CrossRef]
- Emelyanov, A.Y.; Pertsev, N.A.; Hoffmann-Eifert, S.; Böttger, U.; Waser, R. Grain-boundary effect on the Curie-Weiss law of ferroelectric ceramics and polycrystalline thin films: Calculation by the method of effective medium. J. Electroceramics 2002, 9, 5–16. [Google Scholar] [CrossRef]
- Tang, X.G.; Chan, H.L.W. Effect of grain size on the electrical properties of (Ba,Ca)(Zr,Ti)O3 relaxor ferroelectric ceramics. J. Appl. Phys. 2005, 97, 034109. [Google Scholar] [CrossRef]
- Fang, T.-T.; Hsieh, H.-L.; Shiau, F.-S. Effects of Pore Morphology and Grain Size on the Dielectric Properties and Tetragonal–Cubic Phase Transition of High-Purity Barium Titanate. J. Am. Ceram. Soc. 1993, 76, 1205–1211. [Google Scholar] [CrossRef]
- Von Hauff, E.; Klotz, D. Impedance spectroscopy for perovskite solar cells: Characterisation, analysis, and diagnosis. J. Mater. Chem. C 2022, 10, 742–761. [Google Scholar] [CrossRef]


| Characteristics | Ceramic Sample | ||||||||
|---|---|---|---|---|---|---|---|---|---|
| SS-CS | SG-CS | SG-SPS | |||||||
| Identified phase | *BCTZ | BCTZ | Ba2TiO4 | BaTi2O5 | BCTZ | Ba2TiO4 | BaTi2O5 | ||
| ICDD PDF4 + | 01-086-8337 | 01-086-8337 | 04-006-8930 | 04-017-1818 | 01-086-8337 | 00-072-0077 | 00-070-0583 | 04-006-8930 | 04-017-1818 |
| System/ Space group | Orthorhombic Amm2 | Orthorhombic Amm2 | Monoclinic P21/n | Orthorhombic Pnma | Orthorhombic Amm2 | Tetragonal P4mm | Cubic Pm-3m | Monoclinic P21/n | Orthorhombic Pnma |
| Phase composition (%) | 100 | 96.0 | 0.3 | 3.7 | 58 | 0.1 | 27.9 | 5.2 | 8.8 |
| a (Å) | 3.995136 ± 0.000258 | 4.014679 ± 0.000148 | 6.077217 ± 0.000580 | 10.288960 ± 0.000555 | 4.026096 ± 0.000386 | 3.582892 ± 0.001127 | 4.032959 ± 0.000332 | 6.105985 ± 0.000269 | 10.428280 ± 0.031393 |
| b (Å) | 5.671437 ± 0.001329 | 5.672983 ± 0.000614 | 7.680506 ± 0.000622 | 3.899641 ± 0.000297 | 5.681889 ± 0.003457 | 3.582892 ± 0.001127 | 4.032959 ± 0.000332 | 7.685928 ± 0.000298 | 3.954501 ± 0.008606 |
| c (Å) | 5.668867 ± 0.001324 | 5.675007 ± 0.000475 | 11.238200 ± 0.001730 | 10.927010 ± 0.000565 | 5.684521 ± 0.003102 | 4.206708 ± 0.002251 | 4.032959 ± 0.000332 | 11.913690 ± 0.000562 | 10.717930 ± 0.033939 |
| V (Å3) | 128.4461 | 129.2495 | 469.0049 | 438.4272 | 130.0381 | 54.0019 | 65.5951 | 559.1114 | 441.9929 |
| Relative density, ρr (%) | 97.1% | 84.79% | 97.91% | ||||||
| Rexp | 7.62884 | 7.63566 | 8.4752 | ||||||
| Rp | 8.30252 | 6.14165 | 6.63801 | ||||||
| Rwp | 12.90004 | 9.11354 | 8.80129 | ||||||
| χ2 | 2.85934 | 1.42456 | 1.07843 | ||||||
| Grain size, <GS> (μm) | 2.35 ± 1.05 | 0.91 ± 0.39 | 0.0675 ± 0.024 | ||||||
| Sample | <GS> nm | γ | δ (K) | ε′A | ε′m | T0 (K) | C | Slope | Intercept | TC (K) |
|---|---|---|---|---|---|---|---|---|---|---|
| SS-CS | 2350 | 1.67 | 13 | 11,696 | 11,457 | 377 | 1.4 × 10⁵ | 7 × 10⁻⁶ | −2.67 × 10⁻³ | 365 |
| SG-CS | 910 | 1.71 | 40 | 1685 | 1626 | 280 | 8.7 × 10⁴ | 1.1 × 10⁻⁵ | −3.19 × 10⁻³ | 270 |
| SG-SPS | 67.5 | 1.75 | 86 | 918 | 911 | 130 | 1.5 × 10⁵ | 6.5 × 10⁻⁵ | −8.44 × 10⁻⁴ | 220 |
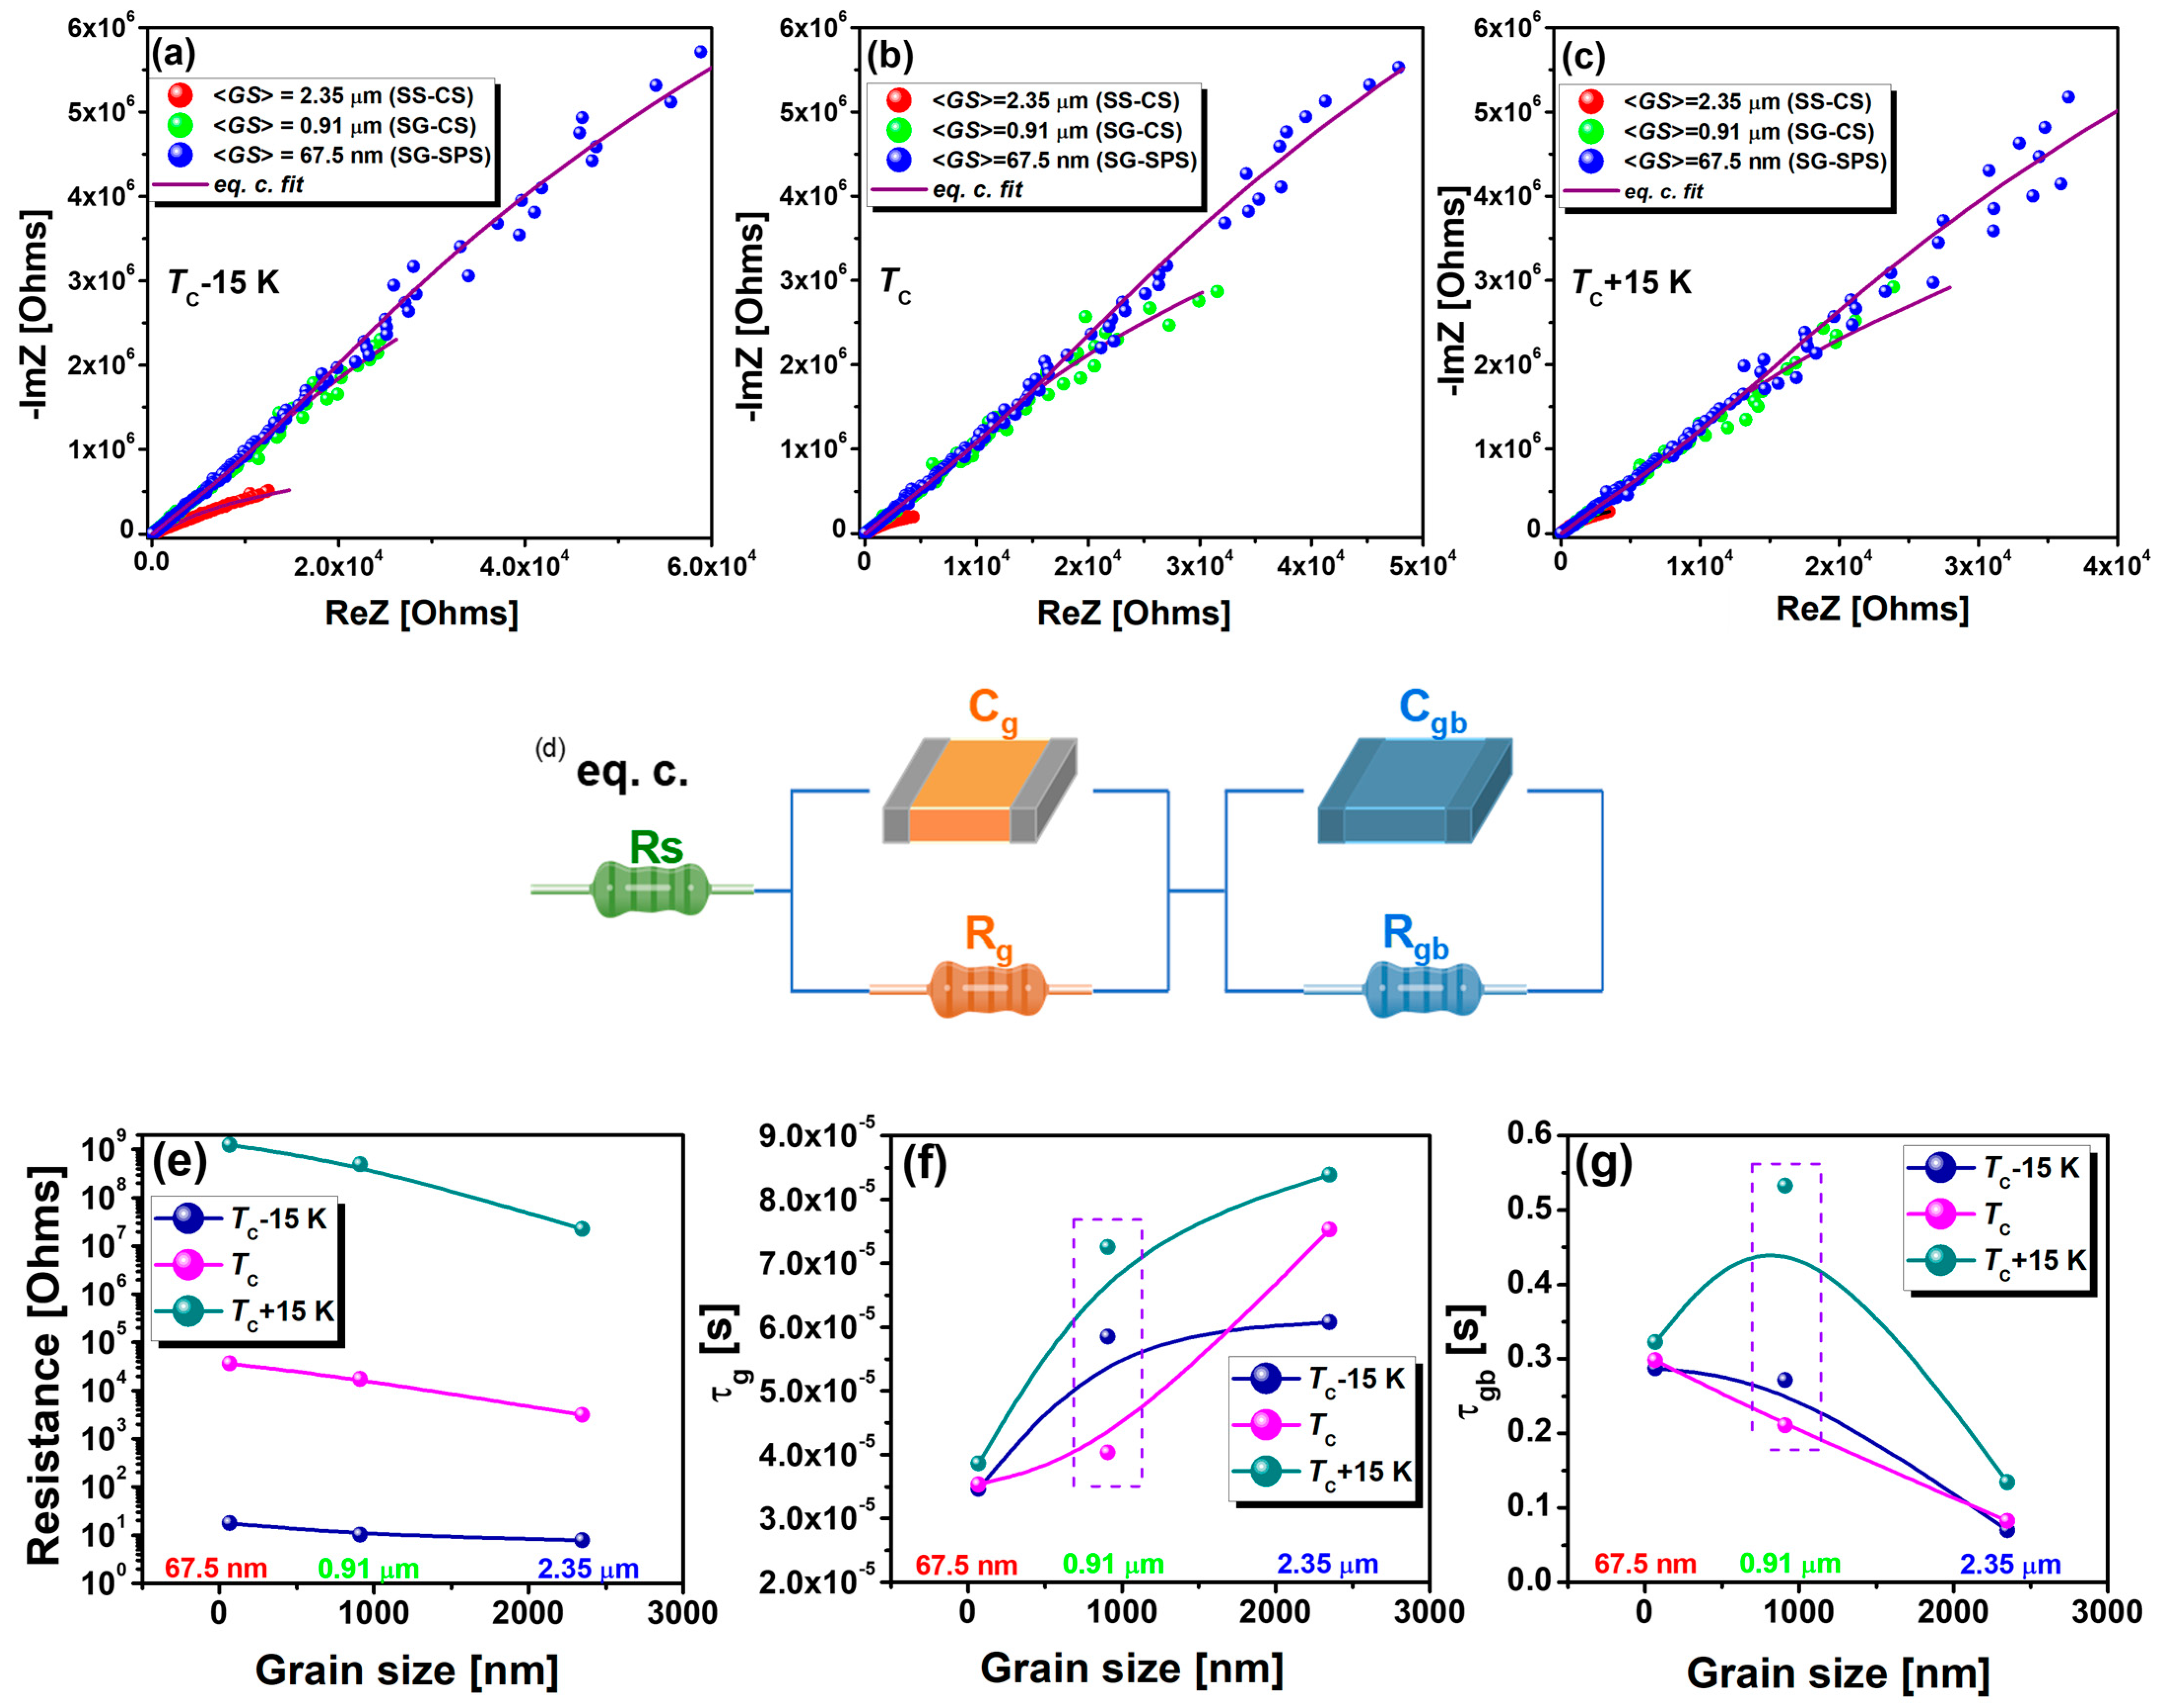
| Temperature | Sample | <GS> (nm) | RS (Ω) | Rg (Ω) | Cg (F) | Rgb (Ω) | Cgb (F) | τg (s) | τgb (s) |
|---|---|---|---|---|---|---|---|---|---|
| TC − 15 | SS-CS | 2350 | 7.8 | 3134 | 1.9 × 10⁻⁸ | 2.3 × 10⁷ | 3.08 × 10⁻⁹ | 6.1 × 10⁻⁵ | 0.07 |
| SG-CS | 910 | 10.3 | 17,457 | 3.4 × 10⁻⁹ | 4.9 × 10⁸ | 5.56 × 10⁻¹⁰ | 5.8 × 10⁻⁵ | 0.27 | |
| SG-SPS | 67.5 | 18 | 36,585 | 3.5 × 10⁻¹⁰ | 1.2 × 10⁹ | 2.32 × 10⁻¹⁰ | 3.5 × 10⁻⁵ | 0.29 | |
| TC | SS-CS | 2350 | 6.1 | 567 | 1.3 × 10⁻⁷ | 1 × 10⁷ | 8.1 × 10⁻⁹ | 7.5 × 10⁻⁵ | 0.08 |
| SG-CS | 910 | 9.9 | 9915 | 4.1 × 10⁻⁹ | 3.8 × 10⁸ | 5.57 × 10⁻¹⁰ | 4 × 10⁻⁵ | 0.21 | |
| SG-SPS | 67.5 | 18.5 | 28,819 | 1.2 × 10⁻⁹ | 1.3 × 10⁹ | 2.32 × 10⁻¹⁰ | 3.5 × 10⁻⁵ | 0.3 | |
| TC + 15 | SS-CS | 2350 | 5.6 | 425 | 2 × 10⁻⁷ | 2.2 × 10⁷ | 6.14 × 10⁻⁸ | 8.4 × 10⁻⁵ | 0.13 |
| SG-CS | 910 | 9.2 | 17,005 | 4.3 × 10⁻⁹ | 9.7 × 10⁸ | 5.48 × 10⁻¹⁰ | 7.3 × 10⁻⁵ | 0.53 | |
| SG-SPS | 67.5 | 18.9 | 25,270 | 1.5 × 10⁻⁹ | 1.4 × 10⁹ | 2.29 × 10⁻¹⁰ | 3.9 × 10⁻⁵ | 0.32 |
Disclaimer/Publisher’s Note: The statements, opinions and data contained in all publications are solely those of the individual author(s) and contributor(s) and not of MDPI and/or the editor(s). MDPI and/or the editor(s) disclaim responsibility for any injury to people or property resulting from any ideas, methods, instructions or products referred to in the content. |
© 2023 by the authors. Licensee MDPI, Basel, Switzerland. This article is an open access article distributed under the terms and conditions of the Creative Commons Attribution (CC BY) license (https://creativecommons.org/licenses/by/4.0/).
Share and Cite
Ene, V.L.; Lupu, V.R.; Condor, C.V.; Patru, R.E.; Hrib, L.M.; Amarande, L.; Nicoara, A.I.; Pintilie, L.; Ianculescu, A.-C. Influence of Grain Size on Dielectric Behavior in Lead-Free 0.5 Ba(Zr0.2Ti0.8)O3–0.5 (Ba0.7Ca0.3)TiO3 Ceramics. Nanomaterials 2023, 13, 2934. https://doi.org/10.3390/nano13222934
Ene VL, Lupu VR, Condor CV, Patru RE, Hrib LM, Amarande L, Nicoara AI, Pintilie L, Ianculescu A-C. Influence of Grain Size on Dielectric Behavior in Lead-Free 0.5 Ba(Zr0.2Ti0.8)O3–0.5 (Ba0.7Ca0.3)TiO3 Ceramics. Nanomaterials. 2023; 13(22):2934. https://doi.org/10.3390/nano13222934
Chicago/Turabian StyleEne, Vladimir Lucian, Valentin Razvan Lupu, Claudiu Vasile Condor, Roxana Elena Patru, Luminita Mirela Hrib, Luminita Amarande, Adrian Ionut Nicoara, Lucian Pintilie, and Adelina-Carmen Ianculescu. 2023. "Influence of Grain Size on Dielectric Behavior in Lead-Free 0.5 Ba(Zr0.2Ti0.8)O3–0.5 (Ba0.7Ca0.3)TiO3 Ceramics" Nanomaterials 13, no. 22: 2934. https://doi.org/10.3390/nano13222934
APA StyleEne, V. L., Lupu, V. R., Condor, C. V., Patru, R. E., Hrib, L. M., Amarande, L., Nicoara, A. I., Pintilie, L., & Ianculescu, A.-C. (2023). Influence of Grain Size on Dielectric Behavior in Lead-Free 0.5 Ba(Zr0.2Ti0.8)O3–0.5 (Ba0.7Ca0.3)TiO3 Ceramics. Nanomaterials, 13(22), 2934. https://doi.org/10.3390/nano13222934