
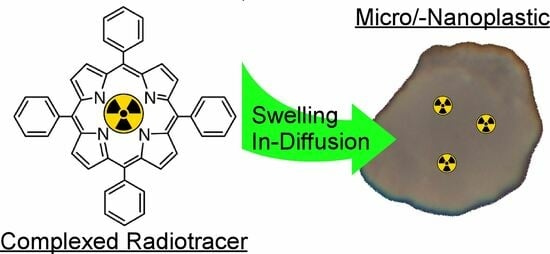
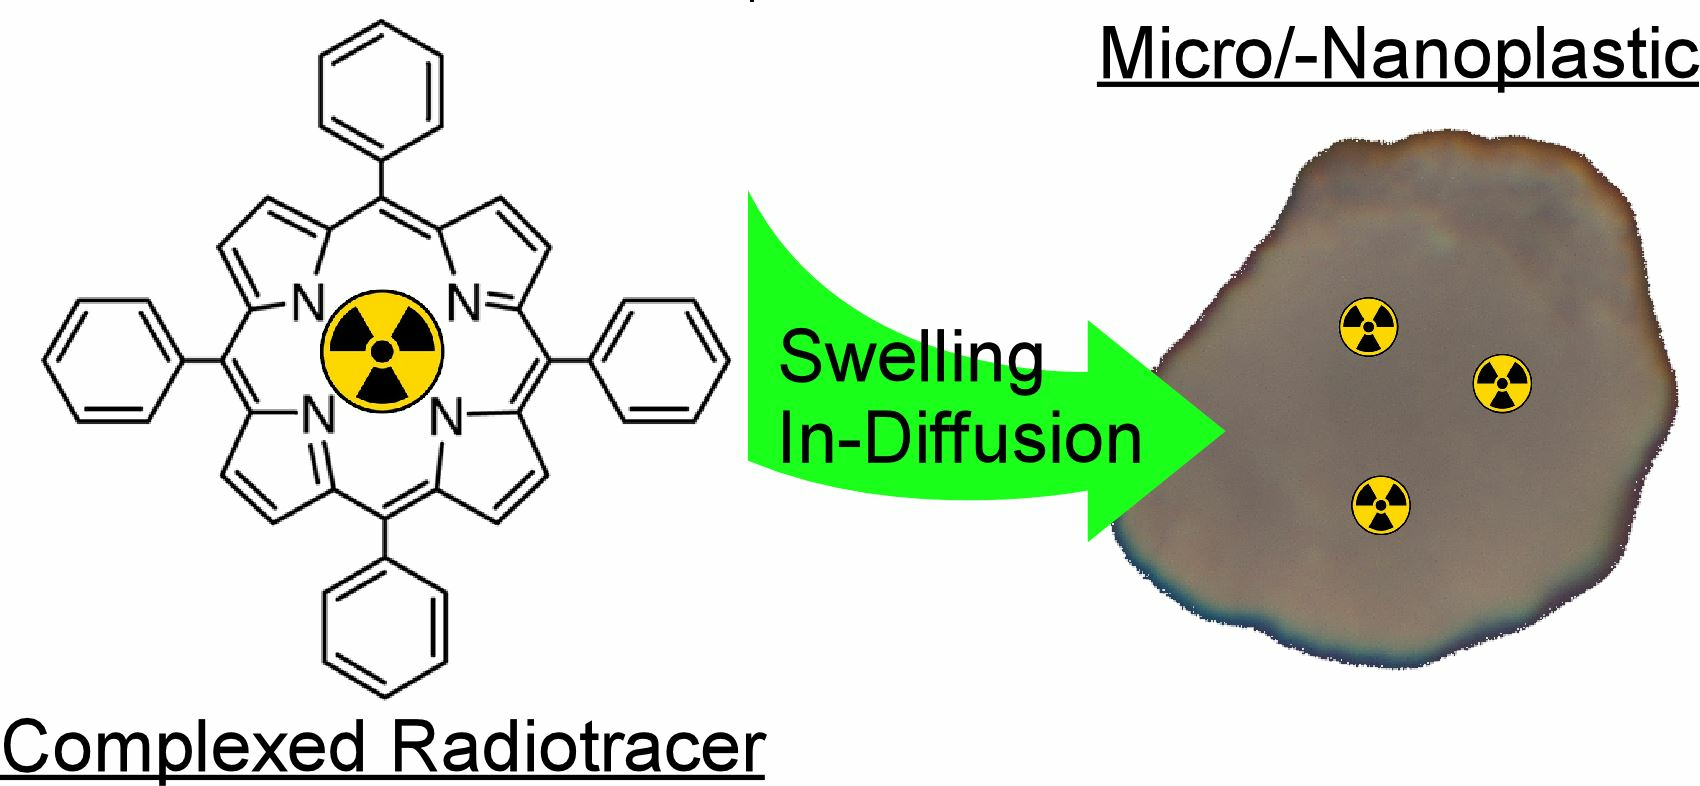
Radiolabeling of Micro-/Nanoplastics via In-Diffusion

Abstract
1. Introduction
2. Materials and Methods
2.1. Materials
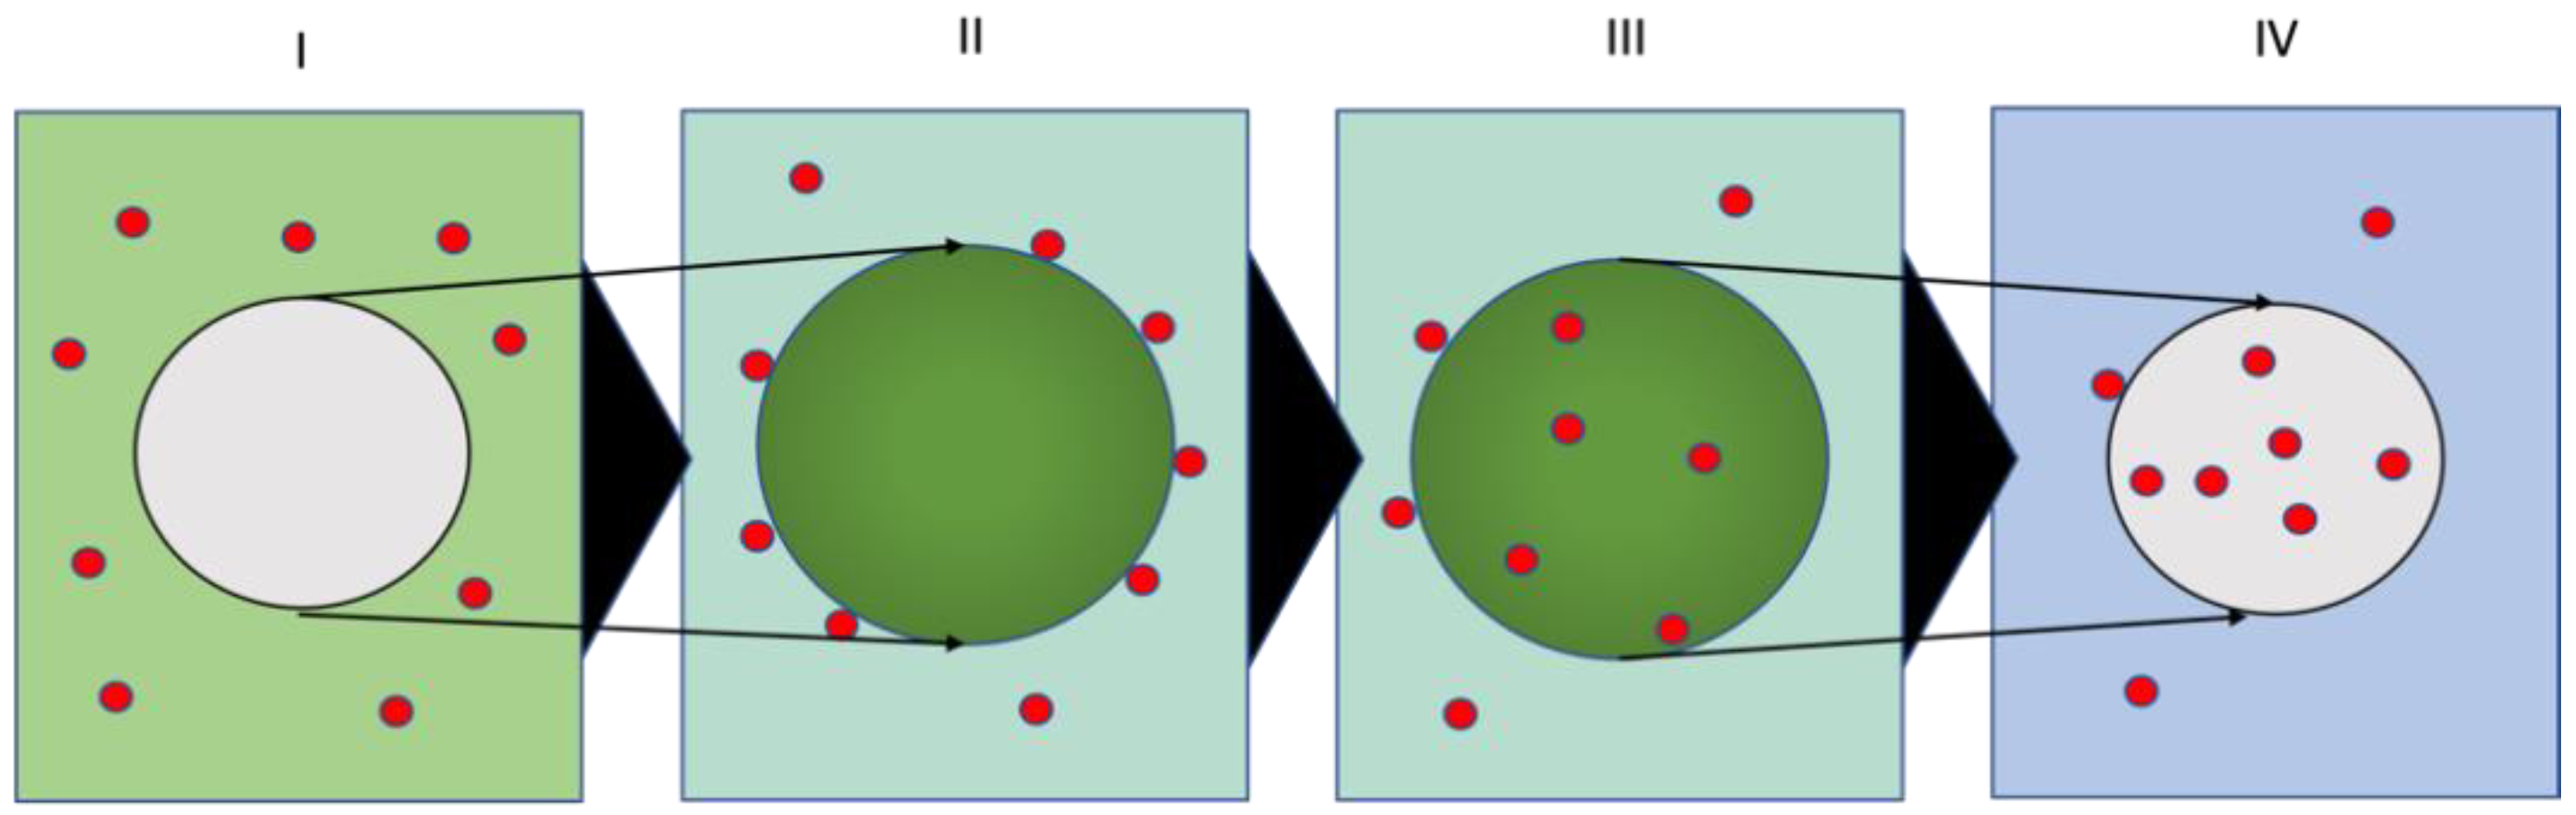
2.2. Methods
2.2.1. Characterization Methods
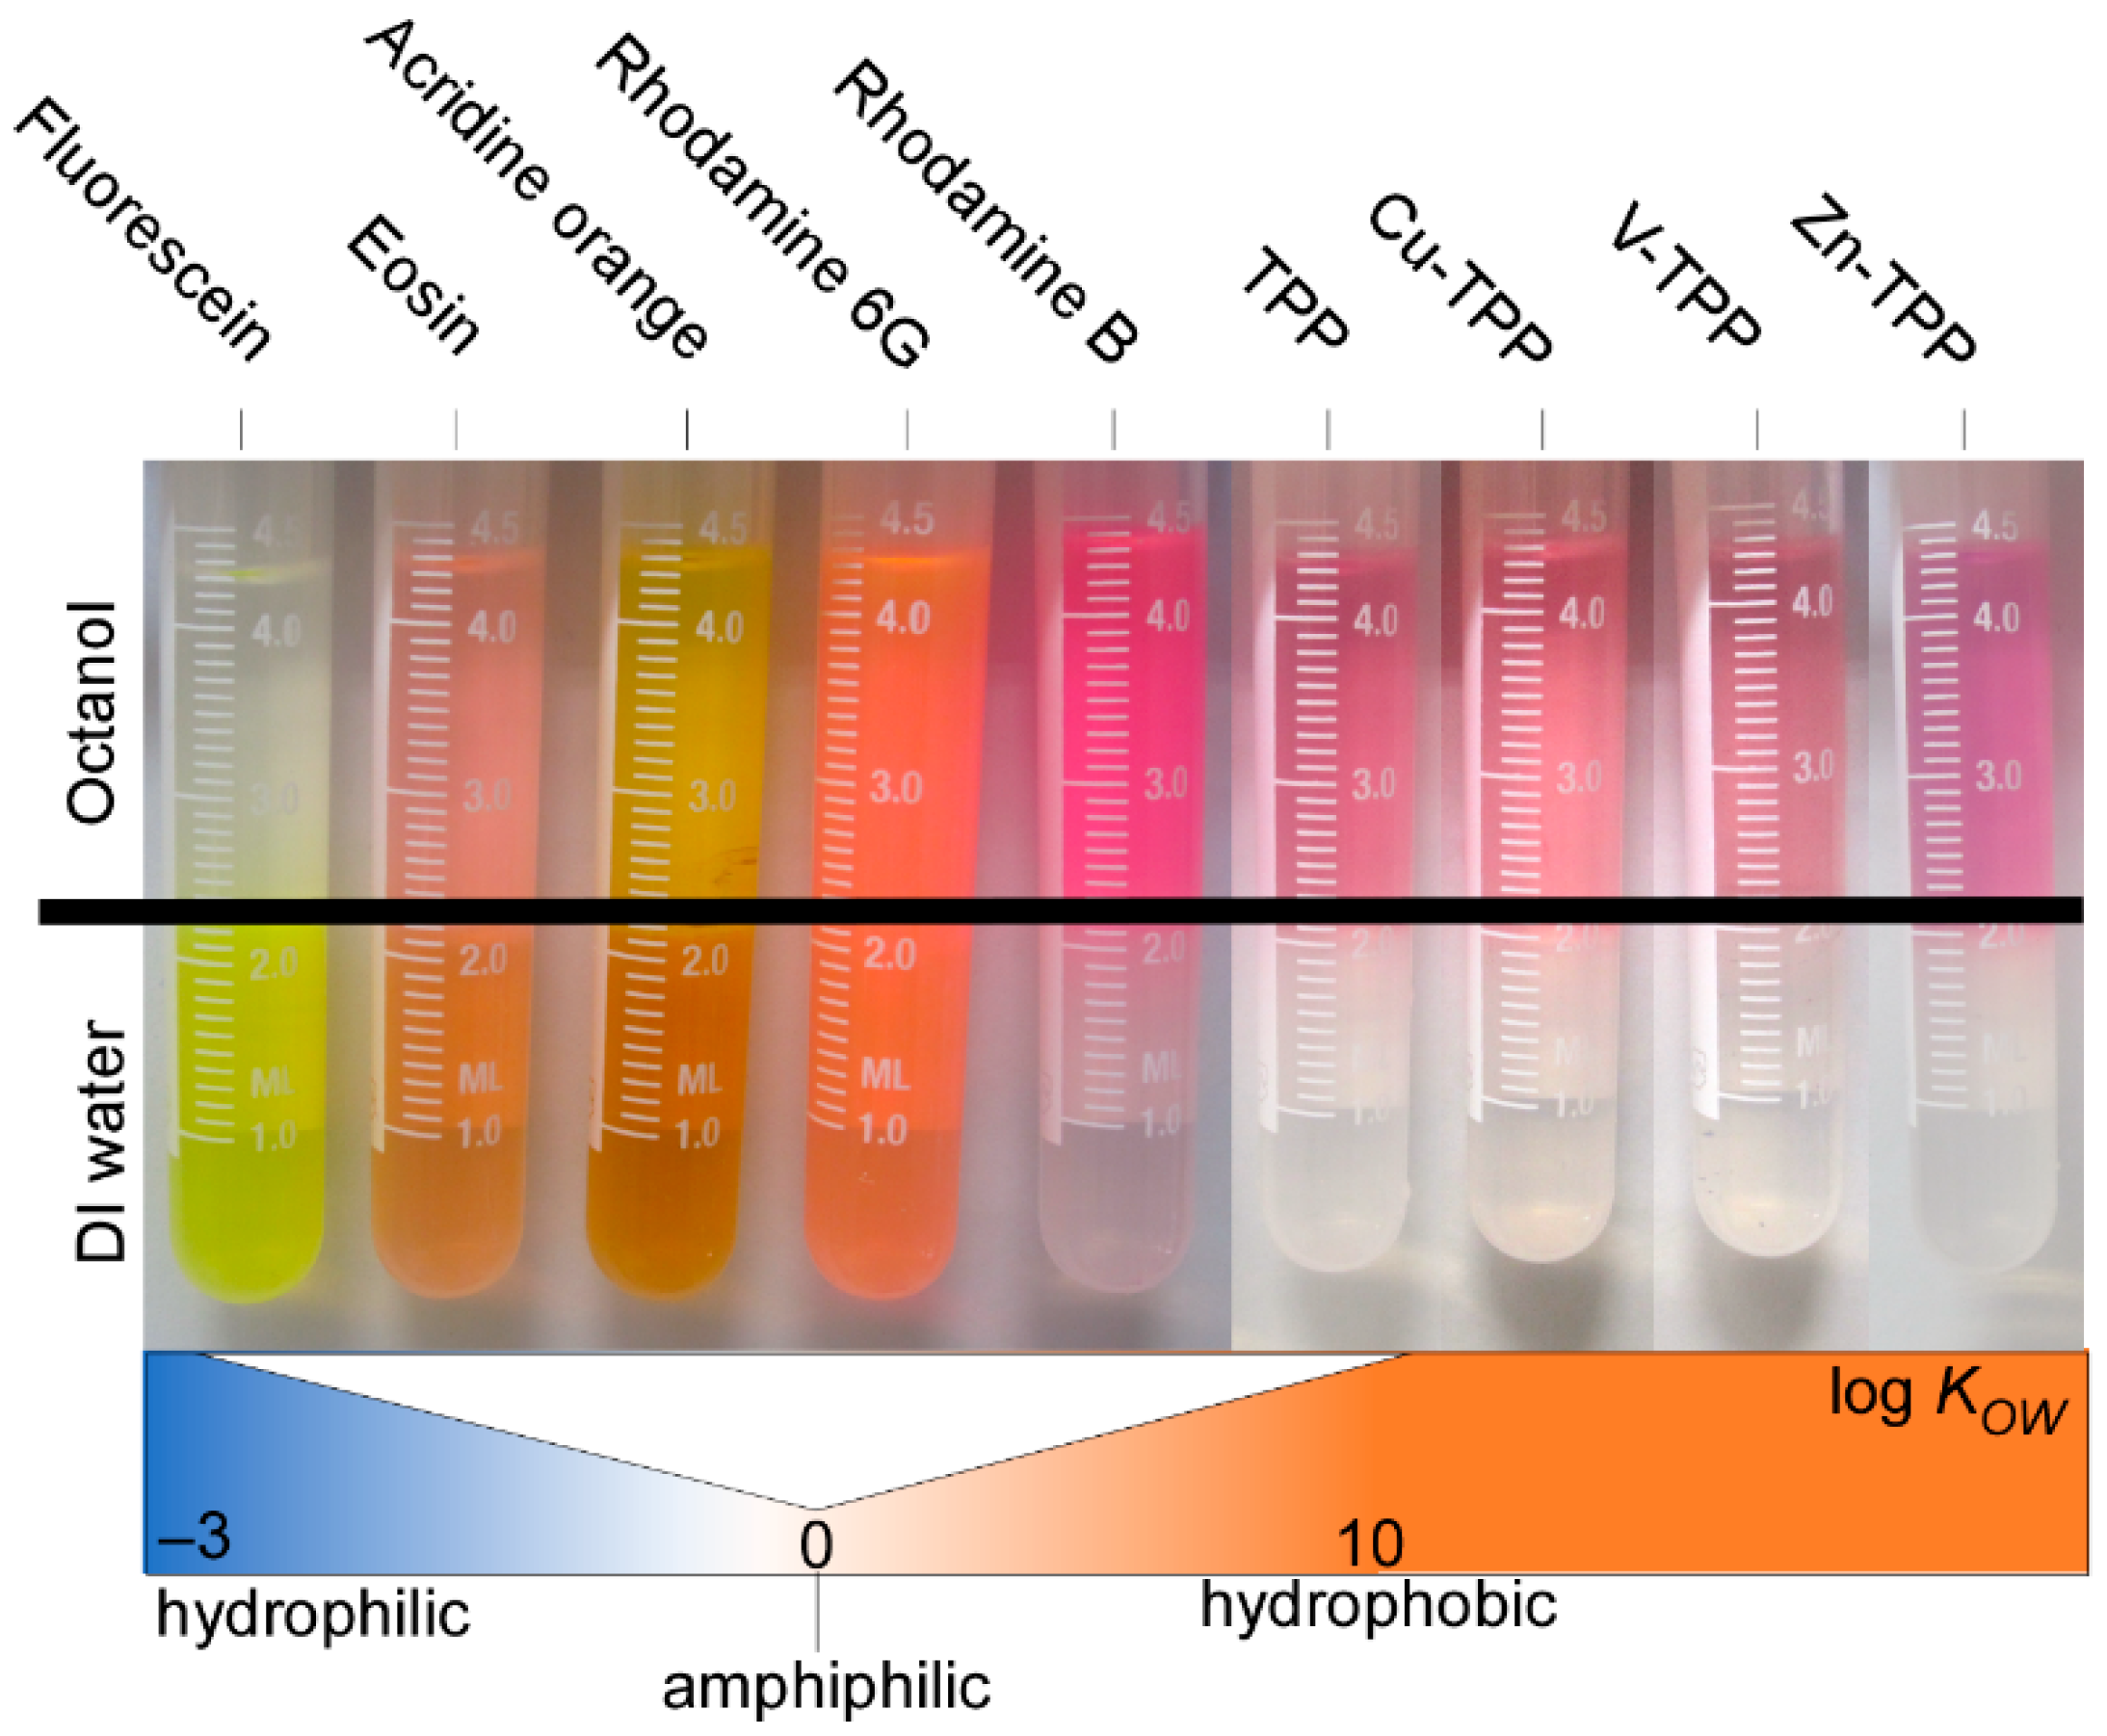
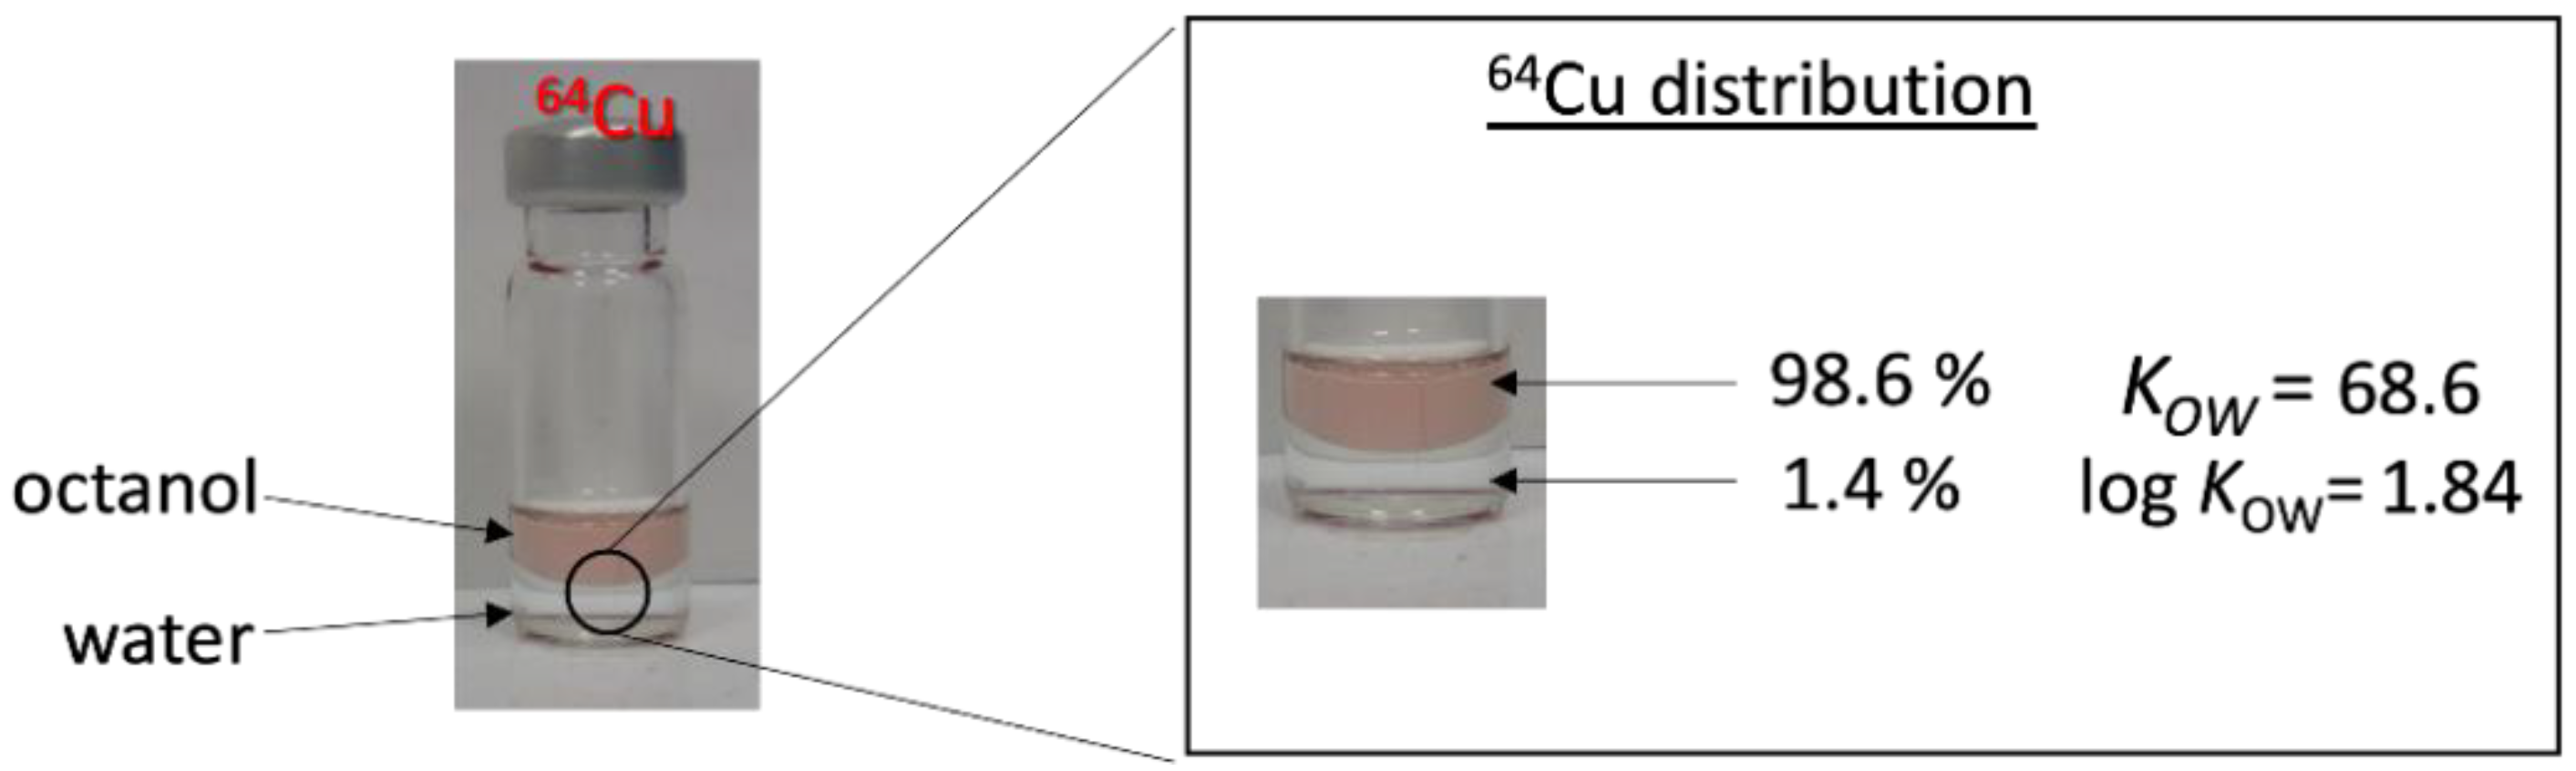
2.2.2. Water–Octanol Partition Coefficient Measurements
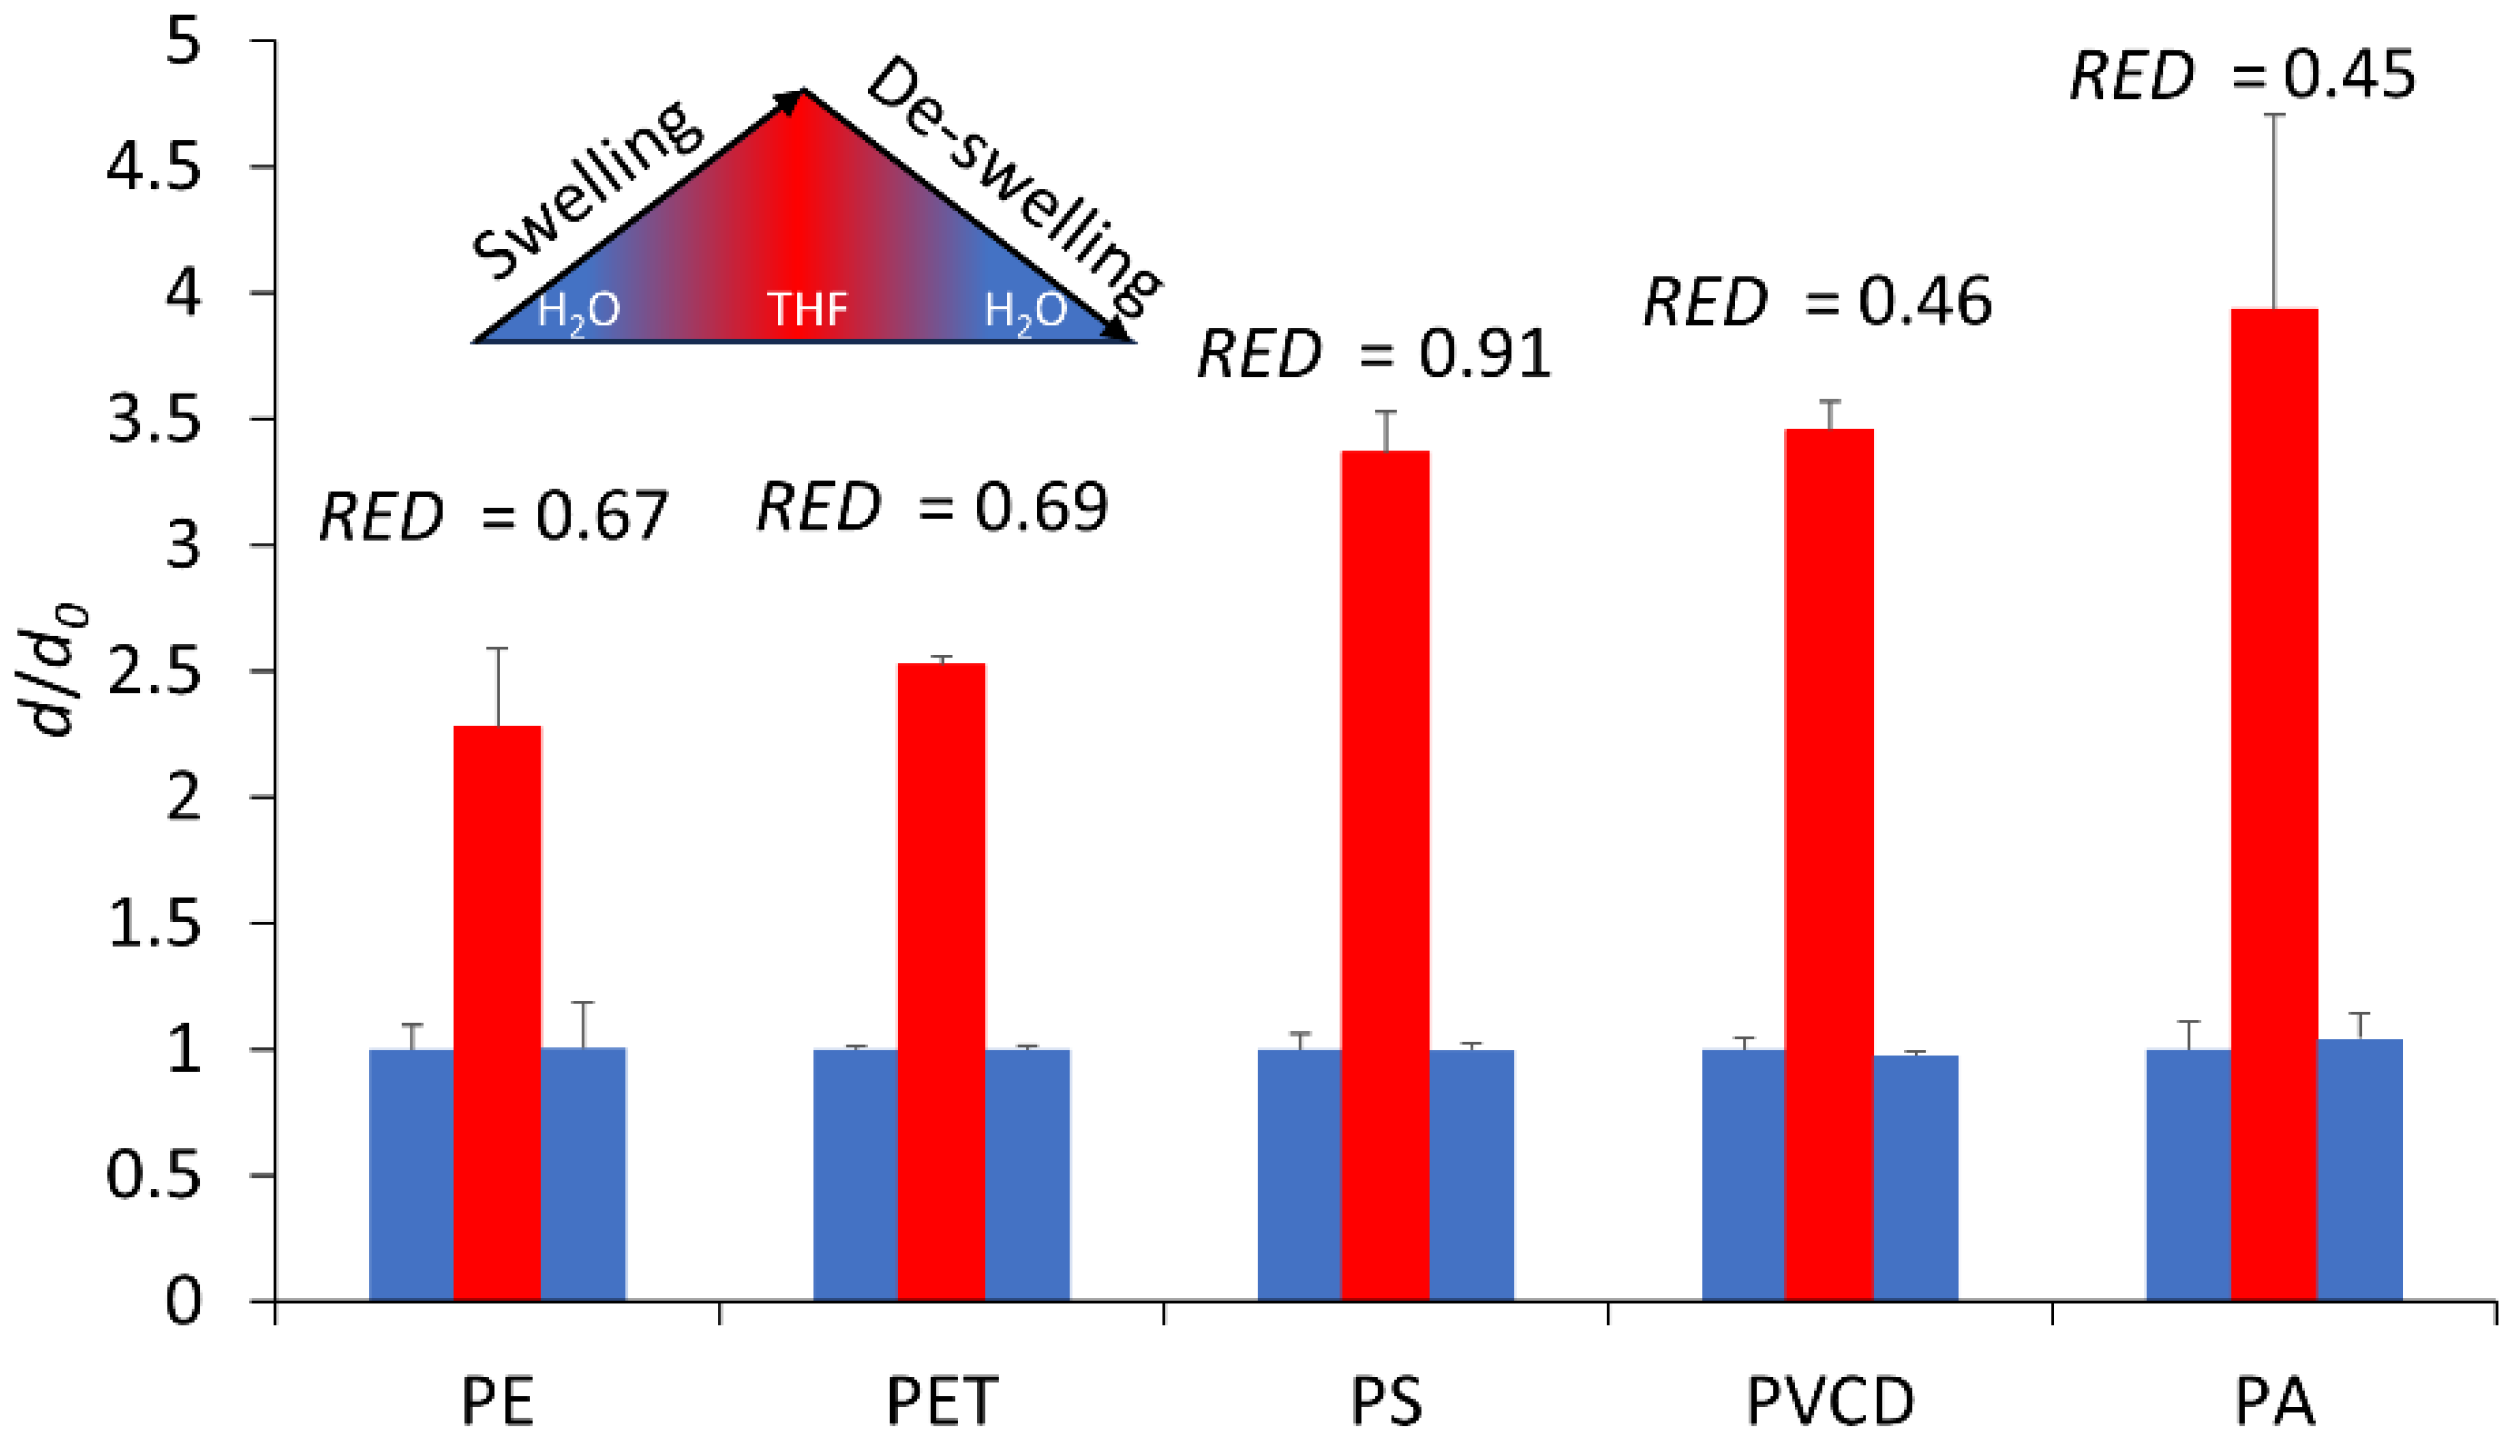
2.2.3. Swelling/De-Swelling Test
2.2.4. Fluorescent Dye Labeling
2.2.5. 64Cu Production
2.2.6. Production of Cu-TPP and [64Cu]-TPP
2.2.7. 64Cu Plastics Labeling
3. Results
3.1. System Component Characterization
3.1.1. Particle Characterization
3.1.2. Dye Characterization
3.1.3. Plastics Swelling Behavior
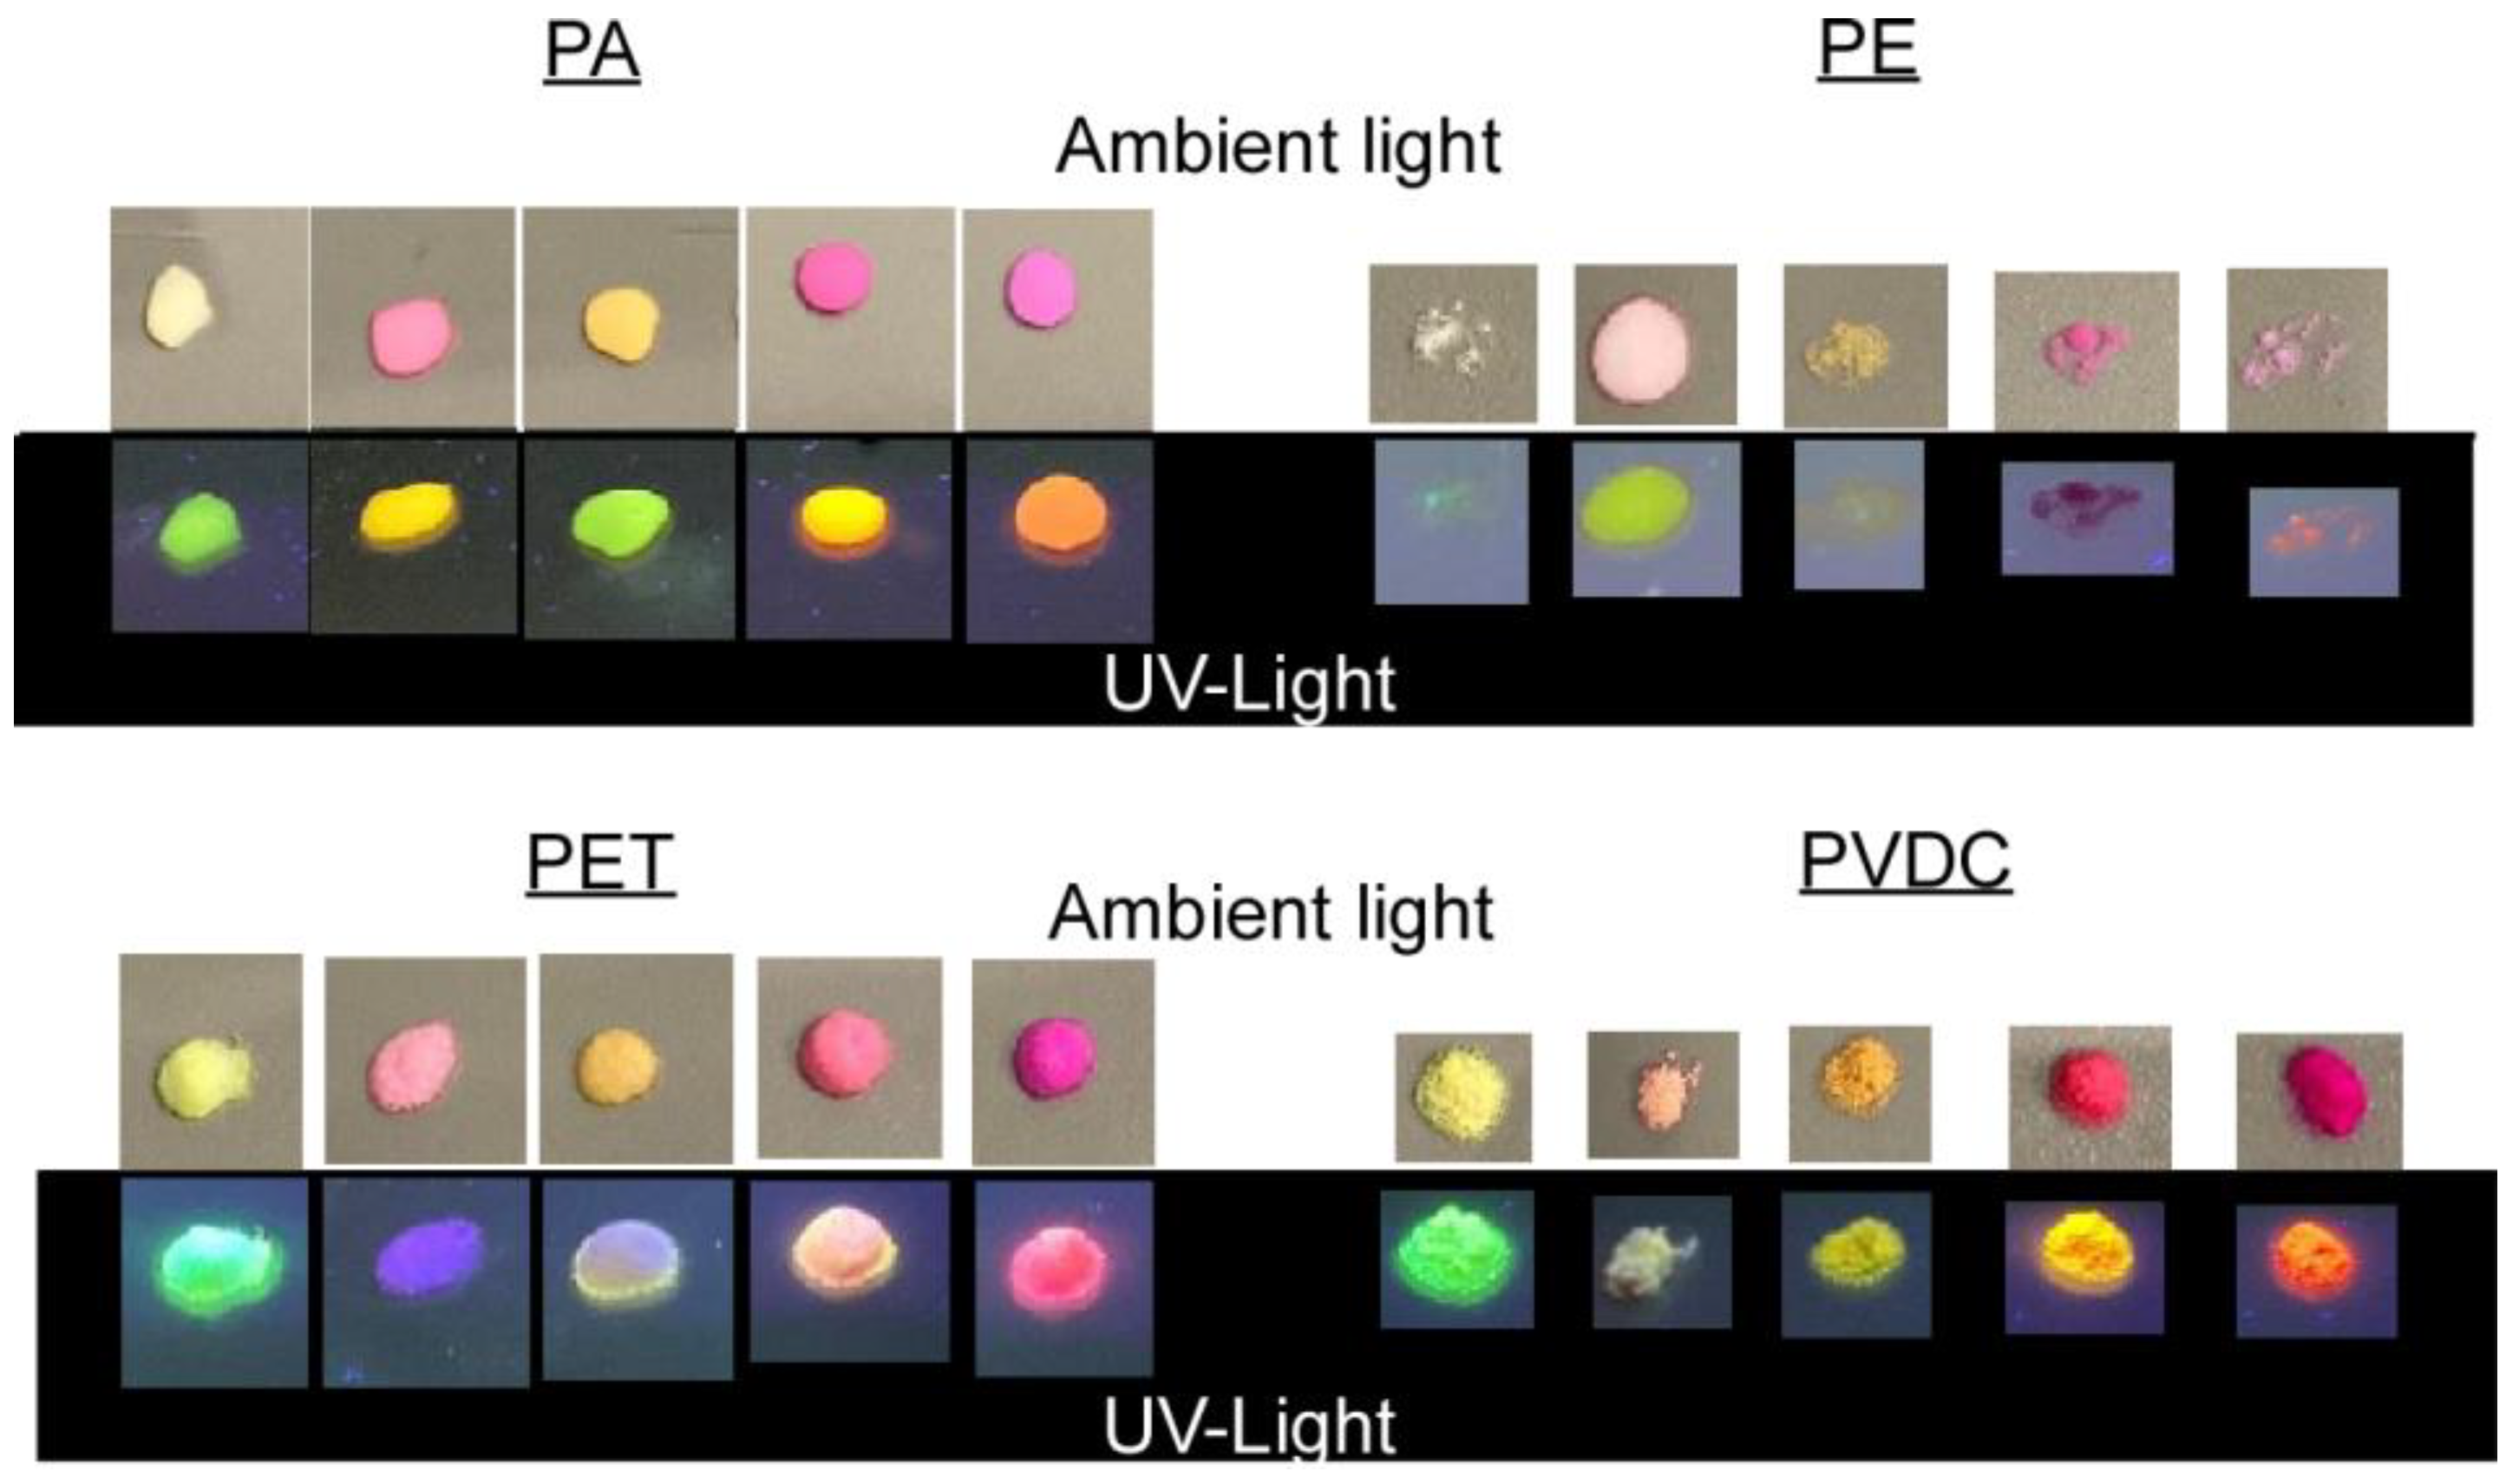
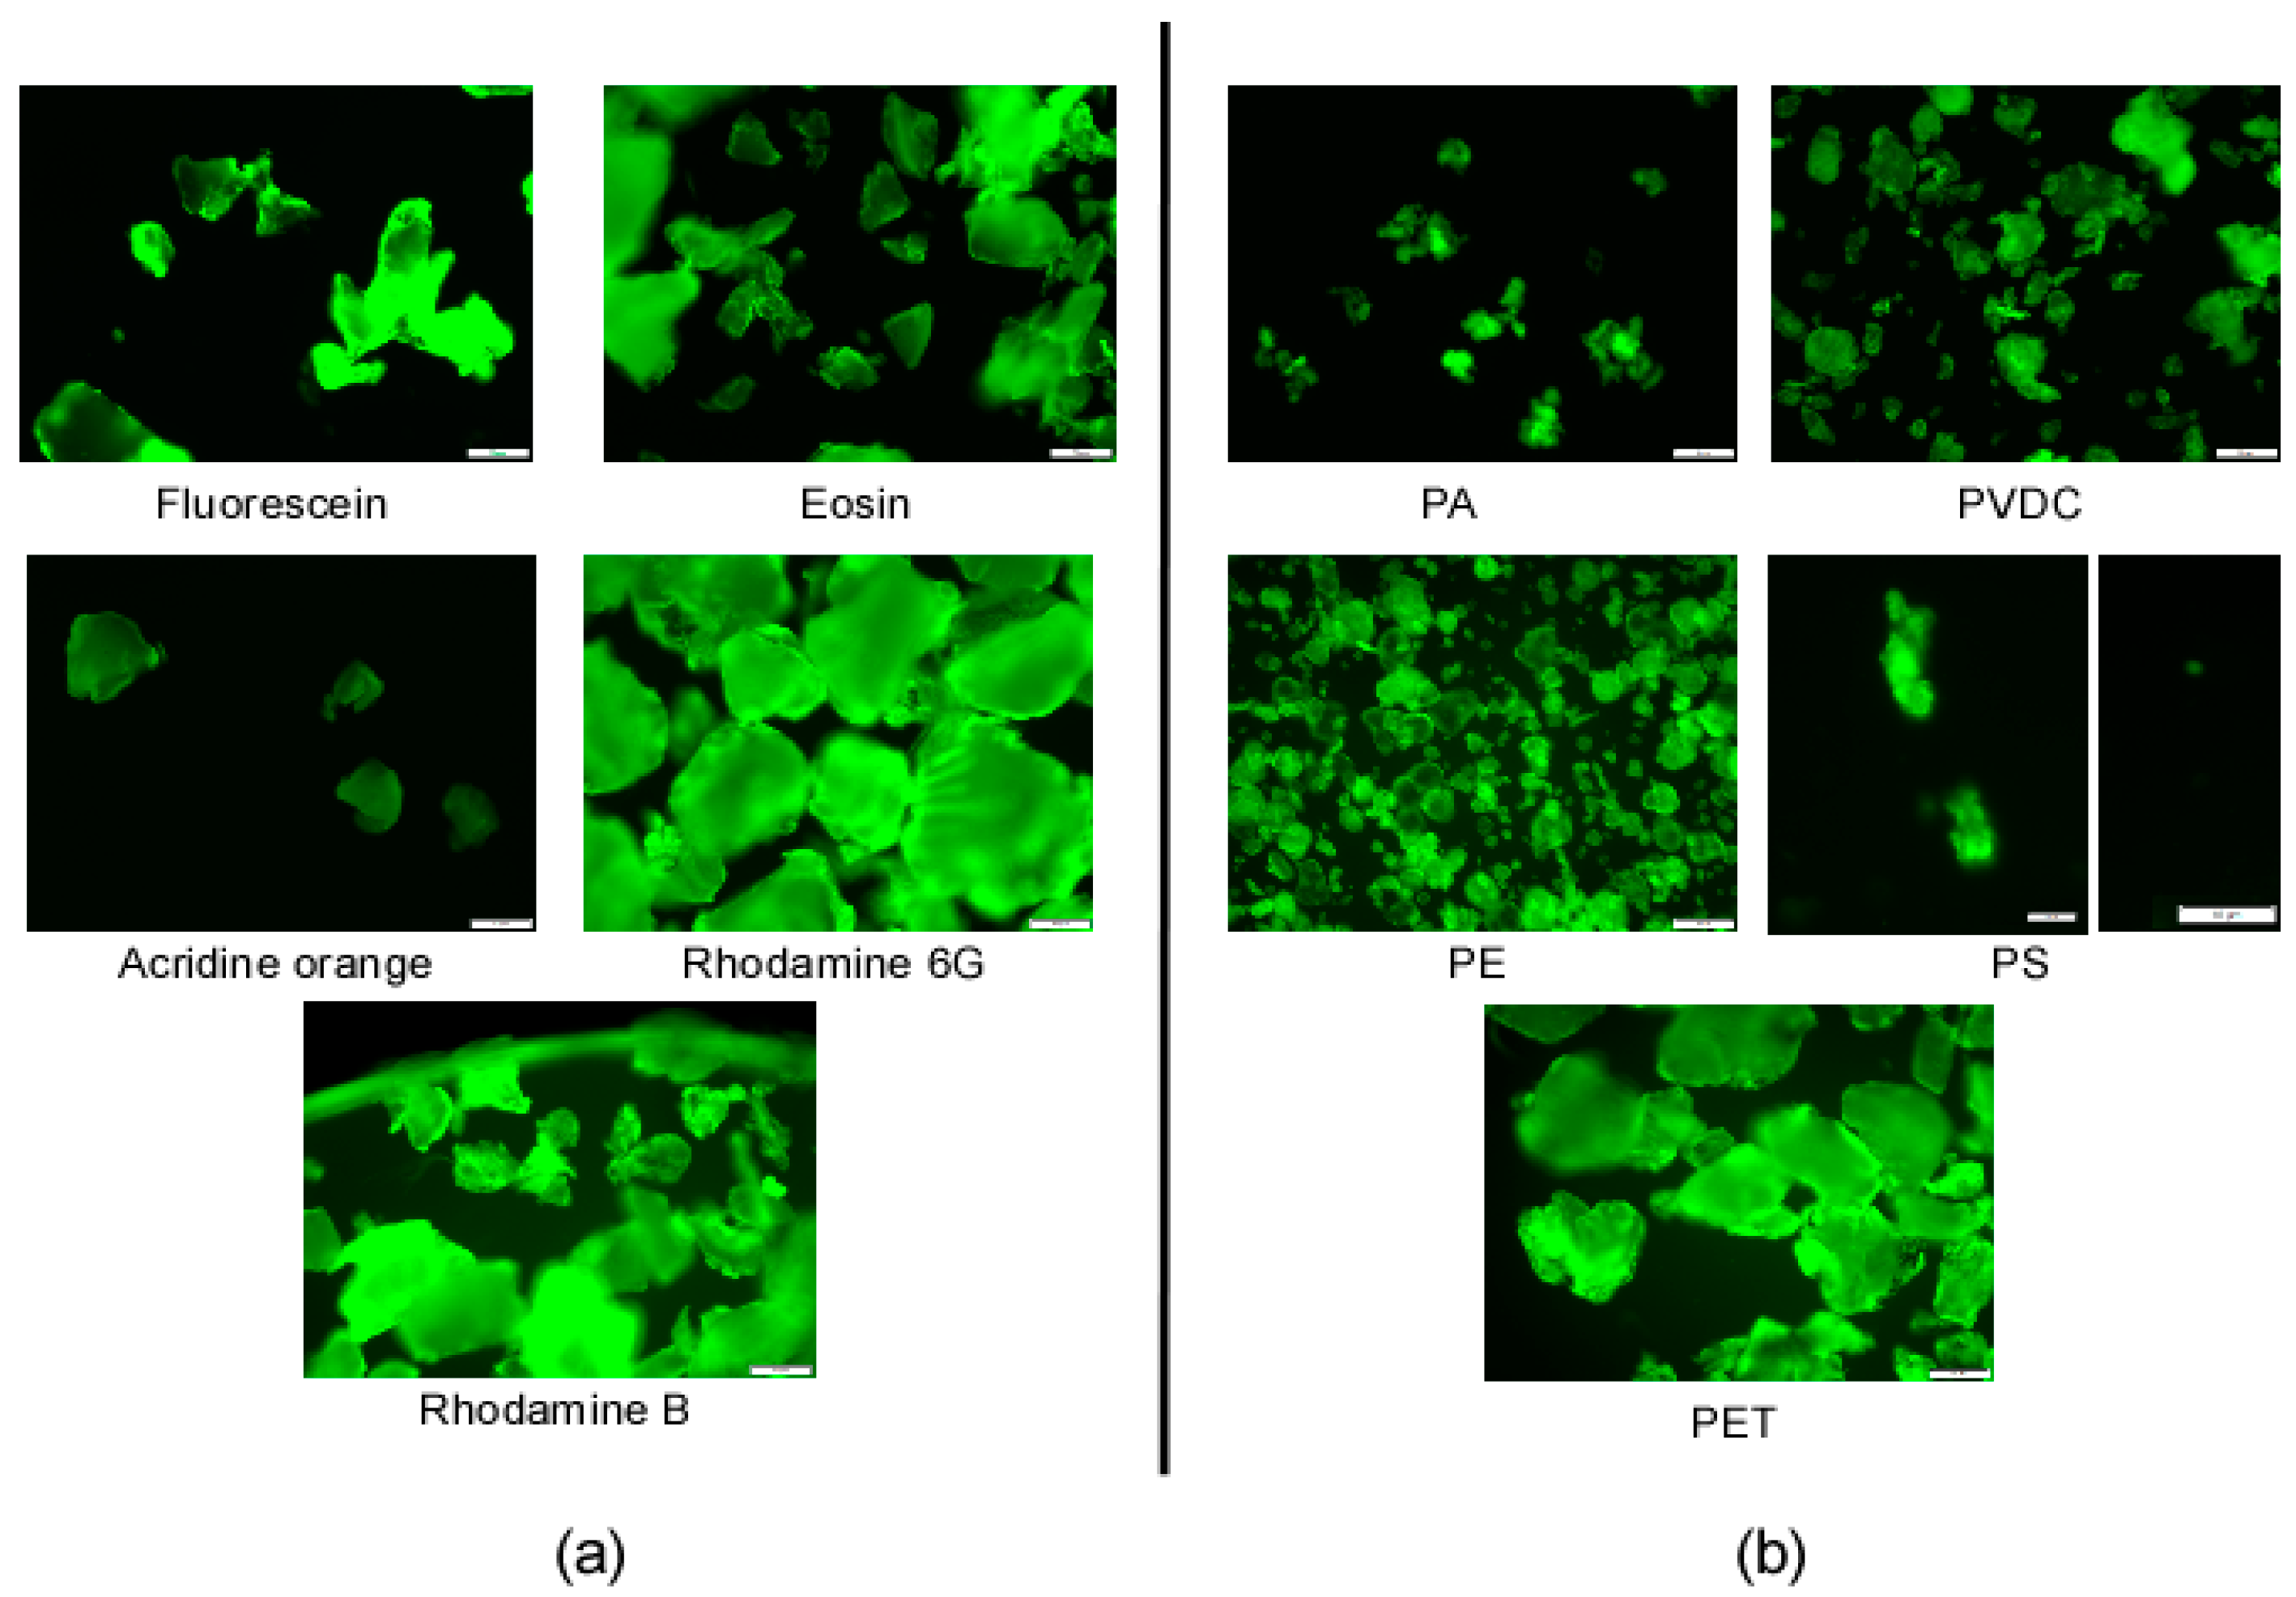
3.2. Fluorescent Dye Labeling of Micro-/Nanoplastics
- The labeling yield increases with more efficient swelling behavior;
- The labeling yield increases with dye hydrophobicity, with a tentative threshold identifiable for slightly hydrophilic to amphiphilic log KOW values close to 0;
- The labeling yield decreases with dye molar volume, with possible shape effects for flat molecular structures.
3.3. Radiolabeling of Micro-/Nanoplastics
3.3.1. 64Cu Complexation
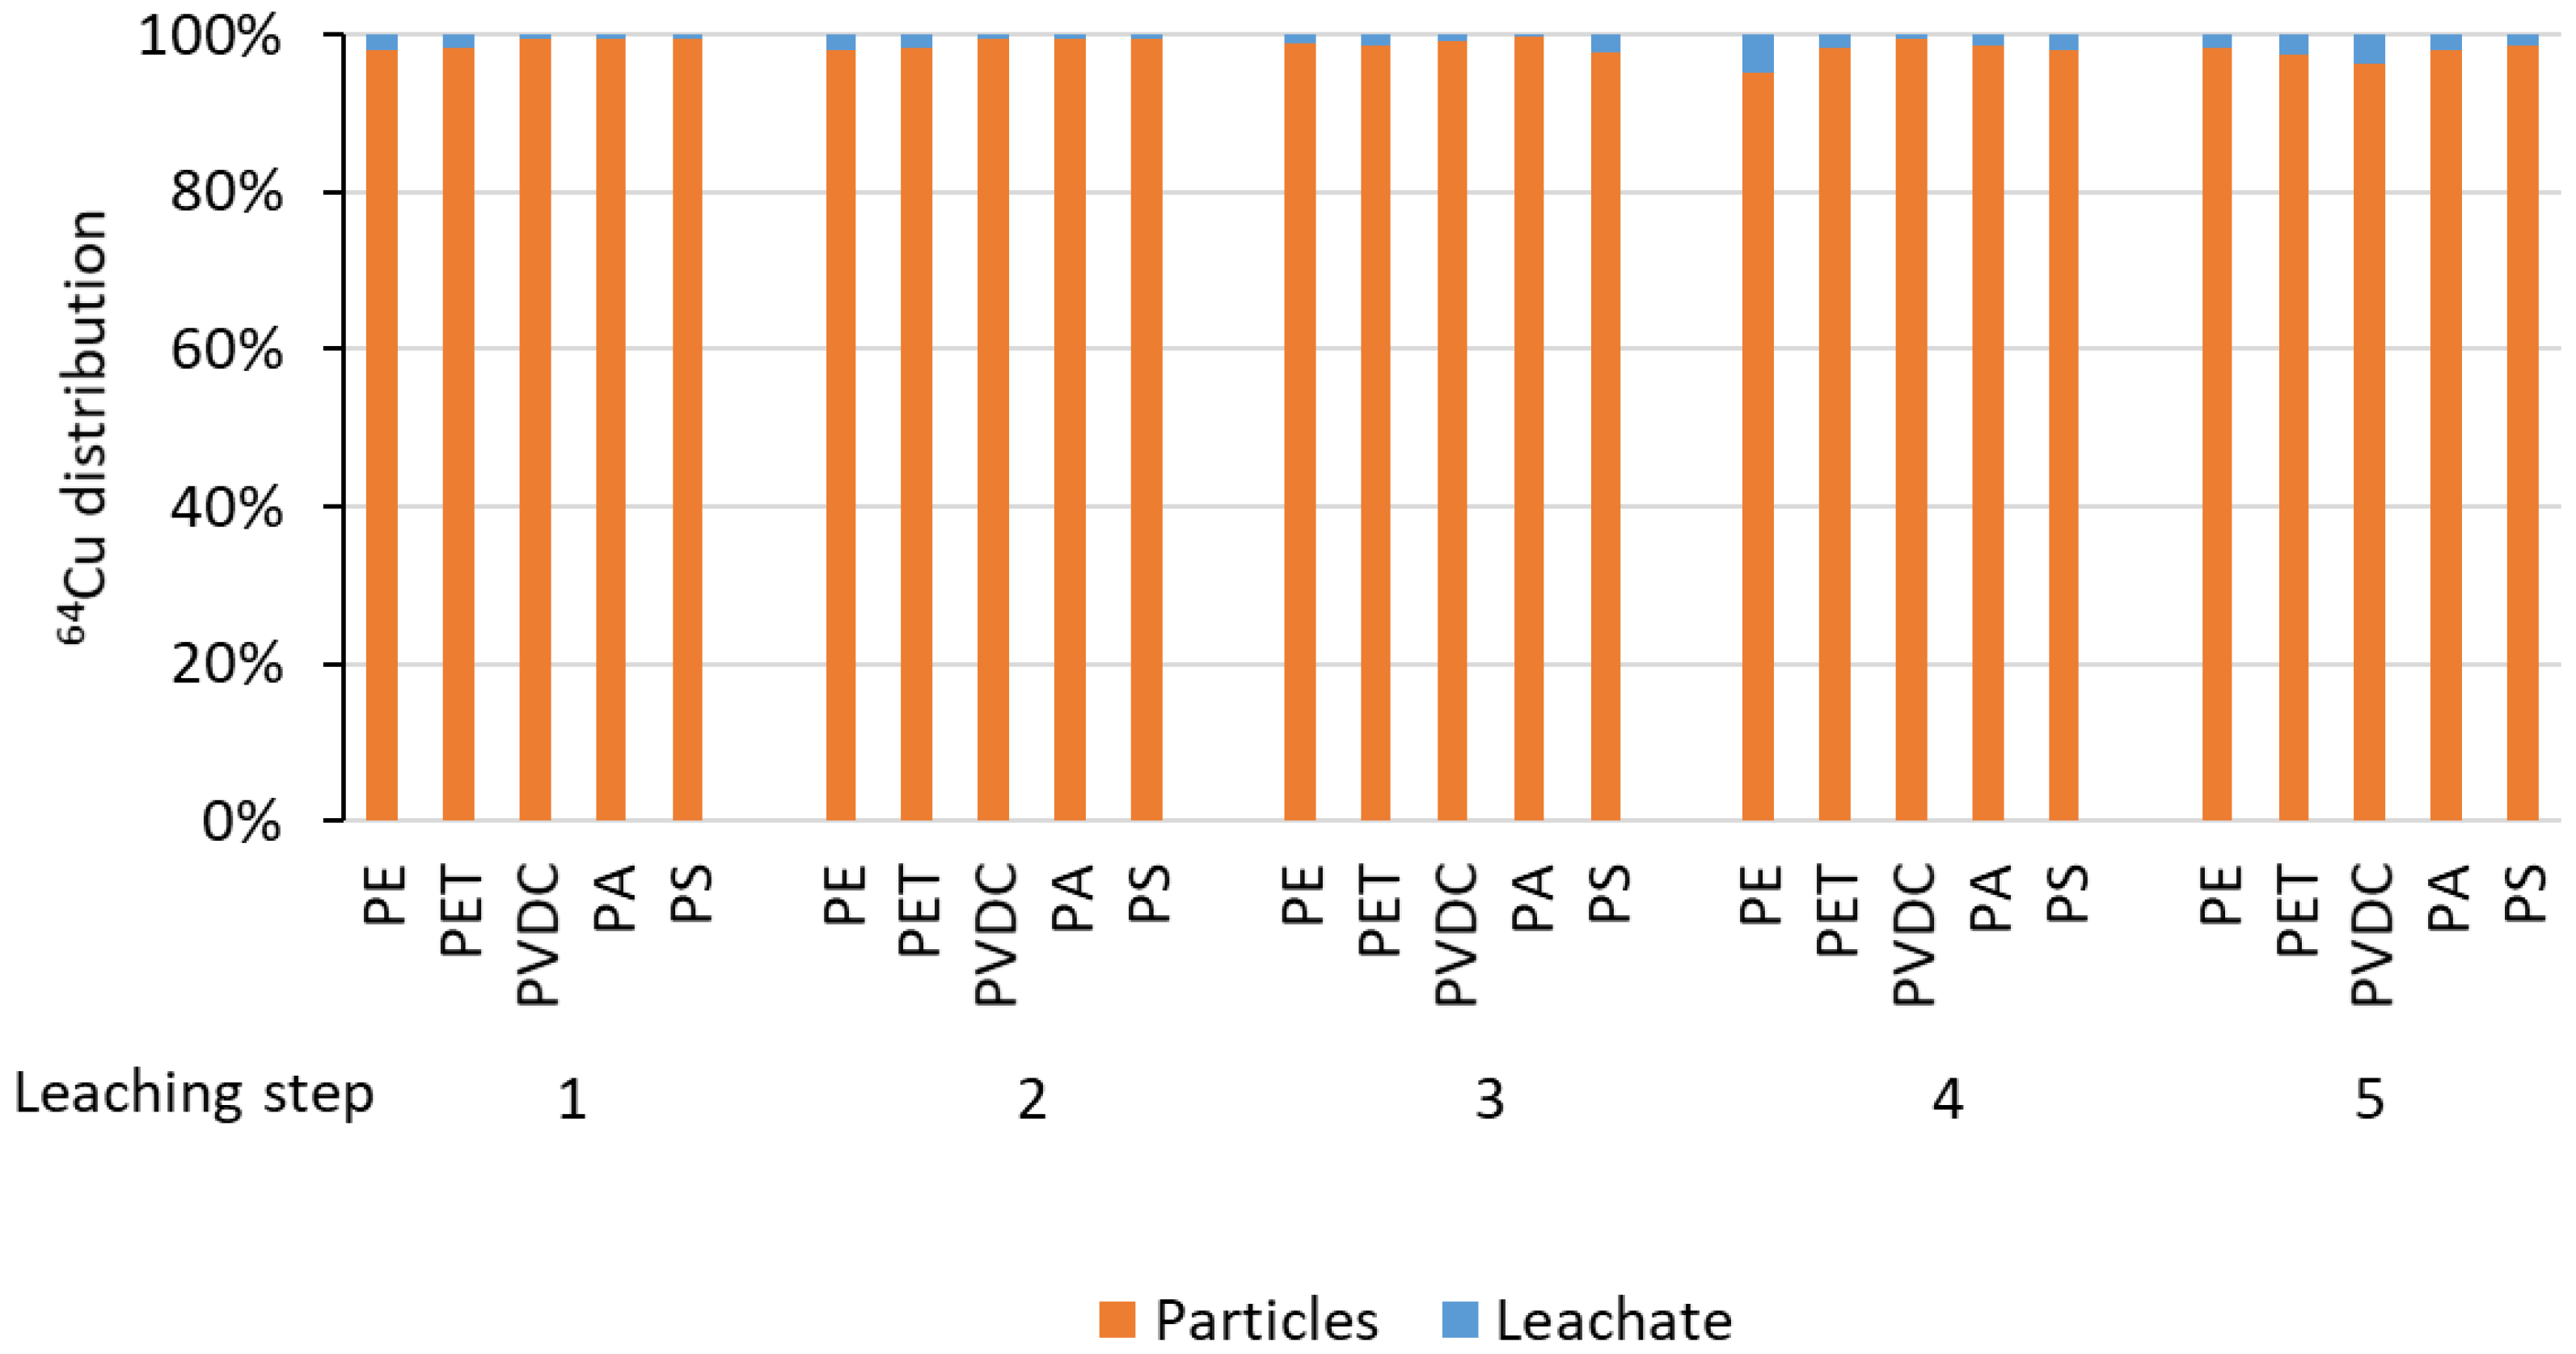
3.3.2. 64Cu Radiolabeling
4. Discussion
5. Conclusions
Supplementary Materials
Author Contributions
Funding
Data Availability Statement
Conflicts of Interest
References
- GESAMP. Sources, Fate and Effects of Microplastics in the Marine Environment: Part 2 of a Global Assessment. Available online: http://www.gesamp.org/publications/microplastics-in-the-marine-environment-part-2 (accessed on 6 September 2023).
- Li, J.; Liu, H.; Paul Chen, J. Microplastics in freshwater systems: A review on occurrence, environmental effects, and methods for microplastics detection. Water Res. 2018, 137, 362–374. [Google Scholar] [CrossRef] [PubMed]
- Li, C.; Busquets, R.; Campos, L.C. Assessment of microplastics in freshwater systems: A review. Sci. Total Environ. 2020, 707, 135578. [Google Scholar] [CrossRef] [PubMed]
- Zhang, M.; Tan, M.; Ji, R.; Ma, R.; Li, C. Current Situation and Ecological Effects of Microplastic Pollution in Soil. Rev. Environ. Contam. Toxicol. 2022, 260, 2–18. [Google Scholar] [CrossRef]
- Hale, R.C.; Seeley, M.E.; La Guardia, M.J.; Mai, L.; Zeng, E.Y. A Global Perspective on Microplastics. J. Geophys. Res. Ocean. 2020, 125, 1–40. [Google Scholar] [CrossRef]
- Bertling, J.; Bertling, R.; Hamann, L. Kunststoffe in der Umwelt: Mikro- und Makroplastik. Ursachen, Mengen, Umweltschicksale, Wirkungen, Lösungsansätze, Empfehlungen; Fraunhofer UMSICHT: Oberhausen, Germany, 2018. [Google Scholar]
- Lv, L.; Yan, X.; Feng, L.; Jiang, S.; Lu, Z.; Xie, H.; Sun, S.; Chen, J.; Li, C. Challenge for the detection of microplastics in the environment. Water Environ. Res. 2021, 93, 5–15. [Google Scholar] [CrossRef] [PubMed]
- Wagner, S.; Reemtsma, T. Things we know and don’t know about nanoplastic in the environment. Nat. Nanotechnol. 2019, 14, 300–301. [Google Scholar] [CrossRef]
- Silva, A.B.; Bastos, A.S.; Justino, C.I.L.; da Costa, J.P.; Duarte, A.C.; Rocha-Santos, T.A.P. Microplastics in the environment: Challenges in analytical chemistry—A review. Anal. Chim. Acta 2018, 1017, 1–19. [Google Scholar] [CrossRef]
- Yang, H.; He, Y.; Yan, Y.; Junaid, M.; Wang, J. Characteristics, Toxic Effects, and Analytical Methods of Microplastics in the Atmosphere. Nanomaterials 2021, 11, 2747. [Google Scholar] [CrossRef]
- Chakraborty, I.; Banik, S.; Biswas, R.; Yamamoto, T.; Noothalapati, H.; Mazumder, N. Raman spectroscopy for microplastic detection in water sources: A systematic review. Int. J. Environ. Sci. Technol. 2023, 20, 10435–10448. [Google Scholar] [CrossRef]
- Trujillo, C.; Pérez-Arantegui, J.; Lobinski, R.; Laborda, F. Improving the Detectability of Microplastics in River Waters by Single Particle Inductively Coupled Plasma Mass Spectrometry. Nanomaterials 2023, 13, 1582. [Google Scholar] [CrossRef]
- Huang, S.; Huang, X.; Bi, R.; Guo, Q.; Yu, X.; Zeng, Q.; Huang, Z.; Liu, T.; Wu, H.; Chen, Y.; et al. Detection and Analysis of Microplastics in Human Sputum. Environ. Sci. Technol. 2022, 56, 2476–2486. [Google Scholar] [CrossRef]
- Nigamatzyanova, L.; Fakhrullin, R. Dark-field hyperspectral microscopy for label-free microplastics and nanoplastics detection and identification in vivo: A Caenorhabditis elegans study. Environ. Pollut. 2021, 271, 116337. [Google Scholar] [CrossRef] [PubMed]
- Sun, J.; Dai, X.; Wang, Q.; van Loosdrecht, M.C.M.; Ni, B.J. Microplastics in wastewater treatment plants: Detection, occurrence and removal. Water Res. 2019, 152, 21–37. [Google Scholar] [CrossRef]
- Roch, S.; Brinker, A. Rapid and Efficient Method for the Detection of Microplastic in the Gastrointestinal Tract of Fishes. Environ. Sci. Technol. 2017, 51, 4522–4530. [Google Scholar] [CrossRef] [PubMed]
- Wesch, C.; Barthel, A.K.; Braun, U.; Klein, R.; Paulus, M. No microplastics in benthic eelpout (Zoarces viviparus): An urgent need for spectroscopic analyses in microplastic detection. Environ. Res. 2016, 148, 36–38. [Google Scholar] [CrossRef] [PubMed]
- Witzig, C.S.; Földi, C.; Wörle, K.; Habermehl, P.; Pittroff, M.; Müller, Y.K.; Lauschke, T.; Fiener, P.; Dierkes, G.; Freier, K.P.; et al. When Good Intentions Go Bad-False Positive Microplastic Detection Caused by Disposable Gloves. Environ. Sci. Technol. 2020, 54, 12164–12172. [Google Scholar] [CrossRef]
- Karakolis, E.G.; Nguyen, B.; You, J.B.; Rochman, C.M.; Sinton, D. Fluorescent Dyes for Visualizing Microplastic Particles and Fibers in Laboratory-Based Studies. Environ. Sci. Technol. Lett. 2019, 6, 334–340. [Google Scholar] [CrossRef]
- Lu, Y.; Zhang, Y.; Deng, Y.; Jiang, W.; Zhao, Y.; Geng, J.; Ding, L.; Ren, H. Uptake and Accumulation of Polystyrene Microplastics in Zebrafish (Danio rerio) and Toxic Effects in Liver. Environ. Sci. Technol. 2016, 50, 4054–4060. [Google Scholar] [CrossRef]
- Stock, V.; Laurisch, C.; Franke, J.; Dönmez, M.H.; Voss, L.; Böhmert, L.; Braeuning, A.; Sieg, H. Uptake and cellular effects of PE, PP, PET and PVC microplastic particles. Toxicol. In Vitro 2021, 70, 105021. [Google Scholar] [CrossRef]
- Erni-Cassola, G.; Gibson, M.I.; Thompson, R.C.; Christie-Oleza, J.A. Lost, but Found with Nile Red: A Novel Method for Detecting and Quantifying Small Microplastics (1 mm to 20 μm) in Environmental Samples. Environ. Sci. Technol. 2017, 51, 13641–13648. [Google Scholar] [CrossRef]
- Meyers, N.; Catarino, A.I.; Declercq, A.M.; Brenan, A.; Devriese, L.; Vandegehuchte, M.; De Witte, B.; Janssen, C.; Everaert, G. Microplastic detection and identification by Nile red staining: Towards a semi-automated, cost- and time-effective technique. Sci. Total Environ. 2022, 823, 153441. [Google Scholar] [CrossRef] [PubMed]
- Tong, H.; Jiang, Q.; Zhong, X.; Hu, X. Rhodamine B dye staining for visualizing microplastics in laboratory-based studies. Environ. Sci. Pollut. Res. Int. 2021, 28, 4209–4215. [Google Scholar] [CrossRef] [PubMed]
- Gao, Z.; Wontor, K.; Cizdziel, J.V. Labeling Microplastics with Fluorescent Dyes for Detection, Recovery, and Degradation Experiments. Molecules 2022, 27, 7415. [Google Scholar] [CrossRef] [PubMed]
- Shebeeb, C.M.; Joseph, A.; Farzeena, C.; Dinesh, R.; Sajith, V. Fluorescent carbon dot embedded polystyrene particle: An alternative to fluorescently tagged polystyrene for fate of microplastic studies: A preliminary investigation. Appl. Nanosci. 2022, 12, 2725–2731. [Google Scholar] [CrossRef]
- Wang, J.; Tao, J.; Ji, J.; Wu, M.; Sun, Y.; Li, J.; Gan, J. Use of a Dual-Labeled Bioaccumulation Method to Quantify Microplastic Vector Effects for Hydrophobic Organic Contaminants in Soil. ACS Environ. Au 2023, 3, 233–241. [Google Scholar] [CrossRef]
- Xu, Y.; Zhang, P.; Jin, S.; Liu, C.; Yang, L.; Ao, Z.; Qin, M.; Nie, K.; Hou, Y.; Gao, M. Tracking How Biodegraded Microplastics Enter the Ecosystem with CuInS2@ZnS QDs. J. Phys. Chem. C 2022, 126, 20605–20612. [Google Scholar] [CrossRef]
- Facchetti, S.V.; La Spina, R.; Fumagalli, F.; Riccardi, N.; Gilliland, D.; Ponti, J. Detection of Metal-Doped Fluorescent PVC Microplastics in Freshwater Mussels. Nanomaterials 2020, 10, 2363. [Google Scholar] [CrossRef]
- Frehland, S.; Kaegi, R.; Hufenus, R.; Mitrano, D.M. Long-term assessment of nanoplastic particle and microplastic fiber flux through a pilot wastewater treatment plant using metal-doped plastics. Water Res. 2020, 182, 115860. [Google Scholar] [CrossRef]
- Yin, Y.; Tan, Z.; Hu, L.; Yu, S.; Liu, J.; Jiang, G. Isotope Tracers To Study the Environmental Fate and Bioaccumulation of Metal-Containing Engineered Nanoparticles: Techniques and Applications. Chem. Rev. 2017, 117, 4462–4487. [Google Scholar] [CrossRef]
- Schymura, S.; Rybkin, I.; Uygan, S.S.S.; Drev, S.; Podlipec, R.; Rijavec, T.; Mansel, A.; Lapanje, A.; Franke, K.; Strok, M. Dissolution-based uptake of CeO2 nanoparticles by freshwater shrimp—A dual-radiolabelling study of the fate of anthropogenic cerium in water organisms. Environ. Sci. Nano 2021, 8, 1934–1944. [Google Scholar] [CrossRef]
- Schymura, S.; Fricke, T.; Hildebrand, H.; Franke, K. Elucidating the Role of Dissolution in CeO. Angew. Chem. Int. Ed. Engl. 2017, 56, 7411–7414. [Google Scholar] [CrossRef]
- Hildebrand, H.; Schymura, S.; Holzwarth, U.; Gibson, N.; Dalmiglio, M.; Franke, K. Strategies for radiolabeling of commercial TiO2 nanopowder as a tool for sensitive nanoparticle detection in complex matrices. J. Nanopart. Res. 2015, 17, 2435. [Google Scholar] [CrossRef]
- Lanctôt, C.M.; Al-Sid-Cheikh, M.; Catarino, A.I.; Cresswell, T.; Danis, B.; Karapanagioti, H.K.; Mincer, T.; Oberhänsli, F.; Swarzenski, P.; Tolosa, I. Application of nuclear techniques to environmental plastics research. J. Environ. Radioact. 2018, 192, 368–375. [Google Scholar] [CrossRef]
- Im, C.; Kim, H.; Zaheer, J.; Kim, J.Y.; Lee, Y.J.; Kang, C.M.; Kim, J.S. PET Tracing of Biodistribution for Orally Administered 64Cu-Labeled Polystyrene in Mice. J. Nucl. Med. 2022, 63, 461–467. [Google Scholar] [CrossRef] [PubMed]
- Lee, J.H.; Gomez, I.J.; Sitterle, V.B.; Meredith, J.C. Dye-labeled polystyrene latex microspheres prepared via a combined swelling-diffusion technique. J. Colloid Interface Sci. 2011, 363, 137–144. [Google Scholar] [CrossRef] [PubMed]
- Wang, J.; Li, J.; Sun, S.; Dong, H.; Wu, L.; Zhao, E.; He, F.; Ma, X.; Zhao, Y.S. Revealing molecular diffusion dynamics in polymer microspheres by optical resonances. Sci. Adv. 2023, 9, eadf1725. [Google Scholar] [CrossRef] [PubMed]
- Hansen, C.M. Hansen Solubility Parameters—A Users Handbook; CRC Press: Boca Raton, FL, USA, 2000. [Google Scholar]
- Andrady, A.L. The plastic in microplastics: A review. Mar. Pollut. Bull. 2017, 119, 12–22. [Google Scholar] [CrossRef]
- Mollaeva, M.R.; Yabbarov, N.; Sokol, M.; Chirkina, M.; Mollaev, M.D.; Zabolotskii, A.; Seregina, I.; Bolshov, M.; Kaplun, A.; Nikolskaya, E. Optimization, Characterization and Pharmacokinetic Study of Meso-Tetraphenylporphyrin Metal Complex-Loaded PLGA Nanoparticles. Int. J. Mol. Sci. 2021, 22, 12261. [Google Scholar] [CrossRef]
- Kulenkampff, J.; Stoll, M.; Gründig, M.; Mansel, A.; Lippmann-Pipke, J.; Kersten, M. Time-lapse 3D imaging by positron emission tomography of Cu mobilized in a soil column by the herbicide MCPA. Sci. Rep. 2018, 8, 7091. [Google Scholar] [CrossRef]
- Nayak, J.N.; Aralaguppi, M.I.; Kumar Naidu, B.V.; Aminabhavi, T.M. Thermodynamic Properties of Water + Tetrahydrofuran and Water + 1,4-Dioxane Mixtures at (303.15, 313.15, and 323.15) K. J. Chem. Eng. Data 2004, 49, 468–474. [Google Scholar] [CrossRef]
- Szelecsényi, F.; Blessing, G.; Qaim, S.M. Excitation functions of proton induced nuclear reactions on enriched 61Ni and 64Ni: Possibility of production of no-carrier-added 61Cu and 64Cu at a small cyclotron. Appl. Radiat. Isot. 1993, 44, 575–580. [Google Scholar] [CrossRef]
- Avila-Rodriguez, M.A.; Nye, J.A.; Nickles, R.J. Simultaneous production of high specific activity 64Cu and 61Co with 11.4 MeV protons on enriched 64Ni nuclei. Appl. Radiat. Isot. 2007, 65, 1115–1120. [Google Scholar] [CrossRef] [PubMed]
- Fagadar-Cosma, E.; Mirica, M.C.; Balcu, I.; Bucovicean, C.; Cretu, C.; Armeanu, I.; Fagadar-Cosma, G. Syntheses, spectroscopic and AFM characterization of some manganese porphyrins and their hybrid silica nanomaterials. Molecules 2009, 14, 1370–1388. [Google Scholar] [CrossRef] [PubMed]
- NETZSCH Polymers: Polymer Database. Available online: https://polymers.netzsch.com/Materials (accessed on 6 September 2023).
- Waggoner, A. Fluorescent labels for proteomics and genomics. Curr. Opin. Chem. Biol. 2006, 10, 62–66. [Google Scholar] [CrossRef]
- Gonçalves, M.S. Fluorescent labeling of biomolecules with organic probes. Chem. Rev. 2009, 109, 190–212. [Google Scholar] [CrossRef]
- Derayea, S.M.; Nagy, D.M. Application of a xanthene dye, eosin Y, as spectroscopic probe in chemical and pharmaceutical analysis; a review. Rev. Anal. Chem. 2018, 37, 20170020. [Google Scholar] [CrossRef]
- Yen, C.C.; Perenich, T.A.; Baughman, G.L. Fate of dyes in aquatic systems II. Solubility and octanol/water partition coefficients of disperse dyes. Environ. Toxicol. Chem. Int. J. 1989, 8, 981–986. [Google Scholar] [CrossRef]
- Hansen, C.M. The three dimensional solubility parameter and solvent diffusion coefficient; Danish Technical Press: Copenhagen, Denmark, 1967. [Google Scholar]
- Inglev, R.; Møller, E.; Højgaard, J.; Bang, O.; Janting, J. Optimization of All-Polymer Optical Fiber Oxygen Sensors with Antenna Dyes and Improved Solvent Selection Using Hansen Solubility Parameters. Sensors 2020, 21, 5. [Google Scholar] [CrossRef]
- Enekvist, M.; Liang, X.; Zhang, X.; Dam-Johansen, K.; Kontogeorgis, G.M. Estimating Hansen solubility parameters of organic pigments by group contribution methods. Chin. J. Chem. Eng. 2021, 31, 186–197. [Google Scholar] [CrossRef]
- Wojeicchowski, J.P.; Ferreira, A.M.; Okura, T.; Pinheiro Rolemberg, M.; Mafra, M.R.; Coutinho, J.A.P. Using COSMO-RS to Predict Hansen Solubility Parameters. Ind. Eng. Chem. Res. 2022, 61, 15631–15638. [Google Scholar] [CrossRef]
- Tang, S.; Zhao, C.; Chen, G.; Sun, G. A study on computerized selection of fluorescent dyes for environmentally friendly textile applications. Dyes Pigments 2019, 165, 256–263. [Google Scholar] [CrossRef]
- Solvent Miscibility Chart. Available online: https://www.sigmaaldrich.com/DE/de/technical-documents/technical-article/analytical-chemistry/purification/solvent-miscibility-table (accessed on 6 September 2023).
- European Chemicals Agency: Candidate List of Substances of Very High Concern for Authorisation. Available online: https://echa.europa.eu/candidate-list-table (accessed on 6 September 2023).
- Lyles, M.B.; Cameron, I.L. Interactions of the DNA intercalator acridine orange, with itself, with caffeine, and with double stranded DNA. Biophys. Chem. 2002, 96, 53–76. [Google Scholar] [CrossRef] [PubMed]
- Lerman, L.S. Structural considerations in the interaction of DNA and acridines. Journal of molecular biology 1961, 3, 18-IN14. [Google Scholar] [CrossRef] [PubMed]
- Hambright, P. The coordination chemistry of metalloporphyrins. Coord. Chem. Rev. 1971, 6, 247–268. [Google Scholar] [CrossRef]
- Fleischer, E.B.; Choi, E.I.; Hambright, P.; Stone, A. Porphyrin studies: Kinetics of metalloporphyrin formation. Inorg. Chem. 1964, 3, 1284–1287. [Google Scholar] [CrossRef]
- Tang, S.; Chen, G.; Sun, G. Computer-Assisted Design of Environmentally Friendly and Light-Stable Fluorescent Dyes for Textile Applications. Int. J. Mol. Sci. 2019, 20, 5971. [Google Scholar] [CrossRef]
- Huth, M.; Chen, C.-W.; Wagner, V. Measurement of Hansen solubility parameters for organophilic fluoromica and evaluation of potential solvents for exfoliation. Appl. Clay Sci. 2018, 155, 120–125. [Google Scholar] [CrossRef]
- Oba, Y.; Poulson, S.R. Octanol-water partition coefficients (Kow) vs. pH for fluorescent dye tracers (fluorescein, eosin Y), and implications for hydrologic tracer tests. Geochem. J. 2012, 46, 517–520. [Google Scholar] [CrossRef][Green Version]
- Arbeloa, I.L.; Ojeda, P.R. Molecular forms of rhodamine B. Chem. Phys. Lett. 1981, 79, 347–350. [Google Scholar] [CrossRef]
- Casalini, T.; Salvalaglio, M.; Perale, G.; Masi, M.; Cavallotti, C. Diffusion and aggregation of sodium fluorescein in aqueous solutions. J. Phys Chem. B 2011, 115, 12896–12904. [Google Scholar] [CrossRef]
- Batistela, V.R.; da Costa Cedran, J.; Moisés de Oliveira, H.P.; Scarminio, I.S.; Ueno, L.T.; Eduardo da Hora Machado, A.; Hioka, N. Protolytic fluorescein species evaluated using chemometry and DFT studies. Dyes Pigments 2010, 86, 15–24. [Google Scholar] [CrossRef]
- Waheed, A.A.; Rao, K.S.; Gupta, P.D. Mechanism of dye binding in the protein assay using eosin dyes. Anal. Biochem. 2000, 287, 73–79. [Google Scholar] [CrossRef] [PubMed]
- Gao, D.; Tian, Y.; Liang, F.; Jin, D.; Chen, Y.; Zhang, H.; Yu, A. Investigation on the pH-dependent binding of Eosin Y and bovine serum albumin by spectral methods. J. Lumin. 2007, 127, 515–522. [Google Scholar] [CrossRef]
- Welle, F. Diffusion Coefficients and Activation Energies of Diffusion of Organic Molecules in Polystyrene below and above Glass Transition Temperature. Polymers 2021, 13, 1317. [Google Scholar] [CrossRef] [PubMed]
- Welle, F. Activation energies of diffusion of organic migrants in cyclo olefin polymer. Int. J. Pharm. 2014, 473, 510–517. [Google Scholar] [CrossRef] [PubMed]
- Yoshioka, A.; Tashiro, K. Solvent Effect on the Glass Transition Temperature of Syndiotactic Polystyrene Viewed from Time-Resolved Measurements of Infrared Spectra at the Various Temperatures and Its Simulation by Molecular Dynamics Calculation. Macromolecules 2004, 37, 467–472. [Google Scholar] [CrossRef]
- Ahmad, A.; Li, S.-H.; Zhao, Z.-P. Insight of organic molecule dissolution and diffusion in cross-linked polydimethylsiloxane using molecular simulation. J. Membr. Sci. 2021, 620, 118863. [Google Scholar] [CrossRef]
- Kalathi, J.T.; Yamamoto, U.; Schweizer, K.S.; Grest, G.S.; Kumar, S.K. Nanoparticle diffusion in polymer nanocomposites. Phys. Rev. Lett. 2014, 112, 108301. [Google Scholar] [CrossRef]
- Zhang, C.; Guo, Y.; Priestley, R.D. Glass Transition Temperature of Polymer Nanoparticles under Soft and Hard Confinement. Macromolecules 2011, 44, 4001–4006. [Google Scholar] [CrossRef]
- Reynier, A.; Dole, P.; Humbel, S.; Feigenbaum, A. Diffusion coefficients of additives in polymers. I. Correlation with geometric parameters. J. Appl. Polym. Sci. 2001, 82, 2422–2433. [Google Scholar] [CrossRef]
- Reynier, A.; Dole, P.; Feigenbaum, A. Additive diffusion coefficients in polyolefins. II. Effect of swelling and temperature on the D = f(M) correlation. J. Appl. Polym. Sci. 2001, 82, 2434–2443. [Google Scholar] [CrossRef]
- George, S.C.; Thomas, S. Transport phenomena through polymeric systems. Prog. Polym. Sci. 2001, 26, 985–1017. [Google Scholar] [CrossRef]
- Sato, T.; Ebisawa, K.; Sue, K.; Ito, S.; Saito, T.; Itoh, N. The Kinetics of the Incorporation of Metals into Tetraphenylporphyrin with Metal Salts in High-Temperature Water. Ind. Eng. Chem. Res. 2012, 51, 13908–13914. [Google Scholar] [CrossRef]
- Ralphs, K.; Zhang, C.; James, S.L. Solventless mechanochemical metallation of porphyrins. Green Chem. 2017, 19, 102–105. [Google Scholar] [CrossRef]
- Schlyer, D.J.; Pillai, M.; Haji-Saeid, M. Cyclotron Produced Radionuclides: Physical Characteristics and Production Methods. IAEA Tech. Rep. Ser. 2009, 468, 266. [Google Scholar]
- Schlyer, D.J.; Van den Winkel, P.; Ruth, T.J.; Vora, M.M.; Pillai, M.; Haji-Saeid, M. Cyclotron produced radionuclides: Principles and practice. IAEA Tech. Rep. Ser. 2008, 465, 215. [Google Scholar]
- Porphyrin Systems: Porphyrin Product Catalog. Available online: https://porphyrin-systems.de/produkt-kategorie/porphyrins/ (accessed on 6 September 2023).
- PorphyChem SAS: Metaloporphyrins Product Catalog. Available online: https://shop.porphychem.com/porphyrins-products/metalloporphyrins.html (accessed on 6 September 2023).
- Por-Lab: Tetraphenylporphine Product Catalog. Available online: https://porphyrin-laboratories.com/ger/katalog/ (accessed on 6 September 2023).
- Stricker, A.; Hilpmann, S.; Mansel, A.; Franke, K.; Schymura, S. Data publication: (Radio)labeling of Micro-/Nanoplastics by In-diffusion. RODARE Database 2023. [Google Scholar] [CrossRef]


| Material | Median Size [µm] | Average Size [µm] | Std. Dev. [µm] | Std. Dev. [%] | Tg [°C] |
|---|---|---|---|---|---|
| PE PS PET PVDC PA | 42.58 0.1078 197.4 84.10 31.07 | 41.96 0.1078 208.7 91.97 32.72 | 14.95 0.0003 89.76 63.18 6.99 | 35.6 0.3 43.0 68.7 21.4 | −130 … −100 80 … 105 70 … 85 −18 … 15 40 … 50 |
| Dye | Molar Mass [g/mol] | Density [g/mL] | Molar Volume [mL/mol] | Peak Maximum λA/λE [nm] | Extinction Coefficient [L/molcm] | log KOW |
|---|---|---|---|---|---|---|
| acridine orange rhodamine 6G rhodamine B fluorescein eosin TPP | 308.81 479.02 479.02 376.28 698.86 614.74 | 1.001 1.260 1.310 1.601 1.018 1.270 | 308.5 380.2 365.7 235.0 685.5 485.0 | 492/530 526/550 555/574 489/514 516/538 440/n.d. | 17753 83476 89191 33148 51347 n.d. | −0.38 0 1.6 <−3 * −0.92 >10 * |
| Material | R0 | |||
|---|---|---|---|---|
| PE PS PET PVDC PA | 17.67 19.46 18.43 18.12 17.5 | 5.27 6.30 6.30 8.08 5.3 | 3.25 4.12 7.30 5.66 10.1 | 7.63 7.24 4.93 9.56 5.5 |
| THF water acetone ethanol DMF DMSO 1-propanol acetonitrile 1,4-dioxane methanol isopropanol acetic acid | 16.8 15.5 18.4 15.8 17.4 18.4 16 15.3 19 15.1 15.8 14.5 | 5.7 16 10.4 8.8 13.7 16.4 6.8 18 1.8 12.3 6.1 8 | 8 42.3 7 19.4 11.3 10.2 17.4 6.1 7.4 22.3 16.4 13.5 | - - - - - - - - - - - - |
| 1-octanol rhodamine B | 17 17.8 | 3.3 4.3 | 11.9 6.2 | - - |
| Material | PE | PS | PET | PVDC | PA |
|---|---|---|---|---|---|
| THF water acetone ethanol DMF DMSO 1-propanol acetonitrile 1,4-dioxane methanol isopropanol acetic acid 1-octanol | 5.08/0.67 40.73/5.34 6.52/0.85 16.95/2.22 11.67/1.53 13.20/1.73 14.62/1.92 13.88/1.82 6.03/0.79 20.95/2.75 13.70/1.80 12.36/1.62 8.98/1.18 | 6.61/0.91 40.18/5.55 5.44/0.75 17.12/2.36 11.10/1.53 11.98/1.65 14.98/2.07 14.49/2.00 5.64/0.78 21.03/2.91 14.29/1.97 13.75/1.90 9.68/1.34 | 3.39/0.69 36.79/7.46 4.11/0.83 13.43/2.72 8.66/1.76 10.51/2.13 11.22/2.27 13.33/2.70 4.64/0.94 17.48/3.54 10.52/2.13 10.16/1.35 6.19/1.26 | 2.56/0.46 34.17/6.21 6.23/1.13 10.50/1.91 8.49/1.54 11.25/2.04 8.03/1.46 14.02/2.55 5.34/0.97 14.46/2.70 7.20/1.31 7.41/1.35 2.87/0.52 | 4.26/0.45 37.85/3.96 2.74/0.29 14.52/1.52 8.09/0.85 9.49/0.99 12.55/1.31 11.42/1.19 6.75/0.71 18.20/1.9 11.87/1.24 10.67/1.12 8.17/1.03 |
| Material | Radiolabeling Yield [%] | Specific Activity [kBq/mg] | Detection Limit 1 [ng/µg/L] |
|---|---|---|---|
| [64Cu]TPP [64Cu]PE [64Cu]PS [64Cu]PA [64Cu]PET [64Cu]PVDC | 98.6 87.7 92.4 97.1 88.4 93.2 | 12760 14.5 409.9 17.5 16.2 15.9 | 0.078/0.004 69/3.4 3/0.1 58/2.9 62/3.1 67/3.3 |
| Material | Ra |
|---|---|
| THF water 1-octanol PE PS PET PVDC PA | 3.03 38.23 6.00 3.12 4.39 2.61 4.07 3.87 |
| Metal | Radiotracer | t1/2 |
|---|---|---|
| Cu Zn Mn Co Fe Ni Pd Ag Au Ba V Cr Cd Ti P Ga In Pb Zr | 64Cu 65Zn 54Mn 57Co 55Fe/59Fe 63Ni 103Pd 110mAg/105Ag 198Au 133Ba 48V 51Cr 109Cd 44Ti/45Ti 32P 67Ga 111In 203Pb 88Zr/89Zr | 12.7 h 244.06 days 312.3 days 271.79 days 2.737 years/44.495 days 100.1 years 16.991 days 249.79 days/41.29 days 2.69 days 10.5 years 15.9735 days 27.7025 days 462.6 days 49 years/184.8 min 14.26 days 3.2612 days 2.8047 days 59.1 h 83.4 days/78.41 h |
Disclaimer/Publisher’s Note: The statements, opinions and data contained in all publications are solely those of the individual author(s) and contributor(s) and not of MDPI and/or the editor(s). MDPI and/or the editor(s) disclaim responsibility for any injury to people or property resulting from any ideas, methods, instructions or products referred to in the content. |
© 2023 by the authors. Licensee MDPI, Basel, Switzerland. This article is an open access article distributed under the terms and conditions of the Creative Commons Attribution (CC BY) license (https://creativecommons.org/licenses/by/4.0/).
Share and Cite
Stricker, A.; Hilpmann, S.; Mansel, A.; Franke, K.; Schymura, S. Radiolabeling of Micro-/Nanoplastics via In-Diffusion. Nanomaterials 2023, 13, 2687. https://doi.org/10.3390/nano13192687
Stricker A, Hilpmann S, Mansel A, Franke K, Schymura S. Radiolabeling of Micro-/Nanoplastics via In-Diffusion. Nanomaterials. 2023; 13(19):2687. https://doi.org/10.3390/nano13192687
Chicago/Turabian StyleStricker, Alexandra, Stephan Hilpmann, Alexander Mansel, Karsten Franke, and Stefan Schymura. 2023. "Radiolabeling of Micro-/Nanoplastics via In-Diffusion" Nanomaterials 13, no. 19: 2687. https://doi.org/10.3390/nano13192687
APA StyleStricker, A., Hilpmann, S., Mansel, A., Franke, K., & Schymura, S. (2023). Radiolabeling of Micro-/Nanoplastics via In-Diffusion. Nanomaterials, 13(19), 2687. https://doi.org/10.3390/nano13192687