1. Introduction
Over 25 billion USD was generated in revenue by the U.S. cosmetic industry in 2021 due to increased consumer desire to improve their overall health and wellness. As a result, many cosmetic companies are now marketing their products with buzzwords such as vegan, naturally derived, eco-friendly, and cruelty-free [
1] to target health-conscious consumers. This “clean beauty” marketing strategy originates from the push toward greener lifestyles and the use of environmentally safe and nontoxic products [
2]. Despite their claims, clean beauty personal care products include potentially harmful chemicals, inadequate transparency on ingredient labels, and concealed substances. Cosmetic manufacturers use various ingredients to brand their products as convenient, long-lasting, and compatible with other skin applications. NPs are not the only dangerous ingredients added to FCs to enhance their physical and chemical properties. For example, cosmetics labeled as “wear-resistant” or “long-lasting” have been found to contain high concentrations of per- and polyfluoroalkyl substances (PFAs) [
3]. These findings, along with others, are focused on raising awareness of the use of chemicals in personal care products and disclosing their harmful effects to consumers [
4,
5,
6].
Common additives in various cosmetic products include minerals, vegetable powders, oils, fats, dyes and pigments, preservatives, ultraviolet filters, water, solvents, and fragrances [
7]. In the U.S., the Food and Drug Administration (FDA) has lenient labeling requirements for cosmetics with regard to the disclosure of these additives and chemicals. The main ingredients required to undergo FDA approval are color additives, which are defined by the FDA as “any dye, pigment, or other substance that can impart color to a cosmetic” [
8]. While the FDA does not require premarket approval for most cosmetic ingredients, they have the ability to enforce the Fair Packaging and Labeling Act (FPLA) guidelines if there are notable health concerns with a product. The FPLA states, “Informed consumers are essential to the fair and efficient functioning of a free market economy” [
9]. Metalss typically in the form of metal oxides, manganese dioxide (MnO
2), chromium oxide (CrO
3), magnesium oxide (MgO), aluminum oxide (Al
2O
3), silver (Ag), bismuth oxide (Bi
2O
3), and tin oxide (SnO
2) are commonly added to powder-based facial cosmetic products (herein referred to as FCs) to enhance shine, gloss, or sparkle and can act as absorbent or bulking materials [
7]. To date, there are no regulations enforcing transparency on ingredient lists when it comes to the use of nanoparticles (NPs) in consumer care products.
NPs are operationally defined as particles smaller than 100 nm in size and are added to FCs to alter their physical and chemical properties, thereby enhancing their color, longevity, and quality [
10,
11]. In 2009, the cosmetic industry was one of the first to incorporate NPs in consumer care products, formulating over 13% of nanotechnology-based products [
12]. Notably, titanium dioxide (TiO
2) and zinc oxide (ZnO) NPs are commonly used in sunscreen formulations as aerosols, powders, and liquids [
13,
14,
15], potentially causing harmful effects to aquatic and human life. For example, TiO
2 and ZnO NPs have been identified as the primary cause of the destruction of entire coral reef colonies [
16]. Other studies provide evidence that NPs may cross the epithelial barrier and risk toxicity to living organisms [
17,
18]. This paper highlights the need for transparency regarding the use of NPs in FC products, especially for health-conscious individuals who assume their clean beauty products are nontoxic, as some ingredients may lead to negative environmental and health impacts [
19,
20,
21].
Despite reports on their harmful effects, the use of NPs in consumer care products, especially FCs, is not common knowledge to consumers, especially those advertised with buzzwords like vegan, nontoxic, organic, or natural. Further, the FDA does not enforce the disclosure of NPs on FC ingredient lists or the use of buzzwords that create the assumption that their products are safe and healthy. The lack of transparency regarding the use of NPs is problematic and a disservice to consumers who assume clean beauty products marked as vegan or nontoxic are safe to use. In 2022, the Science Advisory Board (SAB) of the Environmental Protection Agency (EPA) released a report entitled “Review of the EPA’s Draft Fifth Contaminant Candidate List (CCL 5)” stating NPs were an emerging public health concern due to their unpredictable behavior and the overall lack of information regarding their persistence, reactivity, and short- and long-term impacts on human health and the environment [
22].
All things considered, there is a large gap in the regulatory standards between the FDA and the EU on the use of nanoparticles in food and consumer care products. EU regulations enforce transparency on package labeling when NPs are added to cosmetic formulations [
23]. This action prioritizes consumer awareness as to what cosmetic ingredients they are using on their bodies despite many unknown effects of NPs. Studies have shown that NPs enter aquatic environments through many sources including runoff, industrial applications and atmospheric deposition [
24]. Once in the marine environment, NPs can move laterally and vertically, potentially adsorbing to organic matter [
25,
26,
27,
28], zooplankton [
29,
30], and other organisms [
31].
Although numerous techniques are capable of characterizing inorganic NPs, few can disentangle NPs from other product ingredients due to their complex formulations. Other analyses to determine the size and distribution of NPs include microscopy, spectroscopy, and X-ray diffraction (XRD). However, these methods often require intense sample preparation and have low sample throughput. Previous approaches have utilized inductively coupled plasma–optical emission spectroscopy (ICP-OES) and inductively coupled plasma–mass spectrometry (ICP-MS) to detect and quantify bulk metal concentrations present in cosmetics [
32,
33,
34]. However, studies focused on the presence, characterization, and size of NPs in FCs are lacking. Recently, the use of single-particle ICP-MS (spICP-MS) for NP detection in complex matrices has been reported [
35,
36,
37,
38]. In 2017, de la Calle et al. reported the use of spICP-MS for the screening of TiO
2 and Au NPs in cosmetic matrices including shampoos, sunscreens, creams, and toothpastes [
39]. They also emphasized the importance of consumer awareness regarding the presence of NPs in cosmetics, further validating the need for methods to identify, quantify, and characterize NPs in complex formulations. In comparison to other analytical techniques, the application of spICP-MS/MS is a relatively simple, fast, and routine analysis to observe NPs present in FC products without the need for overcomplicated sample preparation. Additionally, the utilization of tandem mass spectrometry can reduce spectral overlap and improve the limits of detection [
40].
The purpose of this study was to utilize single-particle tandem ICP-MS (spICP-MS/MS) as a comprehensive screening tool for detecting NPs in FCs. The information gained from this study will contribute to the literature regarding the need for transparency when using additives in consumer care products and the presence of NPs in cosmetics found in local U.S. stores that are not disclosed on the packaging labels, especially those claiming to be nontoxic. The method established in this study offers a quick screening tool to analyze FCs for the presence of NPs in complex cosmetic formulations.
2. Materials and Methods
2.1. Reagents
Multielement stock solutions were purchased from Agilent and Sigma-Aldrich (Sigma-Aldrich, St. Louis, MO, USA) and were prepared in 1% (v/v) trace-metal-grade HNO3 (VWR, Radnor, PA, USA). Silver nanospheres (20, 50, 100, and 200 nm) suspended in sodium citrate were purchased from Nanocomposix (San Diego, CA, USA) as a reference material for single-particle size determination. Stock solutions of Ag nanospheres were diluted with nanopure water (Sartorius nanopure system, Göttingen, Germany) and prepared daily for analysis. Triton X-100 (1%) was used to prevent agglomeration and maximize the suspension of NPs present in the FC samples (Alpha Teknova, Hollister, CA, USA).
2.2. Cosmetics Selected for the Study
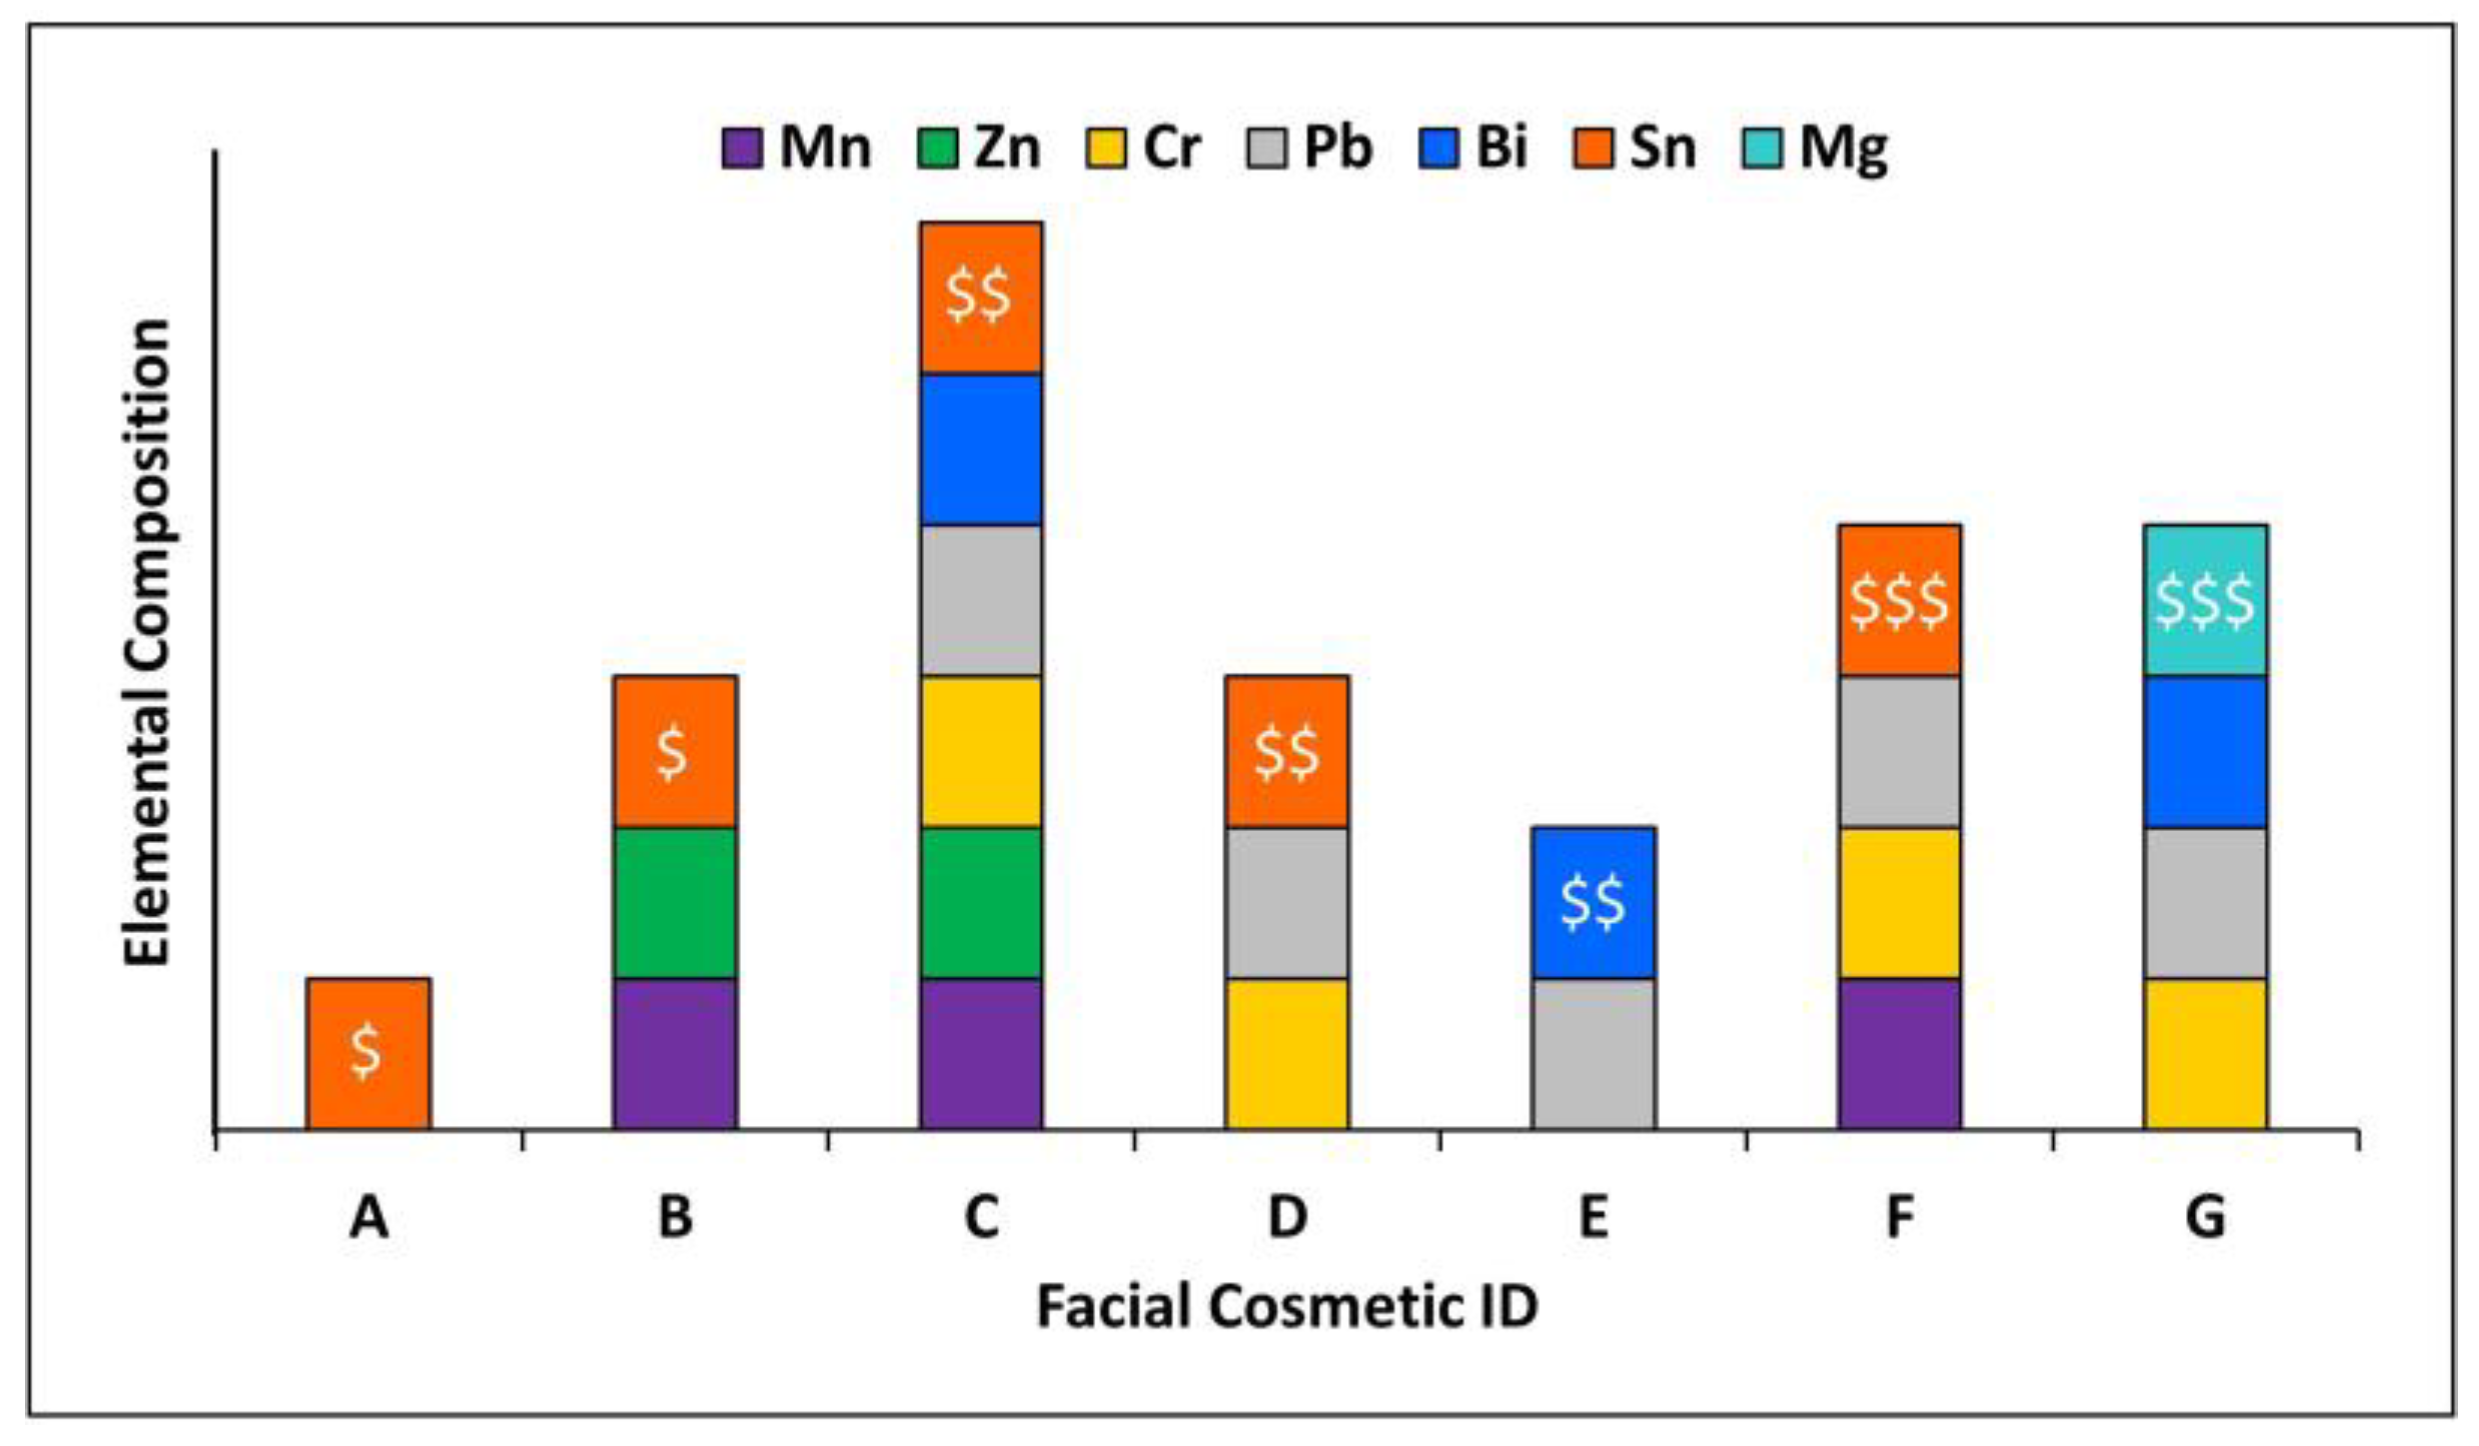
Several cosmetic samples, in the form of eyeshadows and facial powders, were purchased from local retailers in the United States. Products were purchased to obtain a range of low-end (low cost,
$) to high-end (high cost,
$$$) samples. The samples contained a range of colors and shade varieties such as matte shades, glitter shades, metallic shades, and shimmer shades. Overall, seven FCs were screened for the presence of NPs (five eyeshadows and two facial powders). Sample identification and descriptions are listed in
Table 1.
2.3. Standard and Sample Preparation
Standard solutions: Calibration standards for single-particle analysis were prepared from multielement stock solutions. Standards were prepared daily and were serially diluted by volume to a final concentration of 1 µg/L using a 1% solution of nitric acid as the diluent. The diluent was also used as the ionic blank for calibration.
Reference materials: The silver nanoparticle reference material was diluted to concentrations between 20 and 5250 ng/L with nanopure water as the diluent. Reference materials were agitated on a shaker and sonicated after dilution to ensure particle suspension and homogeneity. Four Ag reference standards (20, 50, 100, and 200 nm) were analyzed. The final concentration of each reference standard varied by size, with larger sizes requiring higher concentrations.
Sample Preparation: First, 0.1 g of each FC was dispersed into a 50 mL solution of 1% Triton X-100 in nanopure water. The samples were briefly shaken by hand before sonication in an ultrasonic bath for 2–3 min prior to analysis. The dilutions for each sample were made in the following ratios: 1:1, 1:3, 1:7, 1:15, 1:31, and 1:63. Each sample was shaken and sonicated in between each dilution. Samples were analyzed within 8 h of preparation to maximize particle suspension and stability.
Matrix Effect: In order to observe matrix effects, three solutions were prepared: (1) an unspiked FC sample, (2) a 1:1 dilution of an FC sample spiked with a known concentration of a 50 nm Ag NP reference material, and (3) a matrix-free reference material (RM). Each was suspended in 1% Triton X-100. Values for particle count, NPC, mass concentration, and mean size were averaged between five injections (n = 5). Recovery percentages were calculated based on the % recovered in the spiked sample versus the RM.
2.4. Instrumentation
An Agilent 8900 ICP-MS/MS (Agilent Technologies, Santa Clara, CA, USA) equipped with nickel sampling and skimmer cones, a concentric glass nebulizer, a quartz spray chamber, and a 1.0 mm quartz torch was operated in single-particle mode. The instrument was tuned daily to optimize sensitivity. Masshunter software (Version 5.2) was used for all ICP-MS/MS analyses and data curation. The operational parameters for the analysis can be found in
Table 2. Analyses were performed measuring the monitored masses (
Table 2) in Time-Resolved Analysis (TRA) mode. During tandem MS, helium gas mode was utilized and both quadrupoles were set to the indicated monitored mass for on-mass measurements. The nebulization efficiency was calculated by the instrument software to obtain accurate NP sizes and elemental compositions. The nebulization efficiency is the amount of analyte that enters the plasma in relation to the amount of analyte delivered to the nebulizer. For this study, the nebulization efficiency was calculated using the Ag reference material, maintaining a value of 0.06–0.065, or 6–6.5%. The calculation was based on the particle frequency method established by Pace et al. [
41].
Particle diameter was calculated by the software, which assumed particles were spherical in nature and had a specified chemical composition. The particle density and mass fraction formula of the assumed chemical composition were dependent on the particle diameter and affected the size distribution. The assumed chemical compositions in this study were chosen based on common cosmetic ingredients as well as the ingredients listed on the product packaging of the chosen samples. The assumed chemical compositions are listed in
Table 3, along with their respective particle densities and mass fractions.
2.5. Transmission Electron Microscopy
A random sample was selected to confirm the presence of NPs in the FCs using transmission electron microscopy (TEM) to complement the spICP-MS/MS data. Sample G was dispersed in 200-proof ethanol at a concentration of 2.5 mg/mL, prepared on a Lacey/Carbon 200-mesh copper grid, and evaporated overnight. TEM images were obtained on a JEOL 2010 equipped with an EDAX genesis energy-dispersive spectroscopy (EDS) system operating at an accelerating voltage of 200 kV with an emission current of 109 μA.
Figure S9 illustrates the presence of nanoparticles smaller than 100 nm.
2.6. Baseline and Particle Detection Threshold Determination
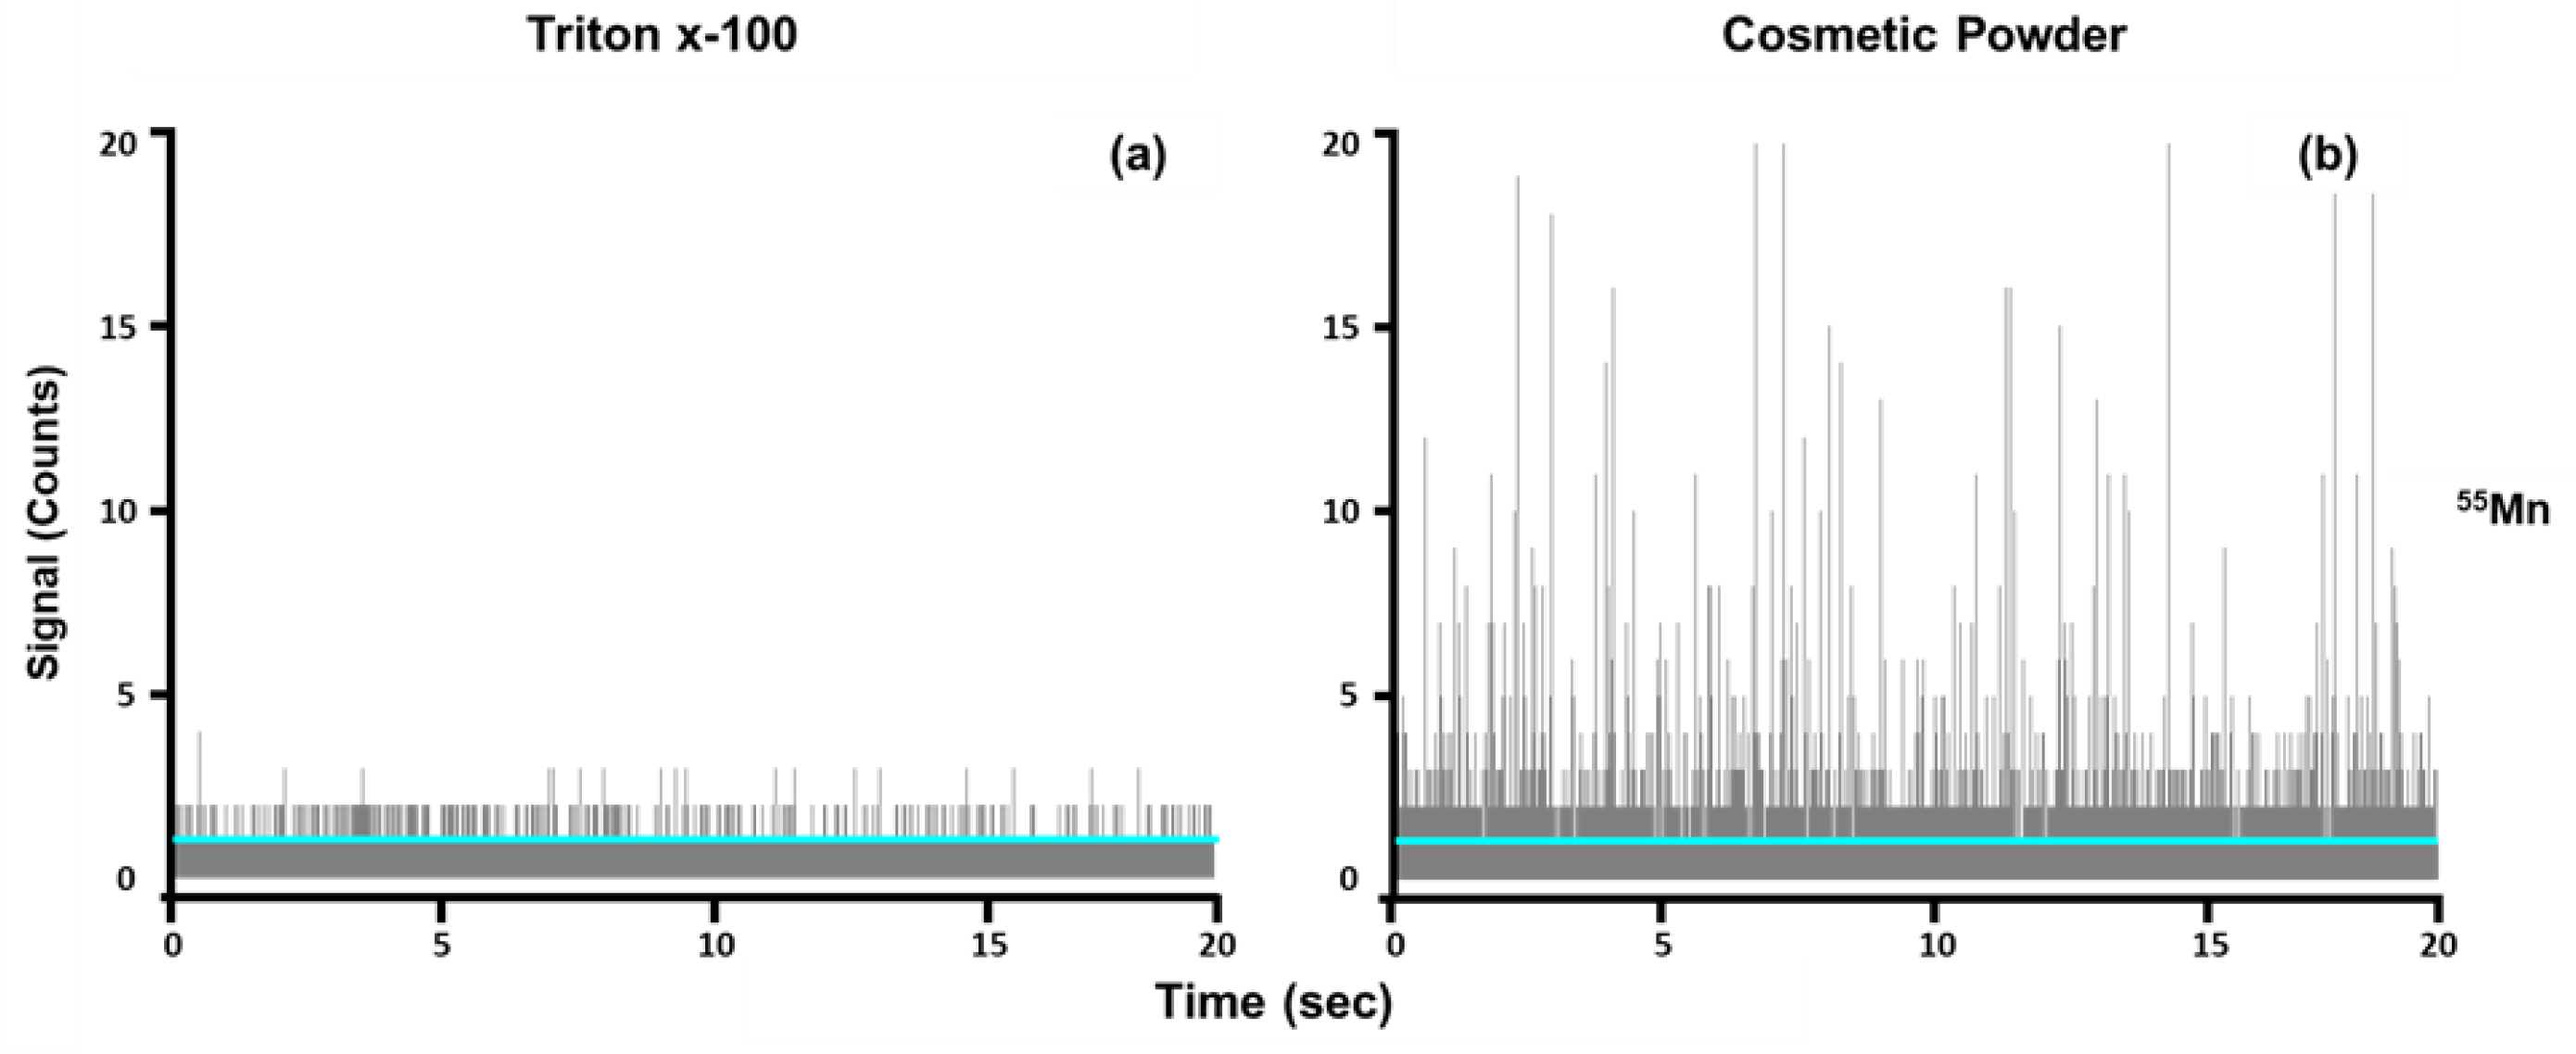
Masshunter determined the particle baseline (Y
B) automatically using a proprietary algorithm. The diluent (1% Triton x-100) was used as a blank. Three replicates of the blank were analyzed, and the mean intensity values for the three runs were averaged for each element. In cases where the software determined that the baseline for the samples was lower than the baseline calculated for the blank, the baseline was manually adjusted to equal the calculated mean intensity value of the blank (
Figure 1). This was performed in an effort to minimize false positives so that signal intensities lower than the baseline observed in the blank were not considered as particle events.
A challenge that must be considered in single-particle analysis is the presence of particles in the blank, especially in cases where multiple elements are being screened simultaneously, thereby making it difficult to avoid the detection of particles in the blank. Therefore, a critical value for the number of particles should be determined to confirm the presence of particles in the sample at some degree higher than that in the blank. In this study, this value was calculated from the mean number of particles detected in the blank (N
B) (Equation (1)). Particles were confirmed when the number of particles detected in the sample exceeded the value calculated using Equation (1) [
43]:
Once the baseline was established and the presence of particles had been confirmed, two particle detection thresholds were calculated for each element in each sample based on Equations (2)–(5). These particle detection threshold calculations were specifically established for microsecond dwell time spICP-MS in samples with high background [
44]. This technique was later applied by Vidmar et al. for the screening of nanoparticles in food matrices [
35]. Thresholds I (Equation (2)) and II (Equation (3)) are considered “critical values”, where Threshold I is applied to baselines higher than five counts and Threshold II is applied to baselines lower than five counts. In calculations of Threshold I and II, only errors related to the detection of false positives are considered. Thresholds III (Equation (4)) and IV (Equation (5)) are considered “detection values” and are applied to baselines higher than five counts and lower than five counts, respectively. A more conservative approach is taken when calculating Thresholds III and IV, which account for both false positives and negatives [
44].
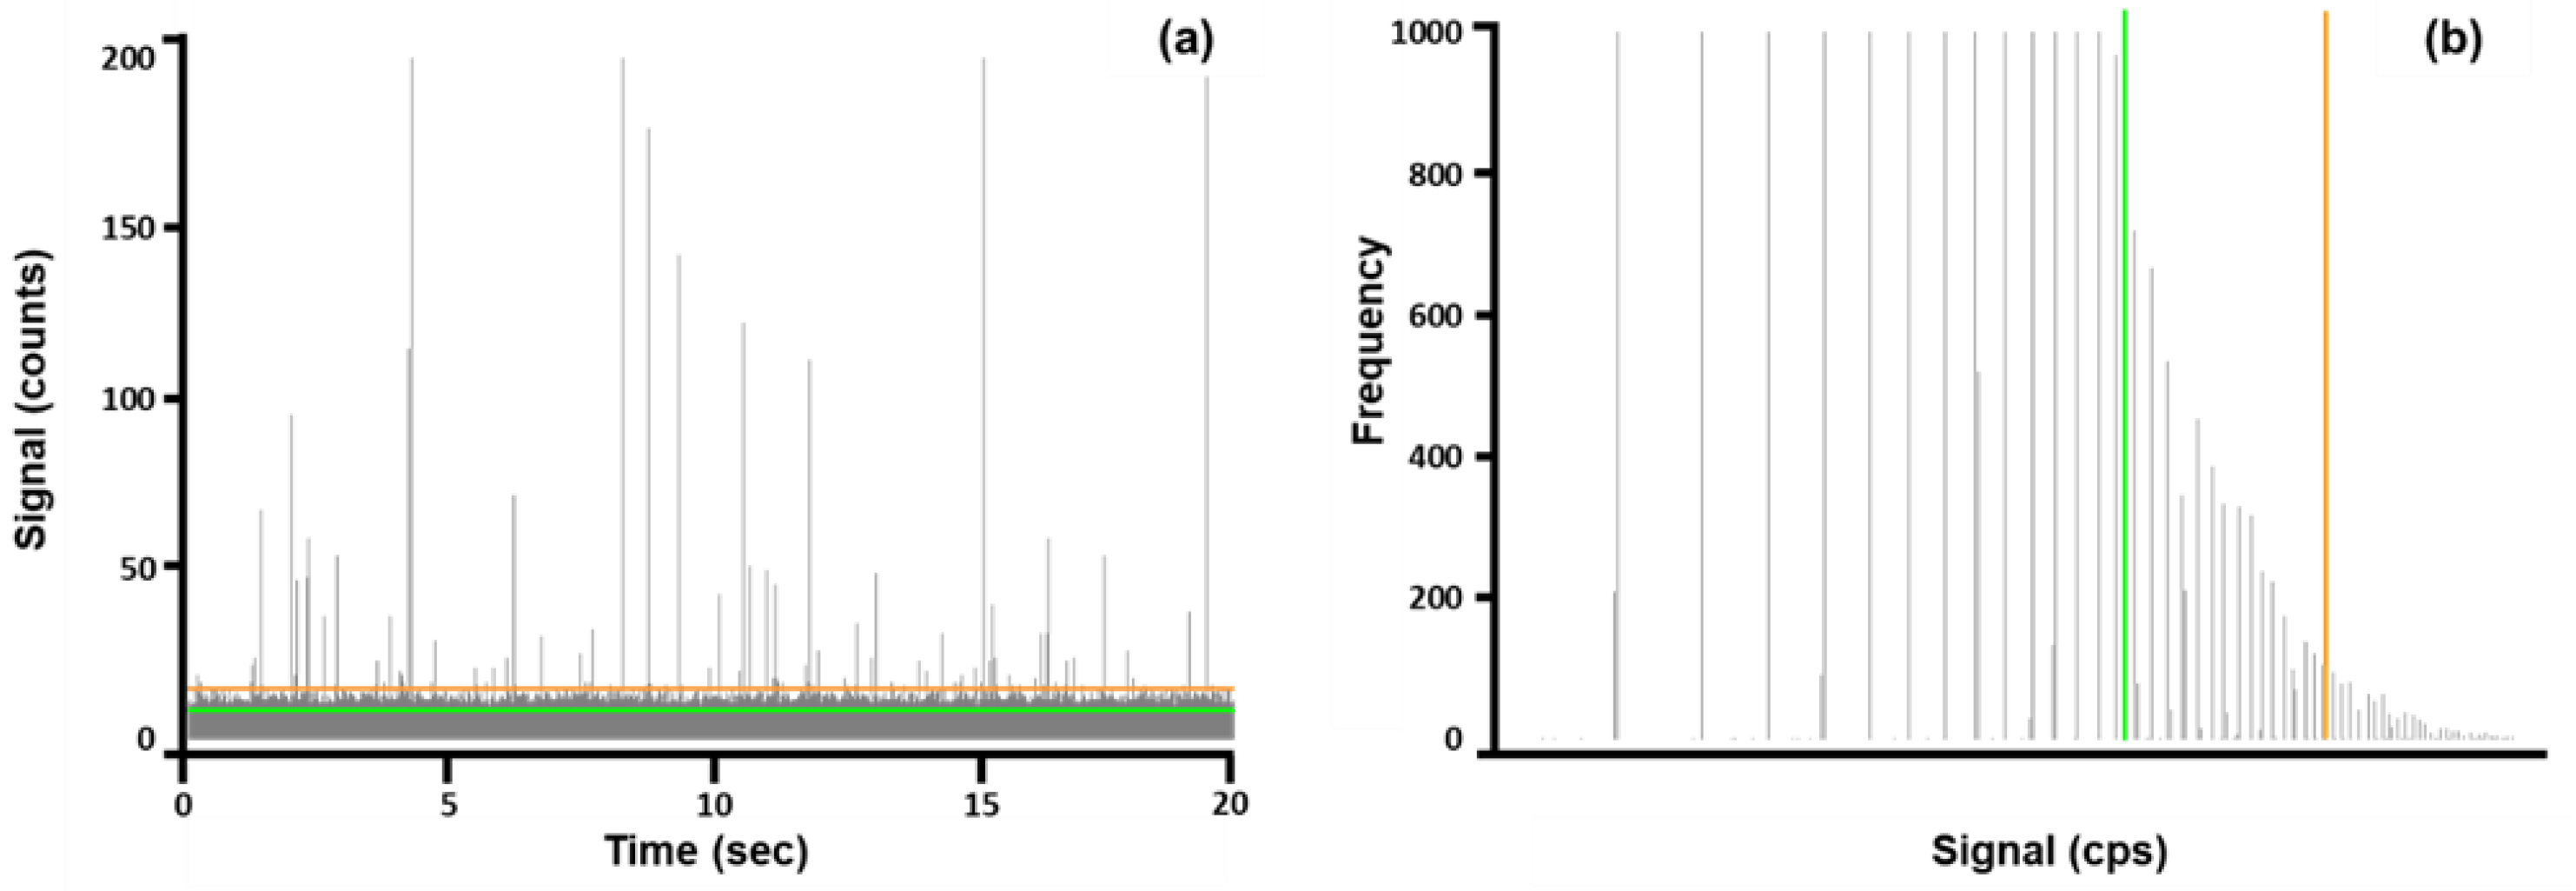
Although the software determined a particle detection threshold, this value could be manually inputted based on user preference. In this case, all particle detection thresholds were entered manually to maintain consistent data treatment. The placement of Threshold I and Threshold III are illustrated as a representative time scan (
Figure 2a) and signal distribution plot (
Figure 2b) for Cr NPs detected in FCs. The signal distribution plot was translated from the time scan.
The number of particles, limit of detection (LOD) size, and most frequent size were determined after manually entering the particle detection thresholds into the Masshunter software. Values for the calculated thresholds presented in
Figure 2 are listed in
Table 4.


