
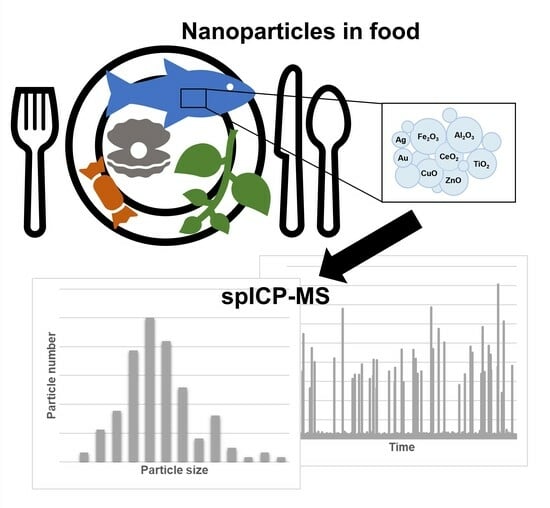
Application of Single Particle ICP-MS for the Determination of Inorganic Nanoparticles in Food Additives and Food: A Short Review


Abstract
:
1. Introduction
2. Literature Search
3. Studied Food Matrices and Nanoparticles
4. Sample Collection and Sample Preparation
5. Analytical Approaches
6. Method Validation
7. Overview and Future Perspectives
Author Contributions
Funding
Data Availability Statement
Acknowledgments
Conflicts of Interest
References
- Tschiche, H.R.; Bierkandt, F.S.; Creutzenberg, O.; Fessard, V.; Franz, R.; Greiner, R.; Gruber-Traub, C.; Haas, K.-H.; Haase, A.; Hartwig, A.; et al. Analytical and Toxicological Aspects of Nanomaterials in Different Product Groups: Challenges and Opportunities. NanoImpact 2022, 28, 100416. [Google Scholar] [CrossRef]
- Turck, D.; Bohn, T.; Castenmiller, J.; De Henauw, S.; Ildico Hirsch-Ernst, K.; Maciuk, A.; Mangelsdorf, I.; McArdle, H.J.; Naska, A.; Pelaez, C.; et al. Safety of Iron Hydroxide Adipate Tartrate as a Novel Food Pursuant to Regulation (EU) 2015/2283 and as a Source of Iron in the Context of Directive 2002/46/EC. EFSA J. 2021, 19, e06935. [Google Scholar] [CrossRef] [PubMed]
- De Vos, S.; Waegeneers, N.; Verleysen, E.; Smeets, K.; Mast, J. Physico-Chemical Characterisation of the Fraction of Silver (Nano)Particles in Pristine Food Additive E174 and in E174-Containing Confectionery. Food Addit. Contam. Part A 2020, 37, 1831–1846. [Google Scholar] [CrossRef] [PubMed]
- Geiss, O.; Ponti, J.; Senaldi, C.; Bianchi, I.; Mehn, D.; Barrero, J.; Gilliland, D.; Matissek, R.; Anklam, E. Characterisation of Food Grade Titania with Respect to Nanoparticle Content in Pristine Additives and in Their Related Food Products. Food Addit. Contam. Part A 2020, 37, 239–253. [Google Scholar] [CrossRef] [PubMed]
- Kermanizadeh, A.; Cassee, F.R.; de Jong, W. The Potential Adverse Effects of Engineered Nanomaterial Exposure. In Molecular and Integrative Toxicology; Springer Science and Business Media B.V.: Berlin/Heidelberg, Germany, 2021; pp. 41–58. [Google Scholar]
- Bouwmeester, H.; van der Zande, M.; Jepson, M.A. Effects of Food-borne Nanomaterials on Gastrointestinal Tissues and Microbiota. WIREs Nanomed. Nanobiotechnol. 2018, 10, e1481. [Google Scholar] [CrossRef] [PubMed]
- Nanotechnology Programs at FDA. Available online: https://www.fda.gov/science-research/science-and-research-special-topics/nanotechnology-programs-fda (accessed on 29 May 2023).
- CFR—Code of Federal Regulations Title 21. Available online: https://www.accessdata.fda.gov/scripts/cdrh/cfdocs/cfcfr/CFRSearch.cfm?CFRPart=73 (accessed on 31 May 2023).
- More, S.; Bampidis, V.; Benford, D.; Bragard, C.; Halldorsson, T.; Hernández-Jerez, A.; Hougaard Bennekou, S.; Koutsoumanis, K.; Lambré, C.; Machera, K.; et al. Guidance on Risk Assessment of Nanomaterials to Be Applied in the Food and Feed Chain: Human and Animal Health. EFSA J. 2021, 19, 6768. [Google Scholar] [CrossRef]
- More, S.; Bampidis, V.; Benford, D.; Bragard, C.; Halldorsson, T.; Hernández-Jerez, A.; Bennekou, S.H.; Koutsoumanis, K.; Lambré, C.; Machera, K.; et al. Guidance on Technical Requirements for Regulated Food and Feed Product Applications to Establish the Presence of Small Particles Including Nanoparticles. EFSA J. 2021, 19, 6769. [Google Scholar] [CrossRef]
- Younes, M.; Aquilina, G.; Castle, L.; Engel, K.; Fowler, P.; Frutos Fernandez, M.J.; Fürst, P.; Gundert-Remy, U.; Gürtler, R.; Husøy, T.; et al. Safety Assessment of Titanium Dioxide (E171) as a Food Additive. EFSA J. 2021, 19, 6585. [Google Scholar] [CrossRef]
- Amenta, V.; Aschberger, K.; Arena, M.; Bouwmeester, H.; Botelho Moniz, F.; Brandhoff, P.; Gottardo, S.; Marvin, H.J.P.; Mech, A.; Quiros Pesudo, L.; et al. Regulatory aspects of nanotechnology in the agri/feed/food sector in EU and non-EU countries. Regul. Toxicol. Pharmacol. 2015, 73, 463–476. [Google Scholar] [CrossRef]
- Rauscher, H.; Rasmussen, K.; Sokull-Klüttgen, B. Regulatory Aspects of Nanomaterials in the EU. Chem. Ing. Tech. 2017, 89, 224–231. [Google Scholar] [CrossRef]
- Vidmar, J.; Hässmann, L.; Loeschner, K. Single-Particle ICP–MS as a Screening Technique for the Presence of Potential Inorganic Nanoparticles in Food. J. Agric. Food Chem. 2021, 69, 9979–9990. [Google Scholar] [CrossRef] [PubMed]
- Mattarozzi, M.; Suman, M.; Cascio, C.; Calestani, D.; Weigel, S.; Undas, A.; Peters, R. Analytical Approaches for the Characterization and Quantification of Nanoparticles in Food and Beverages. Anal. Bioanal. Chem. 2017, 409, 63–80. [Google Scholar] [CrossRef] [PubMed]
- Correia, M.; Verleysen, E.; Loeschner, K. Analytical Challenges and Practical Solutions for Enforcing Labeling of Nanoingredients in Food Products in the European Union. In Nanomaterials for Food Applications; Elsevier: Amsterdam, The Netherlands, 2019; pp. 273–311. [Google Scholar] [CrossRef]
- Montaño, M.D.; Olesik, J.W.; Barber, A.G.; Challis, K.; Ranville, J.F. Single Particle ICP-MS: Advances toward Routine Analysis of Nanomaterials. Anal. Bioanal. Chem. 2016, 408, 5053–5074. [Google Scholar] [CrossRef] [PubMed]
- Meermann, B.; Nischwitz, V. ICP-MS for the Analysis at the Nanoscale—A Tutorial Review. J. Anal. At. Spectrom. 2018, 33, 1432–1468. [Google Scholar] [CrossRef]
- Mozhayeva, D.; Engelhard, C. A Critical Review of Single Particle Inductively Coupled Plasma Mass Spectrometry—A Step towards an Ideal Method for Nanomaterial Characterization. J. Anal. At. Spectrom. 2020, 35, 1740–1783. [Google Scholar] [CrossRef]
- Resano, M.; Aramendía, M.; García-Ruiz, E.; Bazo, A.; Bolea-Fernandez, E.; Vanhaecke, F. Living in a Transient World: ICP-MS Reinvented via Time-Resolved Analysis for Monitoring Single Events. Chem. Sci. 2022, 13, 4436–4473. [Google Scholar] [CrossRef]
- Laborda, F.; Abad-Álvaro, I.; Jiménez, M.S.; Bolea, E. Catching Particles by Atomic Spectrometry: Benefits and Limitations of Single Particle—Inductively Coupled Plasma Mass Spectrometry. Spectrochim. Acta Part B At. Spectrosc. 2023, 199, 106570. [Google Scholar] [CrossRef]
- Laycock, A.; Clark, N.J.; Clough, R.; Smith, R.; Handy, R.D. Determination of Metallic Nanoparticles in Biological Samples by Single Particle ICP-MS: A Systematic Review from Sample Collection to Analysis. Environ. Sci. Nano 2022, 9, 420–453. [Google Scholar] [CrossRef]
- Waegeneers, N.; De Vos, S.; Verleysen, E.; Ruttens, A.; Mast, J. Estimation of the Uncertainties Related to the Measurement of the Size and Quantities of Individual Silver Nanoparticles in Confectionery. Materials 2019, 12, 2677. [Google Scholar] [CrossRef]
- Geiss, O.; Bianchi, I.; Senaldi, C.; Bucher, G.; Verleysen, E.; Waegeneers, N.; Brassinne, F.; Mast, J.; Loeschner, K.; Vidmar, J.; et al. Particle Size Analysis of Pristine Food-Grade Titanium Dioxide and E 171 in Confectionery Products: Interlaboratory Testing of a Single-Particle Inductively Coupled Plasma Mass Spectrometry Screening Method and Confirmation with Transmission Electron Micr. Food Control 2021, 120, 107550. [Google Scholar] [CrossRef]
- Helsper, J.P.F.G.; Peters, R.J.B.; van Bemmel, M.E.M.; Rivera, Z.E.H.; Wagner, S.; von der Kammer, F.; Tromp, P.C.; Hofmann, T.; Weigel, S. Physicochemical Characterization of Titanium Dioxide Pigments Using Various Techniques for Size Determination and Asymmetric Flow Field Flow Fractionation Hyphenated with Inductively Coupled Plasma Mass Spectrometry. Anal. Bioanal. Chem. 2016, 408, 6679–6691. [Google Scholar] [CrossRef]
- Verleysen, E.; Waegeneers, N.; Brassinne, F.; De Vos, S.; Jimenez, I.O.; Mathioudaki, S.; Mast, J. Physicochemical Characterization of the Pristine E171 Food Additive by Standardized and Validated Methods. Nanomaterials 2020, 10, 592. [Google Scholar] [CrossRef] [PubMed]
- Laborda, F.; Gimenez-Ingalaturre, A.C.; Bolea, E.; Castillo, J.R. Single Particle Inductively Coupled Plasma Mass Spectrometry as Screening Tool for Detection of Particles. Spectrochim. Acta Part B At. Spectrosc. 2019, 159, 105654. [Google Scholar] [CrossRef]
- Witzler, M.; Küllmer, F.; Hirtz, A.; Günther, K. Validation of Gold and Silver Nanoparticle Analysis in Fruit Juices by Single-Particle ICP-MS without Sample Pretreatment. J. Agric. Food Chem. 2016, 64, 4165–4170. [Google Scholar] [CrossRef] [PubMed]
- Kantorová, V.; Krausová, G.; Hyršlová, I.; Loula, M.; Mestek, O.; Kaňa, A. Determination of Selenium Nanoparticles in Fermented Dairy Products. Spectrochim. Acta Part B At. Spectrosc. 2023, 199, 106592. [Google Scholar] [CrossRef]
- Li, B.; Chua, S.L.; Yu, D.; Chan, S.H.; Li, A. Detection, Identification and Size Distribution of Silver Nanoparticles (AgNPs) in Milk and Migration Study for Breast Milk Storage Bags. Molecules 2022, 27, 2539. [Google Scholar] [CrossRef]
- Noireaux, J.; López-Sanz, S.; Vidmar, J.; Correia, M.; Devoille, L.; Fisicaro, P.; Loeschner, K. Titanium Dioxide Nanoparticles in Food: Comparison of Detection by Triple-Quadrupole and High-Resolution ICP-MS in Single-Particle Mode. J. Nanoparticle Res. 2021, 23, 102. [Google Scholar] [CrossRef]
- de la Calle, I.; Menta, M.; Klein, M.; Séby, F. Study of the Presence of Micro- and Nanoparticles in Drinks and Foods by Multiple Analytical Techniques. Food Chem. 2018, 266, 133–145. [Google Scholar] [CrossRef]
- Candás-Zapico, S.; Kutscher, D.J.; Montes-Bayón, M.; Bettmer, J. Single Particle Analysis of TiO2 in Candy Products Using Triple Quadrupole ICP-MS. Talanta 2018, 180, 309–315. [Google Scholar] [CrossRef]
- Peters, R.J.B.; van Bemmel, G.; Herrera-Rivera, Z.; Helsper, H.P.F.G.; Marvin, H.J.P.; Weigel, S.; Tromp, P.C.; Oomen, A.G.; Rietveld, A.G.; Bouwmeester, H. Characterization of Titanium Dioxide Nanoparticles in Food Products: Analytical Methods To Define Nanoparticles. J. Agric. Food Chem. 2014, 62, 6285–6293. [Google Scholar] [CrossRef]
- Givelet, L.; Truffier-Boutry, D.; Noël, L.; Damlencourt, J.-F.; Jitaru, P.; Guérin, T. Optimisation and Application of an Analytical Approach for the Characterisation of TiO2 Nanoparticles in Food Additives and Pharmaceuticals by Single Particle Inductively Coupled Plasma-Mass Spectrometry. Talanta 2021, 224, 121873. [Google Scholar] [CrossRef]
- Bucher, G.; Auger, F. Combination of 47 Ti and 48 Ti for the Determination of Highly Polydisperse TiO2 Particle Size Distributions by SpICP-MS. J. Anal. At. Spectrom. 2019, 34, 1380–1386. [Google Scholar] [CrossRef]
- de la Calle, I.; Menta, M.; Klein, M.; Maxit, B.; Séby, F. Towards Routine Analysis of TiO2 (Nano-)Particle Size in Consumer Products: Evaluation of Potential Techniques. Spectrochim. Acta Part B At. Spectrosc. 2018, 147, 28–42. [Google Scholar] [CrossRef]
- Verleysen, E.; Van Doren, E.; Waegeneers, N.; De Temmerman, P.-J.; Abi Daoud Francisco, M.; Mast, J. TEM and SP-ICP-MS Analysis of the Release of Silver Nanoparticles from Decoration of Pastry. J. Agric. Food Chem. 2015, 63, 3570–3578. [Google Scholar] [CrossRef] [PubMed]
- Loeschner, K.; Correia, M.; López Chaves, C.; Rokkjær, I.; Sloth, J.J. Detection and Characterisation of Aluminium-Containing Nanoparticles in Chinese Noodles by Single Particle ICP-MS. Food Addit. Contam. Part A 2018, 35, 86–93. [Google Scholar] [CrossRef] [PubMed]
- López-Mayán, J.J.; Álvarez-Fernández, B.; Peña-Vázquez, E.; Barciela-Alonso, M.C.; Moreda-Piñeiro, A.; Bermejo-Barrera, P. Ultrasonication Followed by Enzymatic Hydrolysis as a Sample Pre-Treatment for the Determination of Ag Nanoparticles in Edible Seaweed by SP-ICP-MS. Talanta 2022, 247, 123556. [Google Scholar] [CrossRef]
- Jiménez-Lamana, J.; Wojcieszek, J.; Jakubiak, M.; Asztemborska, M.; Szpunar, J. Single Particle ICP-MS Characterization of Platinum Nanoparticles Uptake and Bioaccumulation by Lepidium Sativum and Sinapis Alba Plants. J. Anal. At. Spectrom. 2016, 31, 2321–2329. [Google Scholar] [CrossRef]
- Laughton, S.; Laycock, A.; Bland, G.; von der Kammer, F.; Hofmann, T.; Casman, E.A.; Lowry, G.V. Methanol-Based Extraction Protocol for Insoluble and Moderately Water-Soluble Nanoparticles in Plants to Enable Characterization by Single Particle ICP-MS. Anal. Bioanal. Chem. 2021, 413, 299–314. [Google Scholar] [CrossRef]
- Keller, A.A.; Huang, Y.; Nelson, J. Detection of Nanoparticles in Edible Plant Tissues Exposed to Nano-Copper Using Single-Particle ICP-MS. J. Nanoparticle Res. 2018, 20, 101. [Google Scholar] [CrossRef]
- Laughton, S.; Laycock, A.; von der Kammer, F.; Hofmann, T.; Casman, E.A.; Rodrigues, S.M.; Lowry, G.V. Persistence of Copper-Based Nanoparticle-Containing Foliar Sprays in Lactuca Sativa (Lettuce) Characterized by SpICP-MS. J. Nanoparticle Res. 2019, 21, 174. [Google Scholar] [CrossRef]
- Wojcieszek, J.; Jiménez-Lamana, J.; Bierla, K.; Asztemborska, M.; Ruzik, L.; Jarosz, M.; Szpunar, J. Elucidation of the Fate of Zinc in Model Plants Using Single Particle ICP-MS and ESI Tandem MS. J. Anal. At. Spectrom. 2019, 34, 683–693. [Google Scholar] [CrossRef]
- Wei, W.-J.; Li, L.; Gao, Y.-P.; Wang, Q.; Zhou, Y.-Y.; Liu, X.; Yang, Y. Enzyme Digestion Combined with SP-ICP-MS Analysis to Characterize the Bioaccumulation of Gold Nanoparticles by Mustard and Lettuce Plants. Sci. Total Environ. 2021, 777, 146038. [Google Scholar] [CrossRef] [PubMed]
- Wojcieszek, J.; Jiménez-Lamana, J.; Bierła, K.; Ruzik, L.; Asztemborska, M.; Jarosz, M.; Szpunar, J. Uptake, Translocation, Size Characterization and Localization of Cerium Oxide Nanoparticles in Radish (Raphanus sativus L.). Sci. Total Environ. 2019, 683, 284–292. [Google Scholar] [CrossRef] [PubMed]
- Wojcieszek, J.; Jiménez-Lamana, J.; Ruzik, L.; Asztemborska, M.; Jarosz, M.; Szpunar, J. Characterization of TiO2 NPs in Radish (Raphanus sativus L.) by Single-Particle ICP-QQQ-MS. Front. Environ. Sci. 2020, 8, 100. [Google Scholar] [CrossRef]
- Xiao, B.; Zhang, Y.; Wang, X.; Chen, M.; Sun, B.; Zhang, T.; Zhu, L. Occurrence and Trophic Transfer of Nanoparticulate Ag and Ti in the Natural Aquatic Food Web of Taihu Lake, China. Environ. Sci. Nano 2019, 6, 3431–3441. [Google Scholar] [CrossRef]
- Taboada-López, M.V.; Alonso-Seijo, N.; Herbello-Hermelo, P.; Bermejo-Barrera, P.; Moreda-Piñeiro, A. Determination and Characterization of Silver Nanoparticles in Bivalve Molluscs by Ultrasound Assisted Enzymatic Hydrolysis and Sp-ICP-MS. Microchem. J. 2019, 148, 652–660. [Google Scholar] [CrossRef]
- Sun, Y.; Yang, Y.; Tou, F.-Y.; Niu, Z.-S.; Guo, X.-P.; Liu, C.; Yan, J.; Wu, J.-Y.; Xu, M.; Hou, L.-J.; et al. Extraction and Quantification of Metal-Containing Nanoparticles in Marine Shellfish Based on Single Particle Inductively Coupled Plasma-Mass Spectrometry Technique. J. Hazard. Mater. 2022, 424, 127383. [Google Scholar] [CrossRef]
- Xu, L.; Wang, Z.; Zhao, J.; Lin, M.; Xing, B. Accumulation of Metal-Based Nanoparticles in Marine Bivalve Mollusks from Offshore Aquaculture as Detected by Single Particle ICP-MS. Environ. Pollut. 2020, 260, 114043. [Google Scholar] [CrossRef]
- Kuehr, S.; Meisterjahn, B.; Schröder, N.; Knopf, B.; Völker, D.; Schwirn, K.; Schlechtriem, C. Testing the Bioaccumulation of Manufactured Nanomaterials in the Freshwater Bivalve Corbicula Fluminea Using a New Test Method. Environ. Sci. Nano 2020, 7, 535–553. [Google Scholar] [CrossRef]
- Zhou, Q.; Liu, L.; Liu, N.; He, B.; Hu, L.; Wang, L. Determination and Characterization of Metal Nanoparticles in Clams and Oysters. Ecotoxicol. Environ. Saf. 2020, 198, 110670. [Google Scholar] [CrossRef]
- Gallocchio, F.; Biancotto, G.; Moressa, A.; Pascoli, F.; Pretto, T.; Toffan, A.; Arcangeli, G.; Montesi, F.; Peters, R.; Ricci, A. Bioaccumulation and In Vivo Formation of Titanium Dioxide Nanoparticles in Edible Mussels. Food Chem. 2020, 323, 126841. [Google Scholar] [CrossRef] [PubMed]
- Taboada-López, M.V.; Iglesias-López, S.; Herbello-Hermelo, P.; Bermejo-Barrera, P.; Moreda-Piñeiro, A. Ultrasound Assisted Enzymatic Hydrolysis for Isolating Titanium Dioxide Nanoparticles from Bivalve Mollusk before Sp-ICP-MS. Anal. Chim. Acta 2018, 1018, 16–25. [Google Scholar] [CrossRef] [PubMed]
- Grasso, A.; Ferrante, M.; Arena, G.; Salemi, R.; Zuccarello, P.; Fiore, M.; Copat, C. Chemical Characterization and Quantification of Silver Nanoparticles (Ag-NPs) and Dissolved Ag in Seafood by Single Particle ICP-MS: Assessment of Dietary Exposure. Int. J. Environ. Res. Public Health 2021, 18, 4076. [Google Scholar] [CrossRef] [PubMed]
- Grasso, A.; Ferrante, M.; Zuccarello, P.; Filippini, T.; Arena, G.; Fiore, M.; Cristaldi, A.; Conti, G.O.; Copat, C. Chemical Characterization and Quantification of Titanium Dioxide Nanoparticles (TiO2-NPs) in Seafood by Single-Particle ICP-MS: Assessment of Dietary Exposure. Int. J. Environ. Res. Public Health 2020, 17, 9547. [Google Scholar] [CrossRef]
- Grasso, A.; Ferrante, M.; Moreda-Piñeiro, A.; Arena, G.; Magarini, R.; Oliveri Conti, G.; Cristaldi, A.; Copat, C. Dietary Exposure of Zinc Oxide Nanoparticles (ZnO-NPs) from Canned Seafood by Single Particle ICP-MS: Balancing of Risks and Benefits for Human Health. Ecotoxicol. Environ. Saf. 2022, 231, 113217. [Google Scholar] [CrossRef]
- Loeschner, K.; Navratilova, J.; Købler, C.; Mølhave, K.; Wagner, S.; von der Kammer, F.; Larsen, E.H. Detection and Characterization of Silver Nanoparticles in Chicken Meat by Asymmetric Flow Field Flow Fractionation with Detection by Conventional or Single Particle ICP-MS. Anal. Bioanal. Chem. 2013, 405, 8185–8195. [Google Scholar] [CrossRef] [PubMed]
- Peters, R.J.B.; Rivera, Z.H.; van Bemmel, G.; Marvin, H.J.P.; Weigel, S.; Bouwmeester, H. Development and Validation of Single Particle ICP-MS for Sizing and Quantitative Determination of Nano-Silver in Chicken Meat. Anal. Bioanal. Chem. 2014, 406, 3875–3885. [Google Scholar] [CrossRef]
- Weigel, S.; Peters, R.; Loeschner, K.; Grombe, R.; Linsinger, T.P.J. Results of an Interlaboratory Method Performance Study for the Size Determination and Quantification of Silver Nanoparticles in Chicken Meat by Single-Particle Inductively Coupled Plasma Mass Spectrometry (Sp-ICP-MS). Anal. Bioanal. Chem. 2017, 409, 4839–4848. [Google Scholar] [CrossRef]
- Gomez-Gomez, B.; Perez-Corona, M.T.; Madrid, Y. Using Single-Particle ICP-MS for Unravelling the Effect of Type of Food on the Physicochemical Properties and Gastrointestinal Stability of ZnONPs Released from Packaging Materials. Anal. Chim. Acta 2020, 1100, 12–21. [Google Scholar] [CrossRef]
- Kollander, B.; Widemo, F.; Ågren, E.; Larsen, E.H.; Loeschner, K. Detection of Lead Nanoparticles in Game Meat by Single Particle ICP-MS Following Use of Lead-Containing Bullets. Anal. Bioanal. Chem. 2017, 409, 1877–1885. [Google Scholar] [CrossRef]
- Gray, E.P.; Coleman, J.G.; Bednar, A.J.; Kennedy, A.J.; Ranville, J.F.; Higgins, C.P. Extraction and Analysis of Silver and Gold Nanoparticles from Biological Tissues Using Single Particle Inductively Coupled Plasma Mass Spectrometry. Environ. Sci. Technol. 2013, 47, 14315–14323. [Google Scholar] [CrossRef] [PubMed]
- Gallocchio, F.; Biancotto, G.; Cibin, V.; Losasso, C.; Belluco, S.; Peters, R.; van Bemmel, G.; Cascio, C.; Weigel, S.; Tromp, P.; et al. Transfer Study of Silver Nanoparticles in Poultry Production. J. Agric. Food Chem. 2017, 65, 3767–3774. [Google Scholar] [CrossRef] [PubMed]
- Suzuki, Y.; Kondo, M.; Akiyama, H.; Ogra, Y. Presence of Nano-Sized Mercury-Containing Particles in Seafoods, and an Estimate of Dietary Exposure. Environ. Pollut. 2022, 307, 119555. [Google Scholar] [CrossRef] [PubMed]
- Taboada-López, M.V.; Herbello-Hermelo, P.; Domínguez-González, R.; Bermejo-Barrera, P.; Moreda-Piñeiro, A. Enzymatic Hydrolysis as a Sample Pre-Treatment for Titanium Dioxide Nanoparticles Assessment in Surimi (Crab Sticks) by Single Particle ICP-MS. Talanta 2019, 195, 23–32. [Google Scholar] [CrossRef] [PubMed]
- Verleysen, E.; Waegeneers, N.; De Vos, S.; Brassinne, F.; Ledecq, M.; Van Steen, F.; Andjelkovic, M.; Janssens, R.; Mathioudaki, S.; Delfosse, L.; et al. Physicochemical Characterization of Nanoparticles in Food Additives in the Context of Risk Identification. EFSA Support. Publ. 2021, 18, 6678E. [Google Scholar] [CrossRef]
- NIST. Reference Material® 8012 Gold Nanoparticles, Nominal 30 Nm Diameter; National Institute of Standards and Technology: Gaithersburg, MD, USA, 2015.
- NIST. Reference Material® 8013 Gold Nanoparticles, Nominal 60 Nm Diameter; National Institute of Standards and Technology: Gaithersburg, MD, USA, 2015.
- Colloidal Gold NPs—Nominal Diameter 30 Nm Quality Control Material LGCQC5050, LGC. 2019. Available online: https://www.Lgcstandards.Com/Medias/Sys_master/Root/H84/H04/10435846012958/LGCQC5050.Pdf (accessed on 31 May 2023).
- Montoro Bustos, A.R.; Purushotham, K.P.; Possolo, A.; Farkas, N.; Vladár, A.E.; Murphy, K.E.; Winchester, M.R. Validation of Single Particle ICP-MS for Routine Measurements of Nanoparticle Size and Number Size Distribution. Anal. Chem. 2018, 90, 14376–14386. [Google Scholar] [CrossRef] [PubMed]
- International Organization for Standardization (ISO). ISO Guide 30; International Organization for Standardization (ISO): Geneva, Switzerland, 2015. [Google Scholar]
- Pace, H.E.; Rogers, N.J.; Jarolimek, C.; Coleman, V.A.; Higgins, C.P.; Ranville, J.F. Determining Transport Efficiency for the Purpose of Counting and Sizing Nanoparticles via Single Particle Inductively Coupled Plasma Mass Spectrometry. Anal. Chem. 2011, 83, 9361–9369. [Google Scholar] [CrossRef]
- Cuello-Nuñez, S.; Abad-Álvaro, I.; Bartczak, D.; Del Castillo Busto, M.E.; Ramsay, D.A.; Pellegrino, F.; Goenaga-Infante, H. The Accurate Determination of Number Concentration of Inorganic Nanoparticles Using SpICP-MS with the Dynamic Mass Flow Approach. J. Anal. At. Spectrom. 2020, 35, 1832–1839. [Google Scholar] [CrossRef]
- Peters, R.; Herrera-Rivera, Z.; Undas, A.; Van Der Lee, M.; Marvin, H.; Bouwmeester, H.; Weigel, S. Single Particle ICP-MS Combined with a Data Evaluation Tool as a Routine Technique for the Analysis of Nanoparticles in Complex Matrices. J. Anal. At. Spectrom. 2015, 30, 1274–1285. [Google Scholar] [CrossRef]
- Beauchamp, C.R.; Camara, J.E.; Carney, J.; Choquette, S.J.; Cole, K.D.; DeRose, P.C.; Duewer, D.L.; Epstein, M.S.; Kline, M.C.; Lippa, K.A.; et al. Metrological Tools for the Reference Materials and Reference Instruments of the NIST Material Measurement Laboratory; NIST: Gaithersburg, MD, USA, 2021.
- CFR—Code of Federal Regulations Title 21. 172.480 Silicon Dioxide. Available online: https://www.ecfr.gov/current/title-21/chapter-I/subchapter-B/part-172/subpart-E/section-172.480 (accessed on 5 December 2022).
- Younes, M.; Aggett, P.; Aguilar, F.; Crebelli, R.; Dusemund, B.; Filipič, M.; Frutos, M.J.; Galtier, P.; Gott, D.; Gundert-Remy, U.; et al. Re-Evaluation of Silicon Dioxide (E 551) as a Food Additive. EFSA J. 2018, 16, e05088. [Google Scholar] [CrossRef]
- Lozano, O.; Silva-Platas, C.; Chapoy-Villanueva, H.; Pérez, B.E.; Lees, J.G.; Ramachandra, C.J.A.; Contreras-Torres, F.F.; Lázaro-Alfaro, A.; Luna-Figueroa, E.; Bernal-Ramírez, J.; et al. Amorphous SiO2 Nanoparticles Promote Cardiac Dysfunction via the Opening of the Mitochondrial Permeability Transition Pore in Rat Heart and Human Cardiomyocytes. Part Fibre Toxicol. 2020, 17, 15. [Google Scholar] [CrossRef] [PubMed]
- Khan, S.A.; Johnson, M.E.; Kalan, M.S.; Bustos, A.R.M.; Rabb, S.A.; Strenge, I.H.; Murphy, K.E.; Timothy, R. Croley Characterization of Nanoparticles in Silicon Dioxide Food Additives. 2023; in preparation. [Google Scholar]
- Geiss, O.; Bianchi, I.; Bucher, G.; Verleysen, E.; Brassinne, F.; Mast, J.; Loeschner, K.; Givelet, L.; Cubadda, F.; Ferraris, F.; et al. Determination of the Transport Efficiency in SpICP-MS Analysis Using Conventional Sample Introduction Systems: An Interlaboratory Comparison Study. Nanomaterials 2022, 12, 725. [Google Scholar] [CrossRef] [PubMed]


| Food Matrix Category | Food Matrix (Only Eatable Parts) | Analyzed Element | Assumed NP Composition | Reported NP Shape | NP Origin | Origin of Food Sample | Homogenization Approach | Number/Amount of Samples Analyzed | Matrix Degradation Approach | Further Sample Pre-Treatment | Ref. |
|---|---|---|---|---|---|---|---|---|---|---|---|
| Pure food additives | - | Ag | Ag | Near spherical or irregular shape, aspect ratios from 1.07 to 1.42 | Food additive (E174), powders (≤1 mm), flakes and petals (1 mm to 2 cm), leaves (>2 cm), 10 products in total | Online store | - | 0.015 g | - | Ethanol wetting and dispersion in 0.05% (m/v) BSA by probe sonication | [3] |
| Pure food additives | - | Ag | Ag | Near spherical, aspect ratios from 1.07 to 1.28 | Food additive (E174), 2-mm silver flakes and 8-cm silver leaves | Local store/online store | - | 0.0154 g | - | Ethanol wetting and dispersion in 0.05% (m/v) BSA solution by probe sonication, vortex stirring, dilution with ultrapure water | [23] |
| Pure food additives | - | Ti | TiO2 | - | Food additive (E171), 5 products | Provided by industry | - | 50 mg | - | Dispersion in ultrapure water by bath sonication, filtration (1.2 μm cut-off) | [4] |
| Pure food additives | - | Ti | TiO2 | Ellipsoidal | Food additive (E171) | Not specified (from collaborator) | - | 40 mg | - | Dispersion in ultrapure water by probe sonication, dilution with ultrapure water | [24] |
| Pure food additives | - | Ti | TiO2 | Fractal aggregate structure | Food additive (E171), 7 products | Local stores/online stores | - | (15.36 ± 0.10) mg | - | Ethanol wetting and dispersion in 0.05% (m/v) BSA solution by probe sonication | [25] |
| Pure food additives | - | Ti | TiO2 | Near spherical, often agglomerated | Food additive (E171) | Online store | - | 3.5 mg | - | Dispersion in ultrapure water by probe sonication, dilution with 4% nitric acid | [26] |
| Mainly food additive | Decoration dusting powders for silver metallic finishes (silver powder) | Ag Au Al | Ag Au Mica (KAl2[AlSi3O10](OH)2) | - | Food additive (E174) (E175) (E555) | Not specified (“commercially available”) | - | 0.050 g | - | Dispersion in 0.1% (v/v) Tween 20, centrifugation, bath sonication, centrifugation to remove particles > 1 µm | [27] |
| Water-based | Apple and orange juice | Ag Au | Ag Au | Spherical | Spiked | Local store | - | 1 mL | - | Dilution with ultrapure water | [28] |
| Water-based | Coffee with milk and espresso | Ag | Ag | Unknown | Unknown | Local coffee machine | Stirring with plastic spatula | 100 mL | - | Dilution with ultrapure water | [14] |
| Water-based | Drink from vitamin (effervescent) tablets | Si | SiO2 | Unknown | Unknown | Local store | - | 1 vitamin tablet (3.8 g approx..) | Dissolution of the tablet in ultrapure water supported by vortexing | Dilution with ultrapure water | [14] |
| Water-based | Kefir (3.5% fat) | Se | Se | Spherical and ovoid | Biogenic formation (selenized bacterial strain spiked to food matrix) | - | - | - | Enzymatic digestion with proteinase XXIII | Dilution with 1% (v/v) methanol solution | [29] |
| Water-based | Milk | Ag | Ag | - | Spiked | Local store | - | 5 g | Enzymatic digestion with Proteinase K | Dilution with ultrapure water | [30] |
| Water-based | Milk | Ti | TiO2 | Almost spherical | Spiked | Local store | - | - | - | Dilution with ultrapure water | [31] |
| Water-based | Multifruit juice, white wine for cooking, hot chocolate, coffee, energy drink | Au | Au | Spherical | Spiked | Local store | Vigorous shaking | 80 mL approx. | - | - | [32] |
| Sugar-rich | Cake decoration (edible golden stars) | Al Fe Si Ti | Al2O3 FeO(OH)·H2O SiO2 TiO2 | Unknown | Unknown Unknown Food additive (E172) Food additive (E171) | Local store | - | 1 golden star (65 mg approx.) | Dissolution of matrix in ultrapure water supported by sonication in high-intensity cup horn | Dilution with ultrapure water, vortexing | [14] |
| Sugar-rich | Cake decoration (inscription on plastic film) | Ti | TiO2 | Almost spherical | Food additive (E171) | Local store | - | 1 white inscription “Chocolat” scraped of the plastic film | Dissolution of matrix in 2 g/L sodium hexametaphosphate solution supported by sonication in high-intensity cup horn | Dilution with ultrapure water | [31] |
| Sugar-rich | Chewing gum (coating) | Al Si Ti | Al2O3 SiO2 TiO2 | Unknown | Unknown Unknown Food additive (E171) | Local store | - | 1 chewing gum | Dissolution of matrix in ultrapure water | Removal of gum base, dilution with ultrapure water | [14] |
| Sugar-rich | Chewing gum (coating) | Ti | TiO2 | - | Food additive (E171) | Local store | - | 1 chewing gum | Dissolution of matrix in ultrapure water supported by bath sonication | Dilution with ultrapure water, bath sonication | [33] |
| Sugar-rich | Chewing gum (coating), 2 products | Ti | TiO2 | - | Food additive (E171) | Local store | Pooling of 3 chewing gums | 3 chewing gums (from 4.3 g to 6.1 g) | Dissolution of matrix in ultrapure water supported by manual shaking | Removal of gum part, bath sonication, filtration (0.45 µm cut-off, dilution with ultrapure water | [32] |
| Sugar-rich | Chewing gum (coating) | Ti | TiO2 | - | Food additive (E171) | Local store | Not detailed (representative subsample was prepared) | 0.5 g | Heating with hydrogen peroxide just below boiling point, followed by evaporation | Dilution with 0.5% (m/v) BSA solution | [34] |
| Sugar-rich | Chewing gum (coating) and chocolate candy (sugar coating) | Ti | TiO2 | Ellipsoidal | Food additive (E171) | Provided by industry (candies) or online store (chewing gum) | Pooling of six candies/three chewing gums | 6 candies or 3 chewing gums | Dissolution of matrix in ultrapure water supported by manual shaking | Removal of gum/chocolate base, bath sonication, dilution with ultrapure water | [24] |
| Sugar-rich | Chewing gum (coating) and chocolate candy (sugar coating) | Ti | TiO2 | Almost spherical | Food additive (E171) | Local store | - | 1 chewing gum or 1 chocolate candy | Dissolution of matrix in ultrapure water | Removal of gum/chocolate base, dilution with ultrapure water | [31] |
| Sugar-rich | Chewing gums, chocolate candy, coated sweets, decorations on frozen desserts and pastries, 11 products in total | Ti | TiO2 | - | Food additive (E171) | Local store | - | 0.1 g to 2 g depending on sample | Dispersion in ultrapure water by sonication (for frozen desserts and pastries only specific part of sample taken for analysis) | Dilution with 0.1% (v/v) nitric acid | [35] |
| Sugar-rich | Chewing gum (coating), “typical French wedding hard candies” (almonds covered with sugar and E171 food coloring) Chocolate candy with peanut core (coating) Coconut syrup Soft candies with jelly center (wax glazing) | Ti | TiO2 | - | Food additive (E171) | National control program | - | - | Dissolution of the matrix in ultrapure water supported by bath sonication | Centrifugation (1.2 µm cut-off), dilution with ultrapure water | [36] |
| Sugar-rich | Chocolate candy (sugar coating) | Ti | TiO2 | Almost spherical | Food additive (E171) | Local store | Pooling of 8 candies | 8 candies (around 7 g) | Dissolution of matrix in ultrapure water | Removal of chocolate core, sonication, filtration (0.45 μm cut-off) | [37] |
| Sugar-rich | Coffee creamer (powdered) | Al Si Ti | Al2O3 SiO2 TiO2 | Unknown | Unknown Food additive (E551) Unknown | Online store | - | 1 single serve packet | Dissolution of the matrix in hot coffee | Dilution with ultrapure water | [14] |
| Sugar-rich | Silvery coated candy beads | Ag Al | Ag Al | - | Food additive (E174) (E173) | Not specified (“commercially available”) | Pooling of 5 beads | 5 beads (250 mg to 300 mg) | Dissolution of matrix in ultrapure water | Centrifugation to remove particles > 1 µm, dilution with ultrapure water, bath sonication | [27] |
| Sugar-rich | Silver coated chocolates (“sugar beans”) and silver pearls containing mainly sugar and wheat flour/corn meal | Ag | Ag | Near spherical, aspect ratios from 1.07 to 1.28 | Food additive (E174) | Local store/online store | Pooling of three silver-coated chocolates/twelve silver pearls | 3 items of silver-coated chocolates (~2 g) or 12 silver pearls (~2 g) | Dissolution in 0.05% (m/v) BSA solution supported by probe sonication; chocolate cores of silver-coated chocolates removed before probe sonication | Vortex stirring, dilution with ultrapure water | [23] |
| Sugar-rich | Silver pearls | Ag | Ag | - | Food additive (E174) | Local store | - | 1 silver pearl | Dissolution of matrix in ultrapure water (only coating or whole pearl containing sugar core) | With and without filtration (0.45 µm cut-off), dilution with ultrapure water | [32] |
| Sugar-rich | Silver pearls (decoration of pastry) | Ag | Ag | Most NPs round, suggesting spherical 3D structure; presence of NPs with rectangular or triangular shape | Food additive (E174) | Local store | - | 1 sugar pill (+/−180 mg) | Dissolution of matrix in ultrapure water | Dilution with ultrapure water | [38] |
| Sugar-rich | Silver pearls and silver-coated chocolates (silver beans), 10 products | Ag | Ag | Near spherical or irregular shape, aspect ratios from 1.07 to 1.42 | Food additive (E174) | Local store | Pooling of 12 silver pearls/2–4 silver-coated chocolates | 12 silver pearls or 2–4 silver-coated chocolates (about 2 g) | Dispersion in 0.05% (m/v) BSA solution by probe sonication | Remaining cores rinsed with 0.05% (m/v) BSA solution and removed (only for silver-coated chocolates), vortexing, dilution with ultrapure water | [3] |
| Sugar-rich | Sugar pearls | Ti | TiO2 | - | Food additive (E171) | Provided by industry | Pooling of several pearls | 1 g of pearls | Dissolution of matrix in ultrapure water supported by bath sonication | Filtration (1.2 µm cut-off) | [4] |
| Starch-/dietary fiber-rich | Chinese noodles (n = 21) and NIST SRM 1567a Wheat Flour | Al | Al2O3 or Al2Si2O5(OH)4 (kaolin) | Unknown | Unknown (different possibilities discussed) | National control program | Crushed in bag with rubber mallet followed by grounding in Retch centrifugal mill | 50 g to 100 g | Enzymatic digestion with a-amylase | Dilution with ultrapure water | [39] |
| Starch-/dietary fiber-rich | Chinese noodles | Al Si | Al2O3 SiO2 | Unknown | Unknown | National control program | Crushed in bag with rubber mallet followed by grounding in Retch centrifugal mill | 30 mg | Enzymatic digestion with a-amylase | Hydrogen peroxide treatment supported by sonication (bath) | [14] |
| Starch-/dietary fiber-rich | Edible seaweed: Dulse and 5 sea lettuce | Ag | Ag | Spherical | Exposure study | Marine Research Station | Manual homogenization of seaweed samples; probe sonication of subsample with 2 mM/2 mM citric acid/trisodium citrate buffer (pH 4.5) | 0.05 g | Enzymatic digestion with Macerozyme R-10 | Filtration (cut-off 5.0 μm), dilution with 1.0% (v/v) glycerol | [40] |
| Starch-/dietary fiber-rich | Garden cress (shoots) and white mustard (leaves) | Pt | Pt | - | Exposure study | Grown from seeds | Manual grounding of dried plants using an agate mortar and pestle | 0.025 g of dried and ground sample | Enzymatic digestion with Macerozyme R-10 after homogenization in citrate buffer using probe sonication | Filtration (0.45 μm cut-off), dilution with ultrapure water | [41] |
| Starch-/dietary fiber-rich | Kale, lettuce, and corn (leaves) | Au Cu Zn | Au CuO ZnO | Spherical - - | Exposure study and spiked Spiked Spiked | Local store (kale leaves) or grown from seeds (lettuce and corn) | Mechanical breakdown in homogenizer | 1 g of leave material (fresh weight) | Two approaches: Enzymatic digestion with Macerozyme R-10 or methanol extraction after breakdown of leaf tissue with probe sonication; final method: methanol extraction | Enzymatic digestion: dilution with 0.5% (v/v) FL70, sonication, filtration (cut-off 5 µm); methanol extraction: dilution with 1% (v/v) Tween 80, sonication, filtration (cut-off 1 µm), dilution with deionized water | [42] |
| Starch-/dietary fiber-rich | Kale, lettuce, and collard green (leaves) | Cu | CuO | Primary NPs nearly spherical, while aggregates appear as rods and flakes | Exposure study | Local market | - | Circular pieces of leaf tissue (diameter = 6.35 mm) | Enzymatic digestion with Macerozyme R-10 | Centrifugation, dilution with ultrapure water | [43] |
| Starch-/dietary fiber-rich | Lettuce (leaves) | Cu | CuO, Cu(OH)2 | CuO: roughly spherical, Cu(OH)2: nanorods, commercial product Cu(OH)2: acicular | Exposure study | Grown from seeds | 3 randomly selected plants homogenized in buffer at ratio of 1 g plant (fresh weight) to 20–200 mL buffer solution for a total homogenate volume 3.5 mL and 12 mL | 0.5 mL of homogenate | Methanol extraction after breakdown of leaf tissue with indirect sonication (Vial Tweeter) | Dilution with 1% (v/v) Tween 80, sonication, filtration (cut-off 5 µm), dilution with ultrapure water | [44] |
| Starch-/dietary fiber-rich | Lettuce (leaves) | Zn | ZnO (only dissolved Zn taken up by plants) | - | Exposure study | Local store | Plants were lyophilized and the plant material ground in a mortar. Homogenization in citrate buffer using probe sonication | 0.025 g of grounded sample | Enzymatic digestion with Macerozyme R-10 | Filtration (0.45 µm cut-off) | [45] |
| Starch-/dietary fiber-rich | Mustard and lettuce plants (leaves) | Au | Au | Electron microscopy images presented, but shape not described | Exposure study | Agricultural university | Freeze-drying followed by grounding using a tissue homogenizer | (0.0250 ± 0.0003) g dried and ground plant tissue samples | Enzymatic digestion with Macerozyme R-10 | Filtration (0.45 μm cut-off), dilution with ultrapure water | [46] |
| Starch-/dietary fiber-rich | Radish (roots) | Ce | CeO2 | - | Exposure study | Grown from seeds | Freeze-drying and grinding with mortar | 0.025 g | Enzymatic digestion with Macerozyme R-10 after homogenization by probe sonication | Settling for 15 min and filtration (cut-off 0.45 µm) | [47] |
| Starch-/dietary fiber-rich | Radish (roots) | Ti | TiO2 | - | Exposure study | Grown from seeds | Freeze-drying and grinding with mortar | 0.020 g | Enzymatic digestion with Macerozyme R-10 after homogenization with tissue grinder set | Settling for 60 min | [48] |
| Starch-/dietary fiber-rich | Wheat flour | Al Si | Al2O3 SiO2 | Unknown | Unknown | Local store | - | 30 mg | Enzymatic digestion with a-amylase | Hydrogen peroxide treatment supported by sonication (bath) | [14] |
| Fat-rich/emulsion | Salad dressing | Ti | TiO2 | Unknown | Food additive (E171) | Local store | - | 0.100 g | Dispersion in 0.1% (m/m) SDS solution by high intensity cup horn | Dilution with 0.1% (m/m) SDS, vortexing, dilution with ultrapure water | [14] |
| Fat-rich/emulsion | Sour cream (15% fat) | Se | Se | Spherical and ovoid | Biogenic formation (selenized bacterial strain spiked to food matrix) | - | - | - | Enzymatic digestion with proteinase XXIII | Dilution with 1% (v/v) methanol solution | [29] |
| Protein-rich | Aquatic organisms (invertebrates and fish): Taihu Lake shrimp, freshwater mussel, pearl mussel, Asian clam, snail, spiral shell; fish: stone moroko, yellow catfish, whitebait, crucian, carp, loach | Ag Ti | Ag Ti | - | From aquatic environment | Sampling campaign | Yes, but not described, followed by freeze drying | 0.1 g of freeze dried sample | Alkaline digestion with TMAH | Settling (overnight), dilution with ultrapure water | [49] |
| Protein-rich | Bivalve mollusks: mussels, edible cockles, oysters, razor clams, variegated scallops, Atlantic surf clams, Japanese carpet-shell clams, grooved carpet shell | Ag | Ag | - | From aquatic environment | Local store | Mechanical blending (after byssus and/or shell were removed), 1 kg sample | 1 g of homogenized sample | Enzymatic digestion with pancreatin and lipase, with and without simultaneous probe sonication | Centrifugation, dilution with 1% (v/v) glycerol solution, bath sonication | [50] |
| Protein-rich | Bivalve mollusks: various mussels | Ag Au Ti | Ag Au TiO2 | Electron microscopy images presented, but shape not described | Spiked Spiked From aquatic environment | Aquaculture farm | Ground using tissue grinder and sonicated (before spiking), 60 mussels (35–45 g each); final method: freeze drying of ground samples | 0.2 g to 0.5 g of wet sample, final method: 0.2 g of dry sample | Several approaches: Alkaline digestion with TMAH (2 protocols) or enzymatic digestion (5 protocols), final method: TMAH | Final method: centrifugation, dilution with ultrapure water | [51] |
| Protein-rich | Bivalve mollusks: oysters, mussels, scallops, clams, and ark shells | Ag Cu Ti Zn Au | Ag Cu (CuO for spiked) Ti (TiO2 for spiked) Zn (ZnO for spiked) Au | - | From aquatic environment Spiked | Offshore aquaculture farm | - | 1.0 g of wet sample | Enzymatic digestion with pancreatin and lipase after probe sonication | Centrifugation, dilution with ultrapure water | [52] |
| Protein-rich | Bivalve mollusks: Asian clam | Ag Ti | Ag TiO2 | Electron microscopy images presented, but shape not described | Exposure study and spiked | Sampling campaign | - | 3 animals (whole soft body and specific tissues) | Enzymatic digestion with Proteinase K | Filtration (0.45 µm cut-off) | [53] |
| Protein-rich | Bivalve mollusks: Mussel NIST SRM 2976 | Al Fe Si Ti | Al2O3 Fe2O3 SiO2 TiO2 | Unknown | Unknown | NIST | Provided as a freeze-dried tissue powder | 30 mg of freeze dried sample | Enzymatic digestion with Proteinase K | Dilution with ultrapure water | [14] |
| Protein-rich | Bivalve mollusks: clams and oysters | Au | Au | Electron microscopy images presented, but shape not described | Spiked | Sampling campaign | Not detailed (cut into pieces) | 0.1 g of wet sample | Two approaches: Alkaline digestion TMAH supported by bath sonication in the beginning and enzymatic digestion with Protease K (excluded based on visual inspection of the samples) | Filtration (0.45 µm cut-off), dilution with 0.1% (v/v) Triton X-100 to TMAH concentrations of at least 1% (v/v) | [54] |
| Protein-rich | Bivalve mollusks: clams and oysters | Ce, La, Nd, Pr, Y (clams), Gd (oysters) | Ce, La, Nd, Pr, Y, Gd | - | From aquatic environment | Sampling campaign | Not detailed (cut into pieces) | 0.1 g of wet sample | Two approaches: Alkaline digestion with TMAH supported by bath sonication in the beginning and enzymatic digestion with Protease K (excluded based on visual inspection of the samples) | Filtration (0.45 µm cut-off), dilution with 0.1% (v/v) Triton X-100 to TMAH concentrations of at least 1% (v/v) | [54] |
| Protein-rich | Bivalve mollusks: Mediterranean mussel | Ti | TiO2 | Electron microscopy images presented, but shape not described | Exposure study | Mussel farm | Yes, but not described (25 mussels per exposure group without shells, 5 mussels per group with digestive glands and tissue prepared separately) | 0.200 g subsample | Enzymatic digestion with Proteinase K | Dilution with ultrapure water | [55] |
| Protein-rich | Bivalve mollusks: mussels, edible cockles, oysters, razor clams, variegated scallops, Atlantic surf clams, Japanese carpet-shell clams, grooved carpet shell | Ti | TiO2 | - | From aquatic environment | Local store | Mechanical blending (after byssus and/or shell were removed), 1 kg sample | 1 g of homogenized sample | Enzymatic digestion with pancreatin and lipase, with and without simultaneous probe sonication | Centrifugation, dilution with 1% (v/v) glycerol solution, bath sonication | [56] |
| Protein-rich | Canned seafood (fish and bivalve mollusks): tuna, mackerel, anchovy, clam | Ag | Ag | - | From aquatic environment | Local store | Yes, but not described | 3 batches for each brand of seafood, 0.25 g taken from each | Alkaline digestion with TMAH, bath sonication in the beginning of the digestion | Dilution with ultrapure water to 1% (v/v) TMAH concentration and 0.1% (v/v) Triton X-100, bath sonication | [57] |
| Protein-rich | Canned seafood (fish and bivalve mollusks): tuna, mackerel, anchovy, clam | Ti | TiO2 | - | From aquatic environment | Local store | - | 3 batches (cans) for each brand of seafood, 0.5 g of sample taken | Alkaline digestion using TMAH, bath sonication in the beginning of the digestion | Dilution with ultrapure water to 1% (v/v) TMAH concentration and 0.1% (v/v) Triton X-100, bath sonication | [58] |
| Protein-rich | Canned seafood (fish and bivalve mollusks): tuna, mackerel, anchovy, clam | Zn | ZnO | - | Unknown (different possibilities discussed) | Local store | Yes, but not described | 0.25 g of sample | Alkaline digestion with TMAH, bath sonication in the beginning of the digestion | Dilution with ultrapure water to 1% (v/v) TMAH concentration and 0.1% (v/v) Triton X-100, bath sonication | [59] |
| Protein-rich | Chicken meat (lean, chicken breast) | Ag | Ag | - | Spiked | Local store | Paste by cryo-milling, vortexing after spiking | 0.25 g | Enzymatic digestion with Proteinase K | Dilution with ultrapure water | [60] |
| Protein-rich | Chicken meat (lean, chicken breast) | Ag | Ag | Spherical | Spiked | Local store | 0.2g subsample of meat cut into small pieces before spiking | 0.2 g subsample | Enzymatic digestion with Proteinase K, tip sonication prior to addition of enzyme | Dilution with ultrapure water | [61] |
| Protein-rich | Chicken meat (lean, chicken breast) | Ag | Ag | Close-to-spherical | Spiked | Local store | Not detailed (described elsewhere) | Not detailed (described elsewhere) | Enzymatic digestion with protease K | Not detailed (described elsewhere) | [62] |
| Protein-rich | Chicken breast | Zn | ZnO | Polygonal shapes with curved ends | Migration study (ZnO NPs in polymer films) | Local market | - | 1 g of chicken breast (cut into small pieces) | Aqueous extraction with Tris-HCl, supported by probe sonication | Dilution with ultrapure water | [63] |
| Protein-rich | Game meat (roe, deer, and wild boar) | Pb | Pb | - | Bullet fragments | National authorities | Production of slurry (homogenized tissue and water mixture) | 17 to 35 g | Enzymatic digestion with Proteinase K | Dilution with ultrapure water | [64] |
| Protein-rich | Ground beef (93% lean) | Ag Au | Ag Au | - | Spiked | Local market | - | 0.5 g | Alkaline digestion with TMAH, bath sonication for breaking down tissue and preventing particle aggregation prior to digestion, bath sonication in the beginning of the digestion | Diluting with ultrapure water to max. 1% (v/v) TMAH concentration | [65] |
| Protein-rich | Hen livers, muscles, kidneys, egg yolk and albumen | Ag | Ag | Spherical | Exposure study | Commercial egg-type hatchery | Yes, but not described | 0.200 g subsample | Enzymatic digestion with Proteinase K | Dilution with ultrapure water | [66] |
| Protein-rich | Seafood (fish and mollusks): Tuna and swordfish, salmon and trout, horse mackerel and sardines, bream and flounder, other raw fishes (mainly bonito and yellowtail), squid and octopus, shellfish, and shrimp and crab | Hg | HgSe | Reference to other publication using high resolution TEM: spherical shaped, composed of 5-10 nm primary NPs | Biogenic formation | Local market | GM 200 knife mill to obtain a smooth paste (for fish internal organs removed before) | 0.5 g of homogenized sample | Enzymatic digestion with pancreatin and lipase, supported by (ice-cooled) bath sonication in the beginning | Centrifugation, dilution with 1% (m/v) Tween-20, removal of dissolved Hg by repeated centrifugal ultrafiltration (50 kDa cut-off) using 1% (v/v) Tween-20 for washing and dilution | [67] |
| Protein-rich | Surimi (crab sticks, fresh and frozen products) | Ti | TiO2 | Electron microscopy images presented, but shape not described | Food additive (E171) | Local store | Mechanical blending of 100 g approx. | 1 g of homogenized sample | Enzymatic digestion with pancreatin and lipase | Centrifugation, dilution with 1% (v/v) glycerol solution, bath sonication | [68] |
| Instrument | Sample Introduction System | Nebulizer | Spray Chamber | Sample Uptake Rate (mL min−1) | Optimization Operating Conditions | Dwell Time | Analysis Time (s) | Element/Isotope Detection | Rinsing Procedure | NP Calibration Standard (Supplier) | Transport Efficiency Method | Data Analysis | Ref. |
|---|---|---|---|---|---|---|---|---|---|---|---|---|---|
| Triple quadrupole (Agilent 8800) | Peristaltic pump | Standard glass concentric nebulizer (Micromist) | Scott | 0.47 | - | 3 ms | 60 | Single element | 40 s rinse with HCl 5% (v/v) and a 160 s rinse with HNO3 4% (v/v) or a 160 s rinse with a mixture of 1% (v/v) HCl (34% to 37%), 1% (v/v) HNO3 (67% to 69%), and 0.1% (m/v) Triton X-100 | AuNPs of 30 nm (nanoComposix) | Particle frequency | - | [3] |
| Triple quadrupole (Agilent 8800) | Peristaltic pump | Standard glass concentric nebulizer (Micromist) | Scott | 0.47 | Manual tuning daily for the highest sensitivity | 3 ms | 60 | Single element | 40 s rinse with HCl 5% (v/v) and a 160 s rinse with HNO3 4% (v/v) or a 160 s rinse with a mixture of 1% (v/v) HCl (34% to 37%), 1% (v/v) HNO3 (67% to 69%), and 0.1% (m/v) Triton X-100 | Citrate-coated 30 nm AuNP (NIST RM 8012) and 30 nm AuNPs (nanoComposix) | Particle frequency | - | [23] |
| Single quadrupole (PerkinElmer NexION 300D) | SC Fast Peristaltic pump | Meinhard concentric glass nebulizer | Cyclonic | 0.17 | Manual tuning daily for the highest sensitivity | 100 µs | 60 | Single element | - | Citrate-coated 60 nm AuNP (Sigma-Aldrich) | Particle size | Vendor software | [4] |
| Single and triple quadrupoles varied among the participants | Varied among the participants | Varied among the participants | Varied among the participants | 0.17 to 0.47 | Manual tuning daily for the highest sensitivity | 100 µs to 3 ms | Various analysis times | Single element | - | Citrate-coated 60 nm AuNP (nanoComposix) | Particle size | Vendor software + SPCT | [24] |
| Single quadrupole (Thermo Scientific XSERIES 2) | Peristaltic pump + Autosampler | Burgener PEEK Mira Mist | Impact bead | - | Manual tuning daily for the highest sensitivity | 3 ms | 60 | Single element | - | Citrate-coated 60 nm AuNP (NIST RM 8013) | Particle frequency | SPCT | [25] |
| Triple quadrupole (Agilent 8800) | - | Standard glass concentric nebulizer (Micromist) | Scott | 0.47 ± 0.02 | - | 3 ms | 60 | Single element | Ultrapure water | AuNPs of 30 nm (nanoComposix) | Particle frequency | SPCT | [26] |
| Single quadrupole (PerkinElmer ELAN DRC-e) | - | Glass concentric Slurry nebulizer | Cyclonic | 1.0 | - | 5 ms | 60 | Single element | - | PEG-carboxyl 100 nm AuNP (nanoComposix) | Particle size and particle frequency | Modified SPCT | [27] |
| Single quadrupole (PerkinElmer NexION 350D) | - | - | - | 0.261 | - | 50 µs | 60 | Single element | - | Citrate-coated 60 nm AuNP (NIST RM 8013) | Particle size | In-house spreadsheet | [28] |
| Triple quadrupole (Agilent 8900) | Peristaltic pump | Standard glass concentric nebulizer (Micromist) | Scott | 0.35 | - | 100 µs | 60 | Single element | 10 s probe rinse with ultrapure water 60 s rinse with 1% (v/v) HCl, 1% (v/v) HNO3, and 1% (v/v) Triton X-100; 30 s rinse with 4% (v/v) HNO3; and 60 s rinse with ultrapure water | Citrate-coated 30 nm AuNP (NIST RM 8012) | Particle size | Vendor software | [14] |
| Single quadrupole (PerkinElmer NexION 350D) DRC mode: CH4 0.4 mL min−1 | Peristaltic pump | Meinhard concentric glass nebulizer | Cyclonic | 0.33 | - | 100 µs | 60 | Single element | - | 100 nm AgNPs (nanoComposix) 150 nm and 250 nm SeNPs (Sigma Aldrich) also tested | Particle frequency | Vendor software | [29] |
| Single quadrupole (Agilent 7900) | - | Standard glass concentric nebulizer (Micromist) | Scott | - | Manual tuning daily for the highest sensitivity | 100 µs | 60 | Single element | - | 40 nm AuNP (nanoComposix) | - | Vendor software | [30] |
| Sector Field (Thermo Scientific Element XR) | Self-aspiration | Glass concentric nebulizer (Seaspray) | Scott | 0.31 | - | 5 ms | 200 | Single element | 2 min wash in ultrapure water followed by a 3 min wash in 3% (v/v) HNO3 and a 2 min wash in ultrapure water | Citrate-coated 30 nm AuNP (NIST RM 8012) | Particle size | In-house spreadsheet | [31] |
| Single quadrupole (PerkinElmer NexION 300X) | Peristaltic pump | Meinhard glass nebulizer | Cyclonic | 0.35 | - | 100 µs | 100 | Single element | - | AuNPs of 30, 50 and 100 nm (PerkinElmer) | Particle size | Vendor software | [32] |
| Triple quadrupole (Thermo Scientific iCAP TQ) | Peristaltic pump + Autosampler | Standard glass concentric nebulizer (Micromist) | Cyclonic at 2.7 °C | 0.3 | Manual tuning daily for the highest sensitivity | 10 ms | 180 or 300 | Single element | - | Citrate-coated 30 nm AuNP (NIST RM 8012) | Particle frequency | Vendor software | [33] |
| Single quadrupole (Thermo Scientific XSERIES 2) | Peristaltic pump + Autosampler | Conical glass concentric | - | - | - | 3 ms | 60 | Single element | - | Citrate-coated 60 nm AuNP (NIST RM 8013) | Particle frequency | SPCT | [34] |
| Single quadrupole (Thermo Scientific iCapQ) | Self-aspiration intake | Teflon Micromist | Cyclonic | 0.36 | - | 10 ms | 180 | Single element | - | 50 nm AuNP | Particle size and particle frequency | Modified SPCT | [35] |
| Single quadrupole (PerkinElmer NexION 300) | Peristaltic pump | Standard glass concentric nebulizer (Micromist) | Cyclonic at room temperature | 0.4 | - | 100 µs | 60 to 300 | Dual isotope sequentially | - | Citrate-coated 60 nm AuNP (BBI) | Particle size and particle frequency | Vendor software | [36] |
| Single quadrupole (Agilent 7900) | Peristaltic pump | Standard glass concentric nebulizer (Micromist) | Scott | 0.346 | - | 100 µs | 100 | Single element | - | Citrate-coated 60 nm AuNP (NIST RM 8013) | Particle size and particle frequency | Vendor software | [37] |
| Triple quadrupole (Agilent 8800) | - | Standard glass concentric nebulizer (Micromist) | Scott | 0.5 | - | 3 ms | 60 | Single element | - | Citrate-coated 60 nm AuNP (NIST RM 8013) | Particle frequency | In-house spreadsheet | [38] |
| Single quadrupole (Thermo Scientific iCapQ) | Peristaltic pump | Low-flow concentric nebulizer | Cyclonic cooled | 0.4 | Manual tuning daily for the highest sensitivity | 3 ms | 60 to 180 | Single element | - | Citrate-coated 60 nm AuNP (NIST RM 8013) | Particle frequency | In-house spreadsheet | [39] |
| Triple quadrupole (Agilent 8900) | Peristaltic pump | Standard glass concentric nebulizer (Micromist) | Scott | 0.35 | - | 100 µs | 60 | Single element | 10 s probe rinse with ultrapure water; 60 s rinse with 1% (v/v) HCl, 1% (v/v) HNO3, and 1% (v/v) Triton X-100; 60 s rinse with 4% (v/v) HNO3; and 60 s rinse with ultrapure water | Citrate-coated 30 nm AuNP (NIST RM 8012) | Particle size | Vendor software | [40] |
| Single quadrupole (PerkinElmer NexION 300X) | Peristaltic pump | Meinhard concentric glass nebulizer | Cyclonic | - | Manual tuning daily for the highest sensitivity | 100 µs | 100 | Single element | - | Citrate-coated 30 nm and 60 nm AuNP (NIST RM 8012 and NIST RM 8013) | Particle size | Vendor software | [41] |
| Time of flight (TOFWERK icpTOF) | - | - | - | 0.32 to 0.40 | Manual tuning daily for the highest sensitivity | 2 ms | - | Multiple elements | - | 50 nm AuNP (Sigma-Aldrich) | Particle size | Custom script | [42] |
| Single quadrupole (Agilent 7900) | Peristaltic pump | Standard glass concentric nebulizer (Micromist) | Scott at 2 °C | 0.346 | - | 100 µs | 60 | Single element | - | Citrate-coated 60 nm AuNP (nanoComposix) | - | Vendor software | [43] |
| Single quadrupole (Agilent 7900) | Syringe pump | DS-5 microflow concentric nebulizer | Modified small volume | - | - | 100 µs | 60 | Single element | - | Citrate-coated 30, 60, 100, 200 nm AuNP (BBI) | Particle size | Custom script | [44] |
| Single quadrupole (Agilent 7900) | Peristaltic pump | - | - | - | - | 100 µs | 60 | Single element | - | Citrate-coated 60 nm AuNP (NIST RM 8013) | Particle frequency | Vendor software | [45] |
| Single quadrupole (Agilent 7700x) | - | Standard glass concentric nebulizer (Micromist) | Scott | 0.36 | Manual tuning daily for the highest sensitivity | 3 ms | 60 | Single element | HNO3 (1%, v/v), and ultrapure water | citrate-coated 60 nm AuNP (nanoComposix) | Particle size | In-house spreadsheet | [46] |
| Single quadrupole (Agilent 7900) | Peristaltic pump | - | - | 0.35 | - | 100 µs | 60 | Single element | - | Citrate-coated 60 nm AuNP (NIST RM 8013) | Particle frequency | Vendor software | [47] |
| Triple quadrupole (Agilent 8900) | Peristaltic pump | - | - | 0.35 | Manual tuning daily for the highest sensitivity | 100 µs | 60 | Single element | - | 50 nm AuNP | Particle size | Vendor software | [48] |
| Triple quadrupole (PerkinElmer NexION 2000B) | - | - | - | 0.32 to 0.36 | - | 50 µs | 60 | Single element | - | 60 nm AgNP (J&K Scientific Ltd.) | Particle frequency | Vendor software | [49] |
| Single quadrupole (PerkinElmer NexION 300X) | Peristaltic pump + Autosampler | Concentric PFA nebulizer | Cyclonic | 0.47 | - | 50 µs | 100 | Single element | - | Citrate-coated 60 nm AuNP (NIST RM 8013) | Particle frequency | Vendor software | [50] |
| Single quadrupole (PerkinElmer NexION 350D) | - | - | - | 0.294 | - | 100 µs | 60 | Single element | - | PVP-coated 30, 60, and 100 nm Au NP (nanoComposix) | - | - | [51] |
| Single quadrupole (PerkinElmer NexION 350X) | - | - | - | 0.29 to 0.32 | - | 100 µs | 100 | Single element | - | PEG-carboxil 30 nm, and 50 nm AuNP (nanoComposix) | Particle frequency | Vendor software | [52] |
| Triple quadrupole (Agilent 8900) | - | - | - | - | - | 100 µs | 60 | Single element | - | Citrate-coated 60 nm AuNP (BBI) | - | Vendor software | [53] |
| Triple quadrupole (Agilent 8800) | - | Standard glass concentric nebulizer (Micromist) | - | 0.346 | - | 3 ms | 60 | Single element | HNO3 (2%, v/v) and Triton X-100 (0.1%, v/v) | PEG-carboxil 50 nm AuNP (nanoComposix) | Particle frequency | Vendor software | [54] |
| Single quadrupole (Thermo Scientific iCapQ) | - | Microflow PFA-ST | Cyclonic | - | Autotune | 3 ms | 60 | Single element | - | Citrate-coated 60 nm AuNP (NIST RM 8013) | Particle frequency | SPCT | [55] |
| Single quadrupole (PerkinElmer NexION 300X) | Peristaltic pump + Autosampler | Concentric glass nebulizer | Cyclonic | 0.41 to 0.42 | - | 100 µs | 100 | Single element | - | Citrate-coated 60 nm AuNP (NIST RM 8013) | Particle frequency | Vendor software | [56] |
| Single quadrupole (PerkinElmer NexION 350D) | - | Meinhard concentric glass nebulizer | Cyclonic | 0.26 to 0.28 | - | 50 µs | 60 | Single element | - | 40 nm AgNP (PELCO®) | Particle frequency | Vendor software | [57] |
| Single quadrupole (PerkinElmer NexION 350D) | - | Meinhard concentric glass nebulizer | Cyclonic | 0.26 to 0.28 | - | 50 µs | 60 | Single element | HNO3 (2%, v/v) | 40 nm AgNP (PELCO®) | Particle frequency | Vendor software | [58] |
| Single quadrupole (PerkinElmer NexION 350D) | - | Meinhard concentric glass nebulizer | Cyclonic | 0.26 to 0.28 | - | 50 µs | 60 | Single element | - | 40 nm AgNP (PELCO®) | Particle frequency | Vendor software | [59] |
| Single quadrupole (Thermo Scientific iCapQ) | Peristaltic pump | Low-flow concentric nebulizer | Cyclonic cooled | 0.4 mL | - | 3 ms | 180 | Single element | - | Citrate-coated 60 nm AuNP (NIST RM 8013) | Particle frequency | In-house spreadsheet | [60] |
| Single quadrupole (Thermo Scientific XSERIES 2) | Peristaltic pump + Autosampler | Conical glass concentric | - | - | - | 3 ms | 60 | Single element | - | Citrate-coated 60 nm AuNP (NIST RM 8013) | Particle frequency | SPCT | [61] |
| Varied among the participants | Varied among the participants | Varied among the participants | Varied among the participants | - | - | 3 ms | 60 | Single element | - | Citrate-coated 60 nm AuNP (NIST RM 8013) | Particle frequency | SPCT | [62] |
| Single quadrupole (Agilent 7700x) | - | Standard glass concentric nebulizer (Micromist) | Scott | - | - | 3 ms | 60 | Single element | - | Citrate-coated 30 nm AuNP (LGCQC5050) | Particle frequency | In-house spreadsheet | [63] |
| Single quadrupole (Thermo Scientific iCapQ) | Peristaltic pump | Low-flow concentric nebulizer | Cyclonic cooled | 0.4 | Manual tuning daily for the highest sensitivity | 5 ms | 60 to 180 | Single element | Surfactant-containing acid mixture | Citrate-coated 60 nm AuNP (NIST RM 8013) | Particle frequency | In-house spreadsheet | [64] |
| Single quadrupole (PerkinElmer NexION 300Q) | - | Meinhard concentric glass nebulizer | Cyclonic | - | - | 10 ms | 200 | Single element | - | Tannic acid-coated 100 nm AuNP (BBI) | Particle size | - | [65] |
| Sector field (Thermo Scientific Element2) | Peristaltic pump | - | - | 1.0 | - | 2 ms | 60 | Single element | - | Citrate-coated 60 nm AuNP (NIST RM 8013) | Particle frequency | SPCT | [66] |
| Single quadrupole (Thermo Scientific iCapQ) | - | Concentric PFA | Cyclonic | - | - | 0.5 ms | 60 to 300 | Single element | HNO3 (2%, v/v) | 60 nm AgNP | Particle frequency | Custom script | [67] |
| Single quadrupole (PerkinElmer NexION 300X) | Peristaltic pump + Autosampler | Concentric PFA nebulizer | Cyclonic | 0.41 to 0.43 | - | 100 µs | 100 | Single element | - | Citrate-coated 60 nm AuNP (NIST RM 8013) | Particle frequency | Vendor software | [68] |
| LOD/LOQ for Size | LOD/LOQ for Mass Concentration | LOD/LOQ for Number Concentration | Size Linear Range | Repeatability | Reproducibility | Trueness of Size | Trueness of Concentration | Ref. |
|---|---|---|---|---|---|---|---|---|
| LOD: 11 nm to 20 nm for Ag depending on the sample | - | - | - | - | - | Confirmed by TEM analysis | Comparison with ICP-MS after acid digestion | [3] |
| LOD: 9 nm for Ag LOQ: 11 nm to 13 nm for Ag | LOD: 0.1 ng g−1 for 110 nm AgNPs | LOD: (0.5 to 1.2) × 104 mL−1 | Assessed for ionic Ag concentration up to 2.5 ng mL−1 | Size: 0.9% to 6.2% Mass Concentration: 16% to 29% | - | Confirmed by TEM analysis | Mass Concentration: 57% Number concentration: 51% Comparison with expected concentration | [23] |
| LOD: 40 nm for TiO2 | - | - | - | - | - | Compared with TEM and CLS analysis | - | [4] |
| LOD: 38 nm for TiO2 | - | - | 38 nm to 475 nm for TiO2 | Size: <10% | Size: <25% | Confirmed by TEM analysis | - | [24] |
| - | - | - | - | - | - | Comparison with SEM and AF4-ICP-MS analysis | Comparison with AF4-ICP-MS analysis | [25] |
| LOD: 39 nm for TiO2 | LOD: 50 ng L−1 in diluted suspensions | LOD: 200 L−1 in diluted suspensions | - | Size: 4.9% Mass Concentration: 18% Number Concentration:17% | Size: 8.2% Mass Concentration: 23% Number Concentration:13% Expressed as intermediate precision | 107% comparison with TEM analysis | Mass Concentration: 96% comparison with expected concentration | [26] |
| LOD ultrapure water: 25 nm for Au, 28 nm for Ag, 48 nm for Al LOD food matrix: 25 nm for Au, 31 nm for Ag, 81 nm for Al | - | LOD ultrapure water: 1.55 × 10⁵ L−1 for Au, 1.50 × 10⁵ L−1 for Ag, 2.32 × 10⁵ L−1 for Al LOD food matrix: 2.21 × 10⁵ L−1 for Au, 1.81 × 10⁵ L−1 for Ag, 1.94 × 10⁵ L−1 for Al | - | - | - | - | - | [27] |
| Particle calibration curve: 31 nm to 34 nm for Ag and Au Blank value: 0.6 nm to 2 nm for Ag and Au Dissolved calibration: 3 nm to 6 nm for Ag and Au | - | - | - | Size: 0.3% to 8.1% for Ag 0.4% to 47.0% for Au Expressed as within-day precision | Size: 1.9% to 25.3% for Ag 2.7% to 58.4% for Au Expressed as intermediate precision | 93.2% to 114.3% for Ag 67.3% to 111.2% for Au Compared with TEM analysis supplied by the manufacturer | Number Concentration: 101.8% to 171.7% for Ag 87.0% to 119.4% for Au Comparison with expected concentration | [28] |
| LOD: 20 nm for Ag 37 nm to 52 nm for Al2O3 35 nm to 76 nm for Fe2O3 89 nm to 311 nm for SiO2 37 nm to 43 nm for TiO2 | - | - | - | - | - | Confirmed by SEM analysis | - | [14] |
| LOD: 18 nm for Se | - | LOD: 1.8 × 10² mL−1 LOQ: 6.0 × 10³ mL−1 | - | - | Confirmed by TEM analysis | - | [29] | |
| - | LOD: 500 ng L−1 for 60 nm AuNPs | - | - | Size: (1 ± 1)% Mass Concentration: (2 ± 1)% | - | Mass Concentration: (97 ± 7)% (n = 3) Comparison with expected concentration | [30] | |
| LOD: 32 nm for TiO2 | - | - | - | - | - | 74% Comparison with SEM analysis | Mass Concentration: 65% to 74% Comparison with ICP-MS after acid digestion | [31] |
| LOD: 18 nm for Au 32 nm for TiO2 > 200 nm for SiO2 30 nm for Ag | LOD: 5 ng L−1 for 30 nm AuNPs 20 ng L−1 for 60 nm AuNPs 200 ng L−1 for 100 nm AuNPs 50 ng L−1 to 100 ng L−1 for TiO2 100 ng L−1 for Ag | - | - | Mass Concentration: 1% to 5% for AuNPs of 30, 50, and 100 nm | Mass Concentration: 8% to 14% for AuNPs of 30, 50, and 100 nm | 80% to 112% for AuNPs | - | [32] |
| LOD: 26 nm to 107 nm for TiO2 | Background equivalent concentration: 0.024 µL L−1to 5.436 µL L−1 | - | - | - | - | Agreement with published TEM | - | [33] |
| LOD: 20 nm to 50 nm for TiO2 | - | - | 60 nm to 300 nm for TiO2 | - | - | Compared with SEM and AF4-ICP-MS analysis | Compared with AF4-ICP-MS analysis | [34] |
| LOD: < 30 nm for TiO2 | - | - | - | - | - | - | - | [35] |
| LOD: 28 nm and 36 nm for 48TiO2; 67 nm and 85 nm for 47TiO2 | - | - | - | - | - | - | - | [36] |
| LOD: 18 nm for Au 32 nm for TiO2 | LOD: 5 ng L−1 for 30 nm AuNPs | - | - | Size: <6% | Size: <14% | Comparison with SEM, TEM, and DLS analysis supplied by the manufacturer | Comparison with ICP-MS after acid digestion | [37] |
| LOD: 13 nm for Ag | - | - | - | Mass Concentration: 38% RSD | - | - | Mass Concentration: 20% Comparison with expected concentration and with ICP-MS after acid digestion | [38] |
| LOD: 50 nm 50 to 60 nm for Al | - | - | - | Size: 2.7% Mass Concentration: 10.8% | - | - | Mass Concentration: 12% for noodle samples and 36.1% for SRM Wheat Flour. Comparison with ICP-MS after acid digestion | [39] |
| LOD: 14 nm for Ag | LOD: 2.2 ng g−1 LOQ: 7.7 ng g−1 | LOD instrumental: 2.40 × 10³ mL−1 LOD sample: 4.34 × 10⁷ g−1 | - | Size: <10% for size Number Concentration: 15% to 18% | - | Confirmed with TEM analysis | Number Concentration: (112 ± 12)% Comparison with expected concentration | [40] |
| - | - | - | - | - | - | - | - | [41] |
| LOD: 30 nm for Au, 42 nm for CuO, 62 nm to 78 nm for ZnO | - | - | - | Number Concentration: 12% to 25% for Au 7% to 17% for CuO 17% to 38% for ZnO | - | Mass Concentration: > 91% for Au 74% for CuO 68% for ZnO Comparison with ICP-MS after acid digestion | [42] | |
| - | - | - | - | - | - | Confirmed by TEM analysis | - | [43] |
| - | - | - | - | - | Compared with spICP-MS analysis of pristine NPs | - | [44] | |
| - | - | - | - | - | - | - | - | [45] |
| - | - | - | - | - | - | Compared with spICP-MS analysis of pristine NPs | Comparison with expected concentration | [46] |
| - | - | - | - | - | - | Compared with spICP-MS analysis of pristine NPs | - | [47] |
| - | - | - | - | - | - | Compared with spICP-MS analysis of pristine NPs | Compared with spICP-MS analysis of pristine NPs | [48] |
| LOD: 11 nm for Ag 27 nm for TiO2 | - | - | - | - | - | Mass Concentration: 73.1% to 127% for Ag 5.5% to 23.3% for TiO2 Comparison with measured concentration of solution used for spiking | [49] | |
| LOD: 13.6 nm to 16.2 nm for Ag | - | LOD: 0.417 × 10⁷ g−1 | - | Number Concentration: 8% | - | Confirmed by SEM analysis | Number Concentration: 92% for 40 nm Ag 103% for 60 nm Ag Comparison with measured concentration of solution used for spiking | [50] |
| LOD: 15 nm to 17 nm for Au 10 nm to 12 nm for Ag 38 nm to 42 nm for TiO2 | LOD: 0.005 ng g−1 for dissolved Au 0.005 ng g−1 for dissolved Ag 0.010 ng g−1 for dissolved Ti | - | - | - | - | Confirmed by TEM analysis | Number Concentration: (95 ± 1)% for Au (88 ± 0.9)% for Ag Comparison with expected concentration | [51] |
| - | - | - | - | - | - | (98.2 ± 3.8)% for 50 nm Au NPs in ultrapure water (106.8 ± 1.2)% for 50 nm Au NPs in enzyme-digested mollusk (97.2 ± 5.5)% for 60 nm for TiO2 NPs in ultrapure water (116.0 ± 4.4)% for 50 nm for CuO NPs in ultrapure water (104.5 ± 12.8)% for 80 nm for ZnO NPs in ultrapure water (94.0 ± 3.7)% for 80 nm for Ag NPs in ultrapure water Not significantly different from those measured in enzyme-digested mollusk and seawater Compared with expected nominal diameter | Number Concentration: (98.6 ± 3)% for 50 nm Au in ultrapure water (94.1 ± 10)% for 50 nm Au in enzyme-digested mollusk (91.0 ± 57)% for 60 nm for TiO2 in enzyme-digested mollusk (92.6 ± 7.1)% for 60 nm for TiO2 in seawater (81.2 ± 6)% for 50 nm for CuO in enzyme-digested mollusk (85.3 ± 8.4)% for 50 nm for CuO in seawater (78.1 ± 4)% for 80 nm for ZnO in enzyme-digested mollusk (80.6 ± 11.6)% for 80 nm for ZnO in seawater (85.3 ± 7)% for 80 nm for Ag in enzyme-digested mollusk (87.6 ± 8.9)% for 80 nm for Ag in seawater Not significantly different from those measured in enzyme-digested mollusk and seawater Compared with expected concentration | [52] |
| LOD: 16 nm to 20 nm for Ag | - | - | - | - | - | Compared with spICP-MS analysis of pristine NPs | - | [53] |
| - | - | - | - | - | - | 95.9% for Au in alkaline treatment solution 103.6% for Au in enzyme treatment solution Compared with spICP-MS analysis of pristine NPs | Mass concentrations: 31.1 ng g−1 to 284.4 ng g−1 in clams 11.6 g g−1 to 127.3 ng g−1 for Y, La, Ce, Pr, and Nd in oysters. NPs of other elements not detected. Comparison with ICP-MS after acid digestion | [54] |
| LOD: 50 nm for TiO2 | LOQ: 50 μg kg−1 for TiO2 | - | - | Mass Concentration: 3% to 8% for TiO2 | - | Confirmed by TEM analysis combined with EDX spectroscopy | Mass Concentration: 70% to 120% for TiO2 Comparison with ICP-MS after acid digestion | [55] |
| LOD: 24.4 nm to 30.4 nm for TiO2 | Total Ti determination LOD: 31.7 ng g−1 LOQ: 105.6 ng g−1 | LOD: 5.28 × 10⁶ g−1 LOQ: 1.76 × 10⁷ g−1 | - | Size: 3% Number Concentration: 17% | - | Comparison with measured size of solution used for spiking | Number Concentration: 90% to 99% Comparison with measured concentration of solution used for spiking | [56] |
| LOD: 20 nm for Ag | - | LOD: 1.5 × 10³ mL−1 LOQ: 3.0 × 10³ mL−1 | - | - | - | 108.0% in water 110.5% in TMAH 1% Confirmed by TEM analysis supplied by the manufacturer | Number Concentration: 97.0% in water 88.4% in TMAH 1% Comparison with expected concentration | [57] |
| LOD: 35 nm for TiO2 | - | LOD: 1.3 × 10³ mL−1 | - | - | - | Confirmed by TEM analysis supplied by the manufacturer | Number Concentration: (97.6 ± 10.5)% in water (108.8 ± 7.2)% in TMAH 1% Comparison with expected concentration | [58] |
| LOD: 27 nm for ZnO | - | LOD: 3.0 × 10⁵ g−1 | - | - | - | Confirmed by TEM analysis supplied by the manufacturer | Number Concentration: (84.7 ± 3.0)% Comparison with expected concentration | [59] |
| LOD: 15 nm for Ag | - | - | - | - | - | Comparison with TEM analysis | Mass Concentration: (68 ± 13)% Comparison with expected concentration | [60] |
| - | LOD: 0.05 mg kg−1 | - | Assessed for 60 nm Ag concentration up to 50 mg kg−1 | Size: 0.8% to 1.8% Mass Concentration: 6.7% to 11% Number Concentration: 6.4% to 14% | Size: 5.0% to 5.6% Mass Concentration: 8.9% to 16% Number Concentration: 7.5% to 18% | 98% to 99% Compared with spICP-MS analysis of pristine NPs | Mass Concentration: 98% to 101% Number Concentration: 91% to 95% Compared with expected values | [61] |
| - | - | - | - | Size: 2% to 5% Number Concentration: 7% to 18% | Size: 15% to 25% Number Concentration: 70% to 90% | 60% larger equivalent median diameter than the spiking solution using TEM and spICP-MS | Mass Concentration: 19% for Ag. Comparison with measured concentration of solution used for spiking by Neutron Activation Analysis | [62] |
| LOD: 26 nm for ZnO | - | - | - | - | - | Confirmed by TEM and DLS analysis | - | [63] |
| LOD: Wild boar: (56 ± 2) nm for Pb for 1 h of enzymatic digestion (80 ± 3) nm for Pb for 16 h of enzymatic digestion Roe deer: (46 ± 2) nm for Pb for 1 h of enzymatic digestion (43 ± 4) nm for Pb for 16 h of enzymatic digestion | LOD: 50 ng g−1 of dissolved Pb for wild boar 40 ng g−1 of dissolved Pb for roe deer | - | - | - | - | - | - | [64] |
| - | - | - | - | - | - | Comparison with expected size distribution of pristine NPs | Number Concentration: 90% to 95% for Au 83% to 106% for Ag Comparison with expected concentration Mass Concentration: 90% for Au 96% for Ag Comparison with ICP-MS after acid digestion | [65] |
| LOD: 10 nm for Ag | - | - | - | - | - | 88% for Ag Confirmed by SEM-EDX analysis | Mass Concentration: 80% to 118% for Ag Comparison with AAS after acid digestion | [66] |
| LOD: 20.9 nm to 22.9 nm for HgSe | - | - | - | - | - | - | - | [67] |
| LOD: 31.3 nm to 37.1 nm for TiO2 | - | LOD: 5.1 × 10⁵ g−1 LOQ: 1.7 × 10⁶ g−1 | - | Size: 8% Number Concentration: 25% | - | Confirmed by TEM analysis | Number Concentration: (108 ± 5)% for 50 nm TiO2 (105 ± 4)% for 100 nm TiO2 Comparison with measured concentration of solution used for spiking | [68] |
Disclaimer/Publisher’s Note: The statements, opinions and data contained in all publications are solely those of the individual author(s) and contributor(s) and not of MDPI and/or the editor(s). MDPI and/or the editor(s) disclaim responsibility for any injury to people or property resulting from any ideas, methods, instructions or products referred to in the content. |
© 2023 by the authors. Licensee MDPI, Basel, Switzerland. This article is an open access article distributed under the terms and conditions of the Creative Commons Attribution (CC BY) license (https://creativecommons.org/licenses/by/4.0/).
Share and Cite
Loeschner, K.; Johnson, M.E.; Montoro Bustos, A.R. Application of Single Particle ICP-MS for the Determination of Inorganic Nanoparticles in Food Additives and Food: A Short Review. Nanomaterials 2023, 13, 2547. https://doi.org/10.3390/nano13182547
Loeschner K, Johnson ME, Montoro Bustos AR. Application of Single Particle ICP-MS for the Determination of Inorganic Nanoparticles in Food Additives and Food: A Short Review. Nanomaterials. 2023; 13(18):2547. https://doi.org/10.3390/nano13182547
Chicago/Turabian StyleLoeschner, Katrin, Monique E. Johnson, and Antonio R. Montoro Bustos. 2023. "Application of Single Particle ICP-MS for the Determination of Inorganic Nanoparticles in Food Additives and Food: A Short Review" Nanomaterials 13, no. 18: 2547. https://doi.org/10.3390/nano13182547
APA StyleLoeschner, K., Johnson, M. E., & Montoro Bustos, A. R. (2023). Application of Single Particle ICP-MS for the Determination of Inorganic Nanoparticles in Food Additives and Food: A Short Review. Nanomaterials, 13(18), 2547. https://doi.org/10.3390/nano13182547