
The Structural and Electrochemical Properties of CuCoO2 Crystalline Nanopowders and Thin Films: Conductivity Experimental Analysis and Insights from Density Functional Theory Calculations


 , ,
, ,  , ,
, , 
Abstract
1. Introduction
2. Experimental Part
2.1. Synthesis of CuCoO2 Powders
2.2. Synthesis of the CuCoO2 Thin Films
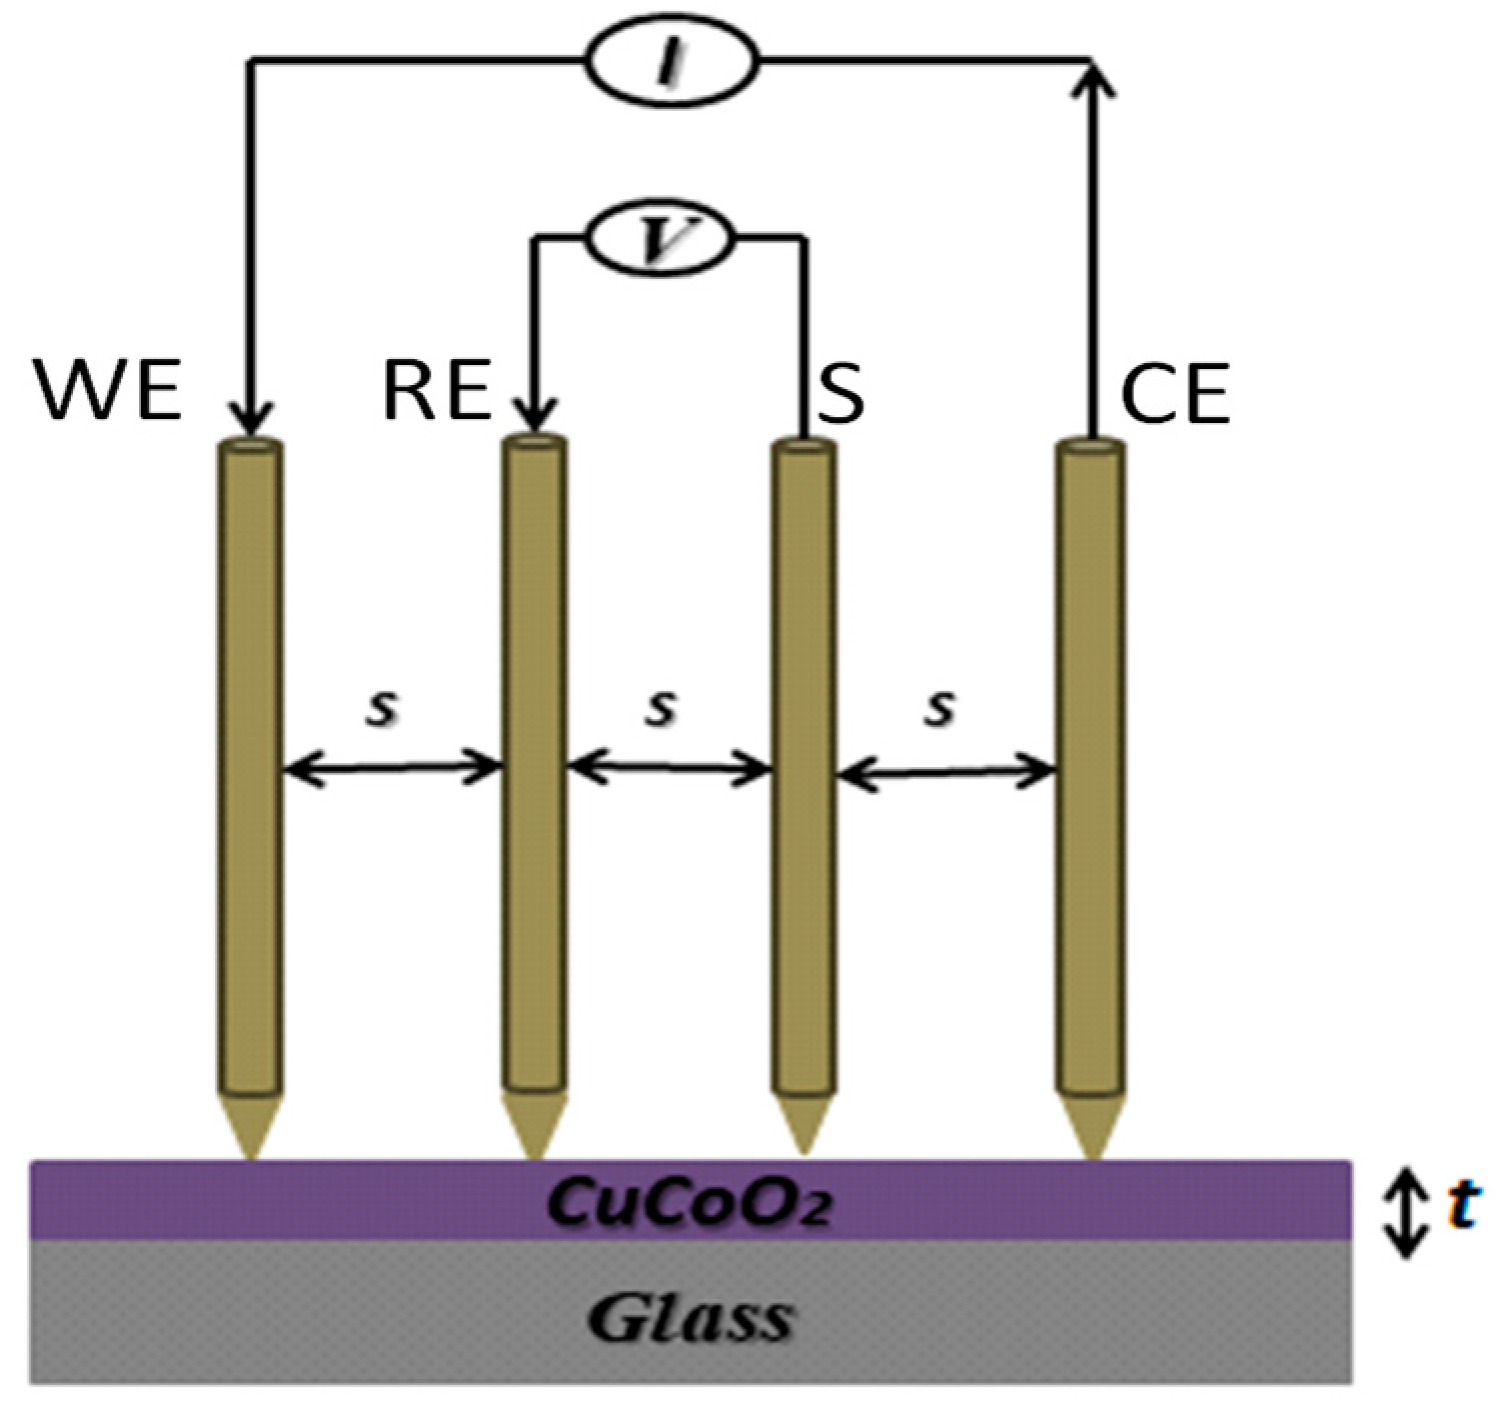
2.3. The Four-Probe Method
2.4. Electrochemical Impedance Spectroscopy (EIS) Measurements
3. Results and Discussion
3.1. Structural Analysis
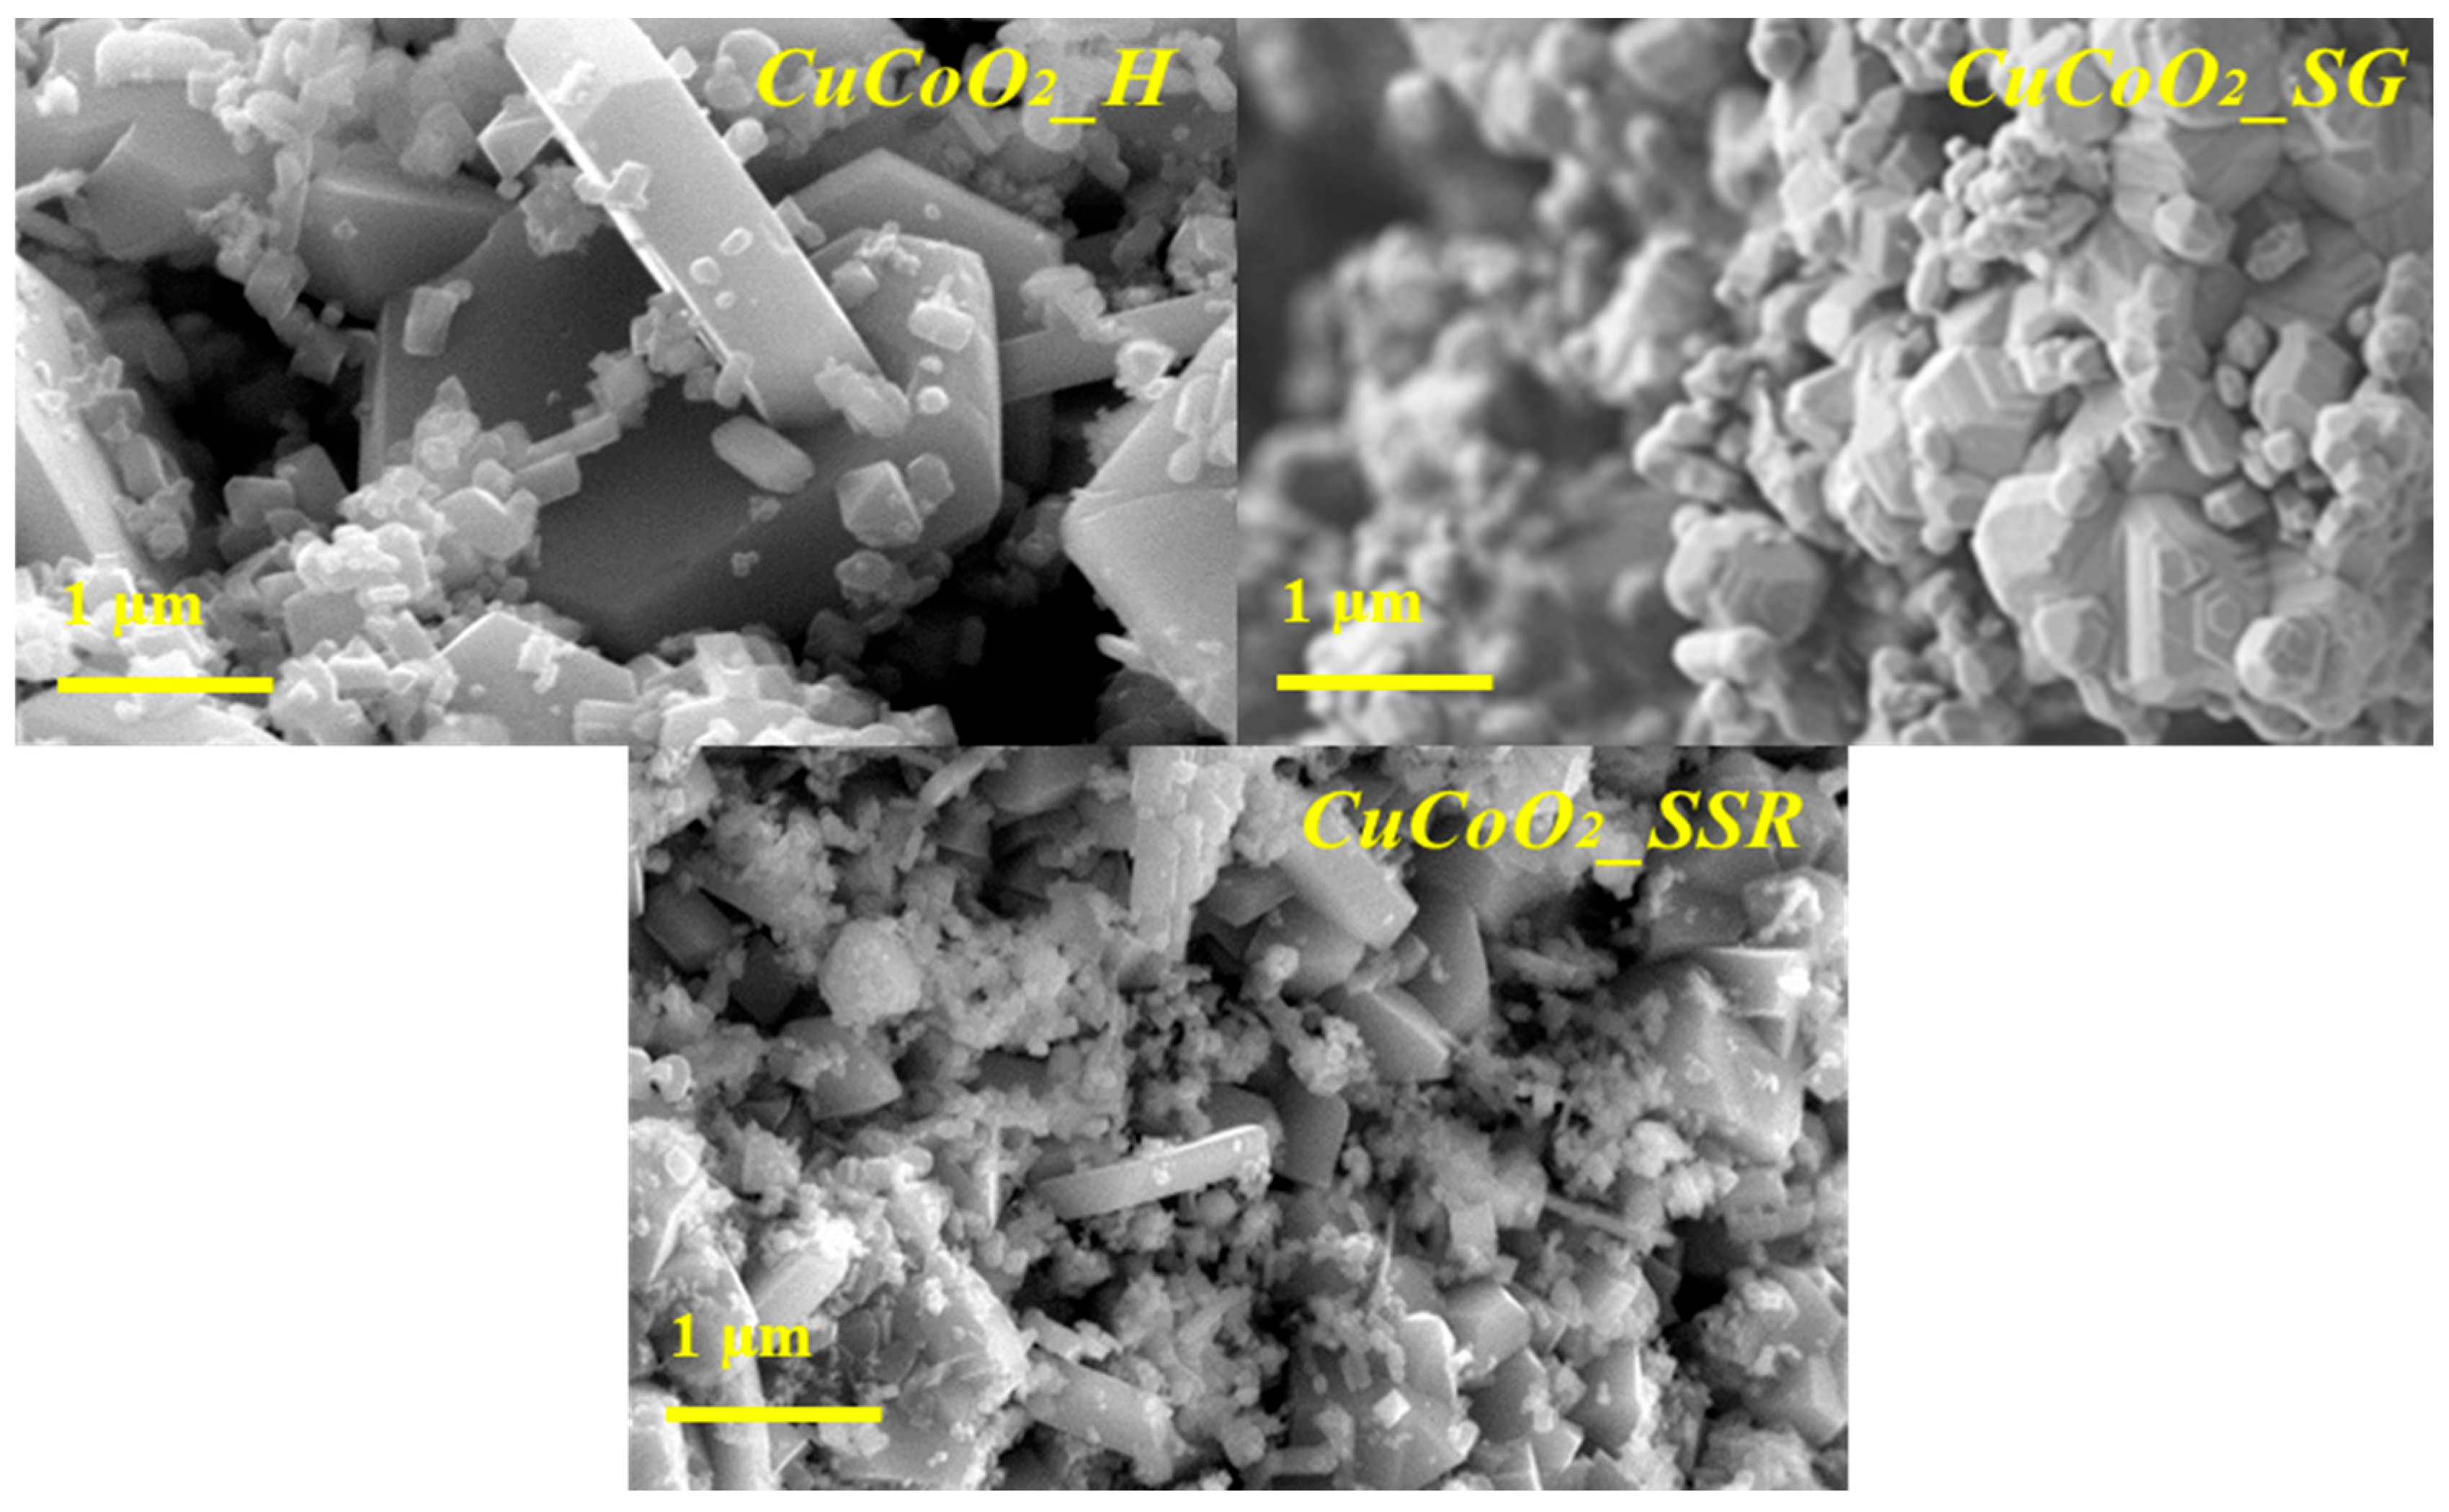
3.2. FE-SEM Analysis
3.3. HR-TEM
Analysis
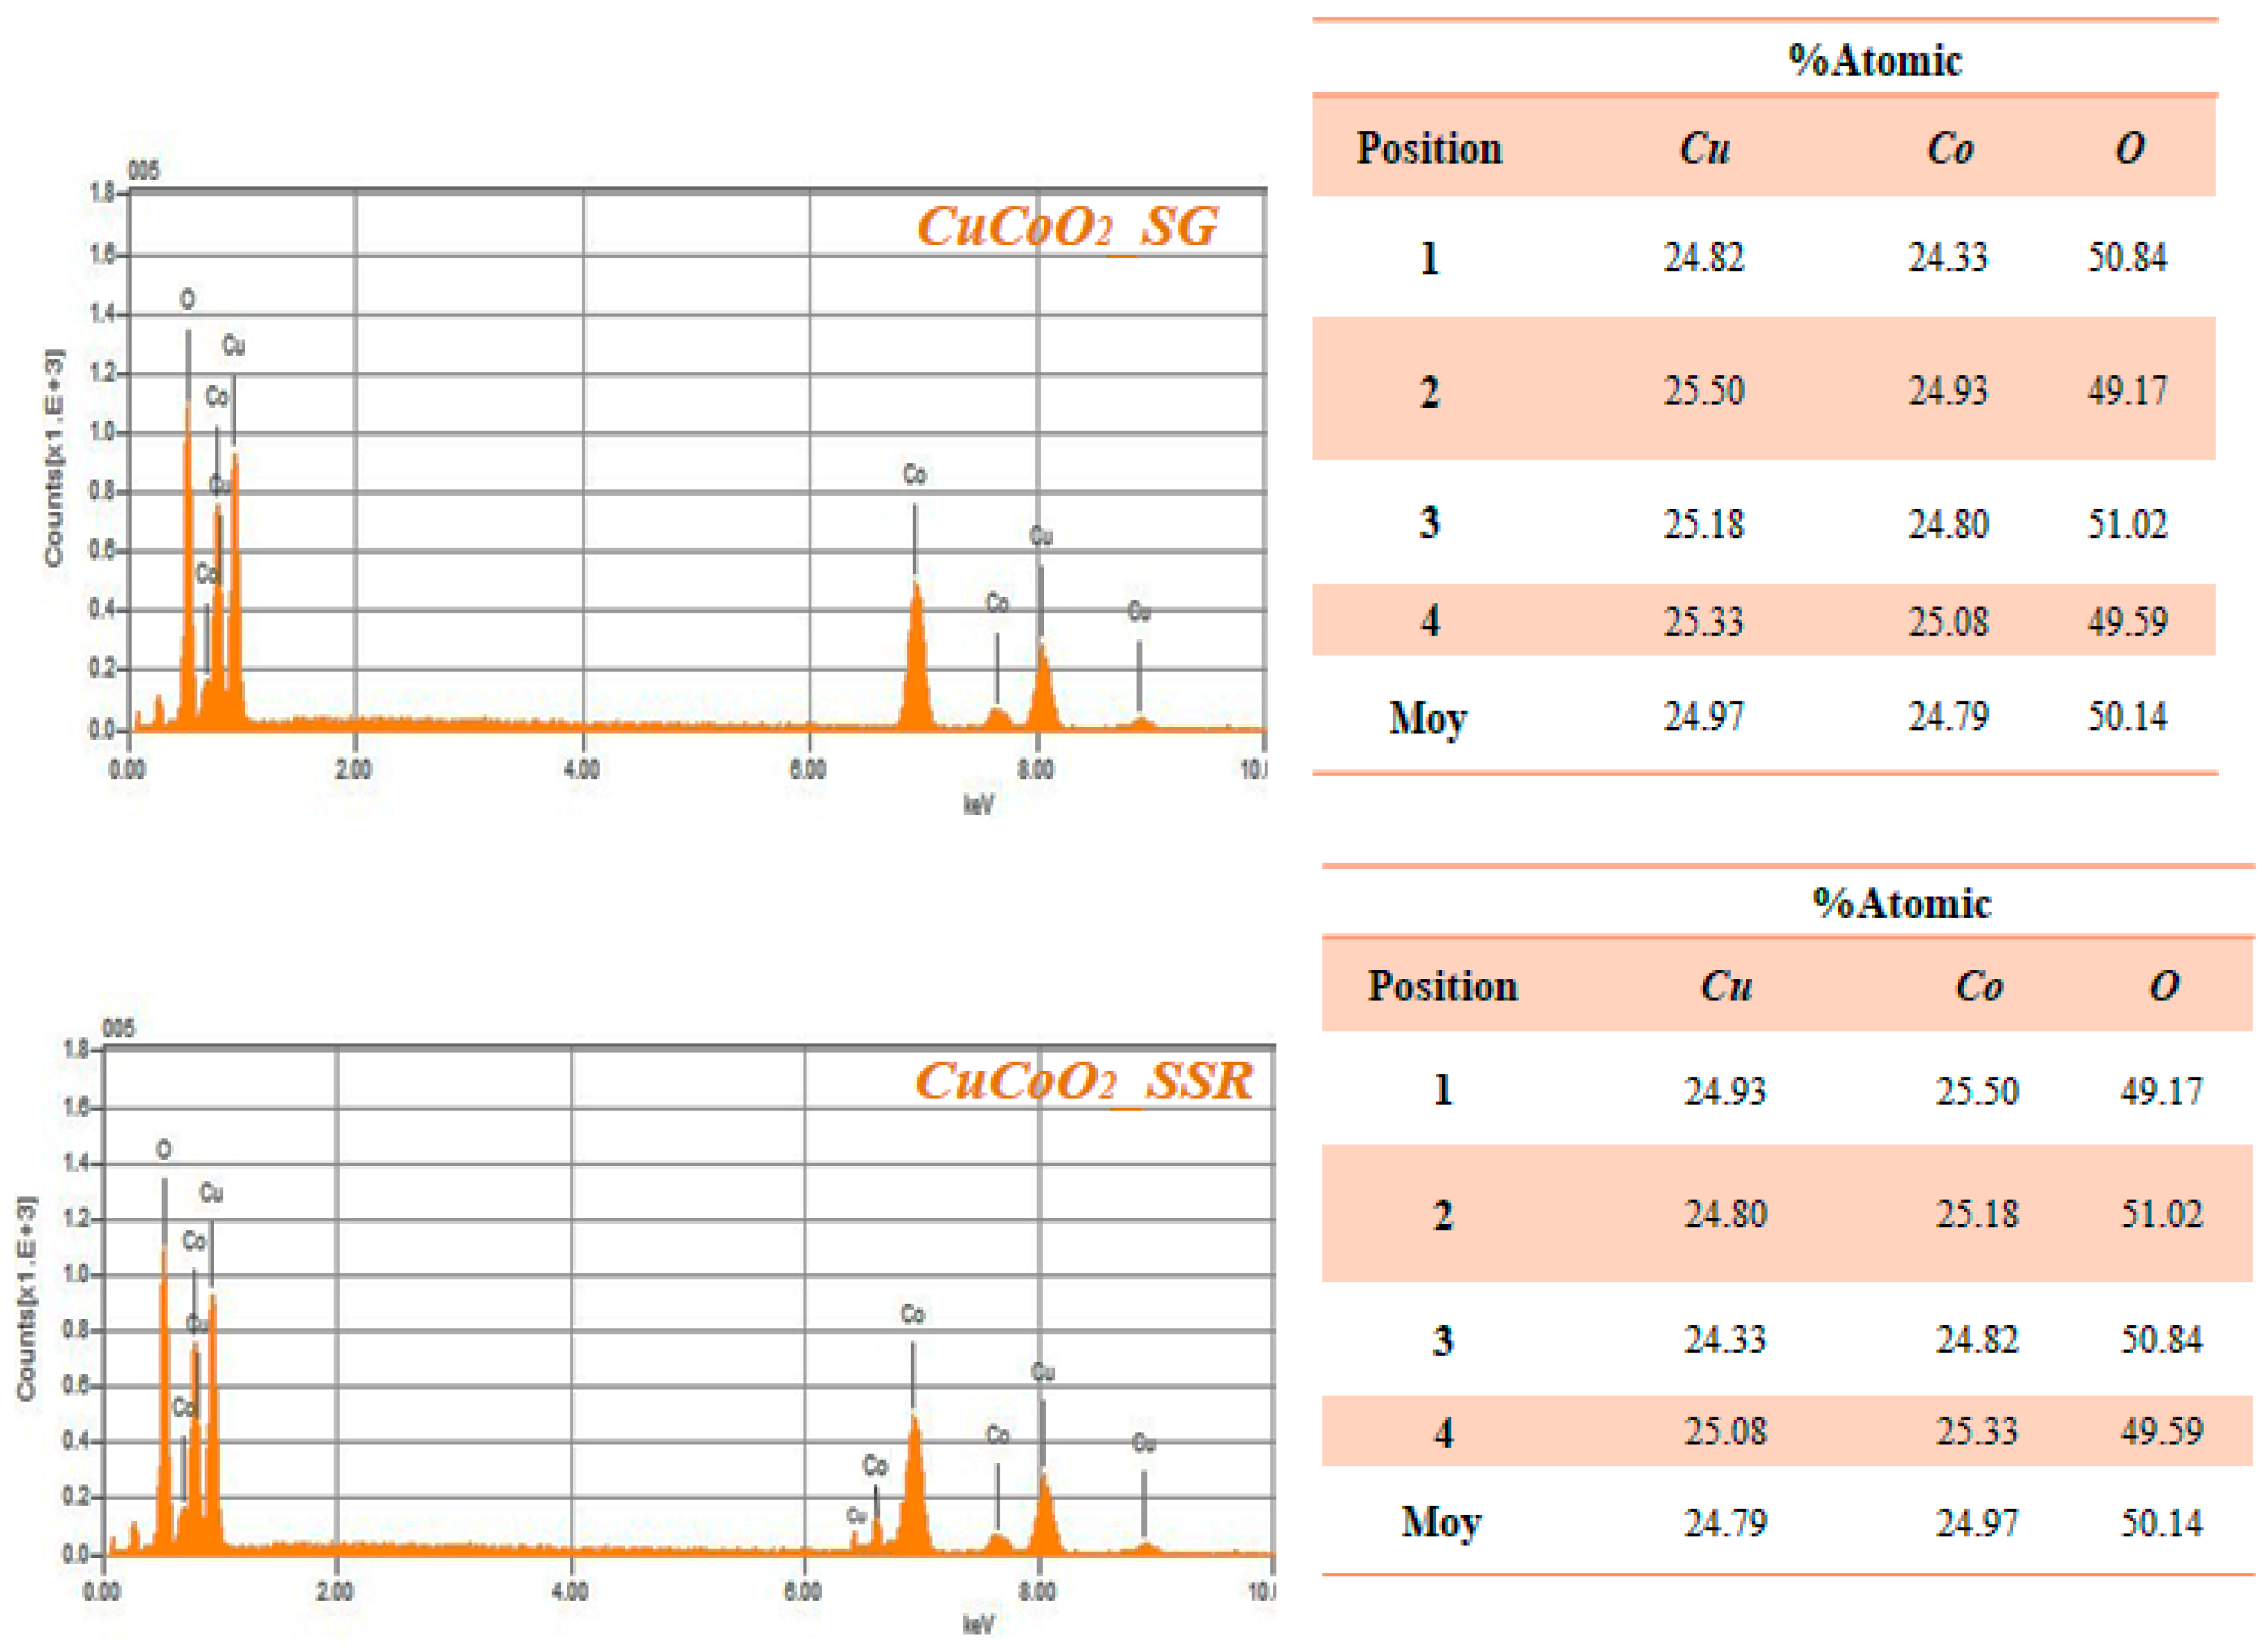
4. EDX Analysis
5. Optical Properties
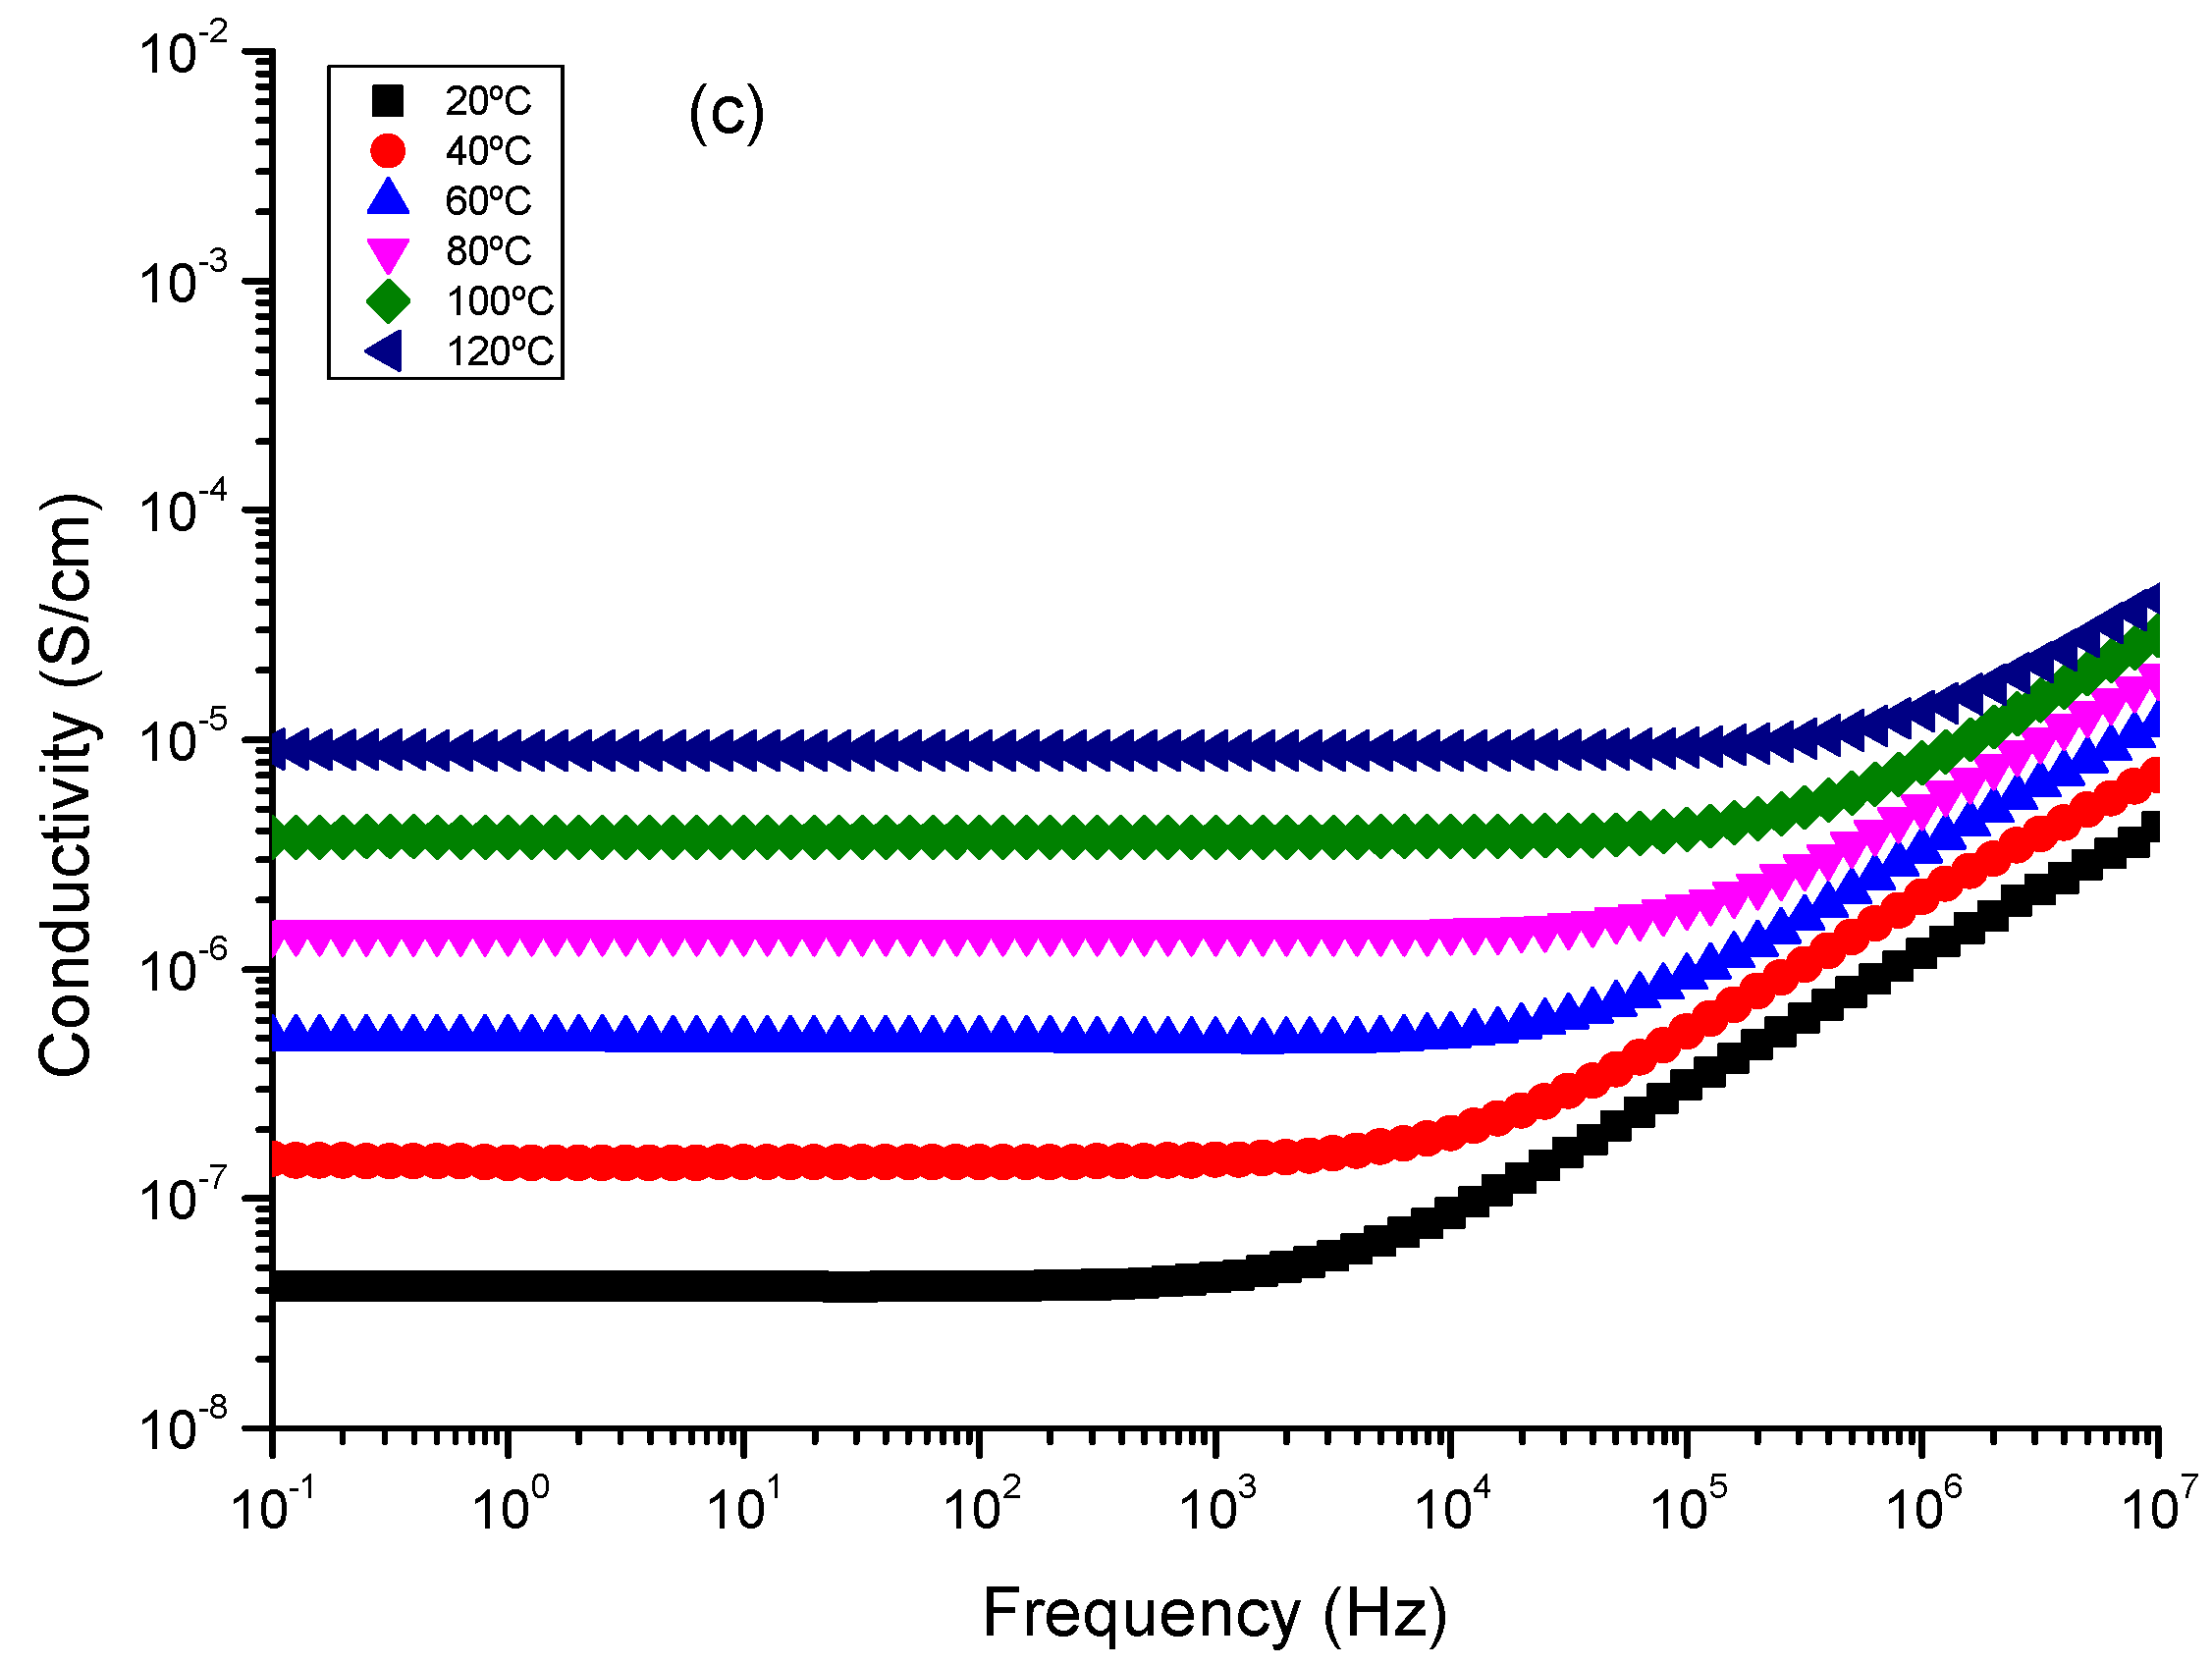
6. In-Plane Conductivity Measurements
7. Dielectric Spectra Analysis
8. Theoretical Insight
9. Conclusions
Supplementary Materials
Author Contributions
Funding
Data Availability Statement
Conflicts of Interest
References
- Ai, B.; Fan, Z.; Wong, Z.J. Plasmonic–perovskite solar cells, light emitters, and sensors. Microsyst. Nanoeng. 2022, 8, 5. [Google Scholar] [CrossRef]
- Fukuda, K.; Yu, K.; Someya, T. The Future of Flexible Organic Solar Cells. Adv. Energy Mater. 2020, 10, 2000765. [Google Scholar] [CrossRef]
- Sehrawat, P.; Malik, R.K.; Khatkar, S.P.; Taxak, V.B. Highly efficient green-glimmering Y3Al5O12: Er3+ NPs for next generation electro-optic appliances, mainly white-LEDs and solar-cells. Chem. Phys. Lett. 2021, 773, 138592. [Google Scholar] [CrossRef]
- Sargent, E.H. Solar Cells, Photodetectors, and Optical Sources from Infrared Colloidal Quantum Dots. Adv. Mater. 2008, 20, 3958–3964. [Google Scholar] [CrossRef]
- Cappelli, I.; Carli, F.; Fort, A.; Micheletti, F.; Vignoli, V.; Bruzzi, M. Self-Sufficient Sensor Node Embedding 2D Visible Light Positioning through a Solar Cell Module. Sensors 2022, 22, 5869. [Google Scholar] [CrossRef] [PubMed]
- Dinh, N.N.; Khanh, T.S.T.; Long, L.M.; Cuong, N.D.; Nam, N.P.H. Nanomaterials for Organic Optoelectronic Devices: Organic Light-Emitting Diodes, Organics Solar Cells and Organic Gas Sensors. Mater. Trans. 2020, 61, 1422–1429. [Google Scholar] [CrossRef]
- Dai, B.; Biesold, G.M.; Zhang, M.; Zou, H.; Ding, Y.; Wang, Z.L.; Lin, Z. Piezo-phototronic effect on photocatalysis, solar cells, photodetectors and light-emitting diodes. Chem. Soc. Rev. 2021, 50, 13646–13691. [Google Scholar] [CrossRef]
- Xu, J.; Shalom, M. Conjugated Carbon Nitride as an Emerging Luminescent Material: Quantum Dots, Thin Films and Their Applications in Imaging, Sensing, Optoelectronic Devices and Photoelectrochemistry. Chemphotochem 2019, 3, 170–179. [Google Scholar] [CrossRef]
- Youn, D.H.; Choi, Y.H.; Kim, J.H.; Han, S.; Heller, A.; Mullins, C.B. Simple Microwave-Assisted Synthesis of Delafossite CuFeO2 as an Anode Material for Sodium-Ion Batteries. ChemElectroChem 2018, 5, 2419–2423. [Google Scholar] [CrossRef]
- Amrute, A.P.; Łodziana, Z.; Mondelli, C.; Krumeich, F.; Perez-Ramirez, J. Solid-state chemistry of cuprous delafossites: Synthesis and stability aspects. Chem. Mater. 2013, 25, 4423–4435. [Google Scholar] [CrossRef]
- Sheets, W.C.; Mugnier, E.; Barnabé, A.; Marks, T.J.; Poeppelmeier, K.R. Hydrothermal Synthesis of Delafossite-Type Oxides. Chem. Mater. 2006, 18, 7–20. [Google Scholar] [CrossRef]
- Karati, A.; Parida, T.; Gupta, J.; Adigilli, H.K.; Borse, P.H.; Joardar, J. Band-gap engineering in novel delafossite-type multicomponent oxides for photocatalytic degradation of methylene blue. Mater. Res. Bull. 2021, 137, 111181. [Google Scholar] [CrossRef]
- Singh, A.N.; Mondal, R.; Rath, C.; Singh, P. Electrochemical Performance of Delafossite, AgFeO2: A Pseudo-Capacitive Electrode in Neutral Aqueous Na2SO4 Electrolyte. J. Electrochem. Soc. 2021, 168, 120512. [Google Scholar] [CrossRef]
- Bennett, J.W.; Jones, D.T.; Hudson, B.G.; Melendez-Rivera, J.; Hamers, R.J.; Mason, S.E. Emerging investigator series: First-principles and thermodynamics comparison of compositionally-tuned delafossites: Cation release from the (001) surface of complex metal oxides. Environ. Sci. Nano 2020, 7, 1642–1651. [Google Scholar] [CrossRef]
- Dong, Y.; Cao, C.; Chui, Y.-S.; Zapien, J.A. Facile hydrothermal synthesis of CuFeO2 hexagonal platelets/rings and graphene composites as anode materials for lithium ion batteries. Chem. Commun. 2014, 50, 10151–10154. [Google Scholar] [CrossRef] [PubMed]
- Liu, Y.; Gong, Y.; Mellott, N.P.; Wang, B.; Ye, H.; Wu, Y. Luminescence of delafossite-type CuAlO2 fibers with Eu substitution for Al cations. Sci. Technol. Adv. Mater. 2016, 17, 200–209. [Google Scholar] [CrossRef]
- Fujishiro, F.; Murakami, M.; Hashimoto, T.; Takahashi, M. Orange luminescence of Eu3+-doped CuLaO2 delafossite oxide. J. Ceram. Soc. Jpn. 2010, 118, 1217–1220. [Google Scholar] [CrossRef][Green Version]
- Jacob, A.; Parent, C.; Boutinaud, P.; Le Flem, G.; Doumerc, J.; Ammar, A.; Elazhari, M.; Elaatmani, M. Luminescent properties of delafossite-type oxides LaCuO2 and YCuO2. Solid State Commun. 1997, 103, 529–532. [Google Scholar] [CrossRef]
- Zhao, T.; Liu, Q.L.; Zhao, Z.Y. High-throughput screening delafossite CuMO2 (M = IIIA, 3d, 4d, 5d, and RE) optoelectronic functional materials based on first-principles calculations. J. Phys. Chem. C 2019, 123, 14292–14302. [Google Scholar] [CrossRef]
- Tsuboi, N.; Ohara, H.; Hoshino, T.; Kobayashi, S.; Kato, K.; Kaneko, F. Luminescence properties of delafossite-type CuYO2 doped with calcium, oxygen or rare earth Tb. Jpn. J. Appl. Phys. 2005, 44, 765. [Google Scholar] [CrossRef]
- Siedliska, K.; Pikula, T.; Oleszak, D.; Jartych, E. Structure and Hyperfine Interactions of Mechanically Activated Delafossite CuFeO2. Acta Phys. Pol. A 2018, 133, 372–375. [Google Scholar] [CrossRef]
- Daou, R.; Frésard, R.; Eyert, V.; Hébert, S.; Maignan, A. Unconventional aspects of electronic transport in delafossite oxides. Sci. Technol. Adv. Mater. 2017, 18, 919–938. [Google Scholar] [CrossRef] [PubMed]
- Okuda, T.; Jufuku, N.; Hidaka, S.; Terada, N. Magnetic, transport, and thermoelectric properties of the delafossite oxides CuCr1−xMgxO2 (0 ≤ x ≤ 0.04). Phys. Rev. B 2005, 72, 144403. [Google Scholar] [CrossRef]
- Van Hoang, D.; Pham, A.T.T.; Ta, H.K.T.; Nguyen, T.H.; Pham, N.K.; Hoa, L.T.; Tran, V.C.; Michitaka, O.; Tran, Q.M.N.; Park, J.-H.; et al. Effects of multi-scale defects on the thermoelectric properties of delafossite CuCr1−xMgxO2 materials. J. Alloys Compd. 2020, 844, 156119. [Google Scholar] [CrossRef]
- Feng, Y.; Elquist, A.; Zhang, Y.; Gao, K.; Ferguson, I.; Tzempelikos, A.; Lu, N. Temperature dependent thermoelectric properties of cuprous delafossite oxides. Compos. Part B Eng. 2019, 156, 108–112. [Google Scholar] [CrossRef]
- Van Hoang, D.; Le, T.A.K.; Pham, A.T.T.; Ta, H.K.T.; Pham, N.K.; Nguyen, T.H.; Lai, H.T.; Truong, D.C.; Van Le, N.; Huynh, C.T.; et al. The roles of interstitial oxygen and phase compositions on the thermoelectric properties CuCr0.85Mg0.15O2 delafossite material. J. Alloys Compd. 2021, 867, 158995. [Google Scholar] [CrossRef]
- Ruttanapun, C.; Wichainchai, A.; Prachamon, W.; Yangthaisong, A.; Charoenphakdee, A.; Seetawan, T. Thermoelectric properties of Cu1−xPtxFeO2 (0.0 ≤ x ≤ 0.05) delafossite-type transition oxide. J. Alloys Compd. 2011, 509, 4588–4594. [Google Scholar] [CrossRef]
- Sinnarasa, I.; Thimont, Y.; Presmanes, L.; Bonningue, C.; Barnabé, A.; Tailhades, P. Influence of thickness and microstructure on thermoelectric properties of Mg-doped CuCrO2 delafossite thin films deposited by RF-magnetron sputtering. Appl. Surf. Sci. 2018, 455, 244–250. [Google Scholar] [CrossRef]
- Liu, Q.-L.; Zhao, Z.-Y.; Zhao, R.-D.; Yi, J.-H. Fundamental properties of delafossite CuFeO2 as photocatalyst for solar energy conversion. J. Alloys Compd. 2018, 819, 153032. [Google Scholar] [CrossRef]
- Liu, Q.L.; Zhao, Z.Y.; Yi, J.H. Excess oxygen in delafossite CuFeO2+ δ: Synthesis, characterization, and applications in solar energy conversion. Chem. Eng. J. 2020, 396, 125290. [Google Scholar] [CrossRef]
- Dong, X.-D.; Zhao, Z.-Y. Boosting and regulating solar energy conversion performance of delafossite AgFeO2 by spin polarization. J. Mater. Chem. A 2022, 10, 4800–4816. [Google Scholar] [CrossRef]
- Zhao, R.-D.; Zhang, Y.-M.; Liu, Q.-L.; Zhao, Z.-Y. Effects of the Preparation Process on the Photocatalytic Performance of Delafossite CuCrO2. Inorg. Chem. 2020, 59, 16679–16689. [Google Scholar] [CrossRef] [PubMed]
- Zhao, Q.M.; Zhao, Z.Y.; Liu, Q.L.; Yao, G.Y.; Dong, X.D. Delafossite CuGaO2 as promising visible-light-driven photocatalyst: Synthesize, properties, and performances. J. Phys. D Appl. Phys. 2020, 53, 135102. [Google Scholar] [CrossRef]
- Ahmed, J.; Mao, Y. Synthesis, characterization and electrocatalytic properties of delafossite CuGaO2. J. Solid State Chem. 2016, 242, 77–85. [Google Scholar] [CrossRef]
- Xu, Q.; Li, R.; Wang, C.; Yuan, D. Visible-light photocatalytic reduction of Cr (VI) using nano-sized delafossite (CuFeO2) synthesized by hydrothermal method. J. Alloys Compd. 2017, 723, 441–447. [Google Scholar] [CrossRef]
- Díaz-García, A.K.; Lana-Villarreal, T.; Gómez, R. Sol–gel copper chromium delafossite thin films as stable oxide photocathodes for water splitting. J. Mater. Chem. A 2015, 3, 19683–19687. [Google Scholar] [CrossRef]
- Jang, Y.J.; Lee, J.S. Photoelectrochemical Water Splitting with p-Type Metal Oxide Semiconductor Photocathodes. Chemsuschem 2019, 12, 1835–1845. [Google Scholar] [CrossRef] [PubMed]
- Jang, Y.J.; Bin Park, Y.; Kim, H.E.; Choi, Y.H.; Choi, S.H.; Lee, J.S. Oxygen-Intercalated CuFeO2 Photocathode Fabricated by Hybrid Microwave Annealing for Efficient Solar Hydrogen Production. Chem. Mater. 2016, 28, 6054–6061. [Google Scholar] [CrossRef]
- Prévot, M.S.; Li, Y.; Guijarro, N.; Sivula, K. Improving charge collection with delafossite photocathodes: A host–guest CuAlO2/CuFeO2 approach. J. Mater. Chem. A 2016, 4, 3018–3026. [Google Scholar] [CrossRef]
- Li, C.; He, J.; Xiao, Y.; Li, Y.; Delaunay, J.J. Earth-abundant Cu-based metal oxide photocathodes for photoelectrochemical water splitting. Energy Environ. Sci. 2020, 13, 3269–3306. [Google Scholar] [CrossRef]
- Garcia-Torregrosa, I.; Geertzema, Y.G.; Ismail, A.S.M.; Lee, T.; Groot, F.M.F.; Weckhuysen, B.M. Facile Two-Step Synthesis of Delafossite CuFeO2 Photocathodes by Ultrasonic Spray Pyrolysis and Hybrid Microwave Annealing. Chemphotochem 2019, 3, 1238–1245. [Google Scholar] [CrossRef]
- Deng, Z.; Meng, G.; Fang, X.; Dong, W.; Shao, J.; Wang, S.; Tong, B. A novel ammonia gas sensors based on p-type delafossite AgAlO2. J. Alloys Compd. 2019, 777, 52–58. [Google Scholar] [CrossRef]
- Tong, B.; Deng, Z.; Xu, B.; Meng, G.; Shao, J.; Liu, H.; Dai, T.; Shan, X.; Dong, W.; Wang, S.; et al. Oxygen Vacancy Defects Boosted High Performance p-Type Delafossite CuCrO2 Gas Sensors. ACS Appl. Mater. Interfaces 2018, 10, 34727–34734. [Google Scholar] [CrossRef] [PubMed]
- Upadhyay, D.; Roondhe, B.; Pratap, A.; Jha, P.K. Two-dimensional delafossite cobalt oxyhydroxide as a toxic gas sensor. Appl. Surf. Sci. 2019, 476, 198–204. [Google Scholar] [CrossRef]
- Liu, H.; Cao, X.; Wu, H.; Li, B.; Li, Y.; Zhu, W.; Yang, Z.; Huang, Y. Innovative development on a p-type delafossite CuCrO2 nanoparticles based triethylamine sensor. Sens. Actuators B Chem. 2020, 324, 128743. [Google Scholar] [CrossRef]
- Patzsch, J.; Balog, I.; Krauß, P.; Lehmann, C.W.; Schneider, J.J. Synthesis, characterization and p–n type gas sensing behaviour of CuFeO2 delafossite type inorganic wires using Fe and Cu complexes as single source molecular precursors. RSC Adv. 2014, 4, 15348–15355. [Google Scholar] [CrossRef]
- Beatriceveena, T.; Murthy, A.S.R.; Prabhu, E.; Gnanasekar, K. Wide range hydrogen sensing behavior of a silver delafossite: Performance towards long term stability, repeatability and selectivity. Int. J. Hydrog. Energy 2021, 46, 2824–2834. [Google Scholar] [CrossRef]
- Kong, L.; Xu, S.; Liu, H.; Wu, X.; Tu, X.; Bo, M.; Zhu, W. Hybridized Ag-CuCrO2 Nanostructured Composites for Enhanced Gas Sensing. ACS Appl. Nano Mater. 2022, 5, 12690–12698. [Google Scholar] [CrossRef]
- Liu, H.; Zhao, T.; Kong, L.; Cao, X.; Zhu, W.; Huang, Y.; Bo, M. Twinning enhanced electrical conductivity and surface activity of nanostructured CuCrO2 gas sensor. Sens. Actuators B Chem. 2021, 338, 129845. [Google Scholar] [CrossRef]
- Du, Z.; Xiong, D.; Verma, S.K.; Liu, B.; Zhao, X.; Liu, L.; Li, H. A low temperature hydrothermal synthesis of delafossite CuCoO2 as an efficient electrocatalyst for the oxygen evolution reaction in alkaline solutions. Inorg. Chem. Front. 2018, 5, 183–188. [Google Scholar] [CrossRef]
- Kurita, K.; Yagisawa, M.; Okazaki, R. Electrical resistivity and thermopower of hole-doped delafossite CuCoO2 polycrystals. Jpn. J. Appl. Phys. 2021, 60, 013001. [Google Scholar] [CrossRef]
- Bouakaz, H.; Abbas, M.; Brahimi, R.; Trari, M. Physical properties of the delafossite CuCoO2 synthesized by co-precipitation/hydrothermal route. Mater. Sci. Semicond. Process. 2021, 136, 106132. [Google Scholar] [CrossRef]
- Zhang, Y.M.; Zhao, Z.Y.; Zhao, Y.K.; Wang, C.X. One-pot synthesis of delafossite CuCoO2 microcrystal as visible-light-driven photocatalyst. J. Mater. Sci. 2022, 57, 18687–18710. [Google Scholar] [CrossRef]
- Xiong, D.; Du, Z.; Li, H.; Xu, J.; Li, J.; Zhao, X.; Liu, L. Polyvinylpyrrolidone-Assisted Hydrothermal Synthesis of CuCoO2 Nanoplates with Enhanced Oxygen Evolution Reaction Performance. ACS Sustain. Chem. Eng. 2018, 7, 1493–1501. [Google Scholar] [CrossRef]
- Gao, H.; Yang, M.; Du, Z.; Liu, X.; Dai, X.; Lin, K.; Bao, X.-Q.; Li, H.; Xiong, D. Metal–organic framework derived bimetal oxide CuCoO2 as efficient electrocatalyst for the oxygen evolution reaction. Dalton Trans. 2022, 51, 5997–6006. [Google Scholar] [CrossRef]
- Gao, H.; Liu, X.; Han, N.; Shi, L.; Wang, L.; Mi, Y.; Bao, X.-Q.; Bai, J.; Li, H.; Xiong, D. Nanocrystals of CuCoO2 derived from MOFs and their catalytic performance for the oxygen evolution reaction. Dalton Trans. 2022, 51, 11536–11546. [Google Scholar] [CrossRef] [PubMed]
- Du, Z.; Qian, J.; Bai, J.; Li, H.; Wang, M.; Zhao, X.; Xiong, D. Surfactant-Modified Hydrothermal Synthesis of Ca-Doped CuCoO2 Nanosheets with Abundant Active Sites for Enhanced Electrocatalytic Oxygen Evolution. Inorg. Chem. 2020, 59, 9889–9899. [Google Scholar] [CrossRef]
- Yang, M.; Han, N.; Shi, L.; Gao, H.; Liu, X.; Mi, Y.; Zeng, X.; Bai, J.; Xiong, D. Effect of nickel doping on the structure, morphology and oxygen evolution reaction performance of Cu-BTC derived CuCoO2. Dalton Trans. 2022, 51, 8757–8765. [Google Scholar] [CrossRef]
- Beekman, M.; Salvador, J.; Shi, X.; Nolas, G.; Yang, J. Characterization of delafossite-type CuCoO2 prepared by ion exchange. J. Alloys Compd. 2010, 489, 336–338. [Google Scholar] [CrossRef]
- Toyoda, K.; Hinogami, R.; Miyata, N.; Aizawa, M. Calculated Descriptors of Catalytic Activity for Water Electrolysis Anode: Application to Delafossite Oxides. J. Phys. Chem. C 2015, 119, 6495–6501. [Google Scholar] [CrossRef]
- Miyata, N.; Toyoda, K.; Hinogami, R.; Katayama, M.; Inada, Y.; Ohta, T. Spin states investigation of delafossite oxides by means of X-ray absorption and photoemission spectroscopy. J. Solid State Chem. 2019, 275, 83–87. [Google Scholar] [CrossRef]
- Upadhyay, D.K. Investigation of Structural, Electronic, Magnetic and Dynamical Properties of Transition Metal Doped Delafossite-Type Oxides. Ph.D. Thesis, Maharaja Sayajirao University of Baroda, Baroda, India, 2021. [Google Scholar]
- Burlet, C.; Goethals, H.; Vanbrabant, Y. Delafossite structure of heterogenite polytypes (HCoO2) by Raman and infrared micro-spectroscopy. Spectrochim. Acta Part A Mol. Biomol. Spectrosc. 2016, 159, 90–97. [Google Scholar] [CrossRef]
- Du, Z.; Xiong, D.; Qian, J.; Zhang, T.; Bai, J.; Fang, D.; Li, H. Investigation of the structural, optical and electrical properties of Ca2+ doped CuCoO2 nanosheets. Dalton Trans. 2019, 48, 13753–13759. [Google Scholar] [CrossRef] [PubMed]
- Isacfranklin, M.; Yuvakkumar, R.; Ravi, G.; Pannipara, M.; Al-Sehemi, A.G.; Velauthapillai, D. CuCoO2 electrodes for supercapacitor applications. Mater. Lett. 2021, 296, 129930. [Google Scholar] [CrossRef]
- Feng, Y.; Liao, J.; Chen, X.; Liao, Q.; Wang, H.; Ji, S.; Pollet, B.G.; Li, H.; He, M. Co3O4–CuCoO2 hybrid nanoplates as a low-cost and highly active catalyst for producing hydrogen from ammonia borane. New J. Chem. 2021, 45, 2688–2695. [Google Scholar] [CrossRef]
- Du, Z.; Qian, J.; Zhang, T.; Ji, C.; Wu, J.; Li, H.; Xiong, D. Solvothermal synthesis of CuCoO2 nanoplates using zeolitic imidazolate framework-67 (ZIF-67) as a co-derived precursor. New J. Chem. 2019, 43, 15233–15239. [Google Scholar] [CrossRef]
- Ding, J.; Li, L.; Zheng, H.; Zuo, Y.; Wang, X.; Li, H.; Chen, S.; Zhang, D.; Xu, X.; Li, G. Co3O4–CuCoO2 nanomesh: An interface-enhanced substrate that simultaneously promotes CO adsorption and O2 activation in H2 purification. ACS Appl. Mater. Interfaces 2019, 11, 6042–6053. [Google Scholar] [CrossRef]
- Zhong, X.; He, H.; Du, J.; Ren, Q.; Huang, J.; Tang, Y.; Wang, J.; Yang, L.; Dong, F.; Bian, L.; et al. Boosting solar water oxidation activity and stability of BiVO4 photoanode through the Co-catalytic effect of CuCoO2. Electrochim. Acta 2019, 304, 301–311. [Google Scholar] [CrossRef]
- Dursun, S.; Akyıldız, H.; Kalem, V. Production of CuCoO2 nanoparticle/SnO2 nanofiber heterostructures for visible light photocatalytic applications. J. Photochem. Photobiol. A Chem. 2023, 434, 114233. [Google Scholar] [CrossRef]
- Xing, W.; Kong, L.; Zhang, X.; Zhang, Y.; Tu, X.; Yu, J.; Yang, J.; Zhou, C.; Zhu, W.; Huang, J. Enhanced Methanol Electrooxidation Performance Based on Pt Cluster-Decorated CuCoO2 on Carbon. ChemistrySelect 2022, 7, e202200513. [Google Scholar] [CrossRef]
- Mariappan, K.; Chen, S.-M.; Chen, T.-W.; Tseng, T.-W.; Bian, Y.; Sun, T.-T.; Jiang, J.; Yu, J. Fabrication of Hexagonal CuCoO2 Modified Screen-Printed Carbon Electrode for the Selective Electrochemical Detection of Furaltadone. Int. J. Electrochem. Sci. 2022, 17, 220644. [Google Scholar] [CrossRef]
- Ruttanapun, C.; Sa-Nguan-Cheep, M.; Kahatta, S.; Buranasiri, P.; Jindajitawat, P. Optical and electronic transport properties of p-type CuCoO2 transparent conductive oxide. In Proceedings of the ICPS 2013: International Conference on Photonics Solutions, Pattaya City, Thailand, 26–28 May 2013; SPIE: Bellingham, DC, USA, 2013; Volume 8883, pp. 319–325. [Google Scholar]
- Makuła, P.; Pacia, M.; Macyk, W. How To Correctly Determine the Band Gap Energy of Modified Semiconductor Photocatalysts Based on UV–Vis Spectra. J. Phys. Chem. Lett. 2018, 9, 6814–6817. [Google Scholar] [CrossRef]
- Müller, F.; Ferreira, C.A.; Franco, L.; Puiggalí, J.; Alemán, C.; Armelin, E. New Sulfonated Polystyrene and Styrene–Ethylene/Butylene–Styrene Block Copolymers for Applications in Electrodialysis. J. Phys. Chem. B 2012, 116, 11767–11779. [Google Scholar] [CrossRef] [PubMed]
- Soboleva, T.; Xie, Z.; Shi, Z.; Tsang, E.; Navessin, T.; Holdcroft, S. Investigation of the through-plane impedance technique for evaluation of anisotropy of proton conducting polymer membranes. J. Electroanal. Chem. 2008, 622, 145–152. [Google Scholar] [CrossRef]
- Blachot, J.F.; Diat, O.; Putaux, J.-L.; Rollet, A.-L.; Rubatat, L.; Vallois, C.; Müller, M.; Gebel, G. Anisotropy of structure and transport properties in sulfonated polyimide membranes. J. Membr. Sci. 2003, 214, 31–42. [Google Scholar] [CrossRef]
- Zawodzinski, T.A.; Derouin, C.; Radzinski, S.; Sherman, R.J.; Smith, V.T.; Springer, T.E.; Gottesfeld, S. Water Uptake by and Transport Through Nafion® 117 Membranes. J. Electrochem. Soc. 1993, 140, 1041–1047. [Google Scholar] [CrossRef]
- Escorihuela, J.; Narducci, R.; Compañ, V.; Costantino, F. Proton Conductivity of Composite Polyelectrolyte Membranes with Metal-Organic Frameworks for Fuel Cell Applications. Adv. Mater. Interfaces 2019, 6, 1801146. [Google Scholar] [CrossRef]
- Sacco, A. Electrochemical impedance spectroscopy: Fundamentals and application in dye-sensitized solar cells. Renew. Sustain. Energy Rev. 2017, 79, 814–829. [Google Scholar] [CrossRef]
- Barsoukov, J.R.E. Macdonald, Impedance Spectroscopy: Theory, Experiment, and Applications; John Wiley & Sons, Inc.: Hoboken, NJ, USA, 2005. [Google Scholar]
- Jun, Y.S.; Um, J.G.; Jiang, G.; Lui, G.; Yu, A. Ultra-large sized graphene nano-platelets (GnPs) incorporated polypropylene (PP)/GnPs composites engineered by melt compounding and its thermal, mechanical, and electrical properties. Compos. Part B Eng. 2018, 133, 218–225. [Google Scholar] [CrossRef]
- Vega-Moreno, J.; Lemus-Santana, A.A.; Reguera, E.; Andrio, A.; Compañ, V. High proton conductivity at low and moderate temperature in a simple family of Prussian blue analogs, divalent transition metal hexacyanocobaltates (III). Electrochim. Acta 2020, 360, 136959. [Google Scholar] [CrossRef]
- Del Castillo, R.M.; del Castillo, L.F.; Alipio, G. Calles and Vicente Compañ Experimental and computational conductivity study of multilayer graphene in polypropylene nanocomposites. J. Mater. Chem. C 2018, 6, 7232. [Google Scholar] [CrossRef]
- Sarjanović, J.; Stojić, M.; Rubčić, M.; Pavić, L.; Pisk, J. Impedance Spectroscopy as a Powerful Tool for Researching Molybdenum-Based Materials with Schiff Base Hydrazones. Materials 2023, 16, 1064. [Google Scholar] [CrossRef]
- Lin, P.; Sun, X.-M. A Universal Interpretation of Three Types of Resonator-Based Controllers. IEEE Trans. Circuits Syst. II Express Briefs 2023, 70, 2555–2559. [Google Scholar] [CrossRef]
- Dong, J.; Gong, C.; Bao, J.; Zhu, L.; Chen, H.; Wang, Z. Power Synchronization Compensation Strategy Based on Second-Order Compensation Links for Voltage-Controlled Inverters in Microgrids. J. Mod. Power Syst. Clean Energy 2023. Online first articles. [Google Scholar]
- García-Bernabé, A.; Rivera, A.; Granados, A.; Luis, S.V.; Compañ, V. Ionic transport on composite polymers containing covalently attached and absorbed ionic liquid fragments. Electrochim. Acta 2016, 213, 887–897. [Google Scholar] [CrossRef]
- Andrio, A.; Hernández, S.I.; García-Alcántara, C.; del Castillo, L.F.; Compañ, V.; Santamaría-Holek, I. Temperature dependence of anomalous protonic and superprotonic transport properties in mixed salts based on CsH2PO4. Phys. Chem. Chem. Phys. 2019, 21, 12948. [Google Scholar] [CrossRef]
- Fuentes, I.; Mostazo-López, M.J.; Kelemen, Z.; Compañ, V.; Andrio, A.; Morallón, E.; Cazorla-Amorós, D.; Viñas, C.; Teixidor, F. Are the Accompanying Cations of Doping Anions Influential in Conducting Organic Polymers? The Case of the Popular PEDOT. Chem. Eur. J. 2019, 25, 14308–14319. [Google Scholar] [CrossRef] [PubMed]
- Prokhorov, Y.; Luna-Barcenas, G.; Kovalenko, Y. Interphase percolation phenomena in chitosan-graphene oxide nanocomposites, the role of water content. Express Polym. Lett. 2023, 17, 29–39. [Google Scholar] [CrossRef]
- Chfii, H.; Bouich, A.; Soucase, B.M.; Abdlefdil, M. A new approach for growing high-quality delafossite CuCoO2 films by spray pyrolysis through the optimization of the Cu/Co ratio. Opt. Mater. 2023, 135, 113229. [Google Scholar] [CrossRef]
- Saber, S.; Marí, B.; Andrio, A.; Escorihuela, J.; Khattab, N.; Eid, A.; Nahrawy, A.; Aly, M.A.; Compañ, V. Structural and Electrochemical Analysis of CIGS: Cr Crystalline Nanopowders and Thin Films Deposited onto ITO Substrates. Nanomaterials 2021, 11, 1093. [Google Scholar] [CrossRef]
- Jonscher, A.K. The ‘universal’ dielectric response. Nature 1977, 267, 673. [Google Scholar] [CrossRef]
- Galindo, B.; Benedito, A.; Gimenez, E.; Compañ, V. Comparative study between the microwave heating efficiency of carbon nanotubes versus multilayer graphene in polypropylene nanocomposites. Compos. Part B Eng. 2016, 98, 330–338. [Google Scholar] [CrossRef]
- Valverde, D.; Garcia-Bernabé, A.; Andrio, A.; García-Verdugo, E.; Luis, S.V.; Compañ, V. Free ion diffusivity and charge concentration on cross-linked polymeric ionic liquid iongel films based on sulfonated zwitterionic salts and lithium ions. Phys. Chem. Chem. Phys. 2019, 21, 17923–17932. [Google Scholar] [CrossRef]
- Sidebottom, D.L. Dimensionality Dependence of the Conductivity Dispersion in Ionic Materials. Phys. Rev. Lett. 1999, 83, 983–986. [Google Scholar] [CrossRef]
- Banerjee, P.; Pal, P.; Ghosh, A.; Mandal, T.K. Ion transport and relaxation in phosphonium poly(ionic liquid) homo- and co-polymers. J. Polym. Sci. 2021, 59, 1556–1570. [Google Scholar] [CrossRef]
- Bouich, A.; Torres, J.C.; Chfii, H.; Marí-Guaita, J.; Khattak, Y.H.; Baig, F.; Soucase, B.M.; Palacios, P. Delafossite as hole transport layer a new pathway for efficient perovskite-based solar cells: Insight from experimental, DFT and numerical analysis. Sol. Energy 2023, 250, 18–32. [Google Scholar] [CrossRef]
- Gilbert, T.L. Hohenberg-Kohn theorem for nonlocal external potentials. Phys. Rev. B 1975, 12, 2111–2120. [Google Scholar] [CrossRef]
- Seidl, A.; Görling, A.; Vogl, P.; Majewski, J.A.; Levy, M. Generalized Kohn-Sham schemes and the band-gap problem. Phys. Rev. B 1996, 53, 3764–3774. [Google Scholar] [CrossRef] [PubMed]
- Blöchl, P.E. Projector augmented-wave method. Phys. Rev. B 1994, 50, 17953–17979. [Google Scholar] [CrossRef] [PubMed]
- Krukau, A.V.; Vydrov, O.A.; Izmaylov, A.F.; Scuseria, G.E. Influence of the Exchange Screening Parameter on the Performance of Screened Hybrid Functionals. J. Chem. Phys. 2006, 125, 224106. [Google Scholar] [CrossRef] [PubMed]
- Heyd, J.; Scuseria, G.E.; Ernzerhof, M. Hybrid functionals based on a screened Coulomb potential. J. Chem. Phys. 2003, 118, 8207–8215. [Google Scholar] [CrossRef]
- Heyd, J.; Scuseria, G.E. Assessment and validation of a screened Coulomb hybrid density functional. J. Chem. Phys. 2004, 120, 7274–7280. [Google Scholar] [CrossRef]
- Kresse, G.; Hafner, J. Ab Initio Molecular Dynamics for Open-shell Transition Metals. Phys. Rev. B 1993, 48, 13115–13118. [Google Scholar] [CrossRef]
- Kresse, G.; Furthmüller, J. Efficient Iterative Schemes for Ab Initio Total-Energy Calculations Using a Plane-Wave Basis Set. Phys. Rev. B 1996, 54, 11169–11186. [Google Scholar] [CrossRef] [PubMed]
- Kresse, G.; Joubert, D. From ultrasoft pseudopotentials to the projector augmented-wave method. Phys. Rev. B 1999, 59, 1758–1775. [Google Scholar] [CrossRef]
- Monkhorst, H.J.; Pack, J.D. Special points for Brillouin-zone integrations. Phys. Rev. B 1976, 13, 5188–5192. [Google Scholar] [CrossRef]
- Chfii, H.; Bouich, A.; Soucase, B.M.; Abd-Lefdil, M. Structural and physical properties of Mg-doped CuCoO2 delafossite thin films. Mater. Chem. Phys. 2023, 306, 128006. [Google Scholar] [CrossRef]
- Bouich, A.; Torres, J.C.; Khattak, Y.H.; Baig, F.; Marí-Guaita, J.; Soucase, B.M.; Mendez-Blas, A.; Palacios, P. Bright Future by Controlling α/δ Phase Junction of Formamidinium Lead Iodide Doped by Imidazolium for Solar Cells: Insight from Experimental, DFT Calculations and SCAPS Simulation. Surf. Interfaces 2023, 40, 103159. [Google Scholar] [CrossRef]
- Bouich, A.; Marí-Guaita, J.; Soucase, B.M.; Palacios, P. Bright future by enhancing the stability of methylammonium lead triiodide perovskites thin films through Rb, Cs and Li as dopants. Mater. Res. Bull. 2023, 163, 112213. [Google Scholar] [CrossRef]
- Doumbia, Y.; Bouich, A.; Soucase, B.M.; Soro, D. Towards Stable Free Lead Mixed Halide Perovskite Thin Films on FTO-Coated Glass Substrate. JOM 2023, 1–6. [Google Scholar] [CrossRef]
- Brik, M.; Srivastava, A.; Popov, A. A few common misconceptions in the interpretation of experimental spectroscopic data. Opt. Mater. 2022, 127, 112276. [Google Scholar] [CrossRef]


| Samples | Thickness (nm) | Sheet Resistivity (ρs) ×10−3 (Ω·cm) | Sheet Resistance (Rs) (Ω) | Sheet Conductivity ×103 (S·cm−1) |
|---|---|---|---|---|
| CuCoO2_H | 140 ± 5 | 0.114 ±0.002 | 8.16 ± 0.05 | 8.8 ± 0.2 |
| CuCoO2_SG | 136 ± 5 | 0.105 ± 0.002 | 7.70 ± 0.04 | 9.5 ± 0.2 |
| CuCoO2_SSR | 142 ± 5 | 0.116 ± 0.002 | 8.16 ± 0.04 | 8.6 ± 0.2 |
Disclaimer/Publisher’s Note: The statements, opinions and data contained in all publications are solely those of the individual author(s) and contributor(s) and not of MDPI and/or the editor(s). MDPI and/or the editor(s) disclaim responsibility for any injury to people or property resulting from any ideas, methods, instructions or products referred to in the content. |
© 2023 by the authors. Licensee MDPI, Basel, Switzerland. This article is an open access article distributed under the terms and conditions of the Creative Commons Attribution (CC BY) license (https://creativecommons.org/licenses/by/4.0/).
Share and Cite
Chfii, H.; Bouich, A.; Andrio, A.; Torres, J.C.; Soucase, B.M.; Palacios, P.; Lefdil, M.A.; Compañ, V. The Structural and Electrochemical Properties of CuCoO2 Crystalline Nanopowders and Thin Films: Conductivity Experimental Analysis and Insights from Density Functional Theory Calculations. Nanomaterials 2023, 13, 2312. https://doi.org/10.3390/nano13162312
Chfii H, Bouich A, Andrio A, Torres JC, Soucase BM, Palacios P, Lefdil MA, Compañ V. The Structural and Electrochemical Properties of CuCoO2 Crystalline Nanopowders and Thin Films: Conductivity Experimental Analysis and Insights from Density Functional Theory Calculations. Nanomaterials. 2023; 13(16):2312. https://doi.org/10.3390/nano13162312
Chicago/Turabian StyleChfii, Hasnae, Amal Bouich, Andreu Andrio, Joeluis Cerutti Torres, Bernabé Mari Soucase, Pablo Palacios, Mohammed Abd Lefdil, and Vicente Compañ. 2023. "The Structural and Electrochemical Properties of CuCoO2 Crystalline Nanopowders and Thin Films: Conductivity Experimental Analysis and Insights from Density Functional Theory Calculations" Nanomaterials 13, no. 16: 2312. https://doi.org/10.3390/nano13162312
APA StyleChfii, H., Bouich, A., Andrio, A., Torres, J. C., Soucase, B. M., Palacios, P., Lefdil, M. A., & Compañ, V. (2023). The Structural and Electrochemical Properties of CuCoO2 Crystalline Nanopowders and Thin Films: Conductivity Experimental Analysis and Insights from Density Functional Theory Calculations. Nanomaterials, 13(16), 2312. https://doi.org/10.3390/nano13162312