Article

Quantitative In Situ Monitoring of Cu-Atom Release by Cu2O Nanocatalysts under Photocatalytic CO2 Reduction Conditions: New Insights into the Photocorrosion Mechanism

by
Areti Zindrou
and
Yiannis Deligiannakis
*
Laboratory of Physical Chemistry of Materials & Environment, Department of Physics, University of Ioannina, 45110 Ioannina, Greece
*
Author to whom correspondence should be addressed.
Nanomaterials 2023, 13(11), 1773; https://doi.org/10.3390/nano13111773
Submission received: 1 May 2023 / Revised: 18 May 2023 / Accepted: 29 May 2023 / Published: 31 May 2023

Abstract

:
Cu2O is among the most promising photocatalysts for CO2 reduction, however its photocorrosion remains a standalone challenge. Herein, we present an in situ study of the release of Cu ions from Cu2O nanocatalysts under photocatalytic conditions in the presence of HCO3 as a catalytic substrate in H2O. The Cu-oxide nanomaterials were produced by Flame Spray Pyrolysis (FSP) technology. Using Electron Paramagnetic Resonance (EPR) spectroscopy in tandem with analytical Anodic Stripping Voltammetry (ASV), we monitored in situ the Cu2+ atom release from the Cu2O nanoparticles in comparison with CuO nanoparticles under photocatalytic conditions. Our quantitative, kinetic data show that light has detrimental effect on the photocorrosion of Cu2O and ensuing Cu2+ ion release in the H2O solution, up to 15.7% of its mass. EPR reveals that HCO3 acts as a ligand of the Cu2+ ions, promoting the liberation of {HCO3-Cu} complexes in solution from Cu2O, up to 27% of its mass. HCO3 alone exerted a marginal effect. XRD data show that under prolonged irradiation, part of Cu2+ ions can reprecipitate on the Cu2O surface, creating a passivating CuO layer that stabilizes the Cu2O from further photocorrosion. Including isopropanol as a hole scavenger has a drastic effect on the photocorrosion of Cu2O nanoparticles and suppresses the release of Cu2+ ions to the solution. Methodwise, the present data exemplify that EPR and ASV can be useful tools to help quantitatively understand the solid–solution interface photocorrosion phenomena for Cu2O.

1. Introduction

The rapid development of human society has led to an increase in energy demands and ensuing environmental deterioration, making the use of new and renewable energy sources imperative. Photocatalysts have become a research hotspot over the last decades. The pioneer work of Fujishima and Honda in 1972 [1] paved the way for light-induced water dissociation by TiO2 and has ignited numerous studies on photocatalysts, especially TiO2 [2,3]. Since then, research interest has increased exponentially, combined with the discovery of numerous photocatalysts ranging from metal oxides (e.g., ZnO [4], WO3 [5], and SnO2 [6]), non-oxides (e.g., CdS [7], CuInS2 [8] and ZnS [9]) and metal-free semiconductors (C3N4 [10]). Among them, Cu2O stands out as particularly interesting [11,12,13] thanks to its highly reducing conduction band edge located at ECB = −1000 mV vs. NHE (pH = 0) [12].
Cu2O is a promising photocatalyst for CO2 [14,15,16] reduction and H2 production [17,18], i.e., it has a direct band-gap structure with a small energy gap of 2.0–2.2 eV [12], allowing it to absorb efficiently in the visible range of the solar spectrum, maximizing sunlight harvesting. Despite these advantages, photostability issues are among the well-documented drawbacks of Cu2O [13,19,20]. The so-called photocorrosion phenomenon encodes the key problem, i.e., the photogenerated holes (h+) and electrons (e) can be adversely consumed to the self-decomposition of Cu2O itself [20]. At low degrees of photocorrosion, some Cu1+ atoms of Cu2O can be either oxidized to Cu2+ by the holes (self-photooxidation), or can be reduced to Cu0 atoms by the electrons (self-photoreduction) [20]. Both self-photooxidation and self-photoreduction are due to the energy positioning of the {Cu1+/Cu2+} {Cu1+/Cu0} redox couples within the band gap of Cu2O [21] i.e., E1/2{Cu1+/Cu2+} = 600 mV vs. NHE (pH = 0), E1/2{Cu1+/Cu0} = 470 mV vs. NHE (pH = 0) [12,13]. This phenomenon, even when it does not modify the Cu2O crystal structure much, limits the electron transfer from the Cu2O photocatalyst crystal to the surrounding acceptors or donors, which is detrimental to the photocatalytic activity [12,13,19]. It is well anticipated that when photocorrosion accumulates, physical detachment of Cu2+ ions can occur, resulting in severe destabilization of the Cu2O crystal as a whole. Toe et al. revealed that self-photooxidation is the dominant photocorrosion mechanism for Cu2O [19]. Practically, without the use of a hole scavenger and upon illumination, transformation of Cu2O to CuO occurs, with no evidence of Cu0 formation regardless of the presence of an electron scavenger. Moreover, in [19], XRD and SEM images confirm the growth of CuO on the surface of Cu2O.
In this context, the study of the photocorrosion effects of Cu2O under light plus CO2 is particularly appealing, i.e., since there is a thrust in the use of Cu2O as a CO2-reduction photocatalyst. To this end, most of the previous studies have mainly used photoelectrochemical tools to study the photocorrosion of Cu2O [22,23]. Complementary information on the fate of the Cu2O structure can be monitored with XRD [19], XPS [23] and Raman spectroscopy [24] to name a few methods. Herein, we introduce a methodology for in situ monitoring of the release of Cu2+ ions from Cu2O under photocatalytic CO2-reduction conditions. The method is based on in tandem use of a high analytical sensitivity method, Anodic Stripping Voltammetry (ASV) [25] and Electron Paramagnetic Resonance (EPR) spectroscopy [26]. EPR spectroscopy has been proven a valuable tool for the study of Cu2+ ions at the oxide–solution interface. Examples include monitoring of Cu2+ species in Spinel-Type Oxide Mg1–xCuxAl2O [27], Fe-doped copper oxide nanoparticles [28], Cu2+ on Al2O3 [29] and mononuclear Cu complexes immobilized on SiO2 [30]. We have demonstrated that EPR can provide detailed information on Cu2+ surface coordination, i.e., such as distances between neighboring Cu sites [30,31]. Thus, EPR can provide quantitative coordination information on the Cu2+ interaction with surfaces. Herein, we used EPR as a state-of-the-art tool to monitor in situ the formation of Cu2+ ions by Cu2O nanoparticles under photocorrosion scenarios/conditions. In addition, we used electroanalytical Anodic Stripping Voltammetry for precise analytical determination of Cu2+ ions released in solution [32]. Recently, we demonstrated that ASV can be used as a very sensitive analytical tool to detect trace levels (part-per-billion, ppb) of cadmium (Cd2+) ions released during the photocorrosion of CdS quantum dots [33]. Thus, herein, our methodology was based on the combined use of EPR and ASV to monitor the formation of Cu2+ ions at the Cu2O and their release in the reaction solution phase.
The Cu2O nanocatalysts used herein were synthesized using Flame Spray Pyrolysis (FSP) technology [34,35]. Previously, synthesis of CuO has been achieved by FSP by Waser et al. [36]. However, thus far, synthesis of high-purity Cu2O by FSP has not been achieved. Zhu et al. reported the successful existence of a Cu2O fraction in their CuO particles made by FSP synthesis [37]. Athanassiou et al. used a modified FSP reactor operating under highly reducing conditions to produce carbon-coated metallic copper nanoparticles [38]. Herein, in addition to Cu2O, we also synthesized CuO nanoparticles using Flame Spray Pyrolysis (FSP) as reference materials to study the Cu2+-release dynamics under the photocatalytic CO2-reduction process.
The specific aims of the present research were: [i] to monitor quantitatively the kinetics of Cu2+ ions release in solution, using EPR and ASV under photocorrosion conditions of Cu2O vs. CuO photocatalysts. [ii] To clarify the role of HCO3 as substrate. [iii] To understand the role of photoinduced holes in the observed photocorrosion process.

2. Materials and Methods

2.1. Flame Spray Pyrolysis (FSP) Synthesis of CuO and Cu2O Nanoparticles

A conventional FSP process was used for the synthesis of CuO, as described in detail in previous works [39,40,41]. A precursor solution of 0.25 M was prepared by dissolving Copper (II) Nitrate trihydrate (Cu(NO3)2• 3H2O 99–104%, Sigma-Aldrich (Saint Louis, MO, USA)) in a 1:1 (by volume) mixture of acetonitrile (≥99.9%, Supelco (Bellefonte, Pennsylvania, USA)) and ethylene glycol (≥99%, Supelco (Bellefonte, PA, USA)). This precursor solution (P) was fed at a rate of P = 5 mL min−1 to our system and atomized to fine droplets using an oxygen dispersion flow of D = 5 L min−1 at a pressure drop of 1.5 bar. The spray was ignited and sustained by an oxygen/methane pilot flame of O2/CH4: 4/2 L min−1. For the particle collection, an additional 10 L min−1 O2 sheath was used, and the produced particles were deposited on a glass microfiber filter (Hahnemühle GF 6 257) with the assistance of a vacuum pump (BUSCH V40).
The synthesis of high-purity Cu2O nanoparticles required a more-demanding FSP- setup with control of the combustion-atmosphere surrounding the spray nozzle (see Figure 1a). We used a cylindrical metal chamber consisting of two concentric tubes, a sinter metal tube (outer tube) and a porous metal tube (inner tube) to isolate the flame compartment from the surrounding atmosphere The porous walls of the inner tube allow the radial inflow of an inert mixing gas, in our case, N2, to exclude O2. Moreover, to provide an additional O2-excluding source and aid the particle collection, a 10 L min−1 N2 sheath was used. Once again, a 0.25 M precursor solution of Cu(NO3)2• 3H2O dissolved in a 1:1 mixture of acetonitrile and ethylene glycol was sprayed into our system with a P/D ratio of 3/3. A series of N2 radial inflows were tested in the range 0 to 30 L min−1, resulting in progressively higher Cu2O-phase percentages. In all cases, in addition to the radial N2, a N2 sheath gas was fixed at 10 L min−1, except in the case of pristine CuO, where we used a 10 L min−1 O2 sheath. The produced materials, listed in Table 1, are codenamed as Cu-xN, where x = the radial N2-inflow in L/min−1. In Table 1, we list the most pertinent materials with the Cu-20N to contain the higher Cu2O fraction (>95%). Higher radial N2 inflows resulted in the deterioration of particle crystallinity and are not discussed herein.

2.2. Characterization of Materials

Powder X-Ray Diffraction (pXRD): The as-prepared nanomaterials were characterized using a powder X-ray diffractometer (Bruker D8 Advanced using CuKα radiation = 1.5405 Å) with a scanning step of 0.03° at a rate of 2 s per step and 2-theta (θ) angle ranging from 10–80° at current 40 mA and voltage 40 kV. The average crystal size was calculated by using the Scherrer Equation (1) [42]:
d X R D = k λ β ( c o s θ )
where, dXRD is the crystallite size (nm), k is a shape constant (in this case 0.9), λ is the wavelength of CuKα radiation, β is the full width at half maximum and θ is the peak-diffraction angle. To determine the percentage of CuO/Cu2O crystal phase in each Cu-based nanomaterial, we used Profex, which is a graphical user interface for Rietveld refinement [43].

2.3. Electron Paramagnetic Resonance Spectroscopy (EPR)

EPR spectra were recorded at 77 K using a Bruker ER200D spectrometer equipped with an Agilent 5310 A frequency counter operating at X-band (~9.6 GHz) with a modulation amplitude of 10 G peak to peak. The spectrometer is controlled with a custom-made software based on LabView. To obtain an adequate signal-to-noise ratio, each spectrum is an average of 5–10 scans. Theoretical analysis of the Cu2+ EPR signals was performed using a spin Hamiltonian and can be simulated using EasySpin MATLAB toolbox [44] assuming a spin system with S = 1/2 and I = 3/2 for 63,65Cu2+.

2.4. Analytical Cu2+ Leaching Study by Anodic Stripping Voltammetry (ASV)

The concentration of Cu2+ in aqueous solution was determined by Anodic Stripping Voltammetry (ASV) using a Metrohm 797 VA computrace stand equipped with a Metrohm multimode electrode (MME). More specifically, a conventional three-electrode arrangement was used comprising Hanging Mercury Drop Electrode (HMDE) as the working electrode, Platinum rod (Pt) as the auxiliary electrode and Ag/AgCl (3 mol L−1 KCl) as the reference electrode. Cu standard solutions used for the quantification of our unknown samples were prepared by dissolving Cu(NO3)2• 3H2O in ultrapure triple-distilled (3d) water obtained from a Millipore-Q water purification system (USA) with a resistivity of >18 MΩ cm and diluting to obtain the desired Cu concentrations. The measurements were carried out at a volume of 10 mL of 0. 1 M KNO3 and 3 d water of pH:4 adjusted with HNO3 to ensure the maximum presence of Cu2+ ions based on the theoretical copper speciation for hydroxo complexes in pure water [45]. The instrumental settings were as follows: mercury drop size 0.4 mm and scan rate 20 mV s−1. Moreover, a deposition potential of −0.6 V versus Ag/AgCl (+0.2 V versus SHE at 25 °C) was used and the deposition time was carried out for 90 s. The reported data represent an average of three independent experimental repetitions.

3. Results

Figure 1a shows the FSP reactor set-up and photos of as-produced pure CuO and Cu2O powders on the FSP filter. The black color is typical for CuO, while the red-brown color of Cu2O originates from its band gap Eg = 2.0–2.2 eV [12]. Figure 1b shows the XRD patterns of Cu materials, also listed in Table 1. The characteristic peaks at 35.6°, 38.8° and 48.8° correspond to the planes (11-1), (111) and (20-2) of CuO (JCPDS card no. 48-1548) while the peaks at 29.6°, 36.4° and 42.3° are characteristic of the planes (110), (111) and (200) of Cu2O (JCPDS card no. 07-9767).
The XRD data in Figure 1 show that increasing N2 inflow, promoted the formation of Cu2O at the expense of the originally predominating CuO phase. The XRD-estimated particle diameters values (dXRD) of the CuO and Cu2O phases as well as their respective phase percentages are listed in Table 1. We see that Cu-20N is a Cu2O material with at least 95% and a minor fraction of CuO. Based on several trials, we conclude that a small percentage (2–5%) of CuO was formed upon exposure of the originally pure Cu2O to atmospheric O2 during the particle handling. Once formed, this CuO did not further increase. Thus, the Cu2O/CuO phase compositions listed in Table 1 represent stable compositions of FSP-made nanomaterials.
To underscore the Cu2O-formation process, we note that in FSP, the gas atmosphere where the particle formation takes place, is of key importance [34,46]. Under an oxygen-rich atmosphere, i.e., such as ambient air inflow with 20% O2, the produced materials are highly stable and fully oxidized ceramic powders [47]. In the present case of Cu oxide formation, this FSP protocol results in the formation of pristine CuO, see Figure 1. Decreasing the oxygen concentrations in the FSP reactor by the N2 sheath and mostly by the radial N2 inflow, see Figure 1a, resulted in the promotion of stable, reduced metal oxide (Cu2O) whose lattice is formed by Cu1+ ions. In our case, the use of N2 in our FSP reactor played a dual role: first, the exclusion of oxygen and second, the reduction of oxygen partial pressure inside the reactor, resulting in the progressive formation of Cu2O. We should note here that the formation of metallic Cu0 was not observed, which led us to conclude that this modified FSP setup allows meticulous exploration of the formation of suboxides rather than metallic particles.

3.1. Cu2+ Ion Release under CO2-Photoreduction Conditions

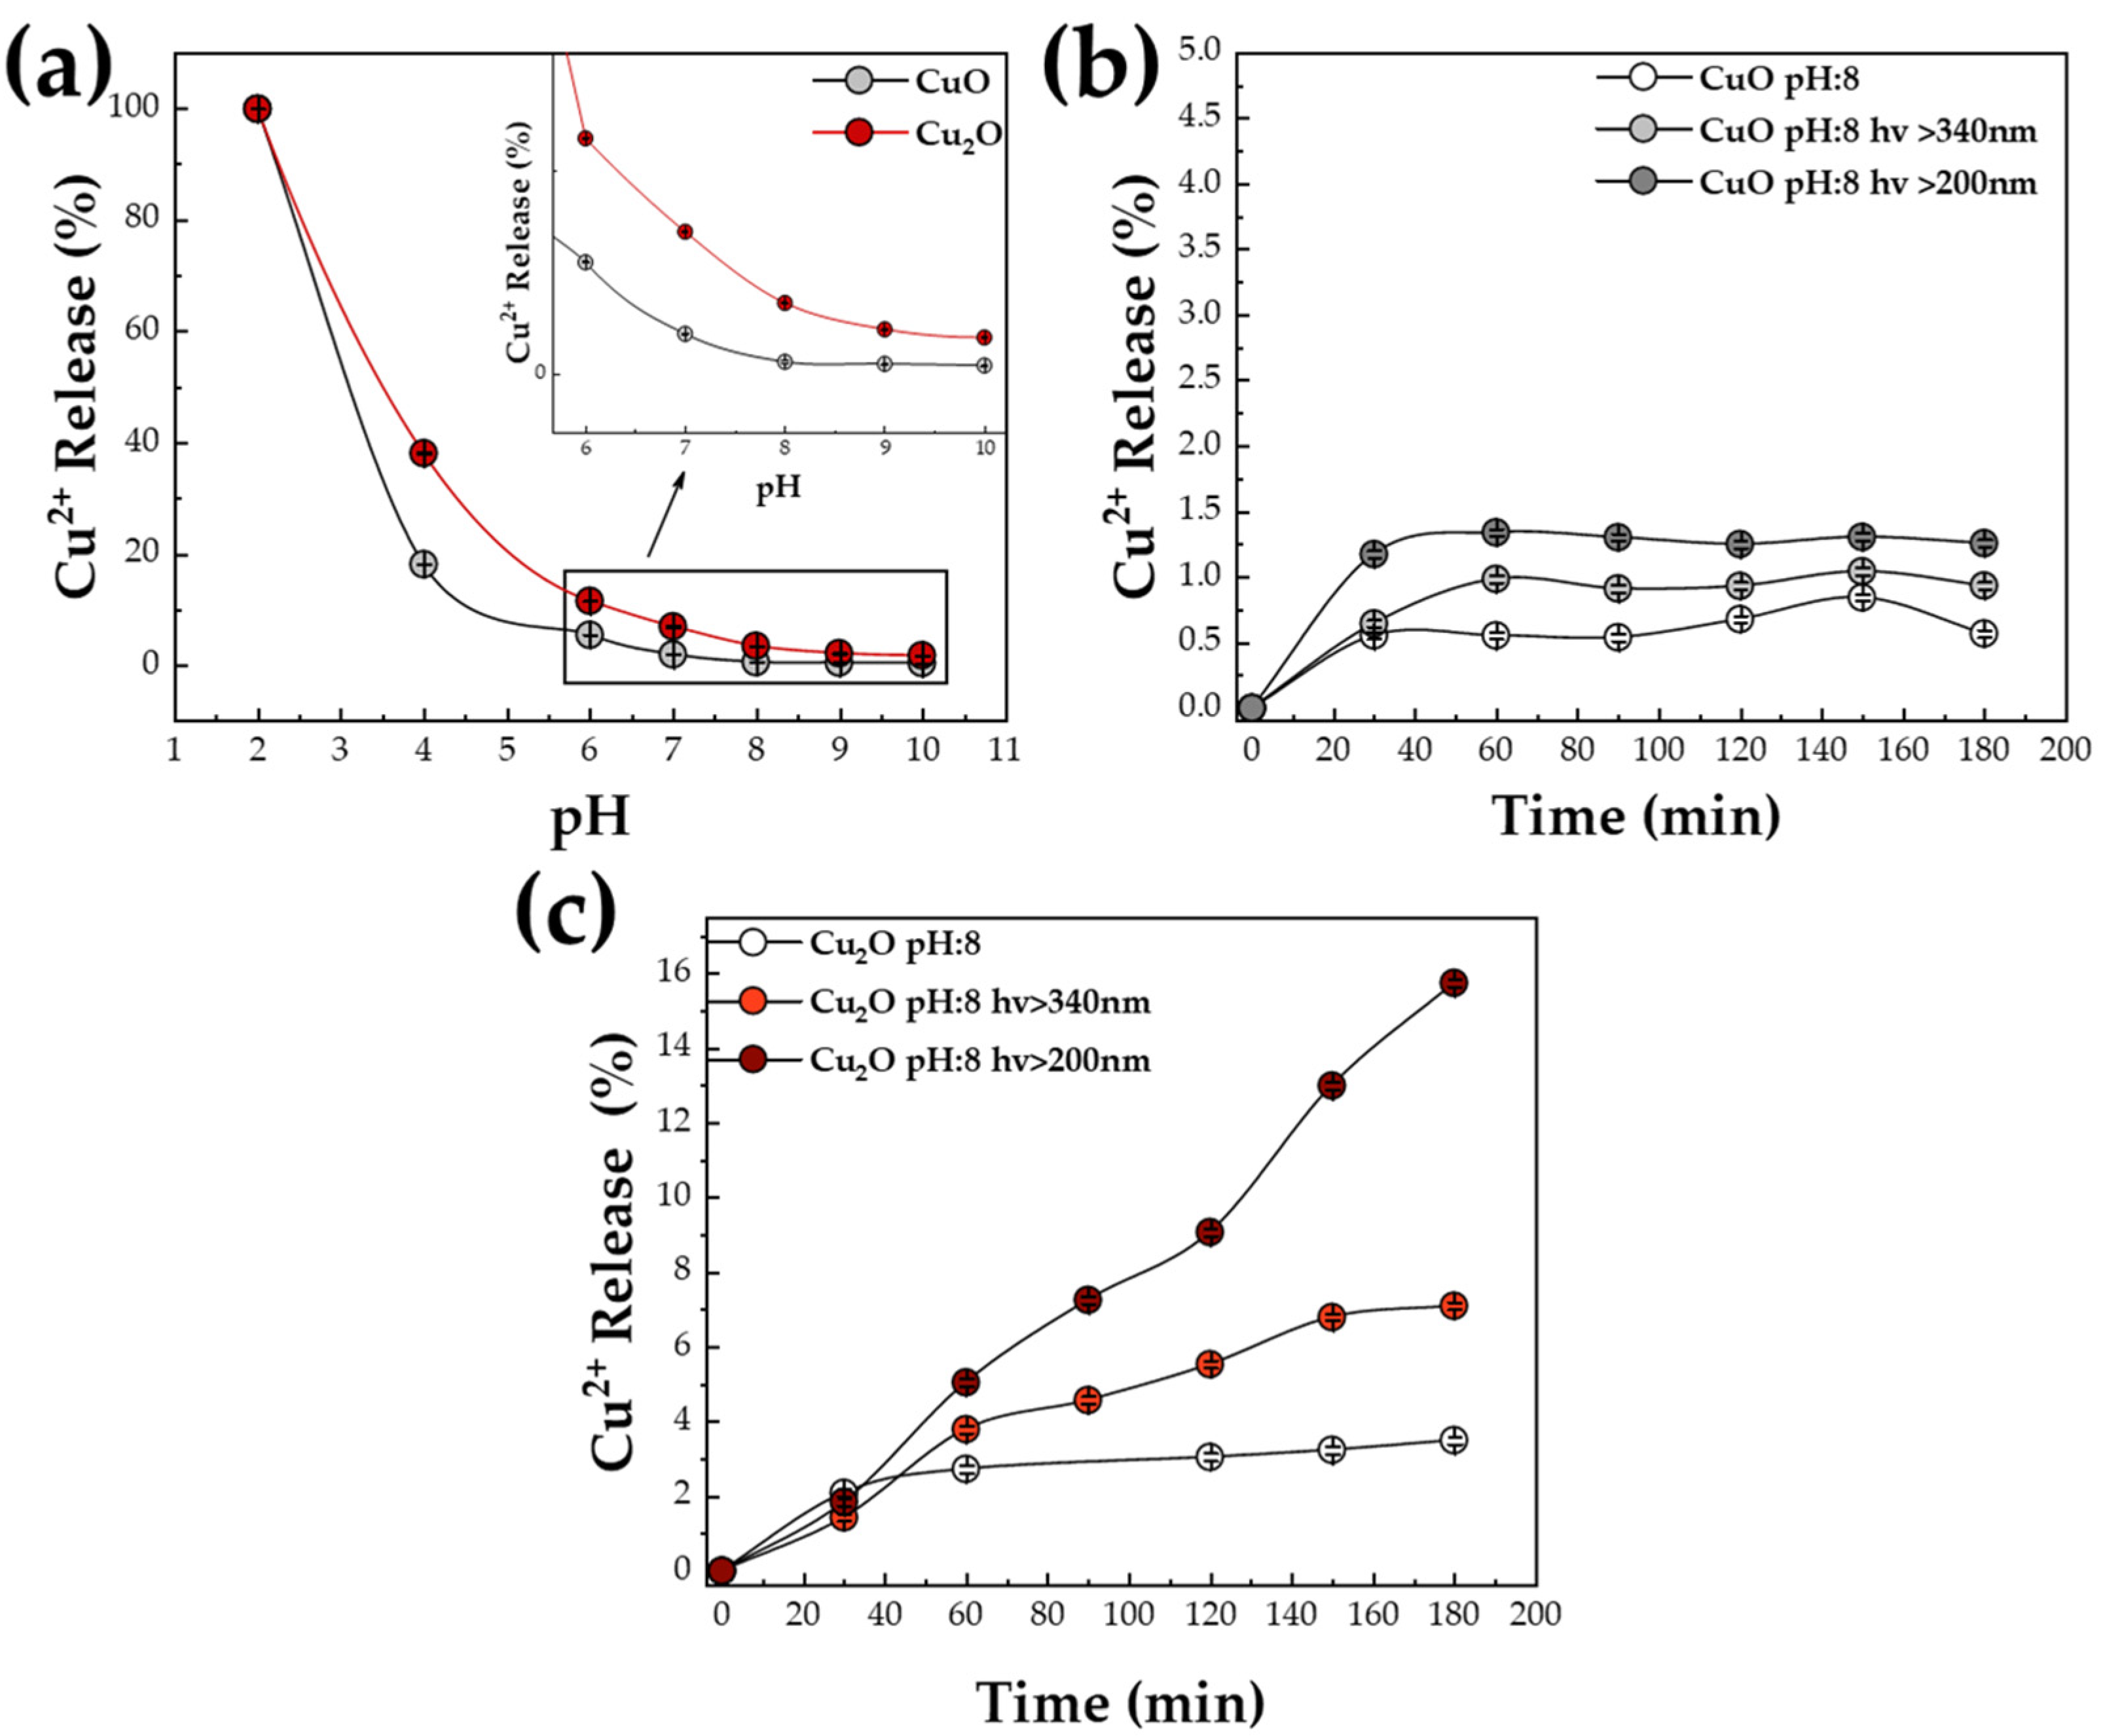
The Role of pH: First, we examined the chemical stability, without light, by monitoring the Cu ions’ release from CuO and Cu2O in H2O under different pH values. Figure 2a presents results based on ASV determination of Cu2+ ions in solution after 3 h of exposure. This time scale (3 h) is typical time span for photocatalytic experiments. As we see in Figure 2a, under acidic pH (pH:2), both CuO and Cu2O materials were 100% dissolved after 3 h. On the contrary, increasing the pH towards more alkaline values, Cu2+ release decreased rapidly, with a threshold pH > 7, where the Cu2+ release was <5% at 3 h. Notice that the CuO phase exhibited better chemical stability than Cu2O. Even at neutral pH, Cu2O was more unstable, having a dissolution of 7%, which is 3.5-fold higher vs. the corresponding leaching of CuO (better viewed at the zoomed Figure 2a inset).
The Role of Light-Photons: Based on these results, a series of Xenon-lamp illuminations were performed under a slightly alkaline pH (pH:8), often used in CO2 photocatalysis in HCO3/H2O systems [12,14], and both CuO and Cu2O are relatively stable, with Cu2+ release of 0.6% and 3.5%, respectively (Figure 2a). As seen in Figure 2b, under full-Xenon spectrum illumination, hv > 200 nm, CuO showed ~1.5% light-induced Cu2+ release, that is a +1% increase vs. no light. Elimination of UV photons by filtration hv > 340 nm resulted in a lower Cu2+ release by CuO, i.e., by ~1% (Figure 2b). Overall, the data in Figure 2a show that the damage of light on the CuO nanoparticles was limited.
On the contrary, light photons exerted a severe effect on Cu2+ leaching by the Cu2O nanophase (material Cu-20N) (Figure 2c). Full-Xenon illumination, hv > 200 nm, resulted in dissolution higher than >15% of the Cu2O matrices, releasing the Cu2+ ions in the aqueous solution. Thus, hv > 200 nm photons enhanced the Cu release by 500%, i.e., from ~3% in the dark to ~15%. Filtering out the UV photons, hv > 340 nm, resulted in a significant drop of Cu2+ ions release to 7% (Figure 2c), which is about 200% versus no light. Overall, the data in Figure 2b,c reveal that [i] Cu2O is far more prone, about 10 fold, to Cu2+ release in solution than CuO. [ii] This is a direct manifestation of photocorrosion. That is to say, photocorrosion starts as an oxidation event inside the Cu2O crustal, as evidenced by many previous data [19,20], and, in the following, the present data show that photocorrosion persists until the physical detachment of the Cu ions from the particle matrix. As we show hereafter, photoinduced holes are the origin of the Cu1+ to Cu2+ oxidation.
The effect of photon wavelength can be understood as follows: the band gap of Cu2O particles near 2.1 eV entails that photons with λ ≤ 580 nm, i.e., visible and UV photons, can photoexcite it, creating holes and electrons. This includes 200 nm photons, i.e., hv~6 eV, which excite highly energetic “deep” holes with energies well below the valence band top. Similarly, electrons well above the conduction-bend edge can be excited. The data in Figure 2c, with hv > 200 nm, indicate that the high energetic holes dramatically boost the Cu2+ release. This results in a significant 15% of the Cu2O mass to literally deteriorate. In the same context, allowing hv > 340 nm contains photons with energy ≤ 3.4 eV that can also photoexcite “deep” holes, though with less energy than the 200 nm photons. Thus, the hv > 340 nm results in about half of the Cu2+ release by the Cu2O particles.
The Role of HCO3: As mentioned previously [48,49], Cu2O is identified as a promising CO2 photocatalyst. In aqueous-phase photocatalytic processes, carbonate species are pertinent. Herein, we tested the role of HCO3 as a photocatalytic substrate that prevails in the pH range 6.5–10.5 in H2O systems [50]. We used 30 mM HCO3, which is an average amount used in CO2-photocatalytic experiments [51,52]. Control data show that HCO3 with no illumination had an insignificant effect on Cu2+ release (Figure 3a) from CuO. Similarly, the Cu2+ release data in Figure 3a show that during underexposure of CuO in HCO3 plus light, Cu-atom release was extremely low, i.e., 0.75% without irradiation and ~1% with hv > 200 nm. This confirms the stability of CuO under light and as well as light +HCO3.
In the case of Cu2O, the presence of HCO3 alone with no light (Figure 3b) caused a Cu-atom release ~11%. This is higher than the Cu2+ release by Cu2O with no HCO3, i.e., 3.5% (compare Figure 3b vs. Figure 2c). This reveals a direct chemical, not photochemical effect of HCO3 on the Cu2O atoms. As we show hereafter by EPR data, HCO3 extracts Cu2+ ions from the Cu2O particles s via formation of Cu-HCO3 complexes.
As seen in Figure 3b, under light photons, the HCO3 severely intensifies the Cu2+ release, which reached ~27% of its mass (Figure 3b) under hv > 200 nm. Filtering off UV photons (Figure 3b), hv > 340 nm, resulted in ~15% Cu2+ release. These results clearly reveal that carbonate, i.e., HCO3 exerts a deteriorating effect in two ways: [i] In the dark, HCO3 is able to drive detachment of some Cu atoms from the Cu2O particles. [ii] Under illumination, the photocorrosive Cu release is exacerbated by the presence of carbonates.

3.2. EPR Spectroscopy

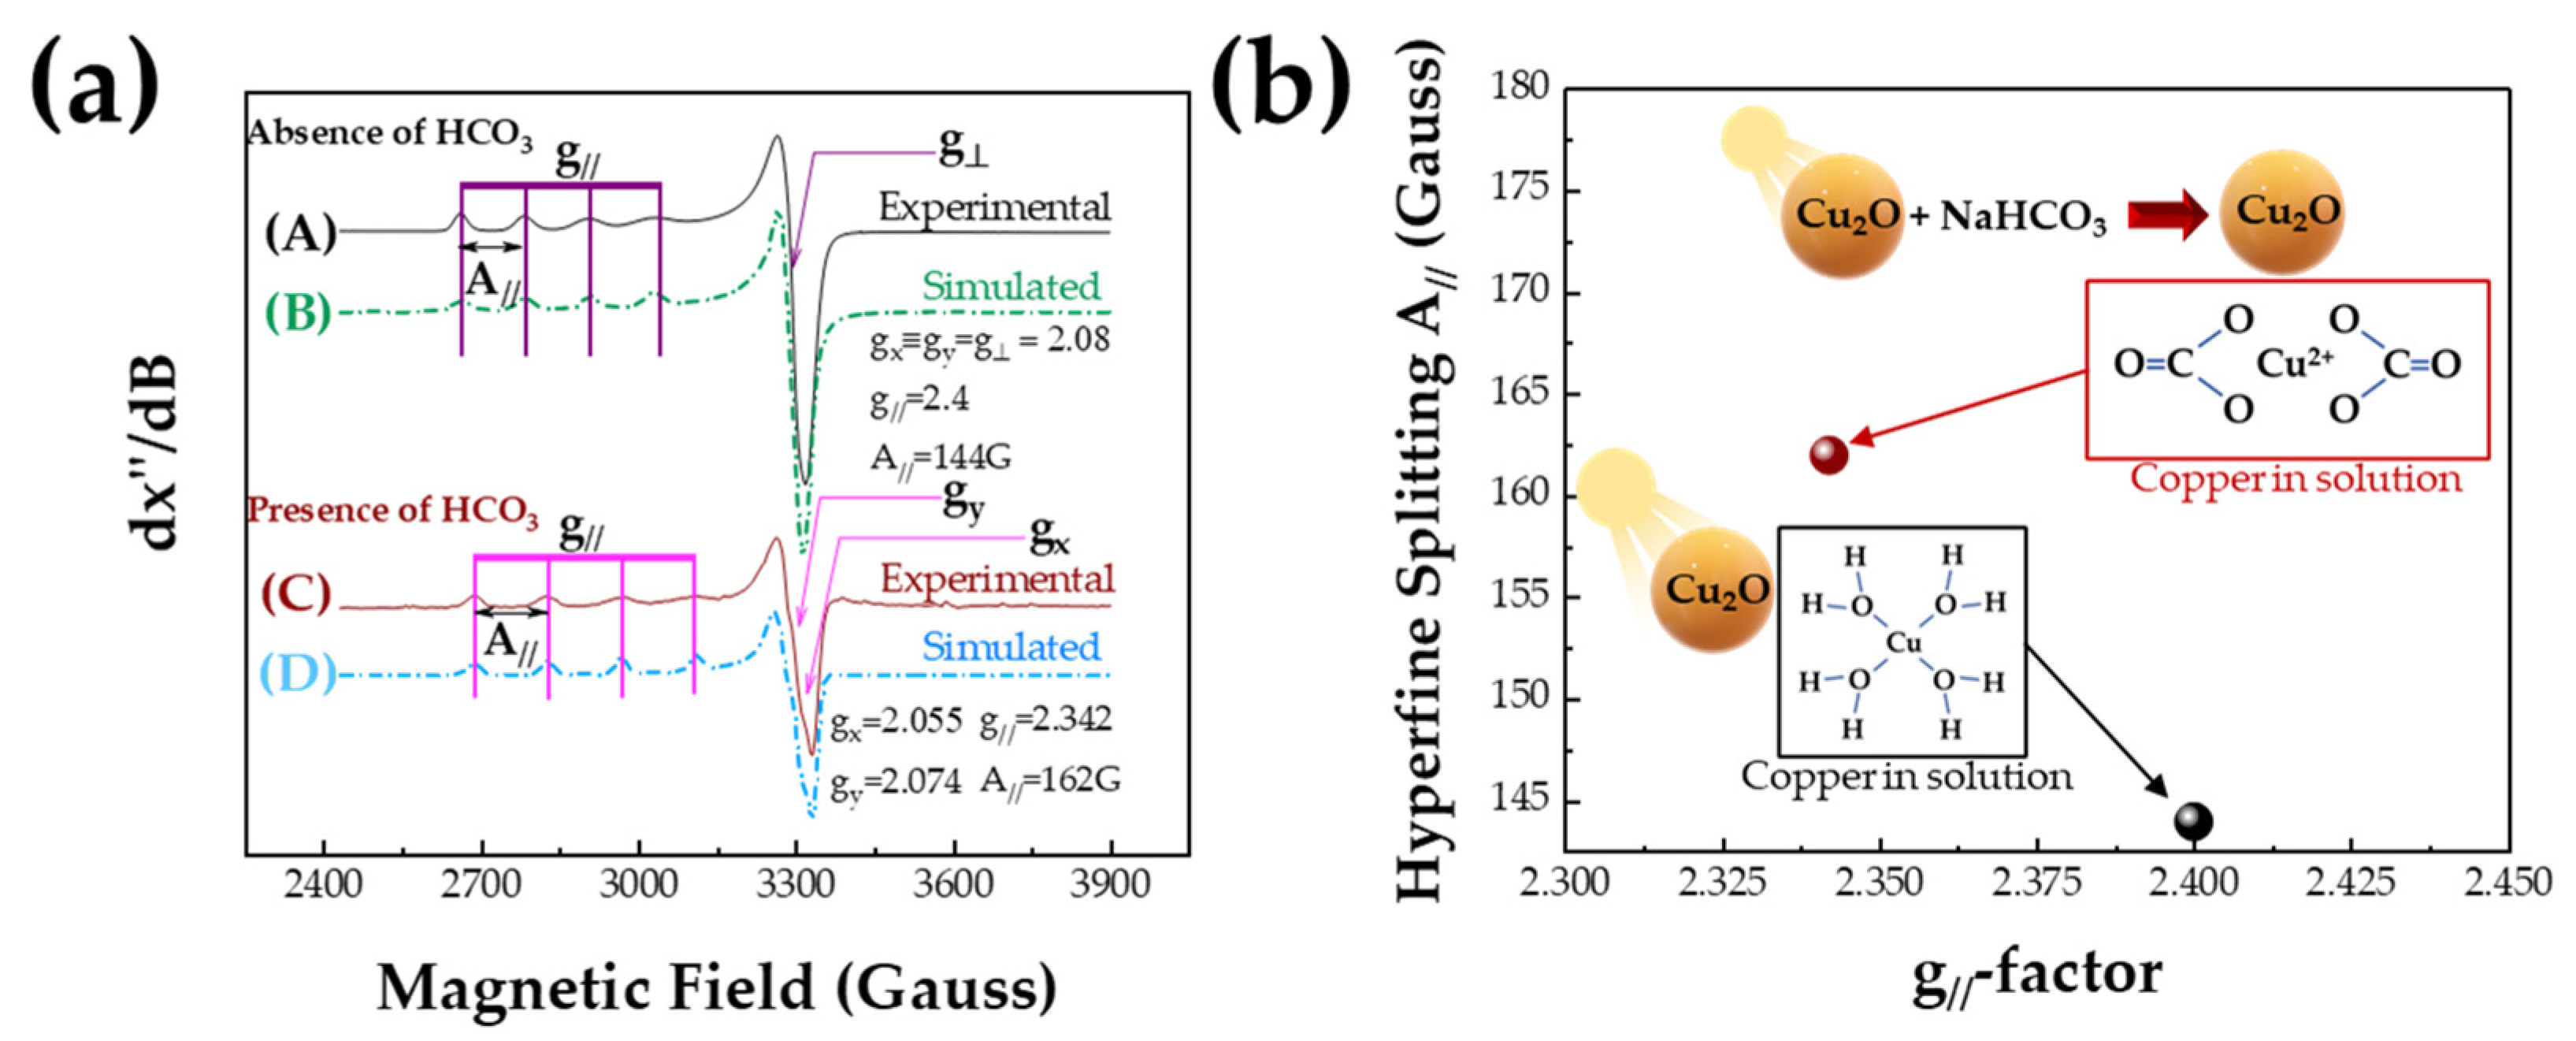
Figure 4a shows X-band EPR spectra for Cu2+ ions released by Cu2O particles under Xenon light irradiation, either in the presence or absence of HCO3. All spectra displayed in Figure 4a are typical for mononuclear Cu2+ (electron spin S = 1/2, nuclear spin I = 3/2) [30,53]. The well-resolved hyperfine lines of Cu2+ EPR spectra correspond to isolated Cu2+ ions in solution. All EPR spectra can be simulated, assuming a spin system with S = 1/2, I = 3/2, i.e., for Cu2+, see dotted lines in Figure 4a with Cu2+ Spin Hamiltonian parameters (tensors g and A), listed in Table 2. In Figure 4b, we represent a so-called Peisach–Blumberg plot [54] for Cu2+ species using the g// and A// from Table 2. Peisach and Blumberg developed a method which correlates EPR parameters (g//, A//) with the number and type of ligand donor atoms in Cu2+ complexes. Previously, we showed that this method may be used to precisely detect the coordination of Cu2+ ions on metal oxides’ surfaces and to distinguish the form of Cu atoms in solution [30,31].
The structural significance of the EPR spectral features can be understood by comparison of the g// and A// parameters with the literature data according to the method established by Peisach and Blumberg. These data indicate that: (a) In the absence of carbonates, the Cu2+ ions are released from illuminated Cu2O as aqua-coordinated ions in solution. (b) In the presence of HCO3 as a photocatalytic substrate, copper ions are released in the form of Cu(HCO3)2 complexes in the aqueous solution. In all cases, the Cu2+ ions are coordinated by O atoms in an octahedral symmetry with the ground-state orbital of the Cu-unpaired electron to be d x 2 y 2 [55,56].

4. Discussion

The present data show that in the presence of HCO3, the Cu2O photocorrosion is severely accentuated. Even in the dark, bicarbonate should be viewed as a highly active coordinating agent that can bind on the Cu2O surface and promote the release of Cu (HCO3)2 complexes in aqueous solution. Additionally, light photons can promote the formation of Cu2+ via self-oxidation.
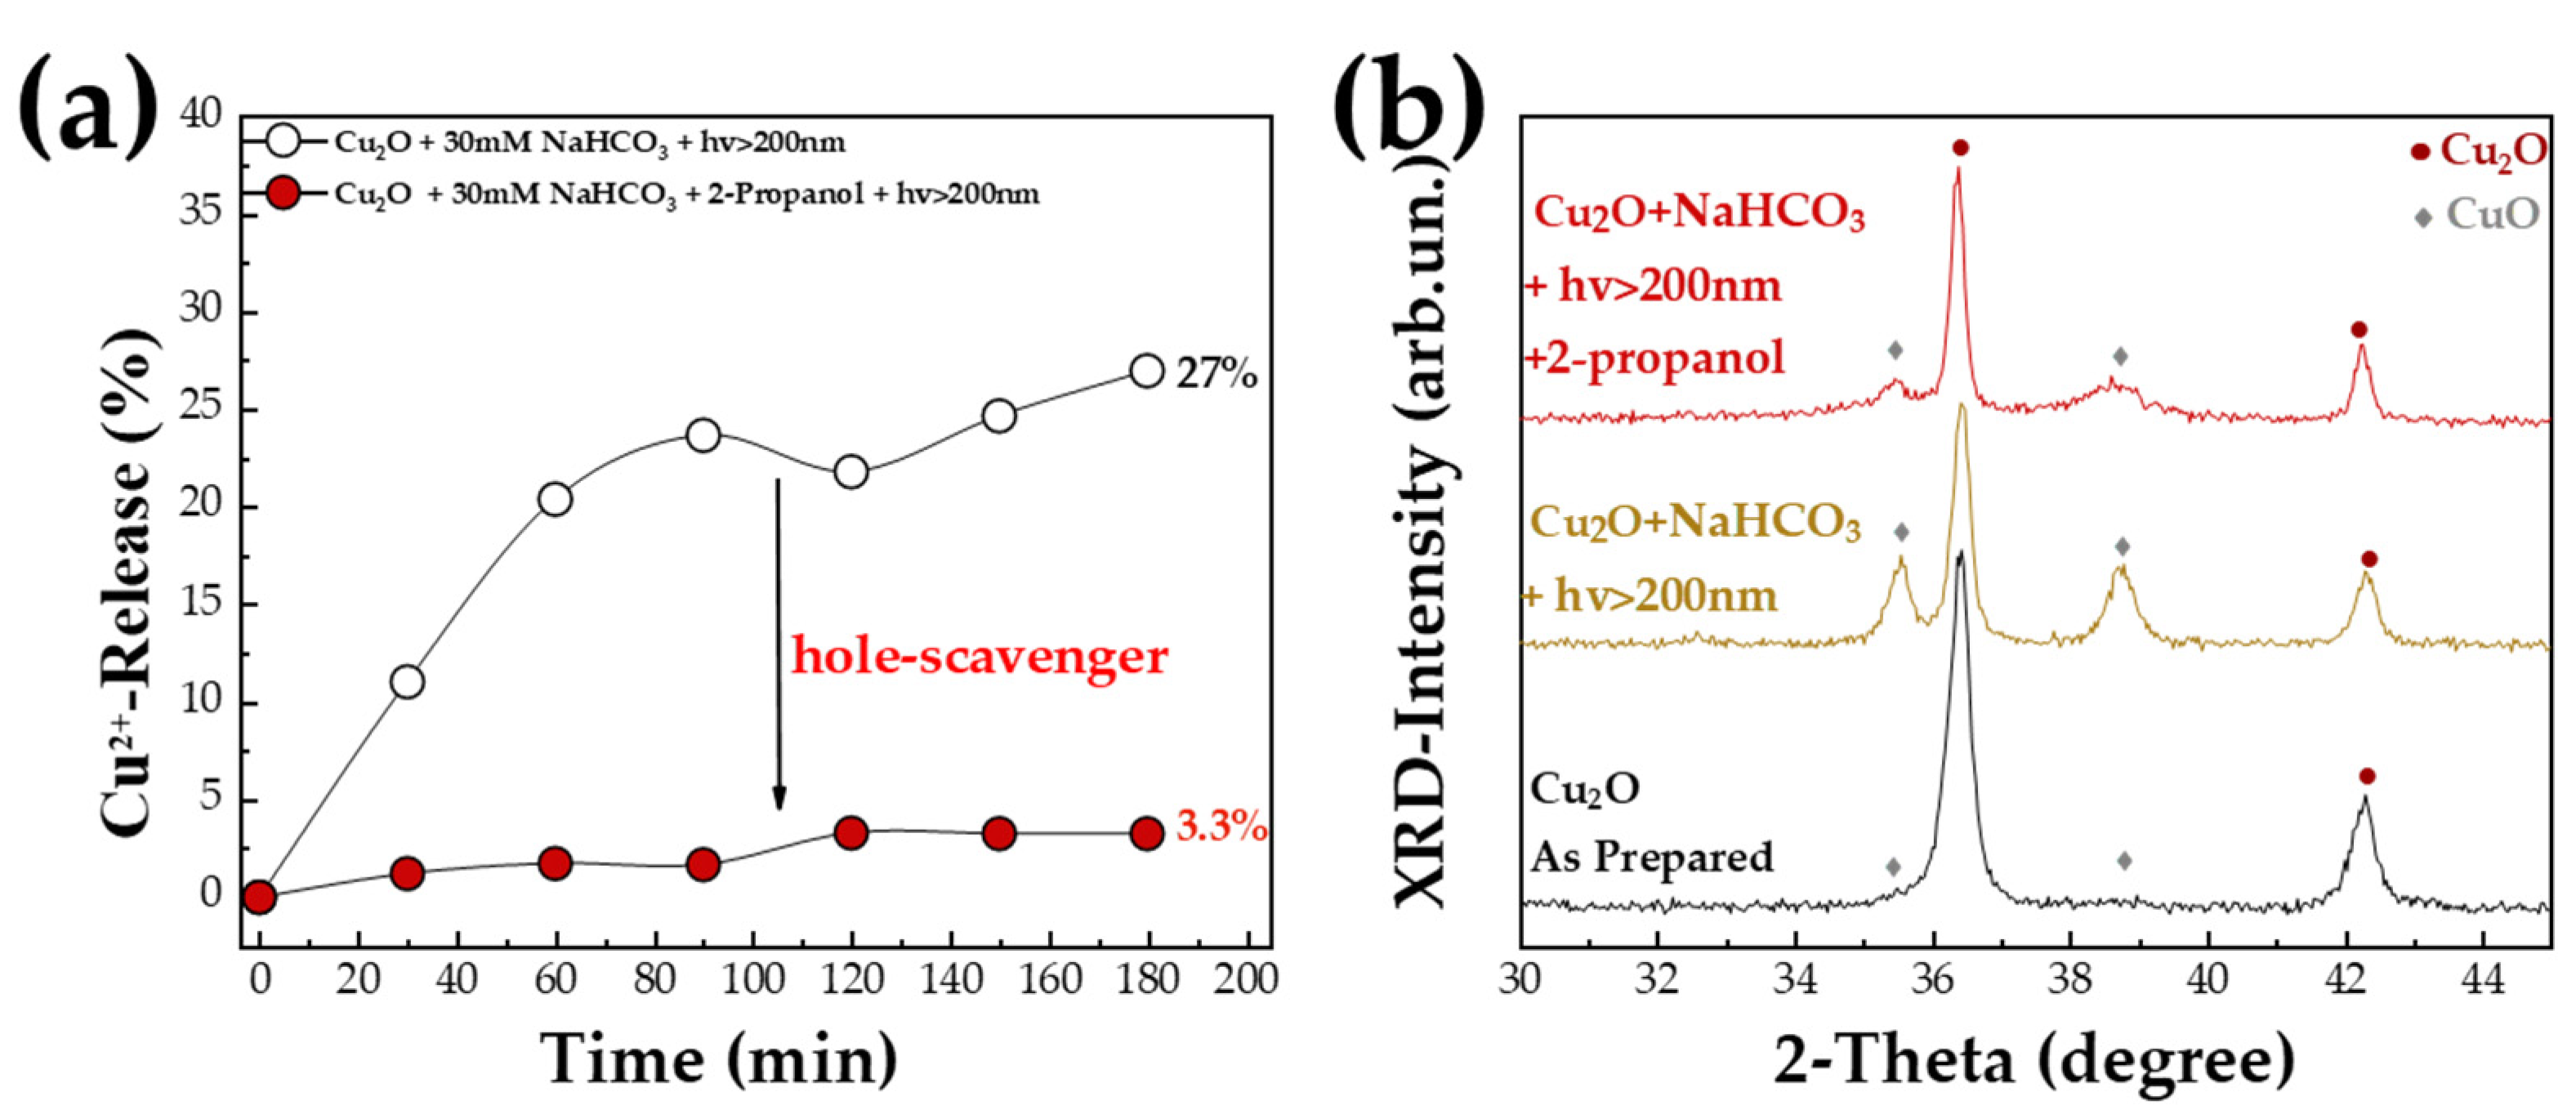
The Role of Hole Scavenger: The data in Figure 2 and Figure 3 clearly exemplify the photocorrosion phenomena that prevail in Cu2O. As mentioned by Toe [19,20], photoinduced holes should be considered as the key reactive species that promote the Cu2+ release from photo-cited Cu2O. In Figure 5, we examine the role of hole scavenger using isopropanol as a standard hole scavenger.
In the presence of 2-propanol plus NaHCO3, a significant suppression of the photocorrosion is observed, as evidenced by the decrease from 27% to 3% of Cu2+-ion release (Figure 5a). This provides clear evidence that scavenging of the photoinduced holes, provides significant protection against photocorrosion of Cu2O under realistic CO2-photocatalytic conditions. This is a very encouraging result, showing a route to address the Cu2O photocorrosion problem.
To further understand the process, we examined by XRD the Cu2O particles after 3 h photocatalytic exposure (Figure 5b). As seen in Figure 5b, in the presence of NaHCO3, after 3 h of irradiation (Xenon, hv > 200 nm) the initial Cu2O-crystal phase composition is changed from >95% Cu2O (see Table 3) to 60% CuO. We underline that the particles collected after 3 h photocorrosion represent only the fraction that is not dissolved to Cu2+ ions. Thus, the photocorrosion of Cu2O in the presence of NaHCO3 has two consequences: [i] Part of the Cu2O particle is dissolved towards Cu2+ ions. [ii] The remaining Cu-oxide particle phase is altered from Cu2O to CuO. Importantly, in the presence of 2-propanol, the Cu2+-release and XRD data show that [i] Practically minimal Cu2+-ions release occurs. That is the Cu-oxide particles remain mostly intact. [ii] The crystal composition is modified, i.e., according to Table 3, the Cu-oxide particles consist of 25% CuO, i.e., the initial 95% Cu2O has been retained to 75%. We consider that the formed 25% CuO forms a protective layer around the Cu2O, and this inhibits the Cu2+-ion release.

5. Conclusions

Using EPR spectroscopy in tandem with ASV, the in situ study of the release of Cu ions from Cu2O nanocatalyst under photocatalytic conditions provides new insight into the role of HCO3 as a catalytic substrate. Light and HCO3 have detrimental effects on the photocorrosion of Cu2O and the ensuing Cu2+-ion release in the H2O solution. EPR reveals that HCO3 acts as ligand of the Cu2+ ions, promoting the liberation of {HCO3-Cu} complexes in solution from Cu2O, up to 27% of its mass. Even in the dark, bicarbonate acts as a highly active coordinating agent that can bind on Cu2O surface and promote the release of Cu (HCO3)2 complexes in aqueous solution. On top of this, light photons can promote the formation of Cu2+ via self-oxidation. XRD data show that under prolonged irradiation, part of Cu2+ ions can re-precipitate on the Cu2O surface, creating a passivating CuO layer that stabilizes the CuO-Cu2O from further photocorrosion. Moreover, including isopropanol as a hole scavenger has a drastic impact on the photo-oxidation of Cu2O to CuO as well as suppresses the release of Cu2+ ions. Method-wise, the present data exemplify that EPR and ASV can be useful tools to quantitatively understand the solid–solution interface photocorrosion phenomena for Cu2O.

Author Contributions

Conceptualization, Y.D.; methodology, A.Z.; formal analysis, A.Z.; investigation, A.Z.; data curation, A.Z.; writing—original draft preparation, A.Z.; writing—review and editing, A.Z. and Y.D.; supervision, Y.D.; funding acquisition, Y.D. All authors have read and agreed to the published version of the manuscript.

Funding

This research was funded by the Hellenic Foundation for Research and Innovation (H.F.R.I) under the “First Call for H.F.R.I Research Projects to support Faculty members and Researchers and the procurement of high-cost research equipment grant” (HFRI-FM17-1888).

Data Availability Statement

Not applicable.

Conflicts of Interest

The authors declare no conflict of interest.

References

  1. Fujishima, A.; Honda, K. Electrochemical Photolysis of Water at a Semiconductor Electrode. Nature 1972, 238, 37–38. [Google Scholar] [CrossRef] [PubMed]
  2. Wang, Q.; Domen, K. Particulate Photocatalysts for Light-Driven Water Splitting: Mechanisms, Challenges, and Design Strategies. Chem. Rev. 2020, 120, 919–985. [Google Scholar] [CrossRef] [PubMed]
  3. Marschall, R. Semiconductor Composites: Strategies for Enhancing Charge Carrier Separation to Improve Photocatalytic Activity. Adv. Funct. Mater. 2014, 24, 2421–2440. [Google Scholar] [CrossRef]
  4. Xu, T.; Zhang, L.; Cheng, H.; Zhu, Y. Significantly Enhanced Photocatalytic Performance of ZnO via Graphene Hybridization and the Mechanism Study. Appl. Catal. B Environ. 2011, 101, 382–387. [Google Scholar] [CrossRef]
  5. Ng, C.; Ng, Y.H.; Iwase, A.; Amal, R. Influence of Annealing Temperature of WO3 in Photoelectrochemical Conversion and Energy Storage for Water Splitting. ACS Appl. Mater. Interfaces 2013, 5, 5269–5275. [Google Scholar] [CrossRef] [PubMed]
  6. Han, Y.; Wu, X.; Ma, Y.; Gong, L.; Qu, F.; Fan, H. Porous SnO2 Nanowire Bundles for Photocatalyst and Li Ion Battery Applications. CrystEngComm 2011, 13, 3506–3510. [Google Scholar] [CrossRef]
  7. Zong, X.; Yan, H.; Wu, G.; Ma, G.; Wen, F.; Wang, L.; Li, C. Enhancement of Photocatalytic H2 Evolution on CdS by Loading MoS2 as Cocatalyst under Visible Light Irradiation. J. Am. Chem. Soc. 2008, 130, 7176–7177. [Google Scholar] [CrossRef]
  8. Tang, Y.; Ng, Y.H.; Yun, J.-H.; Amal, R. Fabrication of a CuInS2 Photoelectrode Using a Single-Step Electrodeposition with Controlled Calcination Atmosphere. RSC Adv. 2013, 4, 3278–3283. [Google Scholar] [CrossRef]
  9. Zhang, J.; Yu, J.; Zhang, Y.; Li, Q.; Gong, J.R. Visible Light Photocatalytic H2-Production Activity of CuS/ZnS Porous Nanosheets Based on Photoinduced Interfacial Charge Transfer. Nano Lett. 2011, 11, 4774–4779. [Google Scholar] [CrossRef]
  10. Cao, S.; Yu, J. G-C3N4-Based Photocatalysts for Hydrogen Generation. J. Phys. Chem. Lett. 2014, 5, 2101–2107. [Google Scholar] [CrossRef]
  11. Gawande, M.B.; Goswami, A.; Felpin, F.-X.; Asefa, T.; Huang, X.; Silva, R.; Zou, X.; Zboril, R.; Varma, R.S. Cu and Cu-Based Nanoparticles: Synthesis and Applications in Catalysis. Chem. Rev. 2016, 116, 3722–3811. [Google Scholar] [CrossRef]
  12. Rej, S.; Bisetto, M.; Naldoni, A.; Fornasiero, P. Well-Defined Cu2O Photocatalysts for Solar Fuels and Chemicals. J. Mater. Chem. A 2021, 9, 5915–5951. [Google Scholar] [CrossRef]
  13. Zindrou, A.; Belles, L.; Deligiannakis, Y. Cu-Based Materials as Photocatalysts for Solar Light Artificial Photosynthesis: Aspects of Engineering Performance, Stability, Selectivity. Solar 2023, 3, 87–112. [Google Scholar] [CrossRef]
  14. Dong, Z.; Zhou, J.; Zhang, Z.; Jiang, Y.; Zhou, R.; Yao, C. Construction of a p–n Type S-Scheme Heterojunction by Incorporating CsPbBr3 Nanocrystals into Mesoporous Cu2O Microspheres for Efficient CO2 Photoreduction. ACS Appl. Energy Mater. 2022, 5, 10076–10085. [Google Scholar] [CrossRef]
  15. Tang, Z.; He, W.; Wang, Y.; Wei, Y.; Yu, X.; Xiong, J.; Wang, X.; Zhang, X.; Zhao, Z.; Liu, J. Ternary Heterojunction in RGO-Coated Ag/Cu2O Catalysts for Boosting Selective Photocatalytic CO2 Reduction into CH4. Appl. Catal. B Environ. 2022, 311, 121371. [Google Scholar] [CrossRef]
  16. Wu, Y.A.; McNulty, I.; Liu, C.; Lau, K.C.; Liu, Q.; Paulikas, A.P.; Sun, C.-J.; Cai, Z.; Guest, J.R.; Ren, Y.; et al. Facet-Dependent Active Sites of a Single Cu2O Particle Photocatalyst for CO2 Reduction to Methanol. Nat. Energy 2019, 4, 957–968. [Google Scholar] [CrossRef]
  17. Ghosh, S.; Bera, S.; Sardar, S.; Pal, S.; Camargo, F.V.A.; D’Andrea, C.; Cerullo, G. Role of Efficient Charge Transfer at the Interface between Mixed-Phase Copper-Cuprous Oxide and Conducting Polymer Nanostructures for Photocatalytic Water Splitting. ACS Appl. Mater. Interfaces 2023, 15, 18867–18877. [Google Scholar] [CrossRef]
  18. Chen, J.-L.; Liu, M.-M.; Xie, S.-Y.; Yue, L.-J.; Gong, F.-L.; Chai, K.-M.; Zhang, Y.-H. Cu2O-Loaded TiO2 Heterojunction Composites for Enhanced Photocatalytic H2 Production. J. Mol. Struct. 2022, 1247, 131294. [Google Scholar] [CrossRef]
  19. Toe, C.Y.; Zheng, Z.; Wu, H.; Scott, J.; Amal, R.; Ng, Y.H. Photocorrosion of Cuprous Oxide in Hydrogen Production: Rationalising Self-Oxidation or Self-Reduction. Angew. Chem. Int. Ed. 2018, 57, 13613–13617. [Google Scholar] [CrossRef]
  20. Toe, C.Y.; Scott, J.; Amal, R.; Ng, Y.H. Recent Advances in Suppressing the Photocorrosion of Cuprous Oxide for Photocatalytic and Photoelectrochemical Energy Conversion. J. Photochem. Photobiol. C Photochem. Rev. 2019, 40, 191–211. [Google Scholar] [CrossRef]
  21. Chen, S.; Wang, L.-W. Thermodynamic Oxidation and Reduction Potentials of Photocatalytic Semiconductors in Aqueous Solution. Chem. Mater. 2012, 24, 3659–3666. [Google Scholar] [CrossRef]
  22. Wu, L.; Tsui, L.; Swami, N.; Zangari, G. Photoelectrochemical Stability of Electrodeposited Cu2O Films. J. Phys. Chem. C 2010, 114, 11551–11556. [Google Scholar] [CrossRef]
  23. Yang, Y.; Han, J.; Ning, X.; Su, J.; Shi, J.; Cao, W.; Xu, W. Photoelectrochemical Stability Improvement of Cuprous Oxide (Cu2O) Thin Films in Aqueous Solution. Int. J. Energy Res. 2016, 40, 112–123. [Google Scholar] [CrossRef]
  24. Wu, F.; Banerjee, S.; Li, H.; Myung, Y.; Banerjee, P. Indirect Phase Transformation of CuO to Cu2O on a Nanowire Surface. Langmuir 2016, 32, 4485–4493. [Google Scholar] [CrossRef]
  25. Brezonik, P.L.; Brauner, P.A.; Stumm, W. Trace Metal Analysis by Anodic Stripping Voltammetry: Effect of Sorption by Natural and Model Organic Compounds. Water Res. 1976, 10, 605–612. [Google Scholar] [CrossRef]
  26. Pilbrow, J.R. Transition Ion Electron Paramagnetic Resonance; Clarendon Press: Oxford, UK, 1990; ISBN 978-0-19-855214-7. [Google Scholar]
  27. Tada, S.; Otsuka, F.; Fujiwara, K.; Moularas, C.; Deligiannakis, Y.; Kinoshita, Y.; Uchida, S.; Honma, T.; Nishijima, M.; Kikuchi, R. Development of CO2-to-Methanol Hydrogenation Catalyst by Focusing on the Coordination Structure of the Cu Species in Spinel-Type Oxide Mg1–XCuxAl2O4. ACS Catal. 2020, 10, 15186–15194. [Google Scholar] [CrossRef]
  28. Naatz, H.; Manshian, B.B.; Rios Luci, C.; Tsikourkitoudi, V.; Deligiannakis, Y.; Birkenstock, J.; Pokhrel, S.; Mädler, L.; Soenen, S.J. Model-Based Nanoengineered Pharmacokinetics of Iron-Doped Copper Oxide for Nanomedical Applications. Angew. Chem. 2020, 132, 1844–1852. [Google Scholar] [CrossRef]
  29. Papadas, I.T.; Kosma, C.; Deligiannakis, Y. Ternary [Al2O3–Electrolyte–Cu2+] Species: EPR Spectroscopy and Surface Complexation Modeling. J. Colloid Interface Sci. 2009, 339, 19–30. [Google Scholar] [CrossRef] [PubMed]
  30. Grigoropoulou, G.; Christoforidis, K.C.; Louloudi, M.; Deligiannakis, Y. Structure-Catalytic Function Relationship of SiO2-Immobilized Mononuclear Cu Complexes:  An EPR Study. Langmuir 2007, 23, 10407–10418. [Google Scholar] [CrossRef]
  31. Zois, D.; Vartzouma, C.; Deligiannakis, Y.; Hadjiliadis, N.; Casella, L.; Monzani, E.; Louloudi, M. Active Catalytic Centers in Silica-Supported Cu(II) and Mn(II) Biomimetic Complexes: Correlation between Catalytic and EPR Data. J. Mol. Catal. A Chem. 2007, 261, 306–317. [Google Scholar] [CrossRef]
  32. Locatelli, C.; Torsi, G. Simultaneous Square Wave Anodic Stripping Voltammetric Determination of Cr, Pb, Sn, Sb, Cu, Zn in Presence of Reciprocal Interference: Application to Meal Matrices. Microchem. J. 2004, 78, 175–180. [Google Scholar] [CrossRef]
  33. Solakidou, M.; Giannakas, A.; Georgiou, Y.; Boukos, N.; Louloudi, M.; Deligiannakis, Y. Efficient Photocatalytic Water-Splitting Performance by Ternary CdS/Pt-N-TiO2 and CdS/Pt-N,F-TiO2: Interplay between CdS Photo Corrosion and TiO2-Dopping. Appl. Catal. B Environ. 2019, 254, 194–205. [Google Scholar] [CrossRef]
  34. Teoh, W.Y.; Amal, R.; Mädler, L. Flame Spray Pyrolysis: An Enabling Technology for Nanoparticles Design and Fabrication. Nanoscale 2010, 2, 1324. [Google Scholar] [CrossRef]
  35. Strobel, R.; Pratsinis, S.E. Flame Aerosol Synthesis of Smart Nanostructured Materials. J. Mater. Chem. 2007, 17, 4743. [Google Scholar] [CrossRef]
  36. Waser, O.; Groehn, A.J.; Eggersdorfer, M.L.; Pratsinis, S.E. Air Entrainment During Flame Aerosol Synthesis of Nanoparticles. Aerosol Sci. Technol. 2014, 48, 1195–1206. [Google Scholar] [CrossRef]
  37. Zhu, Y.; Xu, Z.; Yan, K.; Zhao, H.; Zhang, J. One-Step Synthesis of CuO–Cu2O Heterojunction by Flame Spray Pyrolysis for Cathodic Photoelectrochemical Sensing of l-Cysteine. ACS Appl. Mater. Interfaces 2017, 9, 40452–40460. [Google Scholar] [CrossRef]
  38. Athanassiou, E.K.; Grass, R.N.; Stark, W.J. Large-Scale Production of Carbon-Coated Copper Nanoparticles for Sensor Applications. Nanotechnology 2006, 17, 1668–1673. [Google Scholar] [CrossRef]
  39. Belles, L.; Moularas, C.; Smykała, S.; Deligiannakis, Y. Flame Spray Pyrolysis Co3O4/CoO as Highly-Efficient Nanocatalyst for Oxygen Reduction Reaction. Nanomaterials 2021, 11, 925. [Google Scholar] [CrossRef]
  40. Psathas, P.; Moularas, C.; Smykała, S.; Deligiannakis, Y. Highly Crystalline Nanosized NaTaO3/NiO Heterojunctions Engineered by Double-Nozzle Flame Spray Pyrolysis for Solar-to-H2 Conversion: Toward Industrial-Scale Synthesis. ACS Appl. Nano Mater. 2023, 6, 2658–2671. [Google Scholar] [CrossRef]
  41. Psathas, P.; Zindrou, A.; Papachristodoulou, C.; Boukos, N.; Deligiannakis, Y. In Tandem Control of La-Doping and CuO-Heterojunction on SrTiO3 Perovskite by Double-Nozzle Flame Spray Pyrolysis: Selective H2 vs. CH4 Photocatalytic Production from H2O/CH3OH. Nanomaterials 2023, 13, 482. [Google Scholar] [CrossRef]
  42. Patterson, A.L. The Scherrer Formula for X-Ray Particle Size Determination. Phys. Rev. 1939, 56, 978–982. [Google Scholar] [CrossRef]
  43. Doebelin, N.; Kleeberg, R. Profex: A Graphical User Interface for the Rietveld Refinement Program BGMN. J. Appl. Cryst. 2015, 48, 1573–1580. [Google Scholar] [CrossRef] [PubMed]
  44. Stoll, S.; Schweiger, A. EasySpin, a Comprehensive Software Package for Spectral Simulation and Analysis in EPR. J. Magn. Reson. 2006, 178, 42–55. [Google Scholar] [CrossRef] [PubMed]
  45. Cuppett, J.D.; Duncan, S.E.; Dietrich, A.M. Evaluation of Copper Speciation and Water Quality Factors That Affect Aqueous Copper Tasting Response. Chem. Senses 2006, 31, 689–697. [Google Scholar] [CrossRef]
  46. Koirala, R.; Pratsinis, S.E.; Baiker, A. Synthesis of Catalytic Materials in Flames: Opportunities and Challenges. Chem. Soc. Rev. 2016, 45, 3053–3068. [Google Scholar] [CrossRef]
  47. Athanassiou, E.K.; Grass, R.N.; Stark, W.J. Chemical Aerosol Engineering as a Novel Tool for Material Science: From Oxides to Salt and Metal Nanoparticles. Aerosol Sci. Technol. 2010, 44, 161–172. [Google Scholar] [CrossRef]
  48. Wang, X.-Q.; Chen, Q.; Zhou, Y.-J.; Li, H.-M.; Fu, J.-W.; Liu, M. Cu-Based Bimetallic Catalysts for CO2 Reduction Reaction. Adv. Sens. Energy Mater. 2022, 1, 100023. [Google Scholar] [CrossRef]
  49. Ali, S.; Razzaq, A.; Kim, H.; In, S.-I. Activity, Selectivity, and Stability of Earth-Abundant CuO/Cu2O/Cu0-Based Photocatalysts toward CO2 Reduction. Chem. Eng. J. 2022, 429, 131579. [Google Scholar] [CrossRef]
  50. Pedersen, O.; Colmer, T.; Sand-Jensen, K. Underwater Photosynthesis of Submerged Plants—Recent Advances and Methods. Front. Plant Sci. 2013, 4, 140. [Google Scholar] [CrossRef]
  51. Pan, H.; Heagy, M.D. Photons to Formate: A Review on Photocatalytic Reduction of CO2 to Formic Acid. Nanomaterials 2020, 10, 2422. [Google Scholar] [CrossRef]
  52. Pan, H.; Chowdhury, S.; Premachandra, D.; Olguin, S.; Heagy, M.D. Semiconductor Photocatalysis of Bicarbonate to Solar Fuels: Formate Production from Copper (I) Oxide. ACS Sustain. Chem. Eng. 2018, 6, 1872–1880. [Google Scholar] [CrossRef]
  53. Hathaway, B.J.; Billing, D.E. The Electronic Properties and Stereochemistry of Mono-Nuclear Complexes of the Copper(II) Ion. Coord. Chem. Rev. 1970, 5, 143–207. [Google Scholar] [CrossRef]
  54. Peisach, J.; Blumberg, W.E. Structural Implications Derived from the Analysis of Electron Paramagnetic Resonance Spectra of Natural and Artificial Copper Proteins. Arch. Biochem. Biophys. 1974, 165, 691–708. [Google Scholar] [CrossRef]
  55. Conrad, F. Microwave-Assisted Synthesis of Nanostructured Gallium Oxide Materials. Ph.D. Thesis, University of Zurich, Zürich, Switzerland, 2012. [Google Scholar] [CrossRef]
  56. Sharpe, P.K.; Vickerman, J.C. Solid State Properties of Copper Containing Spinel Solid Solutions (CuxMg1XAl2O4). J. Chem. Soc. Faraday Trans. 1 Phys. Chem. Condens. Phases 1977, 73, 505. [Google Scholar] [CrossRef]
  57. Godiksen, A.; Vennestrøm, P.N.R.; Rasmussen, S.B.; Mossin, S. Identification and Quantification of Copper Sites in Zeolites by Electron Paramagnetic Resonance Spectroscopy. Top. Catal. 2017, 60, 13–29. [Google Scholar] [CrossRef]
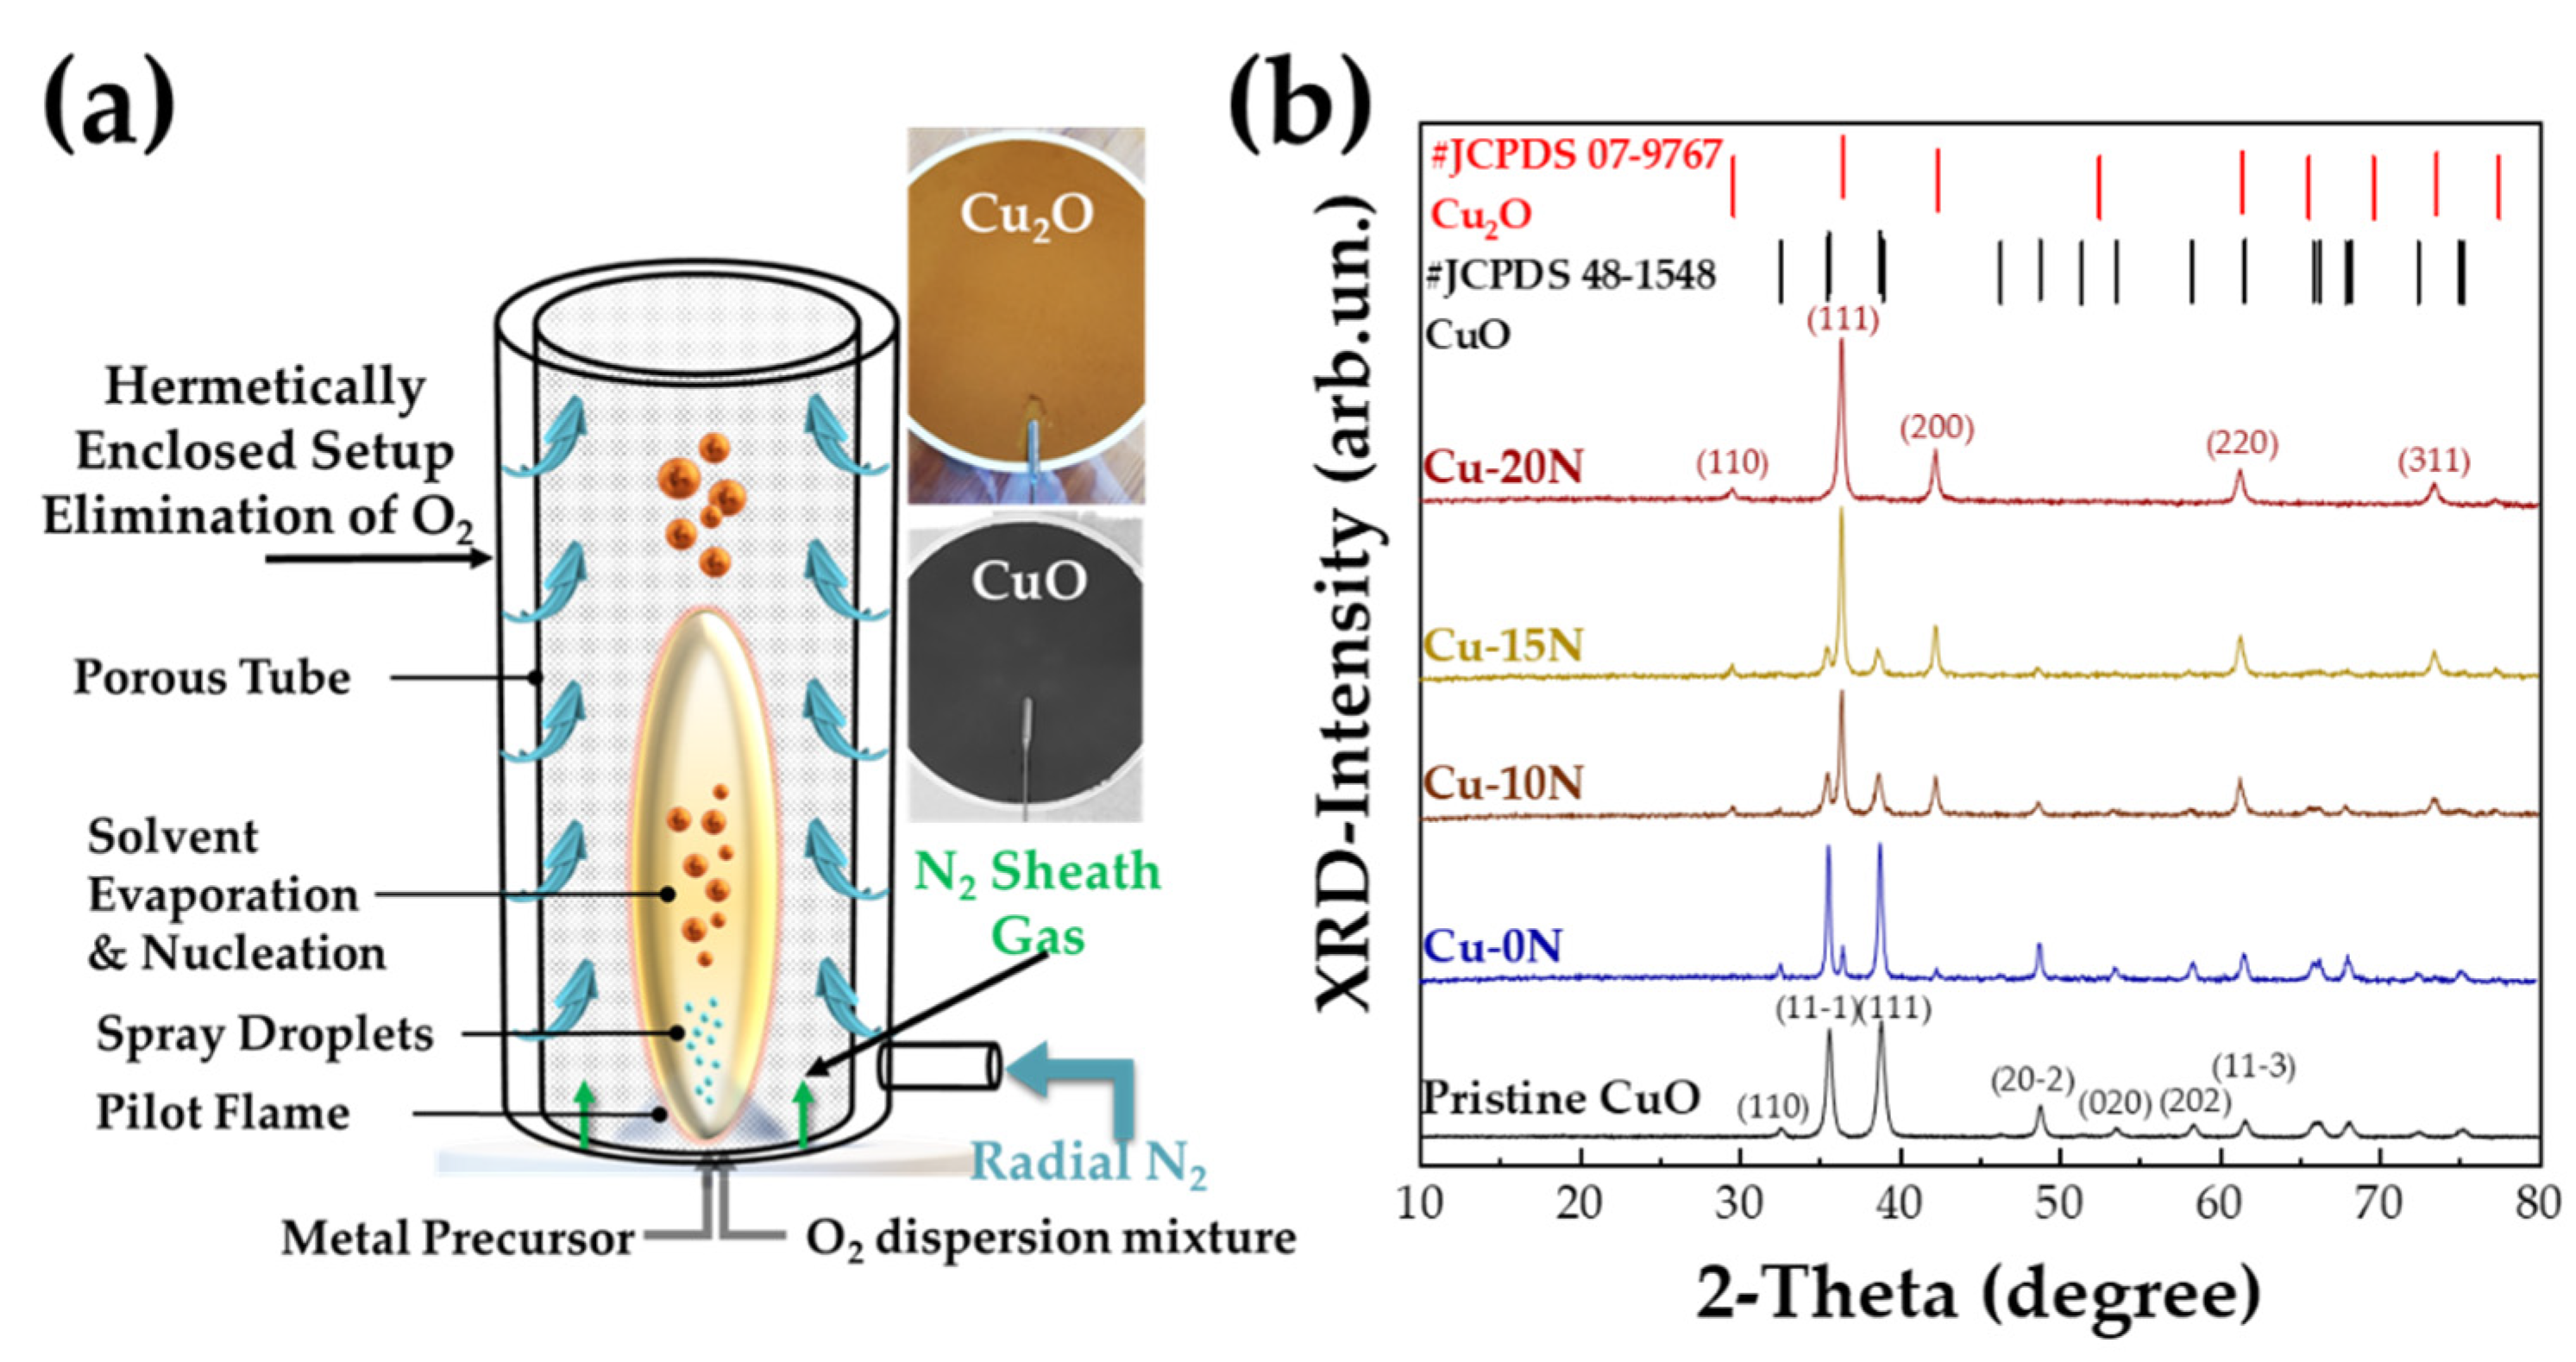
Figure 1. (a) Anoxic FSP reactor set-up used for the synthesis of CuO, Cu2O nanomaterials. The photos are the as-produced CuO and Cu2O powders on the FSP filter; (b) XRD patterns of our Cu-oxide nanomaterials.
Nanomaterials 13 01773 g001
Figure 2. Release of Cu2+ atoms in solution, determined by ASV. The percentages show the fraction of Cu ions released vs. the Cu ion content of the added Cu oxide, in each experiment. (a) Release of Cu2+ ions by CuO and Cu2O (material Cu-20N) dissolution versus pH values, from highly acidic (pH:2) to slightly basic (pH:10), for an incubation time of 3 h. (b,c) Release of Cu2+ ions by CuO and Cu2O (material Cu-20N) in H2O pH:8, under the effect of Xenon-light photons (hv > 200 nm and hv > 340 nm).
Nanomaterials 13 01773 g002
Figure 3. Release of Cu2+ ions in solution, in the presence of 30 mM NaHCO3, determined by ASV. (a) % of Cu2+-ions release by CuO versus time, in H2O pH 8, in the dark or under illumination. (b) % of Cu2+-ions release by Cu2O (material Cu-20N) in H2O pH:8 versus time, in dark or under illumination (hv > 200 nm and hv > 340 nm).
Nanomaterials 13 01773 g003
Figure 4. (a) 77K-EPR spectra for Cu2+ ions release from irradiated Cu2O particles in the absence of the presence of 30 mM NaHCO3. The same samples as those used in Figure 2 and Figure 3 and were used. (Solid lines: experimental EPR spectra, dotted lines: theoretical simulations of Cu2+-EPR using the Spin Hamiltonian parameter listed in Table 2). (b) The relation between g// and A// parameters for Cu2+ ions in the presence and absence of HCO3.
Nanomaterials 13 01773 g004
Figure 5. (a) % of Cu2+-ions release by Cu2O (material Cu-20N) versus irradiation time (hv > 200 nm) in H2O pH 8, in the presence of NaHCO3 or NaHCO3 plus 2-propanol. (b) XRD patterns by Cu2O (material Cu-20N) after 3 h irradiation in presence of NaHCO3 or NaHCO3 plus 2-propanol.
Nanomaterials 13 01773 g005
Table 1. Structural characteristics of the FSP-made Cu-oxide nanomaterials.
Radial N2 (L min−1)CuO (%)Cu2O (%)dXRD CuO (nm)dXRD Cu2O (nm)
Pristine CuO-100 ± 1-20 ± 1-
Cu-0N090 ± 210 ± 229 ± 134 ± 1
Cu-10N1060 ± 240 ± 221 ± 130 ± 1
Cu-15N1540 ± 360 ± 222 ± 131 ± 1
Cu-20N (Cu2O)205 ± 395 ± 2-25 ± 1
Table 2. Spin Hamiltonian EPR parameters used to simulate the Cu2+-EPR spectra for the atoms released from Cu2O nanomaterials.
g [gx, gy, gz]Az = A//GaussReference
Cu2+ from Cu2O + hv (Xenon > 200 nm)gx = gy = g̝⊥ = 2.08
gz = g// = 2.4
144This work
Cu2+ from Cu2O + hv (Xenon > 200 nm) + NaHCO3gx = 2.055
gy = 2.074
gz = g// = 2.342
162This work
Cu2+ + H2O (pH:2)gx = 2.078
gy = 2.078
gz = g// = 2.42
126[29]
(Cu2+ in zeolites) Cu-CHA hydratedgx = gy = g̝⊥ = 2.07
gz = g// = 2.394
157[57]
(Cu2+ in zeolites) Cu-MOR hydratedgx = gy = g̝⊥ = 2.08
gz = g// = 2.4
154[57]
Table 3. XRD analysis of Cu2O particles before and after the photocatalytic/photocorrosion process.
Material CuO
(%)
Cu2O
(%)
dXRD CuO
(nm)
dXRD Cu2O
(nm)
Cu2O (Cu-20N)5 ± 395 ± 3-25 ± 1
Cu2O + 30 mM NaHCO3 + hv > 200 nm60 ± 340 ± 317 ± 126 ± 1
Cu2O + 30 mM NaHCO3 + hv > 200 nm + 2-propanol25 ± 375 ± 38 ± 133 ± 1
Disclaimer/Publisher’s Note: The statements, opinions and data contained in all publications are solely those of the individual author(s) and contributor(s) and not of MDPI and/or the editor(s). MDPI and/or the editor(s) disclaim responsibility for any injury to people or property resulting from any ideas, methods, instructions or products referred to in the content.