

One-Step Hydrothermal Synthesis of Cu2ZnSnS4 Nanoparticles as an Efficient Visible Light Photocatalyst for the Degradation of Congo Red Azo Dye

 ,
,  and
and 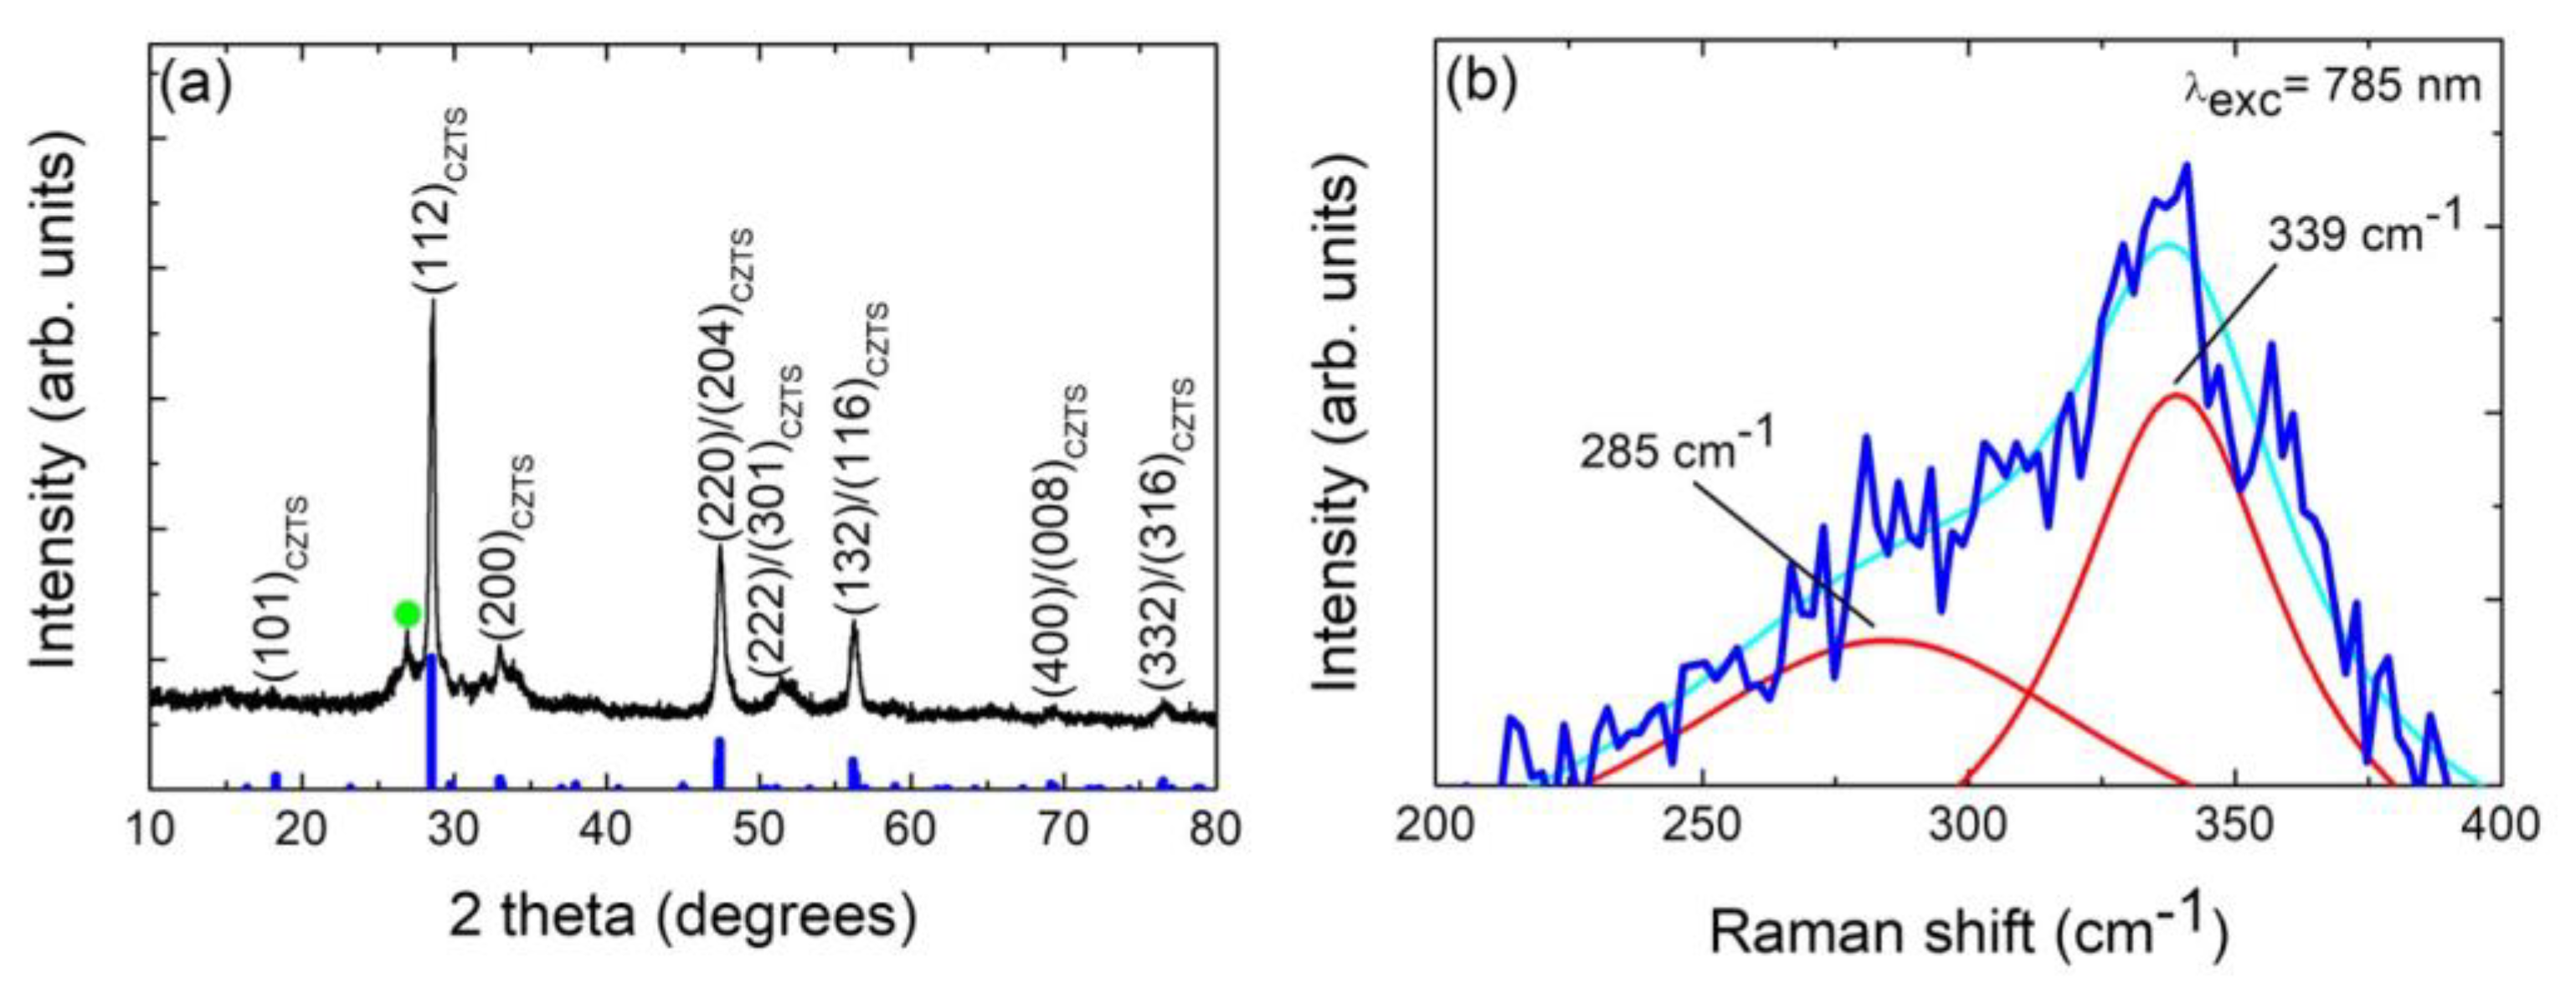
Abstract
1. Introduction
2. Materials and Methods
2.1. Hydrothermal Synthesis
2.2. Characterization of CZTS Nanoparticles
2.3. Photodegradation of Congo Red Azo Dye (CR)
2.4. Photocatalyst Regeneration Study
3. Results
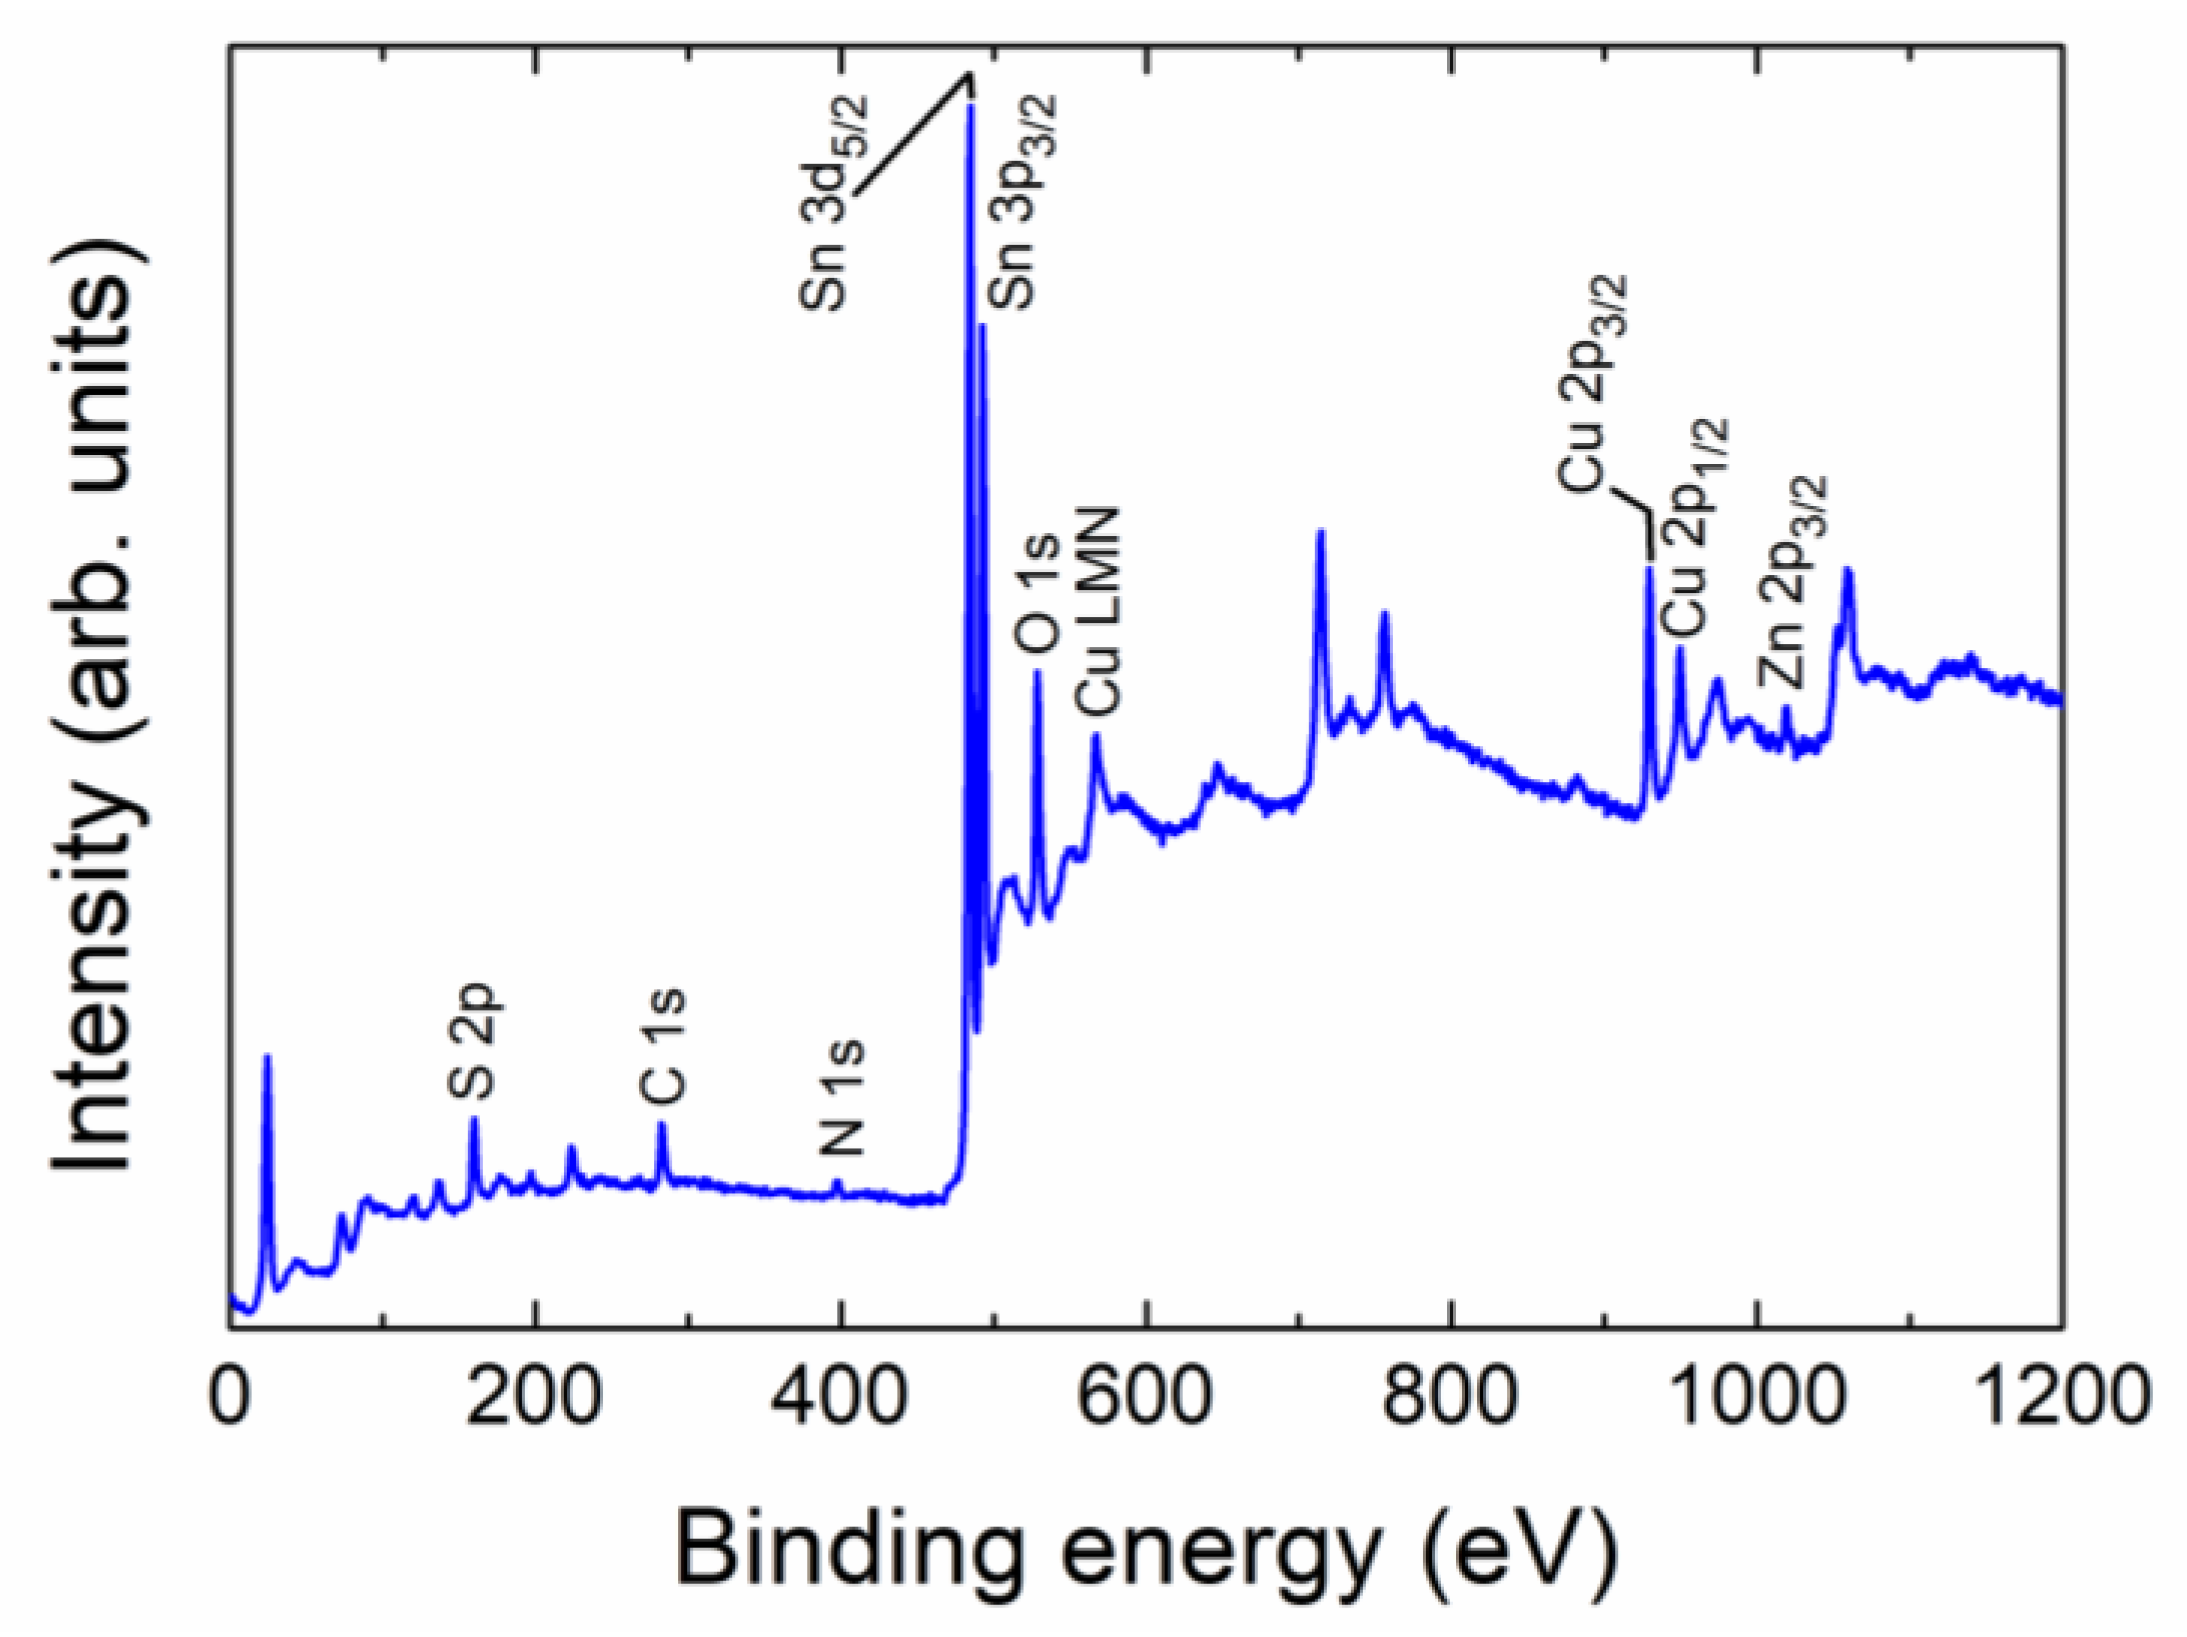
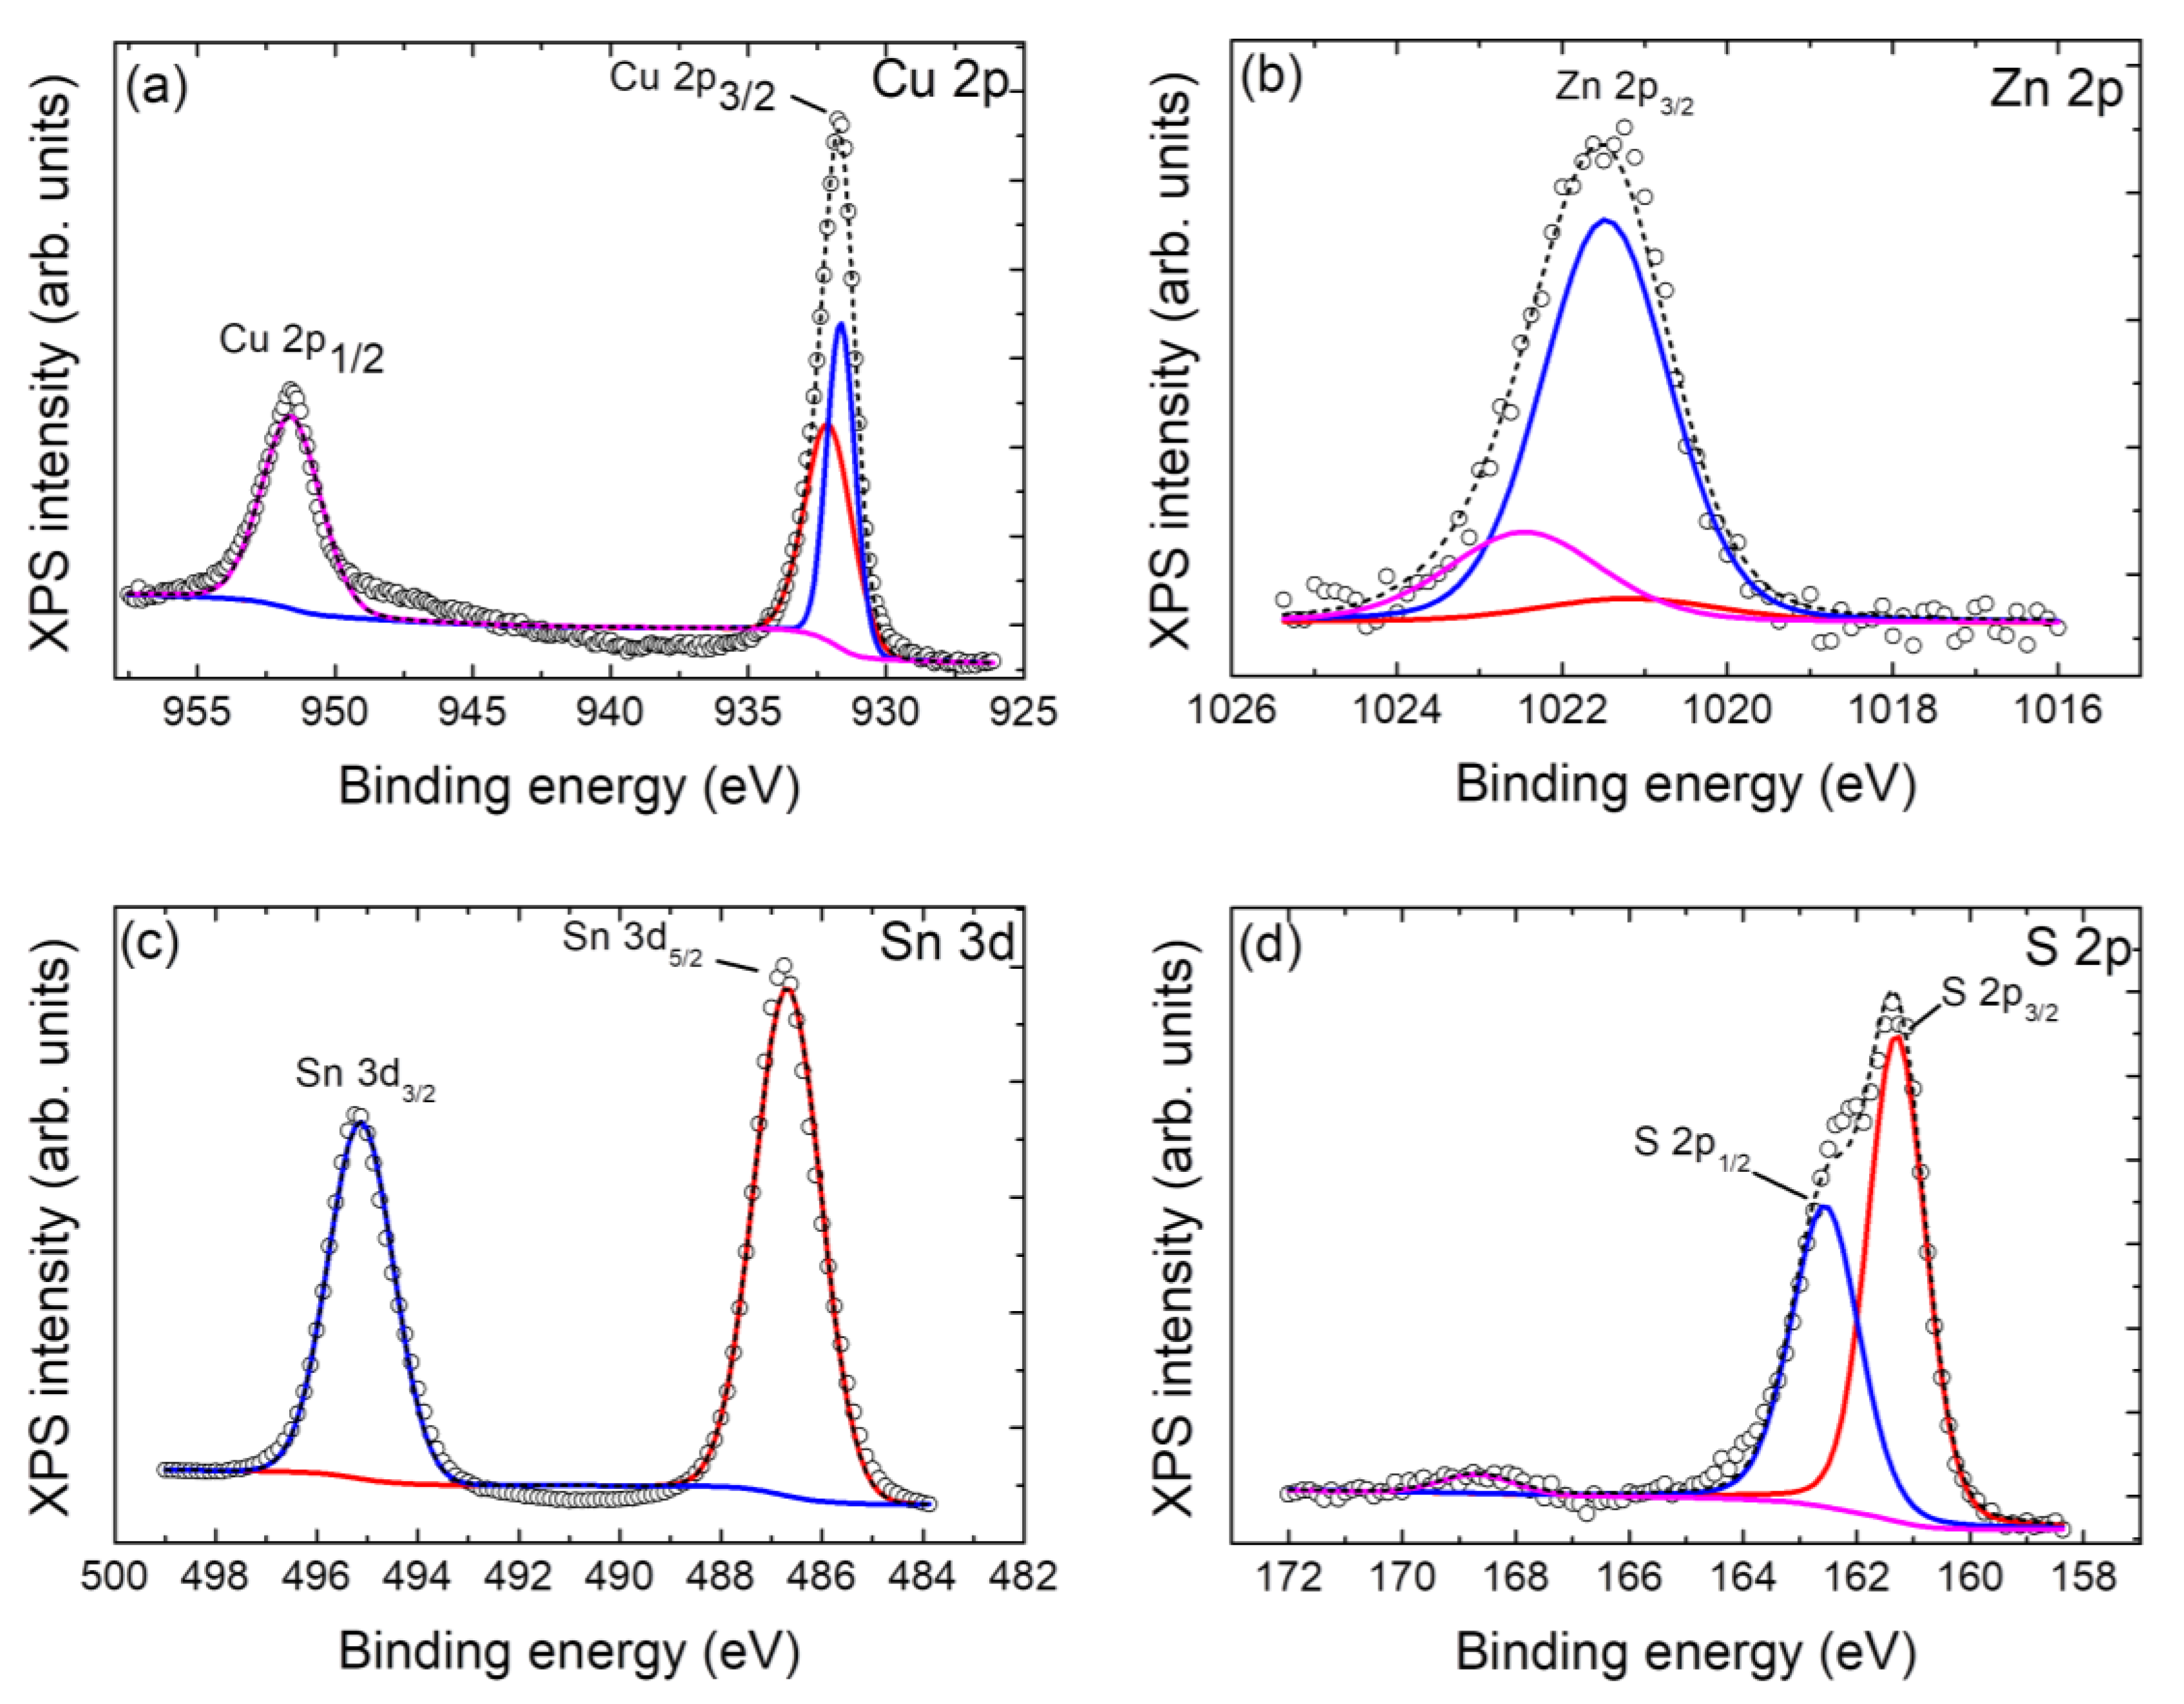
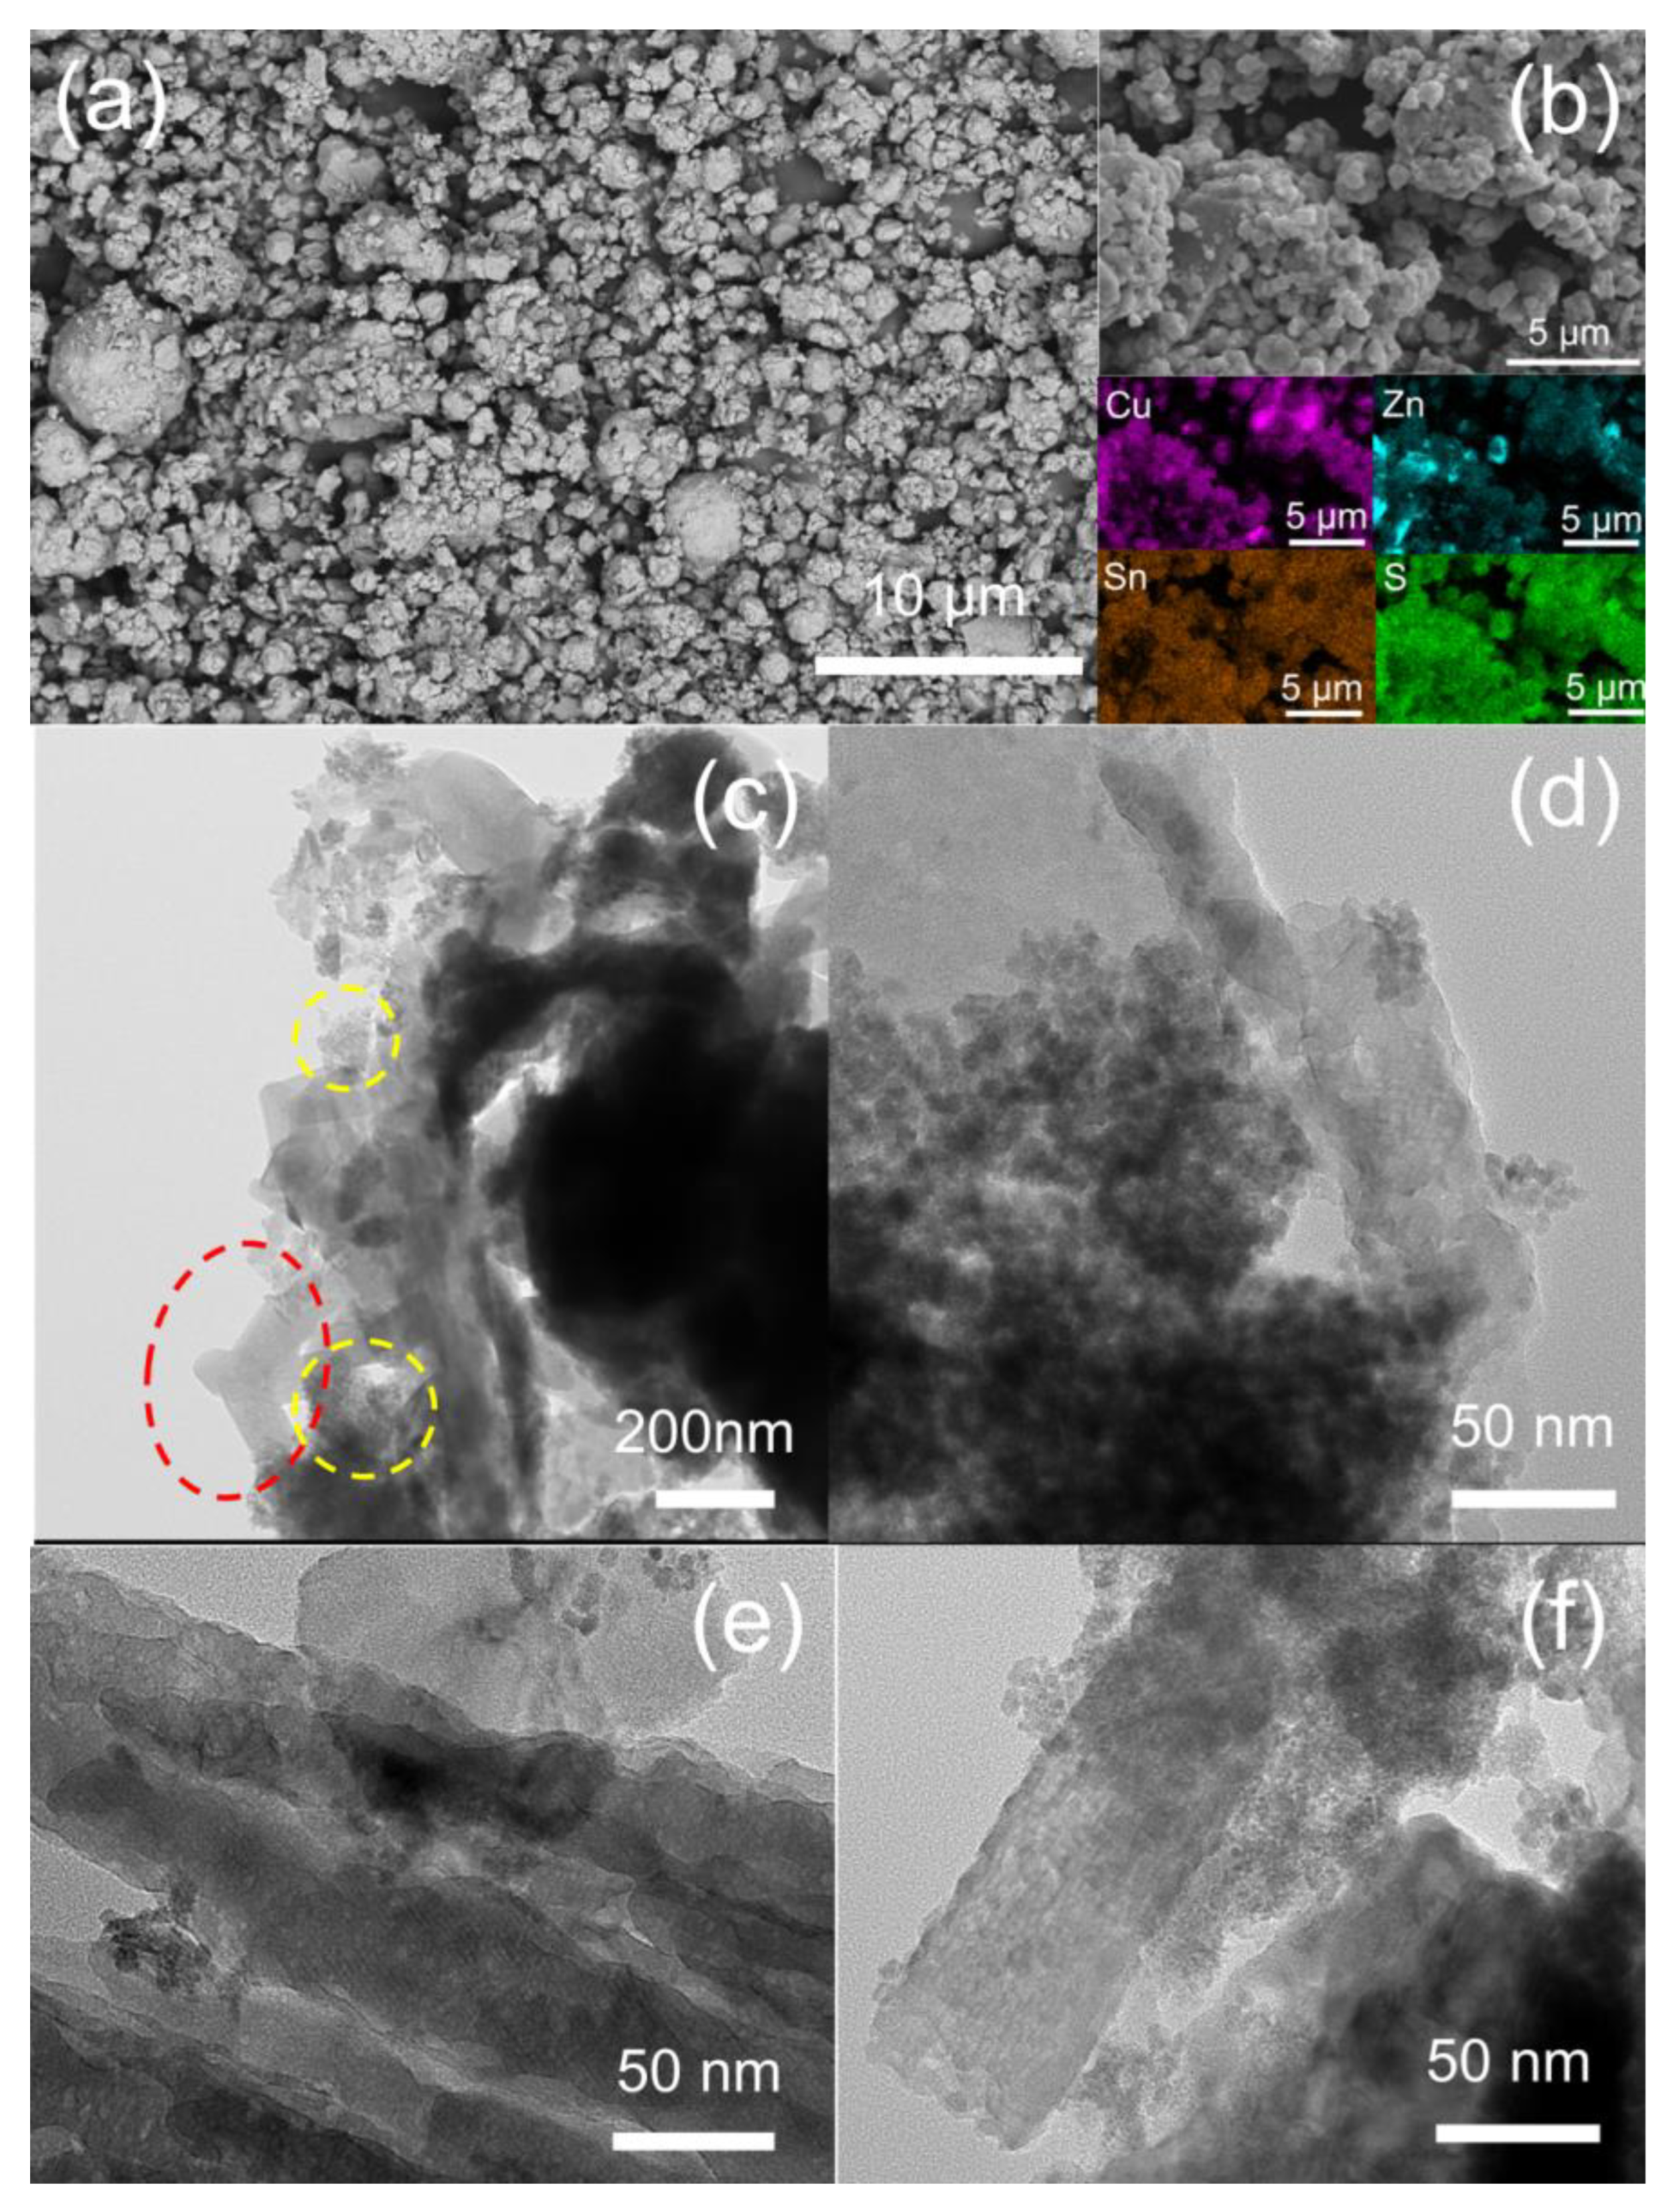
3.1. Structural, Morphological, and Surface Chemical Study
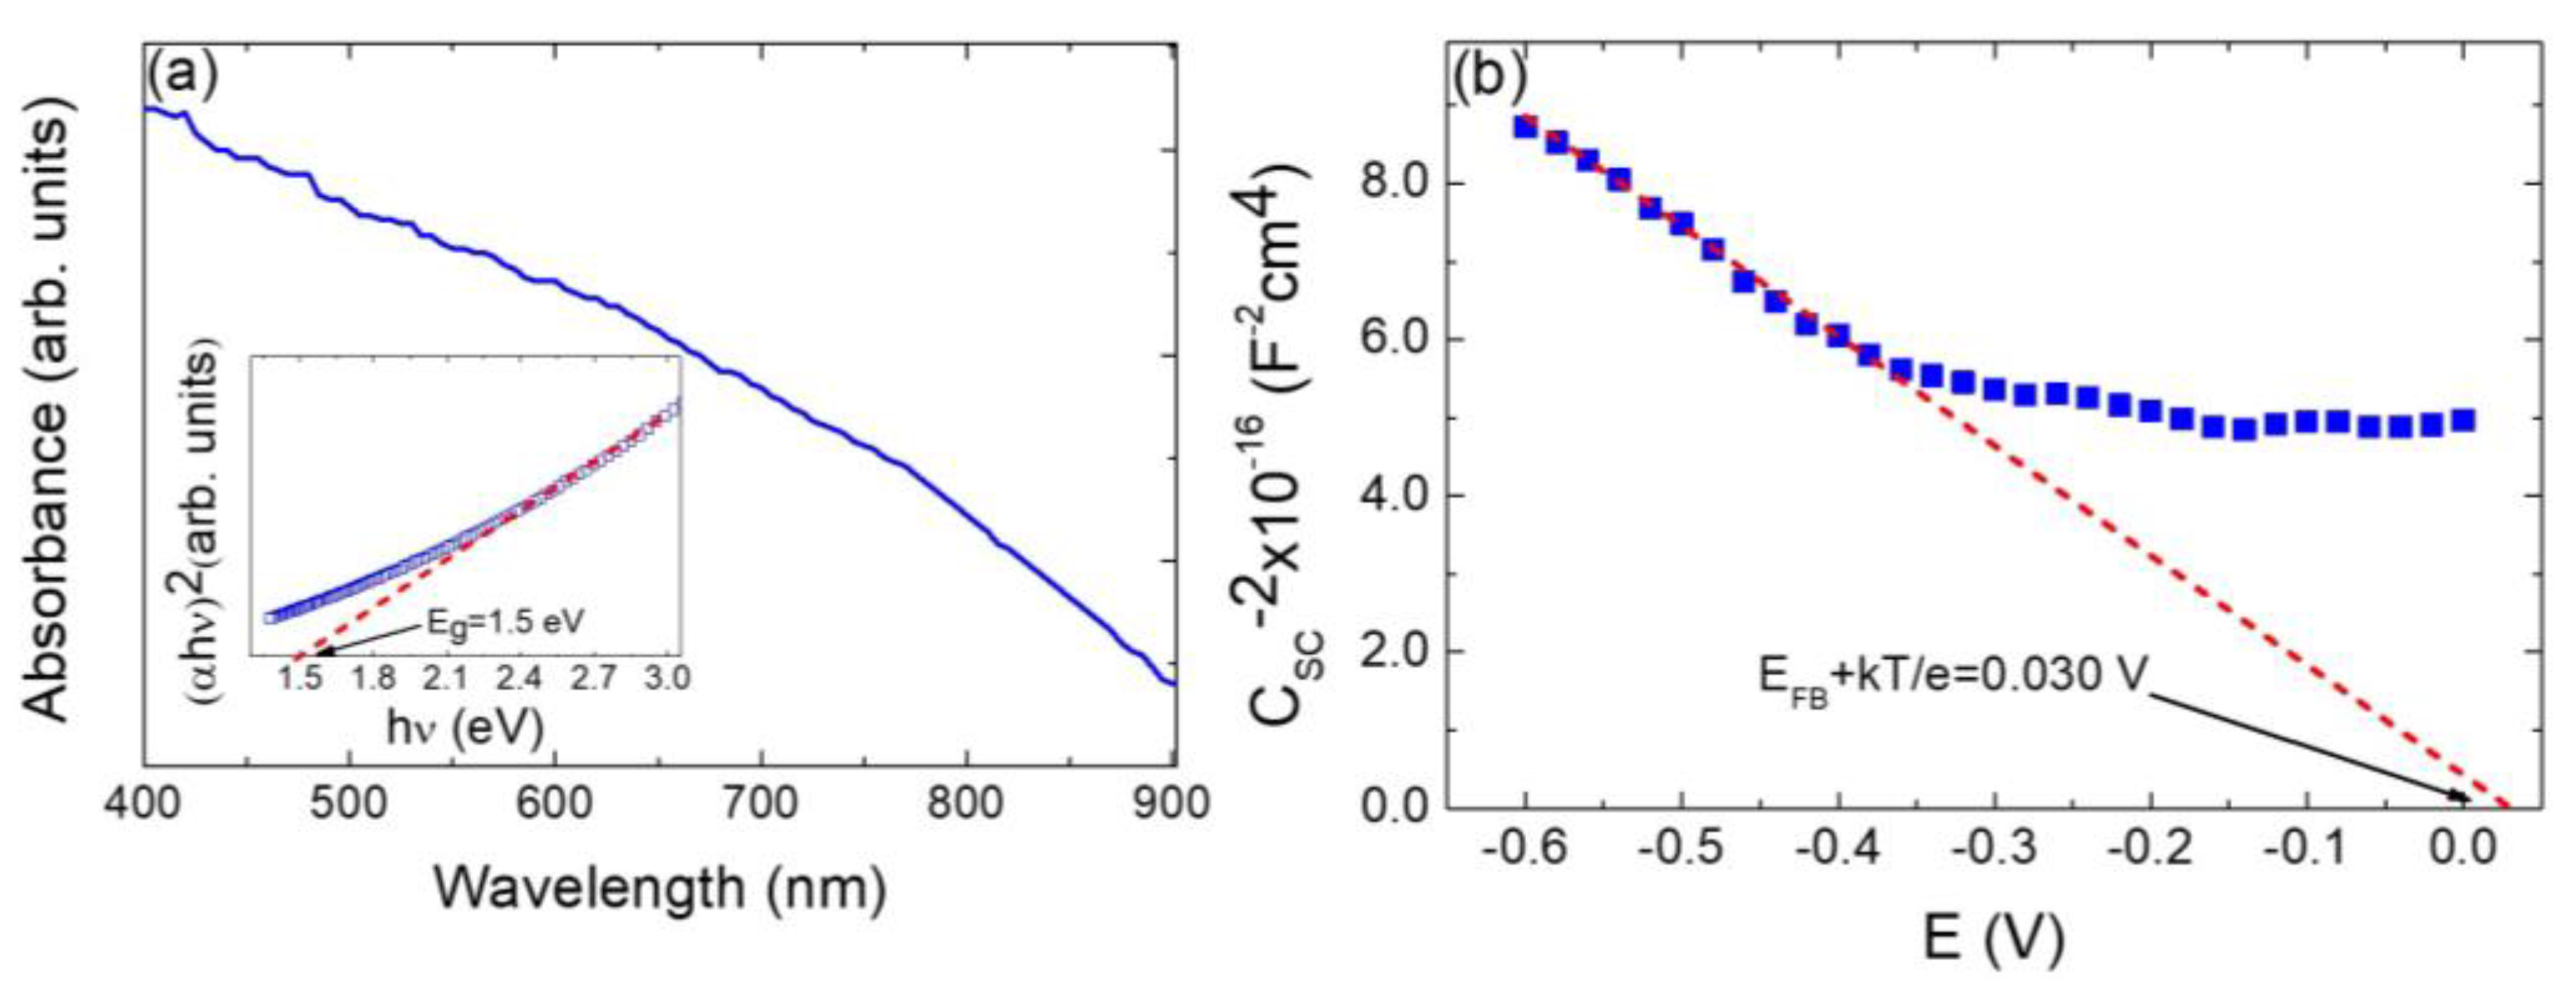
3.2. Optoelectronic Characterization
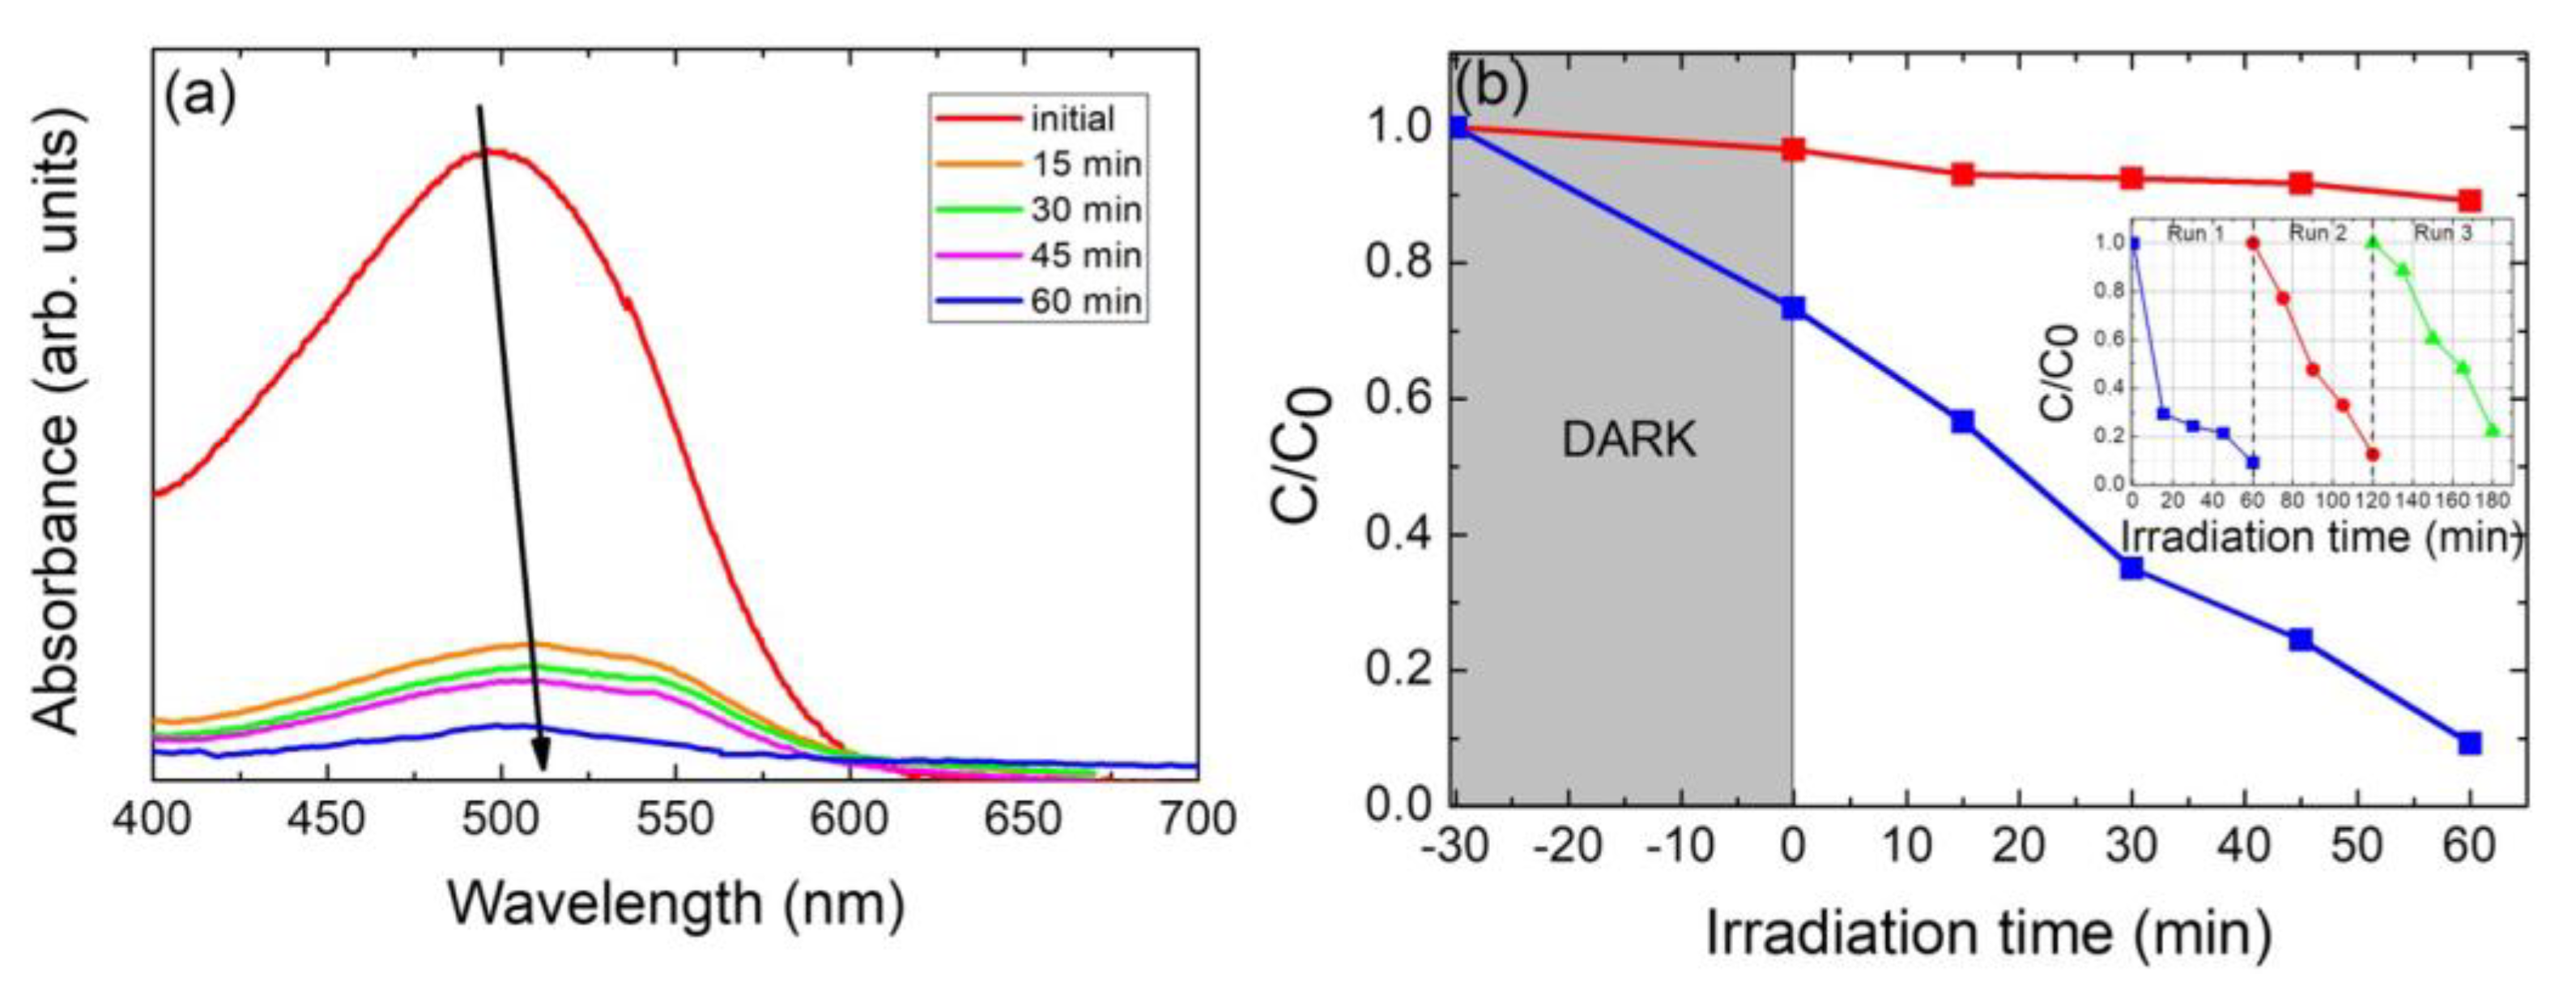
3.3. Photocatalytic Activity Evaluation
4. Conclusions
Author Contributions
Funding
Data Availability Statement
Acknowledgments
Conflicts of Interest
References
- He, M.; Yan, C.; Li, J.; Suryawanshi, M.P.; Kim, J.; Green, M.A.; Hao, X. Kesterite Solar Cells: Insights into Current Strategies and Challenges. Adv. Sci. 2021, 8, 2004313. [Google Scholar] [CrossRef] [PubMed]
- Wang, A.; He, M.; Green, M.A.; Sun, K.; Hao, X. A Critical Review on the Progress of Kesterite Solar Cells: Current Strategies and Insights. Adv. Energy Mater. 2023, 13, 2203046. [Google Scholar] [CrossRef]
- Zhao, Y.; Yu, Z.; Hu, J.; Zheng, Z.; Ma, H.; Sun, K.; Hao, X.; Liang, G.; Fan, P.; Zhang, X.; et al. Over 12% efficient kesterite solar cell via back interface engineering. J. Energy Chem. 2022, 75, 321–329. [Google Scholar] [CrossRef]
- Zaki, M.Y.; Sava, F.; Simandan, I.-D.; Buruiana, A.T.; Stavarache, I.; Bocirnea, A.E.; Mihai, C.; Velea, A.; Galca, A.-C. A Two-Step Magnetron Sputtering Approach for the Synthesis of Cu2ZnSnS4 Films from Cu2SnS3\ZnS Stacks. ACS Omega 2022, 7, 23800–23814. [Google Scholar] [CrossRef]
- Altaf, C.T.; Abdullayeva, N.; Sankir, N.D.; Sankir, N.D. Copper-Based Chalcopyrite and Kesterite Materials for Solar Hydrogen Generation. In Photoelectrochemical Solar Cells; John Wiley & Sons, Ltd.: Hoboken, NJ, USA, 2018; pp. 251–303. ISBN 9781119460008. [Google Scholar]
- Valdés, M.; Hernández, A.; Sánchez, Y.; Fonoll, R.; Placidi, M.; Izquierdo, V.; Cabas-Vidani, A.; Valentini, M.; Mittiga, A.; Pistor, P.; et al. A new approach for alkali incorporation in Cu2ZnSnS4 solar cells. J. Phys. Energy 2022, 4, 44008. [Google Scholar] [CrossRef]
- Todorov, T.; Hillhouse, H.W.; Aazou, S.; Sekkat, Z.; Vigil-Galán, O.; Deshmukh, S.D.; Agrawal, R.; Bourdais, S.; Valdés, M.; Arnou, P.; et al. Solution-based synthesis of kesterite thin film semiconductors. J. Phys. Energy 2020, 2, 12003. [Google Scholar] [CrossRef]
- Mamta; Maurya, K.K.; Singh, V.N. Comparison of Various Thin-Film-Based Absorber Materials: A Viable Approach for Next-Generation Solar Cells. Coatings 2022, 12, 405. [Google Scholar] [CrossRef]
- Al Zoubi, T.; Al-Gharram, M.; Moustafa, M. Insights into the impact of defect states and temperature on the performance of kesterite-based thin-film solar cells. Optik 2022, 264, 169442. [Google Scholar] [CrossRef]
- Nazligul, A.S.; Wang, M.; Choy, K.L. Recent Development in Earth-Abundant Kesterite Materials and Their Applications. Sustainability 2020, 12, 5138. [Google Scholar] [CrossRef]
- Oueslati, S.; Pilvet, M.; Grossberg, M.; Kauk-Kuusik, M.; Krustok, J.; Meissner, D. Kesterite monograins for solar cells and water splitting applications. Thin Solid Films 2021, 739, 138981. [Google Scholar] [CrossRef]
- Apostolopoulou, A.; Mahajan, S.; Sharma, R.; Stathatos, E. Novel development of nanocrystalline kesterite Cu2ZnSnS4 thin film with high photocatalytic activity under visible light illumination. J. Phys. Chem. Solids 2018, 112, 37–42. [Google Scholar] [CrossRef]
- Zaman, M.B.; Mir, R.A.; Poolla, R. Growth and properties of solvothermally derived highly crystalline Cu2ZnSnS4 nanoparticles for photocatalytic and electrocatalytic applications. Int. J. Hydrogen Energy 2019, 44, 23023–23033. [Google Scholar] [CrossRef]
- Alirezazadeh, F.; Sheibani, S. Facile mechano-chemical synthesis and enhanced photocatalytic performance of Cu2ZnSnS4 nanopowder. Ceram. Int. 2020, 46, 26715–26723. [Google Scholar] [CrossRef]
- Hunge, Y.M.; Yadav, A.A.; Liu, S.; Mathe, V.L. Sonochemical synthesis of CZTS photocatalyst for photocatalytic degradation of phthalic acid. Ultrason. Sonochem. 2019, 56, 284–289. [Google Scholar] [CrossRef]
- Sun, K.; Zhao, X.; Zhang, Y.; Wu, D.; Zhou, X.; Xie, F.; Tang, Z.; Wang, X. Enhanced photocarrier separation in novel Z-scheme Cu2ZnSnS4/Cu2O heterojunction for excellent photocatalyst hydrogen generation. Mater. Chem. Phys. 2020, 251, 123172. [Google Scholar] [CrossRef]
- Semalti, P.; Sharma, V.; Sharma, S.N. A novel method of water remediation of organic pollutants and industrial wastes by solution-route processed CZTS nanocrystals. J. Mater. 2021, 7, 904–919. [Google Scholar] [CrossRef]
- Raza, A.; Shen, H.; Haidry, A.A.; Shahzad, M.K.; Liu, R.; Cui, S. In-situ synthesis of mesoporous TiO2-Cu2ZnSnS4 heterostructured nanocomposite for enhanced photocatalytic degradation. Appl. Surf. Sci. 2020, 505, 144540. [Google Scholar] [CrossRef]
- Xi, Z.-H.; Zhao, Y. Fabrication of Ti3+/TNS-CZTS heterostructures nanosheet arrays for photocatalytic enhancement. Vacuum 2022, 201, 111117. [Google Scholar] [CrossRef]
- Mudike, R.; Sabbanahalli, C.; Sriramoju, J.B.; Bheemaraju, A.; Halligudra, G.; Muniyappa, M.; Narayanaswamy, M.P.; Kumar, C.A.; Shivaramu, P.D.; Rangappa, D. Copper zinc tin sulfide and multi-walled carbon nanotubes nanocomposite for visible-light-driven photocatalytic applications. Mater. Res. Bull. 2022, 146, 111606. [Google Scholar] [CrossRef]
- Jain, S.; Singh, A.; Gupta, G.; Vijayan, N.; Sharma, S.N. Precursor ratio optimizations for the synthesis of colloidal CZTS nanoparticles for photocatalytic degradation of malachite green. J. Phys. Chem. Solids 2018, 122, 8–18. [Google Scholar] [CrossRef]
- Mary, C.I.; Senthilkumar, M.; Manobalaji, G.; Prasanna, M.S.; Babu, S.M. Effect of different nanostructures of Cu2ZnSnS4 on visible light-driven photocatalytic degradation of organic pollutants. J. Mater. Sci. Mater. Electron. 2022, 33, 894–906. [Google Scholar] [CrossRef]
- Hou, Z.; Li, Y.; Liu, J.; Shen, H.; Huo, X. The visible light-driven highly efficient photocatalytic properties of Cu2ZnSnS4 nanoparticles synthesized by a hydrothermal method. New J. Chem. 2021, 45, 1743–1752. [Google Scholar] [CrossRef]
- Tiong, V.T.; Bell, J.; Wang, H. One-step synthesis of high quality kesterite Cu2ZnSnS4 nanocrystals—A hydrothermal approach. Beilstein J. Nanotechnol. 2014, 5, 438–446. [Google Scholar] [CrossRef]
- Patro, B.; Vijaylakshmi, S.; Reddy, R.K.; Sharma, P. Microwave-assisted solvothermal synthesis of Cu2ZnSnS4 (CZTS) nanocrystals for photovoltaic applications. Mater. Today Proc. 2016, 3, 2786–2794. [Google Scholar] [CrossRef]
- Gong, Z.; Han, Q.; Li, J.; Hou, L.; Bukhtiar, A.; Yang, S.; Zou, B. A solvothermal route to synthesize kesterite Cu2ZnSnS4 nanocrystals for solution-processed solar cells. J. Alloys Compd. 2016, 663, 617–623. [Google Scholar] [CrossRef]
- Merrad, S.; Abbas, M.; Brahimi, R.; Trari, M. Study of Congo Red removal from aqueous solution by using the deficient perovskite SrTiO3-δ under solar light. J. Mol. Struct. 2022, 1265, 133349. [Google Scholar] [CrossRef]
- Zhou, Y.; Ge, L.; Fan, N.; Xia, M. Adsorption of Congo red from aqueous solution onto shrimp shell powder. Adsorpt. Sci. Technol. 2018, 36, 1310–1330. [Google Scholar] [CrossRef]
- Yahya, N.; Aziz, F.; Jamaludin, N.; Mutalib, M.A.; Ismail, A.; Salleh, W.W.; Jaafar, J.; Yusof, N.; Ludin, N.A. A review of integrated photocatalyst adsorbents for wastewater treatment. J. Environ. Chem. Eng. 2018, 6, 7411–7425. [Google Scholar] [CrossRef]
- Khan, A.; Shah, S.J.; Mehmood, K.; Awais; Ali, N.; Khan, H. Synthesis of potent chitosan beads a suitable alternative for textile dye reduction in sunlight. J. Mater. Sci. Mater. Electron. 2019, 30, 406–414. [Google Scholar] [CrossRef]
- Maksoud, M.I.A.A.; Fahim, R.A.; Bedir, A.G.; Osman, A.I.; Abouelela, M.M.; El-Sayyad, G.S.; Elkodous, M.A.; Mahmoud, A.S.; Rabee, M.M.; Al-Muhtaseb, A.H.; et al. Engineered magnetic oxides nanoparticles as efficient sorbents for wastewater remediation: A review. Environ. Chem. Lett. 2022, 20, 519–562. [Google Scholar] [CrossRef]
- Maksoud, M.I.A.A.; El-Sayyad, G.S.; El-Khawaga, A.M.; Elkodous, M.A.; Abokhadra, A.; Elsayed, M.A.; Gobara, M.; Soliman, L.I.; El-Bahnasawy, H.H.; Ashour, A.H. Nanostructured Mg substituted Mn-Zn ferrites: A magnetic recyclable catalyst for outstanding photocatalytic and antimicrobial potentials. J. Hazard. Mater. 2020, 399, 123000. [Google Scholar] [CrossRef] [PubMed]
- Elkodous, M.A.; El-Khawaga, A.M.; Abouelela, M.M.; Maksoud, M.I.A.A. Cocatalyst loaded Al-SrTiO3 cubes for Congo red dye photo-degradation under wide range of light. Sci. Rep. 2023, 13, 6331. [Google Scholar] [CrossRef] [PubMed]
- Riha, S.C.; Parkinson, B.A.; Prieto, A.L. Solution-Based Synthesis and Characterization of Cu2ZnSnS4 Nanocrystals. J. Am. Chem. Soc. 2009, 131, 12054–12055. [Google Scholar] [CrossRef] [PubMed]
- Cullity, B.D. Elements of X-ray Diffraction, 2nd ed.; Addison-Wesley Publishing Company Inc.: Reading, MA, USA, 1978; Volume 100–105, pp. 277–279. [Google Scholar]
- Henríquez, R.; Vásquez, C.; Muñoz, E.; Grez, P.; Martín, F.; Ramos-Barrado, J.R.; Dalchiele, E.A. Phase-pure iron pyrite (FeS2) micro- and nano-sized crystals synthesized by simple one-step microwave-assisted hydrothermal method. Phys. E Low-Dimens. Syst. Nanostruct. 2020, 118, 113881. [Google Scholar] [CrossRef]
- Li, Z.-S.; Wang, S.-R.; Jiang, Z.; Yang, M.; Lu, Y.-L.; Liu, S.-J.; Zhao, Q.-C.; Hao, R.-T. Cu2ZnSnS4 solar cells prepared by sulfurization of sputtered ZnS/Sn/CuS precursors. Phys. B Condens. Matter 2016, 502, 56–60. [Google Scholar] [CrossRef]
- Su, Z.; Sun, K.; Han, Z.; Cui, H.; Liu, F.; Lai, Y.; Li, J.; Hao, X.; Liu, Y.; Green, M.A. Fabrication of Cu2ZnSnS4 solar cells with 5.1% efficiency via thermal decomposition and reaction using a non-toxic sol–gel route. J. Mater. Chem. A 2014, 2, 500–509. [Google Scholar] [CrossRef]
- Ziti, A.; Hartiti, B.; Labrim, H.; Fadili, S.; Batan, A.; Tahri, M.; Ridah, A.; Mounkachi, O.; Benyoussef, A.; Thevenin, P. Characteristics of kesterite CZTS thin films deposited by dip-coating technique for solar cells applications. J. Mater. Sci. Mater. Electron. 2019, 30, 13134–13143. [Google Scholar] [CrossRef]
- Fernandes, P.A.; Salomé, P.M.P.; da Cunha, A.F. Study of polycrystalline Cu2ZnSnS4 films by Raman scattering. J. Alloys Compd. 2011, 509, 7600–7606. [Google Scholar] [CrossRef]
- Deepa, K.G.; Ramamurthy, P.C.; Singha, M.K. Mesoporous Cu2ZnSnS4 nanoparticle film as a flexible and reusable visible light photocatalyst. Opt. Mater. 2019, 98, 109492. [Google Scholar] [CrossRef]
- Vishwakarma, M.; Thota, N.; Karakulina, O.; Hadermann, J.; Mehta, B.R. Role of graphene inter layer on the formation of the MoS2-CZTS interface during growth. AIP Conf. Proc. 2018, 1953, 100064. [Google Scholar] [CrossRef]
- Schorr, S.; Gurieva, G.; Guc, M.; Dimitrievska, M.; Pérez-Rodríguez, A.; Izquierdo-Roca, V.; Schnohr, C.S.; Kim, J.; Jo, W.; Merino, J.M. Point defects, compositional fluctuations, and secondary phases in non-stoichiometric kesterites. J. Phys. Energy 2020, 2, 12002. [Google Scholar] [CrossRef]
- Chaudhari, J.J.; Joshi, U.S. Fabrication of high-quality kesterite Cu2ZnSnS4 thin films deposited by an optimized sol–gel sulphurization technique for solar cells. J. Mater. Sci. Mater. Electron. 2020, 31, 14411–14420. [Google Scholar] [CrossRef]
- NIST XPS Database. Available online: https://srdata.nist.gov/xps/main_search_menu.aspx (accessed on 10 November 2022).
- Moulder, J.F.; Stickle, W.F.; Sobol, W.M.; Bomben, K.D. Handbook of X-ray Photoelectron Spectroscopy; Perkin-Elmer Corporation, Physical Electronics Division: Eden Prairie, MN, USA, 1992. [Google Scholar]
- Zhang, X.; Guo, G.; Ji, C.; Huang, K.; Zha, C.; Wang, Y.; Shen, L.; Gupta, A.; Bao, N. Efficient Thermolysis Route to Monodisperse Cu2ZnSnS4 Nanocrystals with Controlled Shape and Structure. Sci. Rep. 2014, 4, 5086. [Google Scholar] [CrossRef] [PubMed]
- Pankove, J.I.; Kiewit, D.A. Optical Processes in Semiconductors. J. Electrochem. Soc. 1972, 119, 156Ca. [Google Scholar] [CrossRef]
- Kumarage, W.G.C.; Wijesundera, R.P.; Seneviratne, V.A.; Jayalath, C.P.; Dassanayake, B.S. Tunable optoelectronic properties of CBD-CdS thin films via bath temperature alterations. J. Phys. D. Appl. Phys. 2016, 49, 95109. [Google Scholar] [CrossRef]
- Kisch, H. Chapter 4: Photoelectrochemistry. In Semiconductor Photocatalysis: Principles and Applications; Wiley-VCH: Weinheim, Germany, 2015; p. 59. ISBN 978-3-527-33553-4. [Google Scholar]
- Mudike, R.; Bheemaraju, A.; Rasheed, T.; Singh, N.; Dhage, S.R.; Shivaramu, P.D.; Rangappa, D. Enhanced photocatalysis and photodetection using highly crystalline CZTS thin films optimized using stabilizers. Ceram. Int. 2022, 48, 35666–35675. [Google Scholar] [CrossRef]
- Camara, S.M.; Wang, L.; Zhang, X. Easy hydrothermal preparation of Cu2ZnSnS4 (CZTS) nanoparticles for solar cell application. Nanotechnology 2013, 24, 495401. [Google Scholar] [CrossRef]
- Hou, X.; Li, Y.; Yan, J.-J.; Wang, C.-W. Highly efficient photocatalysis of p-type Cu2ZnSnS4 under visible-light illumination. Mater. Res. Bull. 2014, 60, 628–633. [Google Scholar] [CrossRef]
- Cho, J.W.; Ismail, A.; Park, S.J.; Kim, W.; Yoon, S.; Min, B.K. Synthesis of Cu2ZnSnS4 Thin Films by a Precursor Solution Paste for Thin Film Solar Cell Applications. ACS Appl. Mater. Interfaces 2013, 5, 4162–4165. [Google Scholar] [CrossRef]
- Henríquez, R.; Grez, P.; Muñoz, E.; Dalchiele, E.A.; Marotti, R.E.; Gómez, H. Template-free non-aqueous electrochemical growth of CdO nanorods. Thin Solid Films 2011, 520, 41–46. [Google Scholar] [CrossRef]
- Sivula, K. Mott–Schottky Analysis of Photoelectrodes: Sanity Checks Are Needed. ACS Energy Lett. 2021, 6, 2549–2551. [Google Scholar] [CrossRef]
- Bard, A.J.; Faulkner, L.R. Electrochemical Methods: Fundamentals and Applications, 2nd ed.; John Wiley & Sons, Ltd.: Hoboken, NJ, USA, 2000. [Google Scholar]
- Kisch, H. Chapter 5: Semiconductor Photocatalysis. In Semiconductor Photocatalysis: Principles and Applications; Wiley-VCH: Weinheim, Germany, 2015; p. 112. ISBN 978-3-527-33553-4. [Google Scholar]
- Soleimani, F.; Salehi, M.; Gholizadeh, A. Comparison of visible light photocatalytic degradation of different pollutants by (Zn, Mg)xCu1-xBi2O4 nanoparticles. Ceram. Int. 2019, 45, 8926–8939. [Google Scholar] [CrossRef]
- Putwa, S.; Curtis, I.S.; Dasog, M. Nanostructured silicon photocatalysts for solar-driven fuel production. iScience 2023, 26, 106317. [Google Scholar] [CrossRef] [PubMed]
- Osterloh, F.E.; Parkinson, B.A. Recent developments in solar water-splitting photocatalysis. MRS Bull. 2011, 36, 17–22. [Google Scholar] [CrossRef]
- Khan, J.; Tahir, K.; Wei, Y.; Albalawi, K.; Latif, S.; Abdulaziz, F.; El-Zahhar, A.A.; Saleh, E.A.M.; Al-Shehri, H.S.; Alghamdi, M.M. Preparation of Ca0.1Cu0.90Bi2O4 heterojunction with improved visible light photocatalytic performance of congo red: Kinetics and degradation mechanisms. Inorg. Chem. Commun. 2022, 142, 109607. [Google Scholar] [CrossRef]
- Wang, L.; Li, J.; Wang, Z.; Zhao, L.; Jiang, Q. Low-temperature hydrothermal synthesis of α-Fe/Fe3O4 nanocomposite for fast Congo red removal. Dalt. Trans. 2013, 42, 2572–2579. [Google Scholar] [CrossRef]
- Tian, J.; Tuo, B.; Wang, J.; Tang, Y.; Nie, G.; Yang, Y. Preparation of different crystal types TiO2 materials and its photodegradation performance in Congo Red wastewater. Phase Transit. 2022, 95, 707–725. [Google Scholar] [CrossRef]
- Yang, G.; Yan, Z.; Xiao, T.; Yang, B. Low-temperature synthesis of alkalis doped TiO2 photocatalysts and their photocatalytic performance for degradation of methyl orange. J. Alloys Compd. 2013, 580, 15–22. [Google Scholar] [CrossRef]
- Shin, E.; Jin, S.; Kim, J.; Chang, S.-J.; Jun, B.-H.; Park, K.-W.; Hong, J. Preparation of K-doped TiO2 nanostructures by wet corrosion and their sunlight-driven photocatalytic performance. Appl. Surf. Sci. 2016, 379, 33–38. [Google Scholar] [CrossRef]
- Guo, Y.; Wei, J.; Liu, Y.; Yang, T.; Xu, Z. Surfactant-Tuned Phase Structure and Morphologies of Cu2ZnSnS4 Hierarchical Microstructures and Their Visible-Light Photocatalytic Activities. Nanoscale Res. Lett. 2017, 12, 181. [Google Scholar] [CrossRef]
- Ćurković, L.; Ljubas, D.; Juretić, H. Photocatalytic decolorization kinetics of diazo dye Congo Red aqueous solution by UV/TiO2 nanoparticles. React. Kinet. Mech. Catal. 2010, 99, 201–208. [Google Scholar] [CrossRef]
- Tekin, D. Photocatalytic Degradation Kinetics of Congo Red dye in a Sonophotoreactor with Nanotube TiO2. Prog. React. Kinet. Mech. 2014, 39, 249–261. [Google Scholar] [CrossRef]
- Vandarkuzhali, S.A.A.; Pugazhenthiran, N.; Mangalaraja, R.V.; Sathishkumar, P.; Viswanathan, B.; Anandan, S. Ultrasmall Plasmonic Nanoparticles Decorated Hierarchical Mesoporous TiO2 as an Efficient Photocatalyst for Photocatalytic Degradation of Textile Dyes. ACS Omega 2018, 3, 9834–9845. [Google Scholar] [CrossRef] [PubMed]


Disclaimer/Publisher’s Note: The statements, opinions and data contained in all publications are solely those of the individual author(s) and contributor(s) and not of MDPI and/or the editor(s). MDPI and/or the editor(s) disclaim responsibility for any injury to people or property resulting from any ideas, methods, instructions or products referred to in the content. |
© 2023 by the authors. Licensee MDPI, Basel, Switzerland. This article is an open access article distributed under the terms and conditions of the Creative Commons Attribution (CC BY) license (https://creativecommons.org/licenses/by/4.0/).
Share and Cite
Henríquez, R.; Nogales, P.S.; Moreno, P.G.; Cartagena, E.M.; Bongiorno, P.L.; Navarrete-Astorga, E.; Dalchiele, E.A. One-Step Hydrothermal Synthesis of Cu2ZnSnS4 Nanoparticles as an Efficient Visible Light Photocatalyst for the Degradation of Congo Red Azo Dye. Nanomaterials 2023, 13, 1731. https://doi.org/10.3390/nano13111731
Henríquez R, Nogales PS, Moreno PG, Cartagena EM, Bongiorno PL, Navarrete-Astorga E, Dalchiele EA. One-Step Hydrothermal Synthesis of Cu2ZnSnS4 Nanoparticles as an Efficient Visible Light Photocatalyst for the Degradation of Congo Red Azo Dye. Nanomaterials. 2023; 13(11):1731. https://doi.org/10.3390/nano13111731
Chicago/Turabian StyleHenríquez, Rodrigo, Paula Salazar Nogales, Paula Grez Moreno, Eduardo Muñoz Cartagena, Patricio Leyton Bongiorno, Elena Navarrete-Astorga, and Enrique A. Dalchiele. 2023. "One-Step Hydrothermal Synthesis of Cu2ZnSnS4 Nanoparticles as an Efficient Visible Light Photocatalyst for the Degradation of Congo Red Azo Dye" Nanomaterials 13, no. 11: 1731. https://doi.org/10.3390/nano13111731
APA StyleHenríquez, R., Nogales, P. S., Moreno, P. G., Cartagena, E. M., Bongiorno, P. L., Navarrete-Astorga, E., & Dalchiele, E. A. (2023). One-Step Hydrothermal Synthesis of Cu2ZnSnS4 Nanoparticles as an Efficient Visible Light Photocatalyst for the Degradation of Congo Red Azo Dye. Nanomaterials, 13(11), 1731. https://doi.org/10.3390/nano13111731