Article

Structure, Morphology and Electrical/Magnetic Properties of Ni-Mg Nano-Ferrites from a New Perspective

1
Physics Department, Faculty of Science, Tanta University, Al-Geish St., Tanta 31527, Egypt
2
NANOTECH Center, Ural Federal University, 620002 Yekaterinburg, Russia
3
Department of Applied Medical Chemistry, Medical Research Institute, Alexandria University, Alexandria 21526, Egypt
4
Basic Science Department, Higher Institute of Engineering and Technology, Tanta 31739, Egypt
5
Department of Physics, College of Science, Princess Nourah Bint Abdulrahman University, Riyadh 11671, Saudi Arabia
6
Department of Physics, Faculty of Science, Isra University, Amman 11622, Jordan
7
Department of Nuclear Medicine Research, Institute for Research and Medical Consultations (IRMC), Imam Abdulrahman Bin Faisal University (IAU), Dammam 31441, Saudi Arabia
8
Laboratory of Magnetic Films Physics, SSPA “Scientific and Practical Materials Research Centre of NAS of Belarus”, 19, P. Brovki Str., 220072 Minsk, Belarus
9
Laboratory of Single Crystal Growth, South Ural State University, 76, Lenin Av., 454080 Chelyabinsk, Russia
10
Department of Electronic Materials Technology, National University of Science and Technology MISiS, 119049 Moscow, Russia
11
Electronic Materials Research Laboratory, Key Laboratory of the Ministry of Education & International Center for Dielectric Research, School of Electronic Science and Engineering, Xi’an Jiaotong University, Xi’an 710049, China
*
Author to whom correspondence should be addressed.
Nanomaterials 2022, 12(7), 1045; https://doi.org/10.3390/nano12071045
Submission received: 10 February 2022 / Revised: 14 March 2022 / Accepted: 17 March 2022 / Published: 22 March 2022

Abstract

:
Using the auto combustion flash method, Ni 1 x + 2 Mg x + 2 Fe 2 + 3 O 4 (x = 0, 0.2, 0.6, 0.8 and 1) nano-ferrites were synthesized. All samples were thermally treated at 973 K for 3 h. The structural analysis for the synthesized samples was performed using XRD, high-resolution transmission electron microscopy (HRTEM), and FTIR. Scanning electron microscopy (SEM) was undertaken to explore the surface morphology of all the samples. The thermal stability of these samples was investigated using thermogravimetric analysis (TGA). XRD data show the presence of a single spinel phase for all the prepared samples. The intensity of the principal peak of the spinel phase decreases as Mg content increases, showing that Mg delays crystallinity. The Mg content raised the average grain size (D) from 0.084 μm to 0.1365 μm. TGA shows two stages of weight loss variation. The vibrating sample magnetometer (VSM) measurement shows that magnetic parameters, such as initial permeability (μi) and saturation magnetization (Ms), decay with rising Mg content. The permeability and magnetic anisotropy at different frequencies and temperatures were studied to show the samples’ magnetic behavior and determine the Curie temperature (TC), which depends on the internal structure. The electrical resistivity behavior shows the semi-conductivity trend of the samples. Finally, the dielectric constant increases sharply at high temperatures, explained by the increased mobility of charge carriers, and decreases with increasing frequency.

1. Introduction

Soft ferrites have presented a broad scope in wide applications such as magneto-optical recording media and waveguides, using the disparity of several parameters such as annealing temperature and doping content [1,2,3]. Surface and quantum confinement phenomena attributable to the enormous volume to surface ratio and scale-dependent characteristics of nano-ferrites have received considerable attention. By varying such values, the desired changes in the physicochemical properties of the ferrites can be obtained [4,5].
Ferrites are suitable magnetic materials which have high degree of structural stability. So, they are utilized in some applications; in radio devices, transformer cores and switches. Nickel ferrites (NiFe2O4), also known as spinel ferrites (SF), are used in radio equipment, rod antennas, gas sensing materials and other applications [6,7,8]. Nowadays, ferrites (spinel-type) are frequently utilized in biomedical applications such as magnetic-based drug delivery systems, contrast agents in MRI (magnetic resonance imaging), and magnetic particle imaging [9].
Ni with Zn spinel ferrite nanosized samples can be prepared via spray pyrolysis [10], citrate gel [11], hydrothermal [12], sol–gel [13], microwave refluxing [14], co-precipitation [15,16], and flash auto combustion [17]. Furthermore, the mechanical ball milling method was applied to prepare nanoscale spinel ferrites. Still, this technique has certain flaws, such as rare and valuable raw materials, poor gross synthesis capabilities, and complex processes [18,19,20,21,22,23]. Ni-Zn ferrite is a relatively cheap material. Ni-Zn ferrite nanoparticles possess a high electrical resistivity; the anomalous magnetic properties are caused by the interconnected distribution of the initial Ni, Zn, and Fe cations in the crystal lattice sites are ideal for the cores of intermediate and high-frequency electromagnetic devices [24,25].
Shiv Kumar et al. [26] prepared Ni 1 x Mg x Fe 2 O 4 (x < 0.45) by aqueous sol–gel technique and according to the magnetic measurements, they found that the prepared samples are relatively superparamagnetic materials and can be used for switching devices and as target drug delivery in the human body. Shobana et al. [27] also prepared the same composition (0.25 ≤ x ≥ 1) by the sol–gel method, and they proved that this composition could be used as an anode material for Li-ion batteries.
The novel items of this work are the impact of Mg cation doping on the structure, electrical, and magnetic properties of a series of Ni 1 x + 2 Mg x + 2 Fe 2 + 3 O 4 ferrite in order to use this ferrite in medical applications.

2. Materials and Methods

2.1. Synthesis Procedure and Method

Ferrite samples of Ni 1 x + 2 Mg x + 2 Fe 2 + 3 O 4 (x = 0, 0.2, 0.6, 0.8 and 1) were fabricated by the flash auto combustion method using nickel nitrate (Ni(NO3)2·6H2O), magnesium nitrate (Mg(NO3)2·6H2O), ferric nitrate (Fe(NO3)3·9H2O), and urea (CH4N2O) as a fuel. A glass rod was used to combine the metal nitrates with the urea. The mixture was heated to 80 °C with steady stirring on a hot plate until it became viscous and internal ignition occurred, resulting in brown ferrite powder formation. The final produced powder was annealed for 3 h at 700 °C.

2.2. Characterization Methods

A Philips model (PW-1729, Cambridge, UK) diffractometer (with 2θ from 20° to 80°) was used to investigate the samples by X-ray diffraction. FTIR spectroscopy was used to create an FTIR spectrum in the wavenumber range from 200 cm−1 to 4000 cm−1 (Perkin Elmer 1430, Hamburg, Germany). Transmission electron microscopy (TEM) was involved in studying the microstructure of the samples (JEOL1010, Tokyo, Japan). SEM was used to investigate the morphology of the samples (JEOL JSM-6460, Tokyo, Japan). Image-J and Gatan digital micrograph software were used for calculating average pore size or pores area, the average crystallite size (D), and image processing. Thermogravimetric analyzer (TGA) characterizations were performed in the air with a 10 °C/min rate using a Perkin Elmer Top-Loading Series (STA-6000, Germany). A vibrating sample magnetometer (VSM) with operating system V1.6 control software was used to monitor magnetic hysteresis loops (Oxford OX8JTL, London, UK). Using the R–L–C Bridge (type BM591, Tokyo, Japan), the initial magnetic permeability (μi), DC resistivity (ρ), and at various frequencies, the dielectric constant (ε) was calculated as a temperature function.

3. Results and Discussion

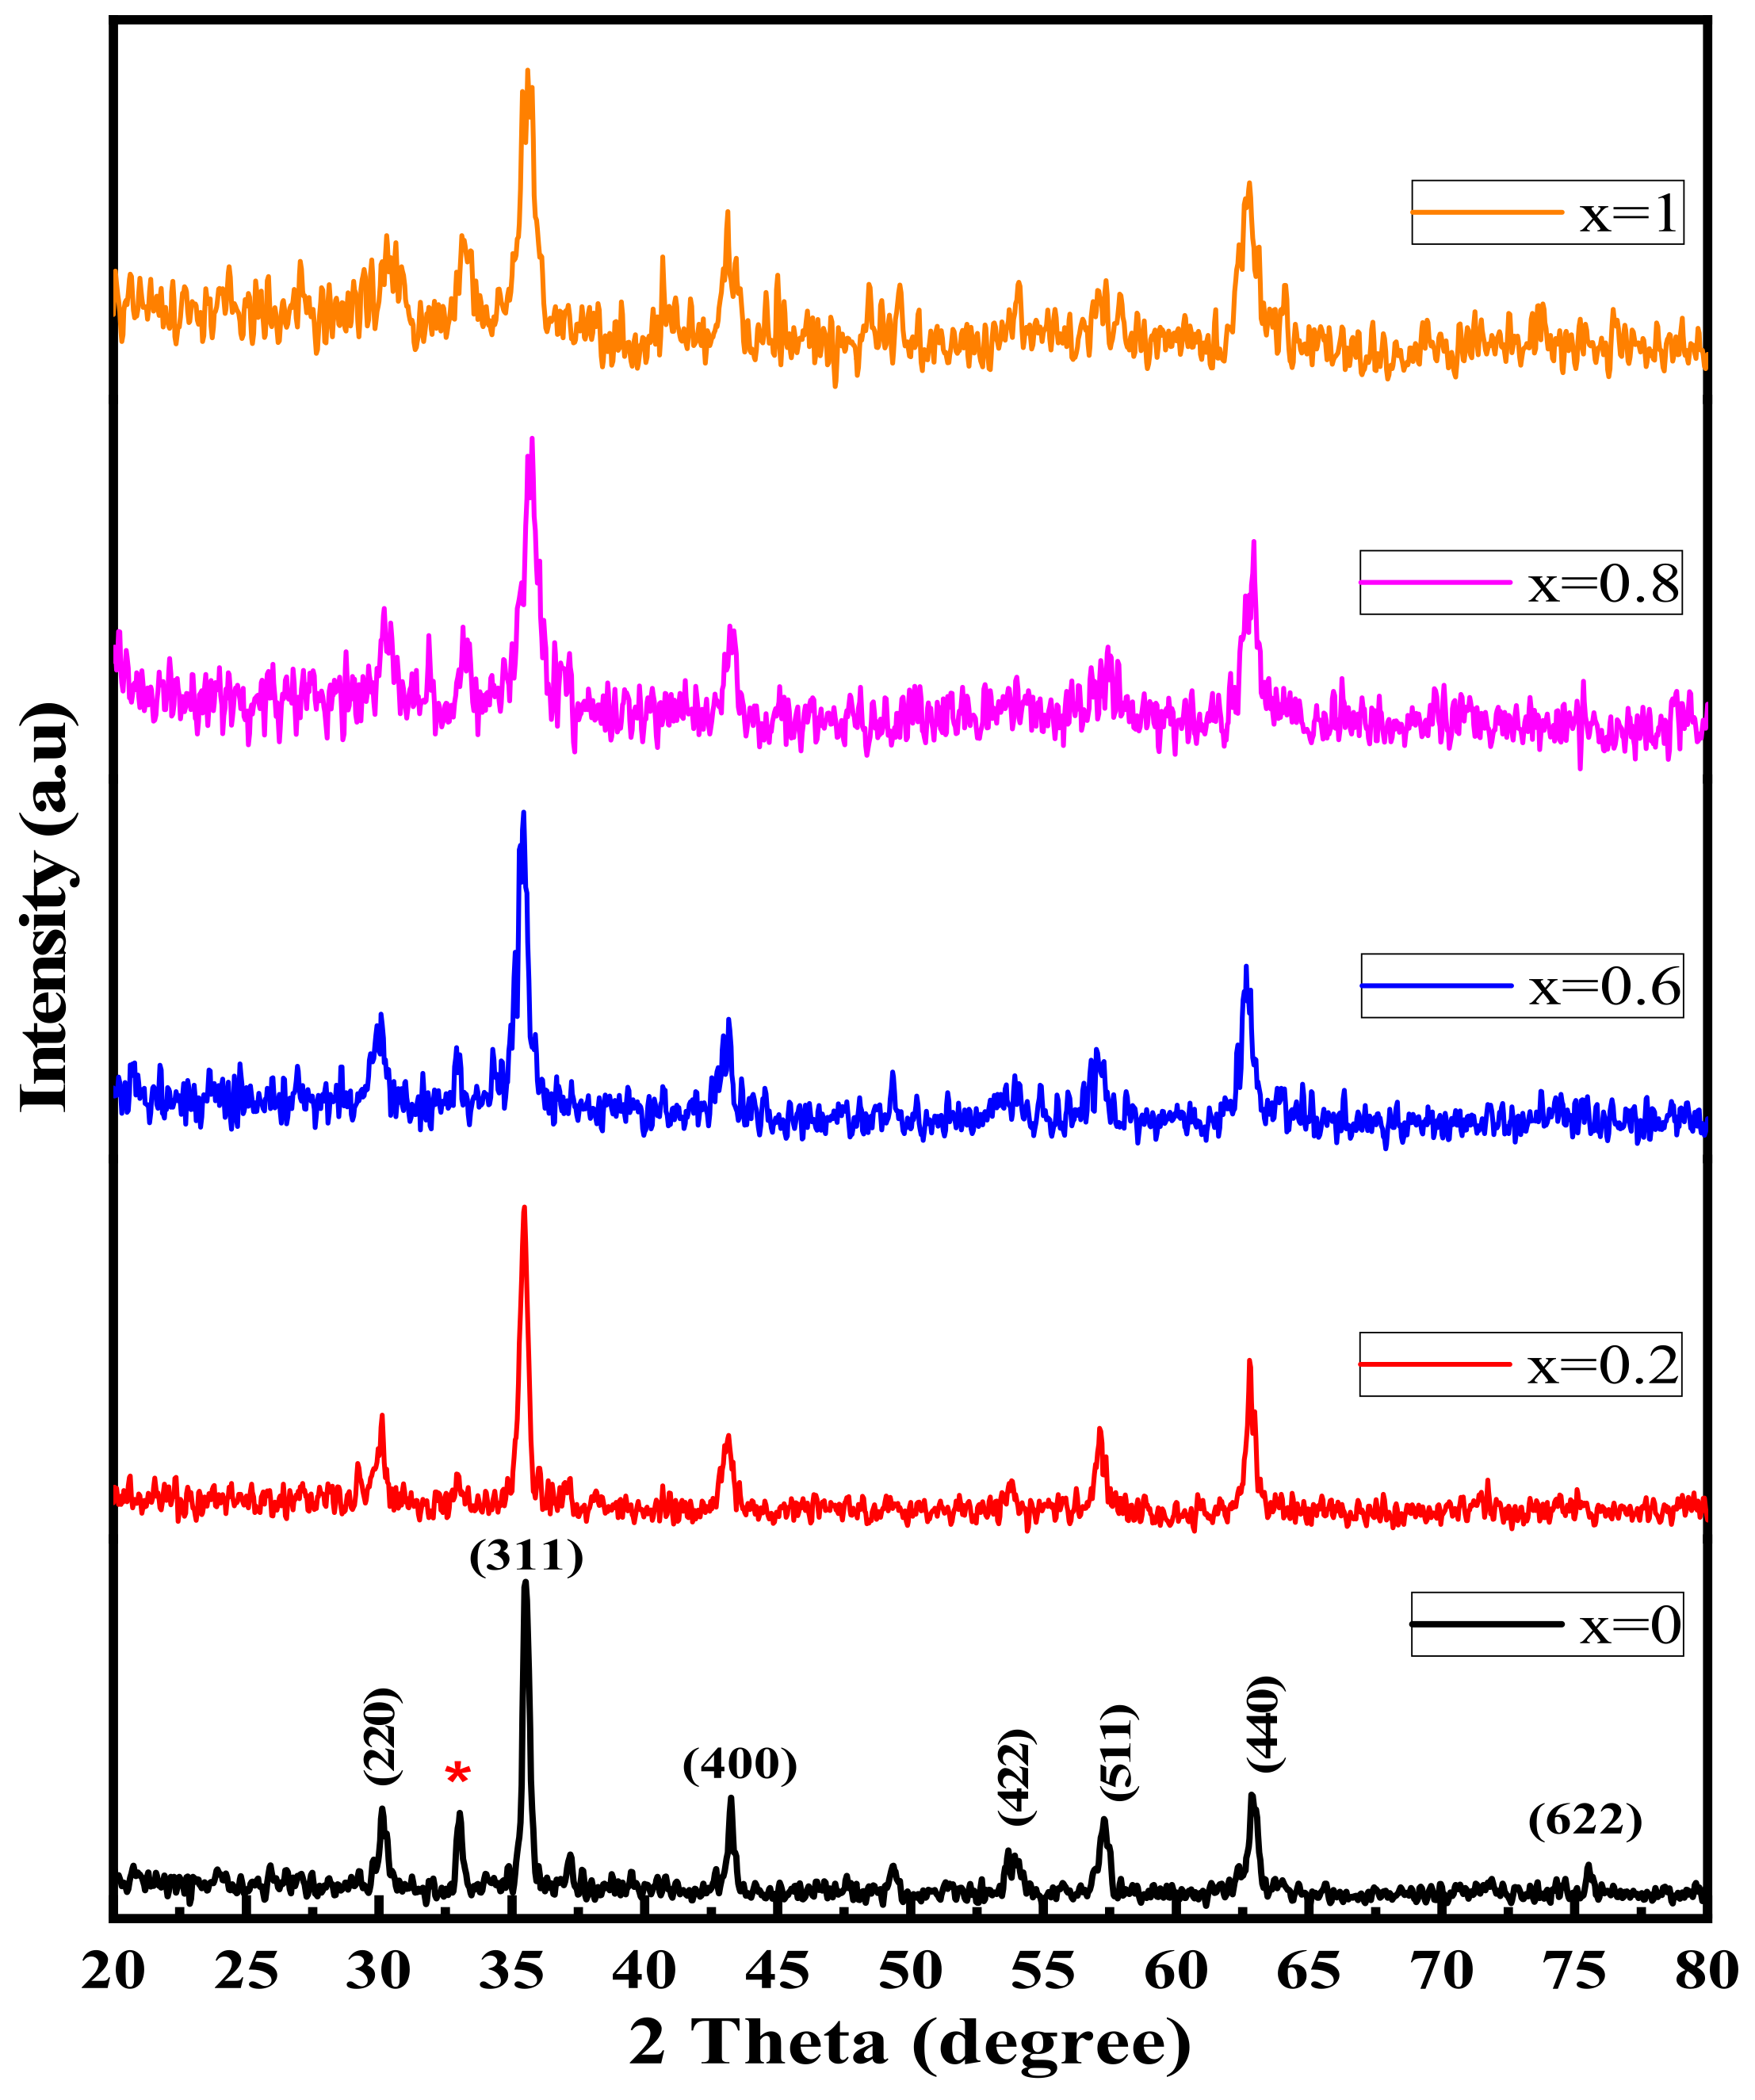
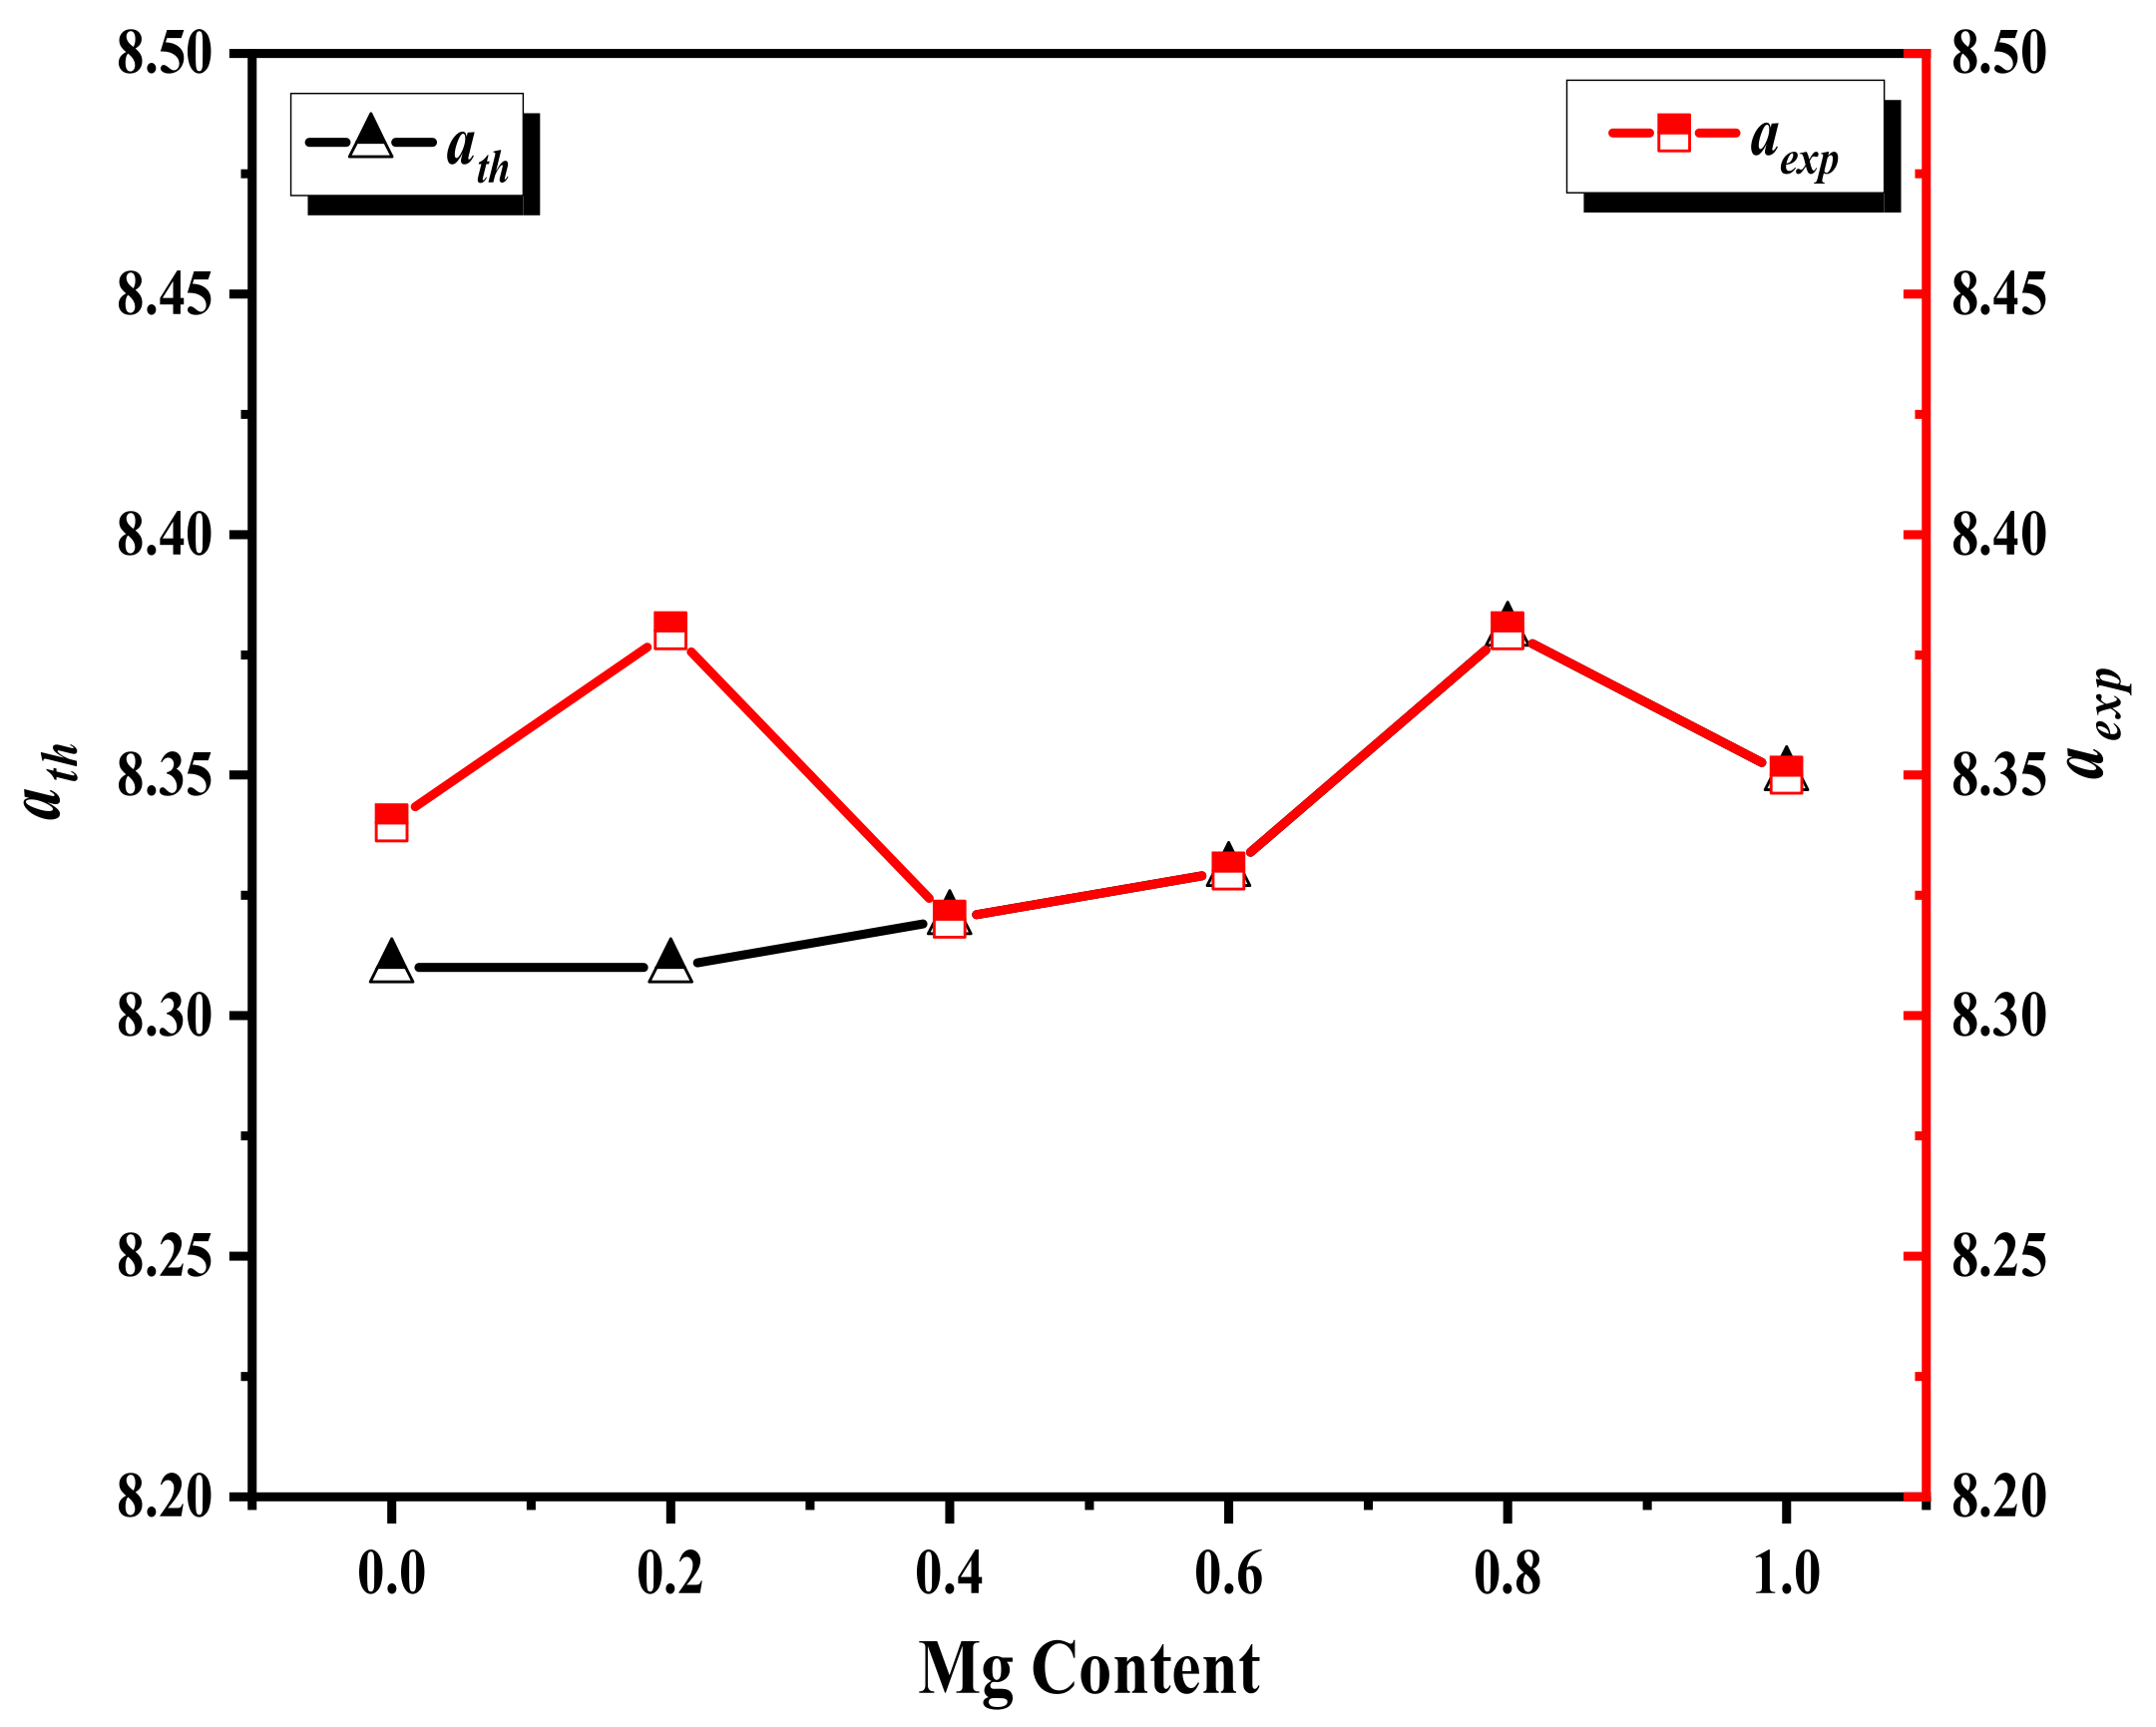
3.1. XRD (X-ray Diffraction) Discussion

The XRD patterns of Ni 1 x + 2 Mg x + 2 Fe 2 + 3 O 4 (x = 0, 0.2, 0.6, 0.8, and 1) are shown in Figure 1, confirming the formation of a spinel phase according to the JCPDS standard data of Ni and Mg ferrite (PDF cards No. 742081 and 732410). The diffraction peaks are prominent and sharp, with only a small peak at around 32°, which may belong to hematite Fe2O3 [28,29,30]. The intensity of the spinel phase’s primary peak decreases as the Mg content increases. The XRD patterns confirm the polycrystalline nature, which belongs to the FCC Bravais lattice.
The variation of cell parameter (a) with Mg content can be understood based on the ionic radii of both Mg2+ (0.720 Å) as well as Ni2+ (0.690 Å), as shown in Figure 2. Thus, the lattice expansion occurs when larger Mg ions replace the Ni ions. After x = 0.8, the Mg ions cannot be inserted in the lattice and become insoluble in Ni ferrite lattice and begin to accumulate on the lattice boundaries causing internal stress leading to the decrease of the lattice constant [31]. The shift in diffraction peak (311) occurred toward the lower diffraction angle leading to the increase of the cell parameter. The values of obtained lattice parameter are in the expected range of Ni ferrite and Mg ferrite, which are both inverse ferrites [32]. The Mg cations fill both tetrahedral (A) and octahedral (B) positions, causing Fe3+ cations to migrate from the (A) position to the (B) position. The four oxygen ions constituted the tetrahedral site, and six oxygen ions surrounding the B-site have to move outward along the diagonal of the lattice, causing the change in the oxygen positional parameter (u) as given in Table 1, which depends on the chemical composition and preparation condition and was computed using (Equation (1)) the ionic radii of the A-site ( r A ), the radius of the O−2 ion ( r O ), and lattice parameter ( a ) [17]:
u = r A + r O 3   a   + 1 4 ;
The obtained ( u ) values are given in Table 1, which are a little more than ideal values for the spinel ferrite (0.375 Å) but agree with the reported value of Mg ferrite [33].
The XRD data are given in Table 1 and were used to confirm the spinel phase formation by calculating the tetrahedral and octahedral radii from the supposed cation distribution from the following equations:
r A = c A M g r M g + 2 + c A F e   r F e + 3   ;
  r B = c B N i r N i + 2 + c B M g   r M g + 2 + c B F e r F e + 3 2 ;
where r N i + 2 , r M g + 2 , and r F e + 3 are ionic radii of Ni+2, Mg+2, and Fe+3, respectively, while c A M g and c A F e   are the Mg+2 and Fe+3 ions concentration at the A-site and c B N i , c B M g , and c B F e are the Ni+2, Mg+2, and Fe+3 ions concentration at the B-site, respectively.
The intensities of diffraction peaks (220) and (440) provide information about the cation distribution in both A and B-sites [34]. As is well-known, the Ni ions fill the (B) position, while Mg ions fill both the (A) and (B) positions. The decrease in the intensity of diffraction peaks (220) and (440) with increasing Mg content showed a mixed cation occupancy for Mg in both the A-site and B-site [34]. Considering the preceding, the most probable distribution of cations can be concluded, which is given in Table 1.
The theoretical magnitudes of the cell parameter ( a t h ) can be computed taking into account the cation distribution [17] using the following:
  a t h = 8 3 3     r A + r O + 3 r B + r O   ;
where the radii of A-site, B-site, and oxygen are r A , r B , and r O , respectively. It is noted that the value of a t h agrees well with those experimentally (experimental lattice parameters) obtained values ( a e x p ), as illustrated in Figure 2.
Using Neel’s theory, the theoretical net magnetic moment ( μ t h ) of the prepared samples was estimated from the expected X-ray cation distribution [2] using the following equation:
μ t h = μ B μ A ;
where μ A and μ B are the magnetic moments at A-site and B-site, respectively, and μ t h is calculated and given in Table 1 for all the prepared samples.
The magnetic moments used for calculating the cation distributions are Ni+2 = 2 μ B , Mg+2 = 0 μ B , and Fe+3 = 5 μ B [17]. The Mg content increases, the μ t h decreases; this is due to the decrease in the Ni+2 ion at the B-site, which results in a drop in the ferrite sample’s net magnetization [17].
The A-site bond length ( R A ), B-site bond length ( R B ), and ( u ) distance between ions and oxygen anion (oxygen positional parameter) at both A and B-sites were estimated [17] and given in Table 1 using the following formulas:
R A = a   3   δ + 1 8 ;
R B = a   3 δ 2 δ 2 + 1 16 ;
where δ is the inversion parameter at u 0.375 , the bond length values steadily increase as the Mg concentration increases, which is consistent with the increase in the lattice parameter [32].
Scherer’s formula estimated the average crystallite size (D) from the calculated diffraction peaks width. As seen in Table 2, the D for all the samples decreased as the Mg concentration increased.
The theoretical X-ray density ( ρ x ) is found to be larger than the bulk (measured) density ( ρ b u l k ), as shown in Table 2. However, the bulk density drops while the concentration of magnesium cations rises, which is explained by the lower atomic weight of Mg (24.3 at. un.) than that of Ni (58.6 at. un.), and also the decrease of density is described by the fact that the density of Mg is 1.74 g/cm3 which is lower than the Ni density which is equal to 8.91 g/cm3 [35]. The porosity ( P ) of the samples was computed [36] using Equation (8):
P = 1 ρ b u l k ρ x   % ;
The calculated P is given in Table 2. Due to the pores and vacancies created during the sample’s preparation, the P rises with high Mg concentration.

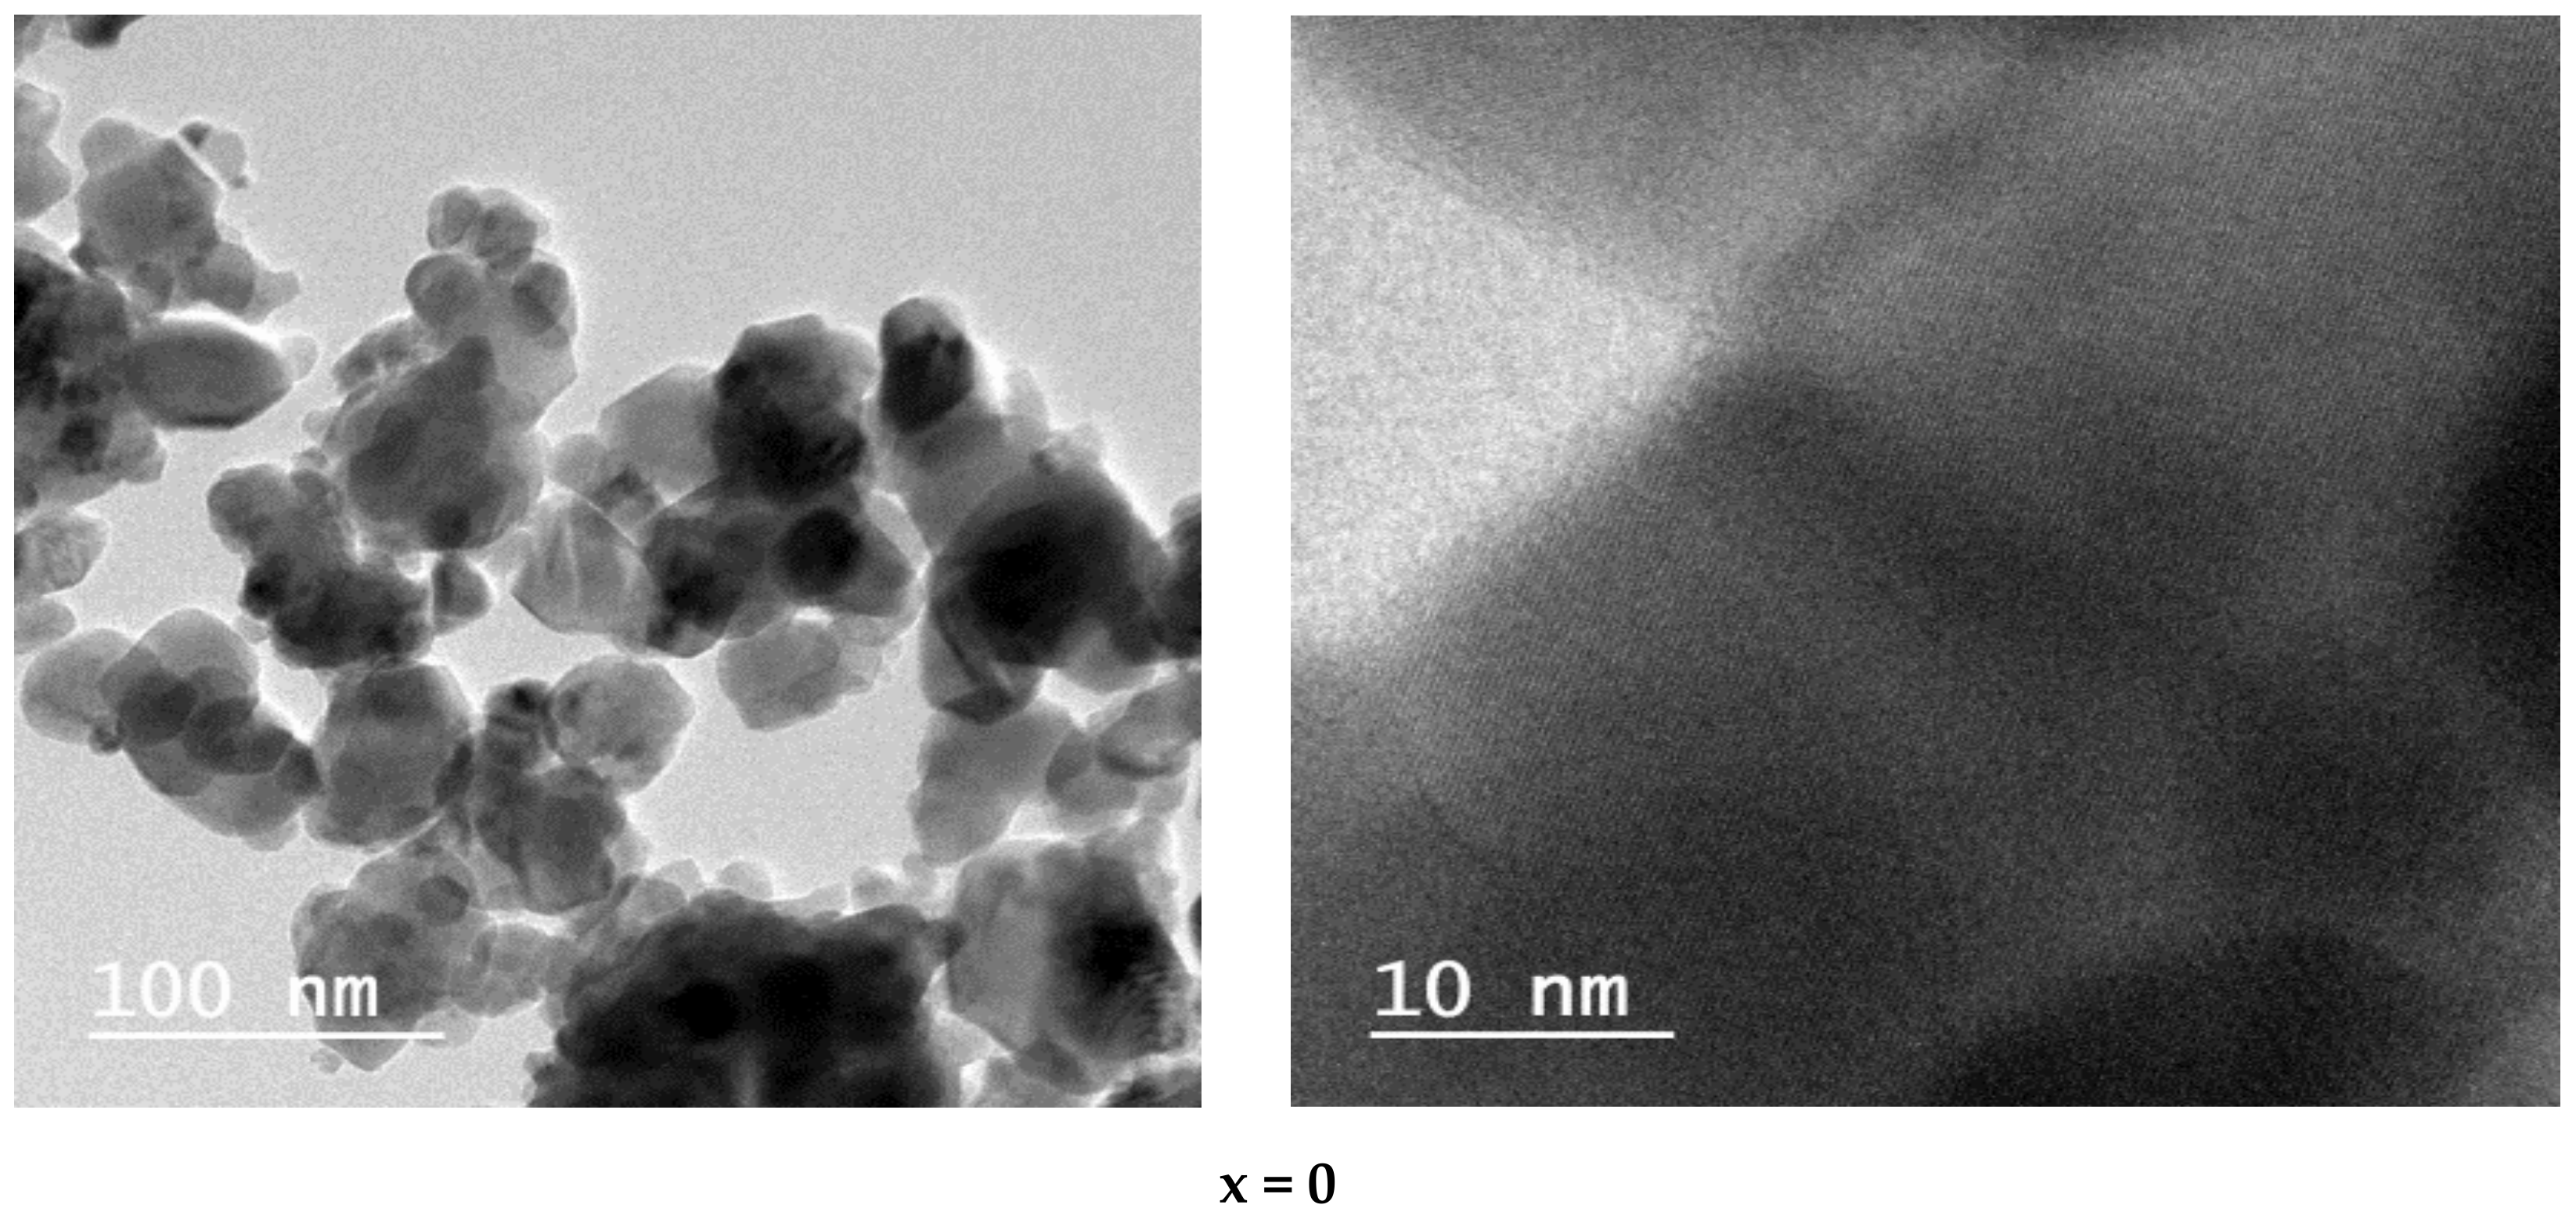
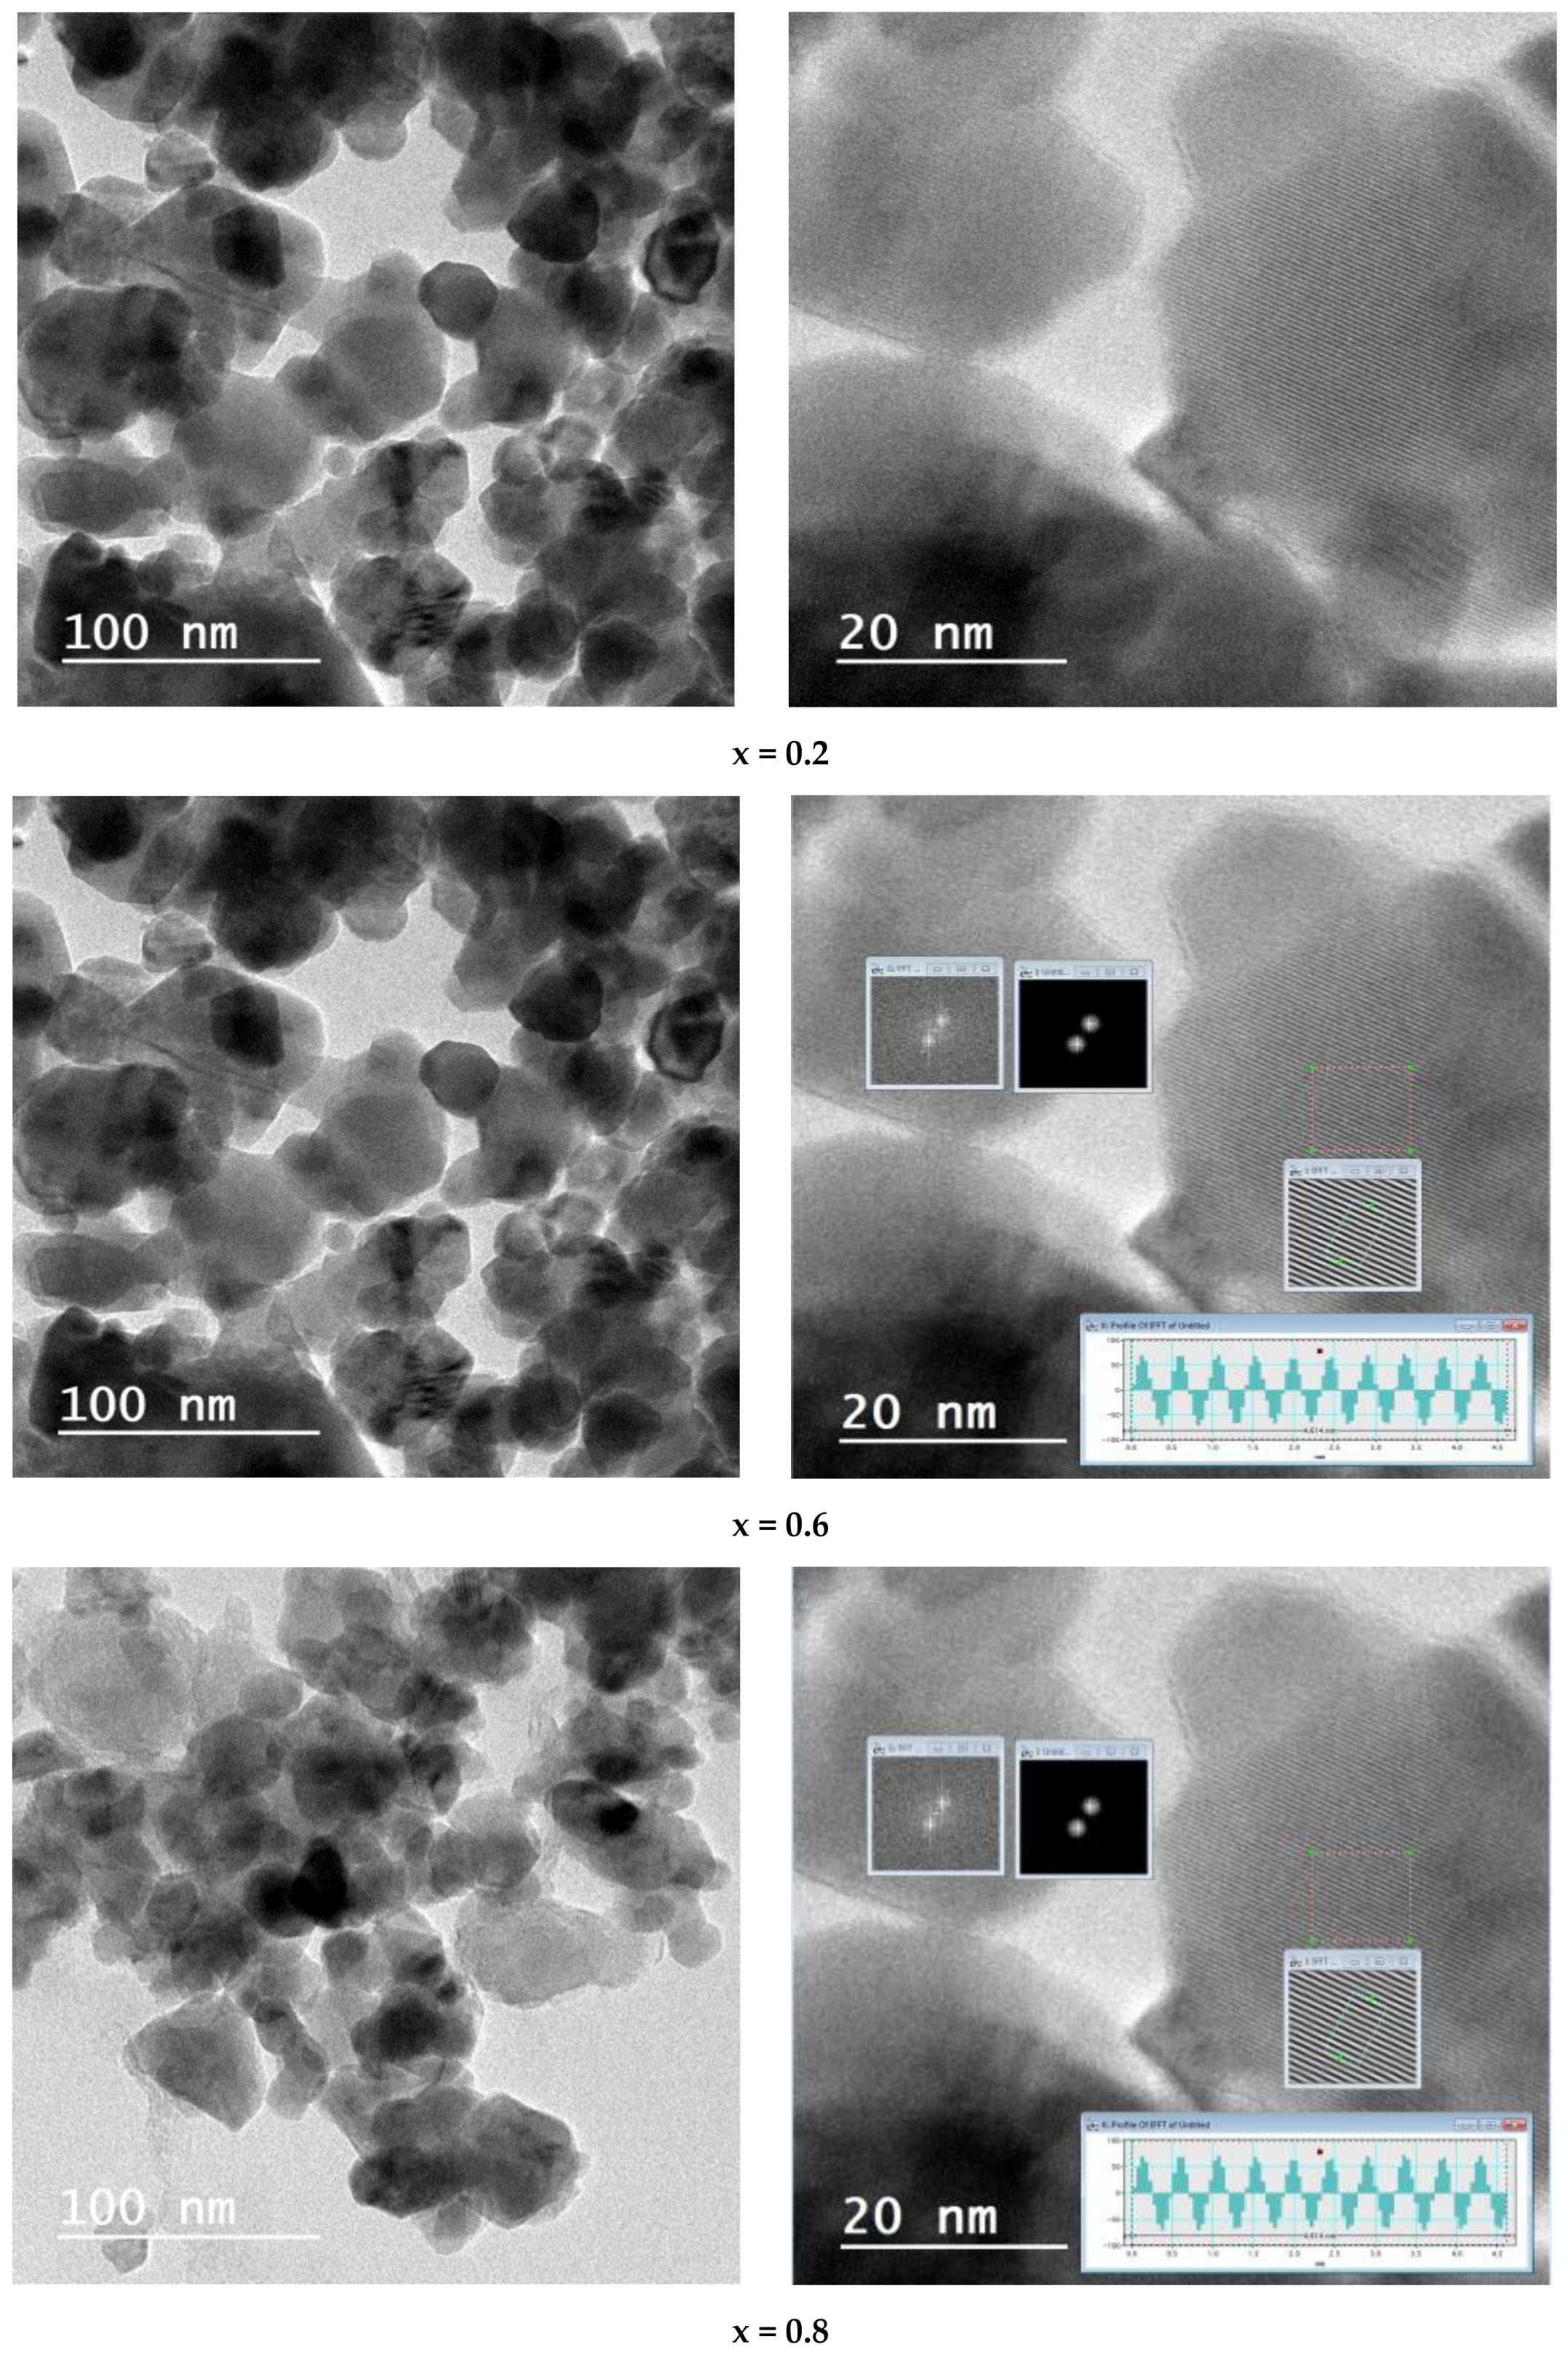
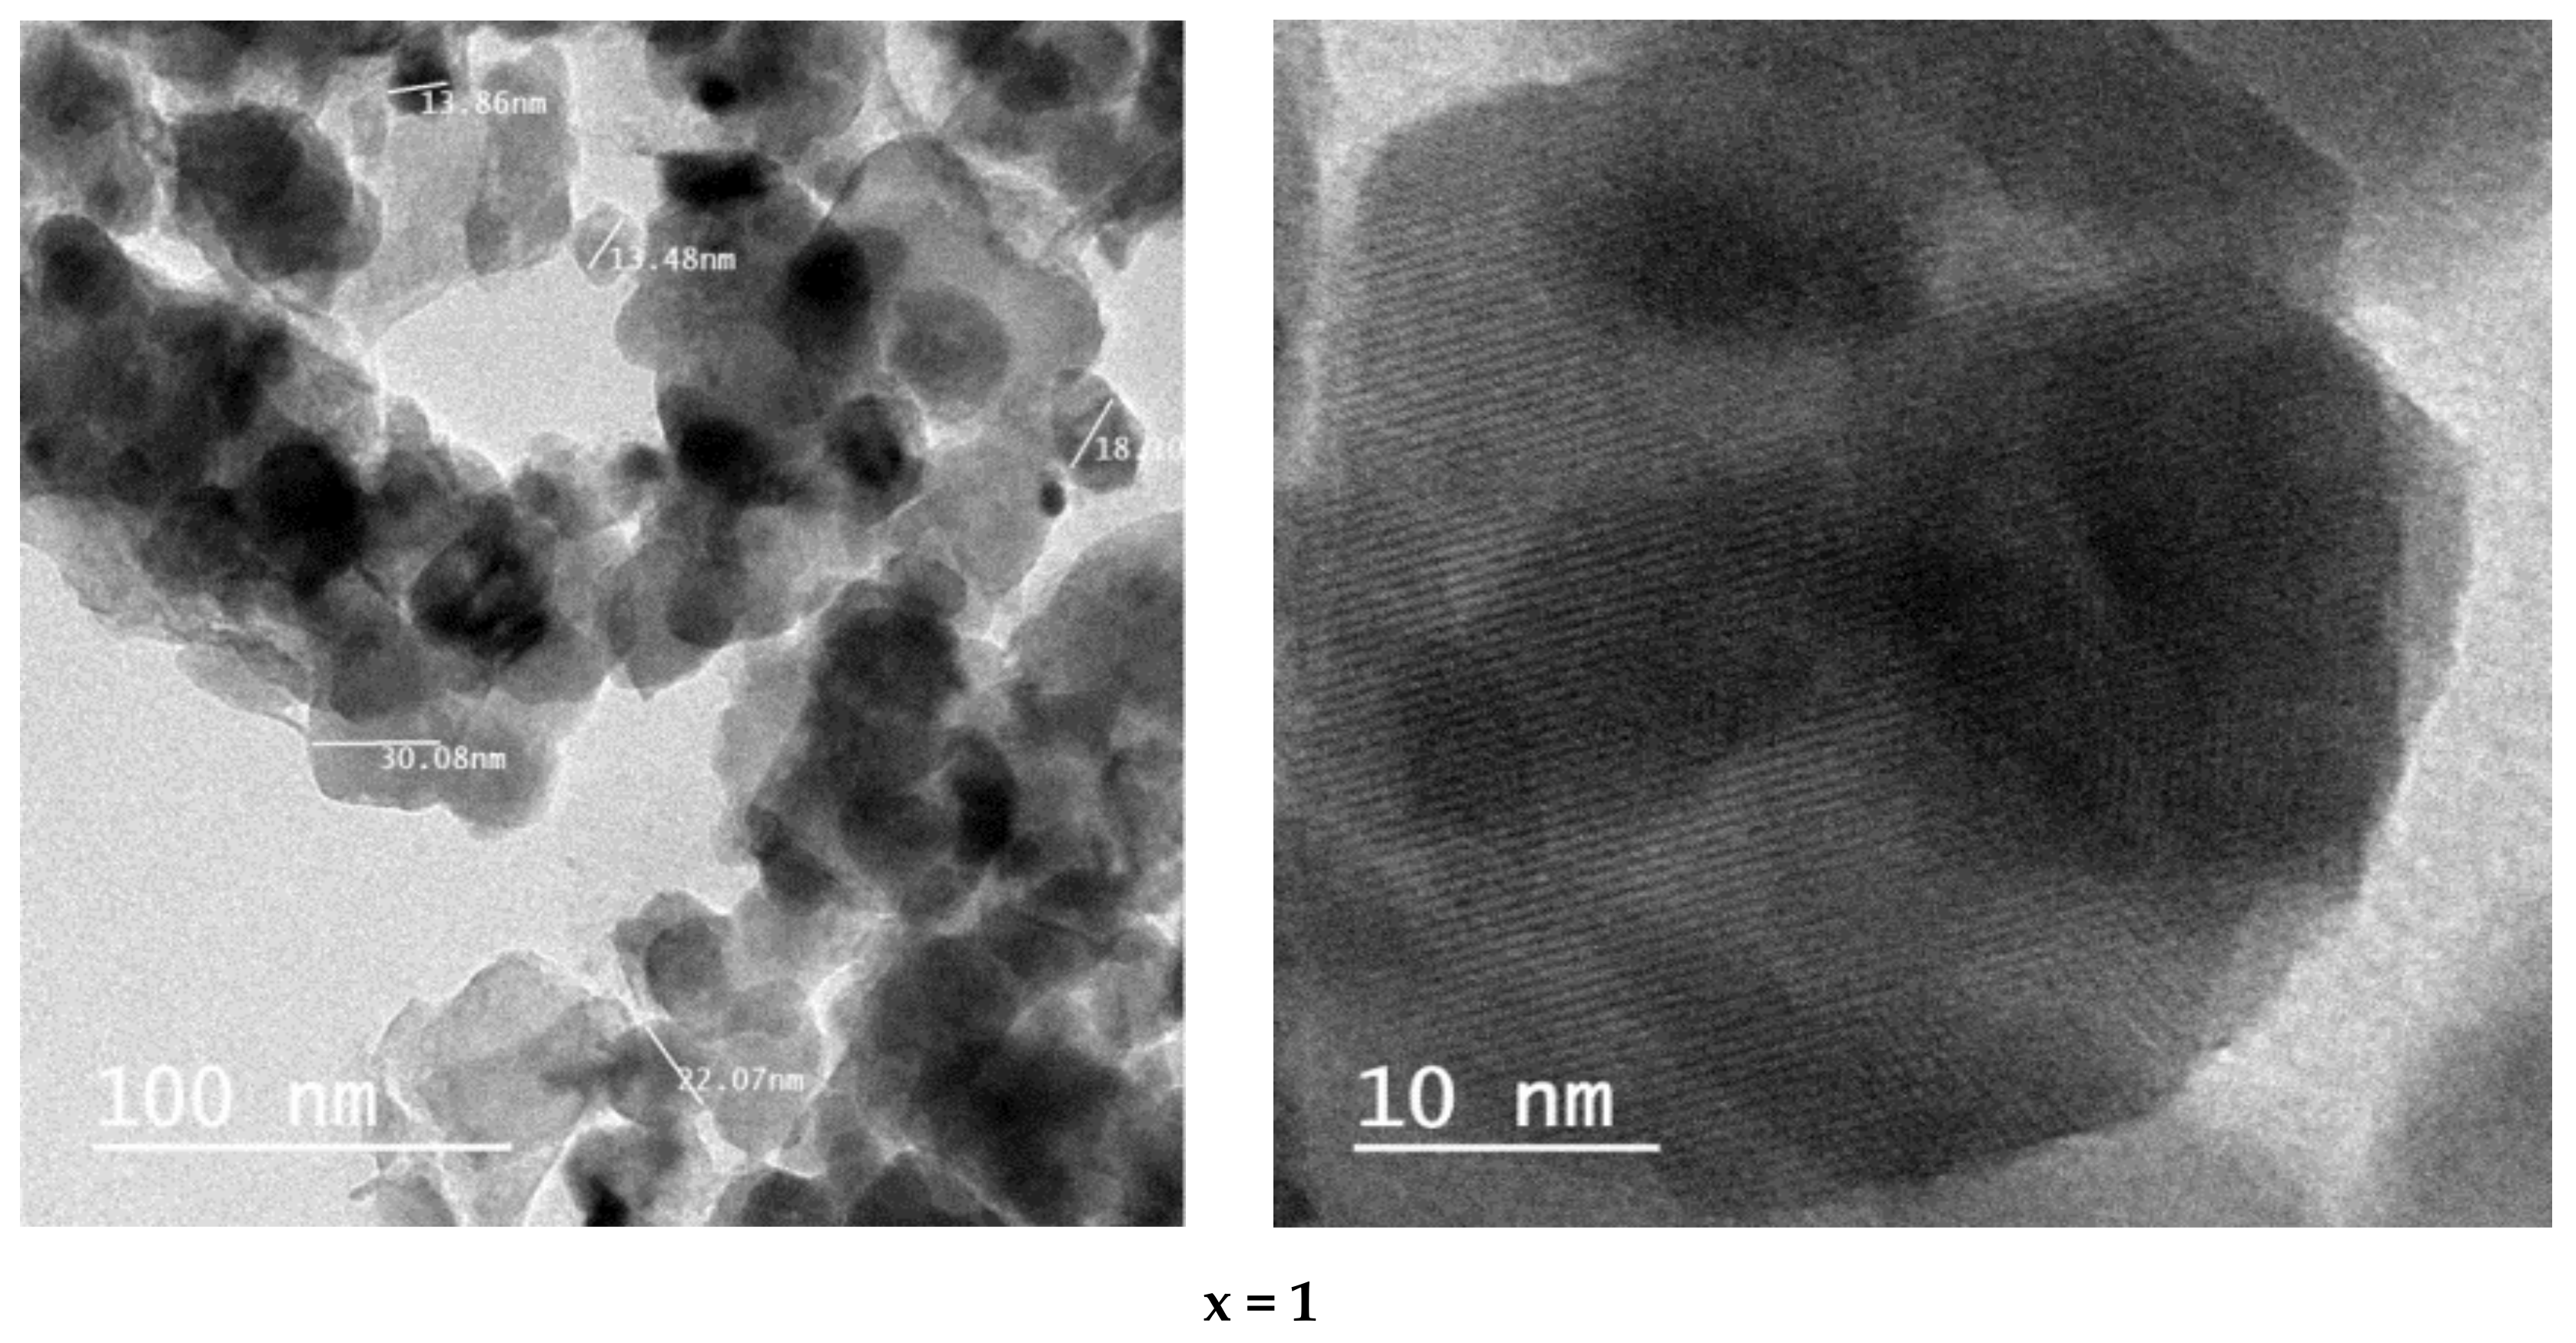
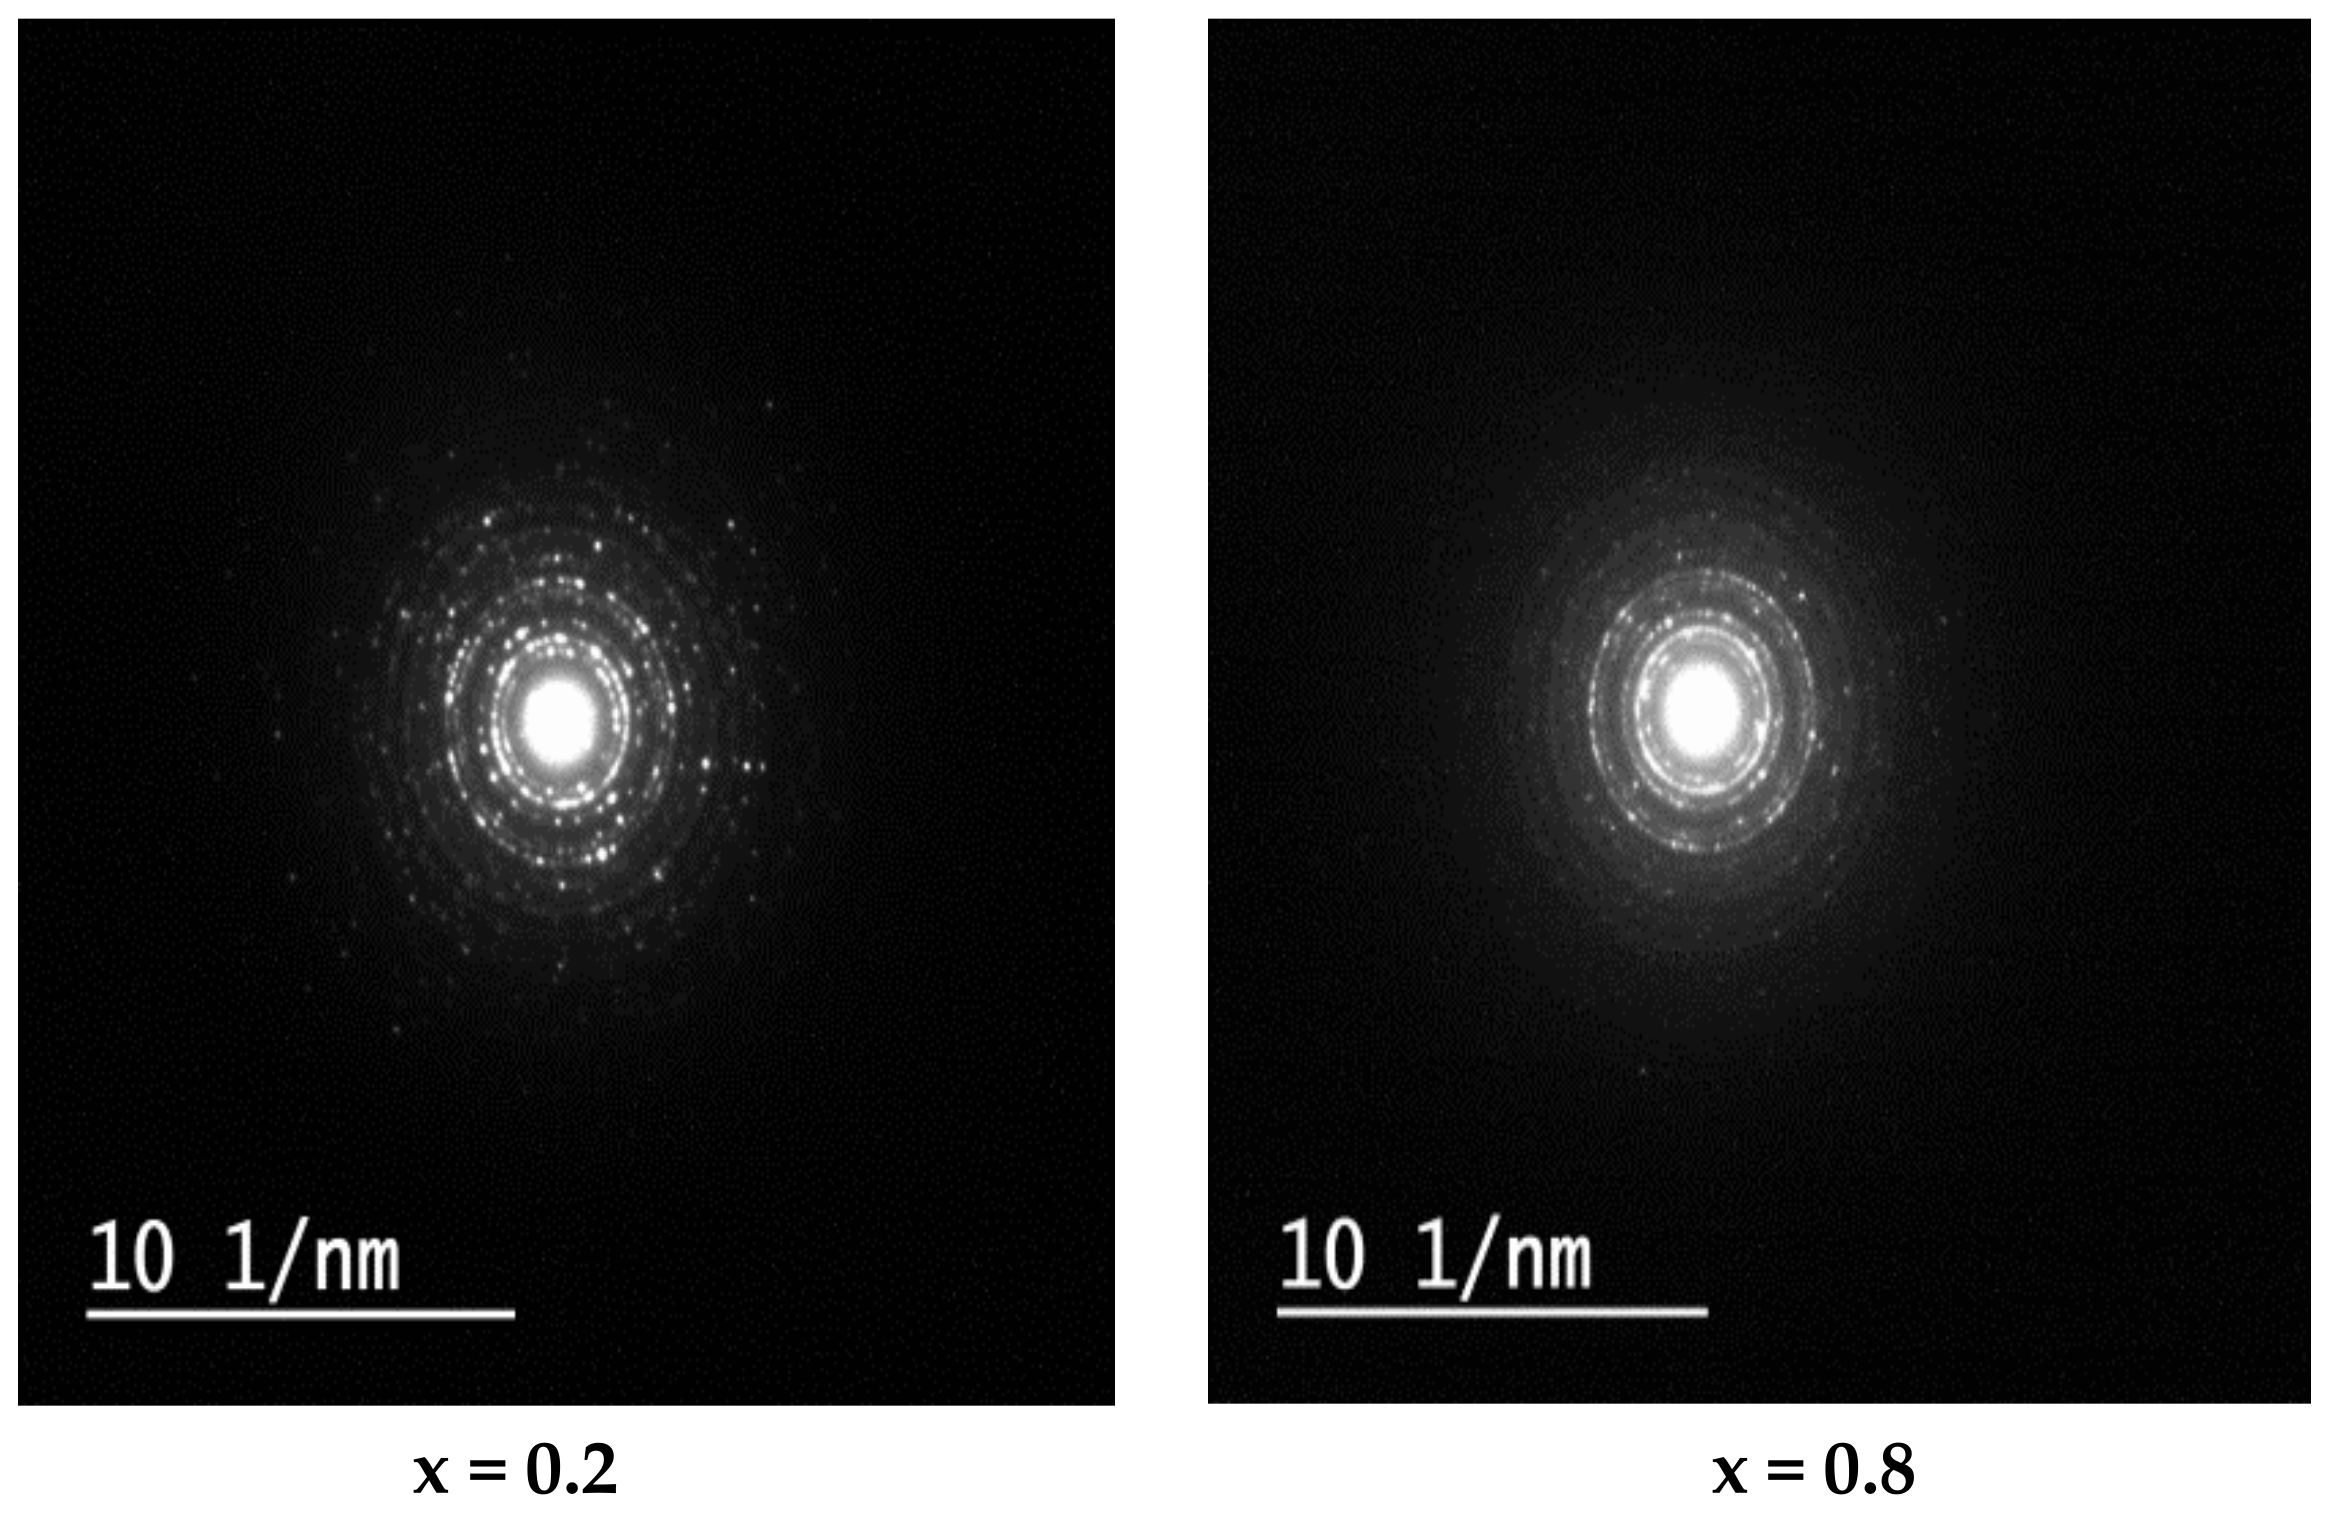
3.2. HRTEM (High-Resolution Transmission Electron Microscopy) Discussion

High-resolution TEM images of Ni 1 x + 2 Mg x + 2 Fe 2 + 3 O 4 (x = 0, 0.2, 0.6, 0.8, 1) with electron diffraction rings are illustrated in Figure 3. The TEM images display a nanocrystalline nature with some agglomeration because of the magnetic interaction between nanoparticles (NPs). The prepared samples (NPs) have a relatively circular shape (irregular), and their sizes match those calculated using Sherer’s equation from XRD measurements. The micrographs exhibit the particles’ size distribution between 17 nm and 20 nm. Corresponding lattice planes appear for each sample. The observed crystallographic value of the interplanar distance (d) is 2.43 Å concerning plan (311), confirming the establishment of the ferrite spinel phase. The observed crystallographic (d) values coincide with those gained from the XRD analysis, so the XRD and TEM confirm the spinel phase formation.
Figure 4 shows the SAED (selected area electron diffraction) depiction for samples with x = 0.2 and 0.8. It was noted that the SAED depiction is composed of a set of conical halo rings that point out the nanocrystalline nature of the samples [37]. The bright spots in the halo rings represent good crystallization of the material. The crystal planes for the different circles, which correspond to different peaks of the cubic spinel phase, are defined as (220), (311), (400), (511), and (440) that appeared at the XRD pattern, which shows the consequence between electron diffraction pattern and XRD pattern [37].

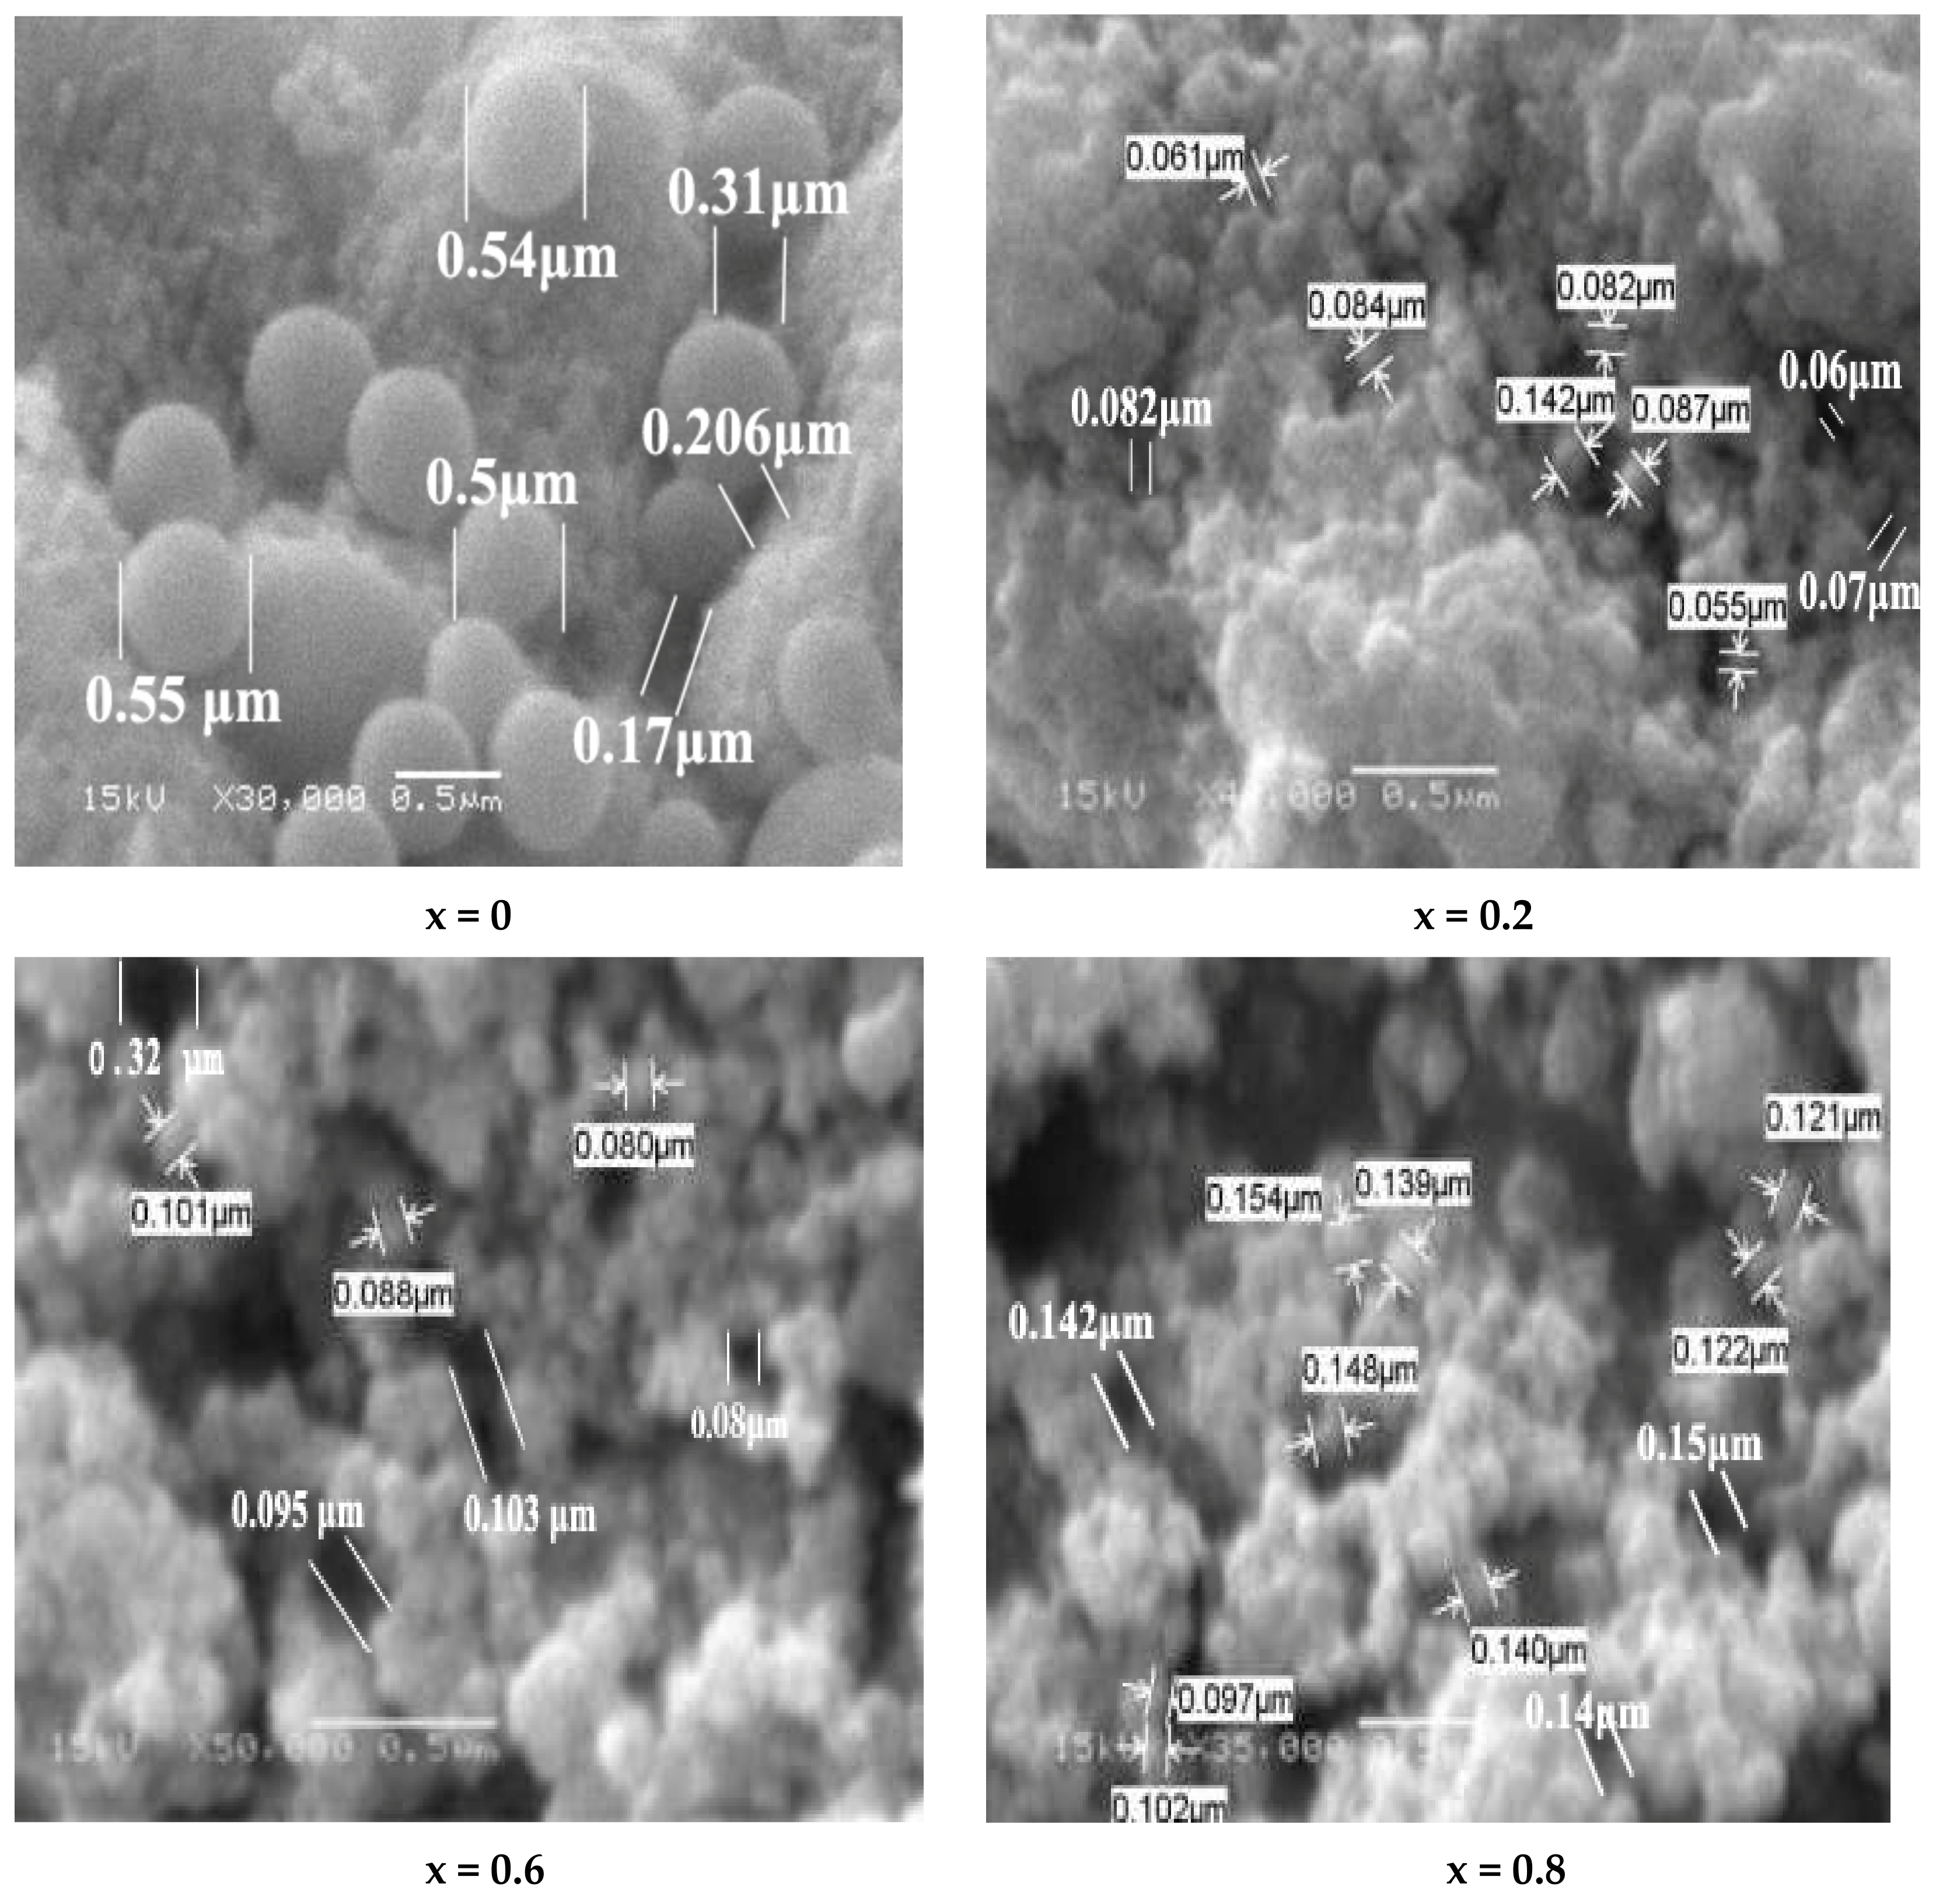
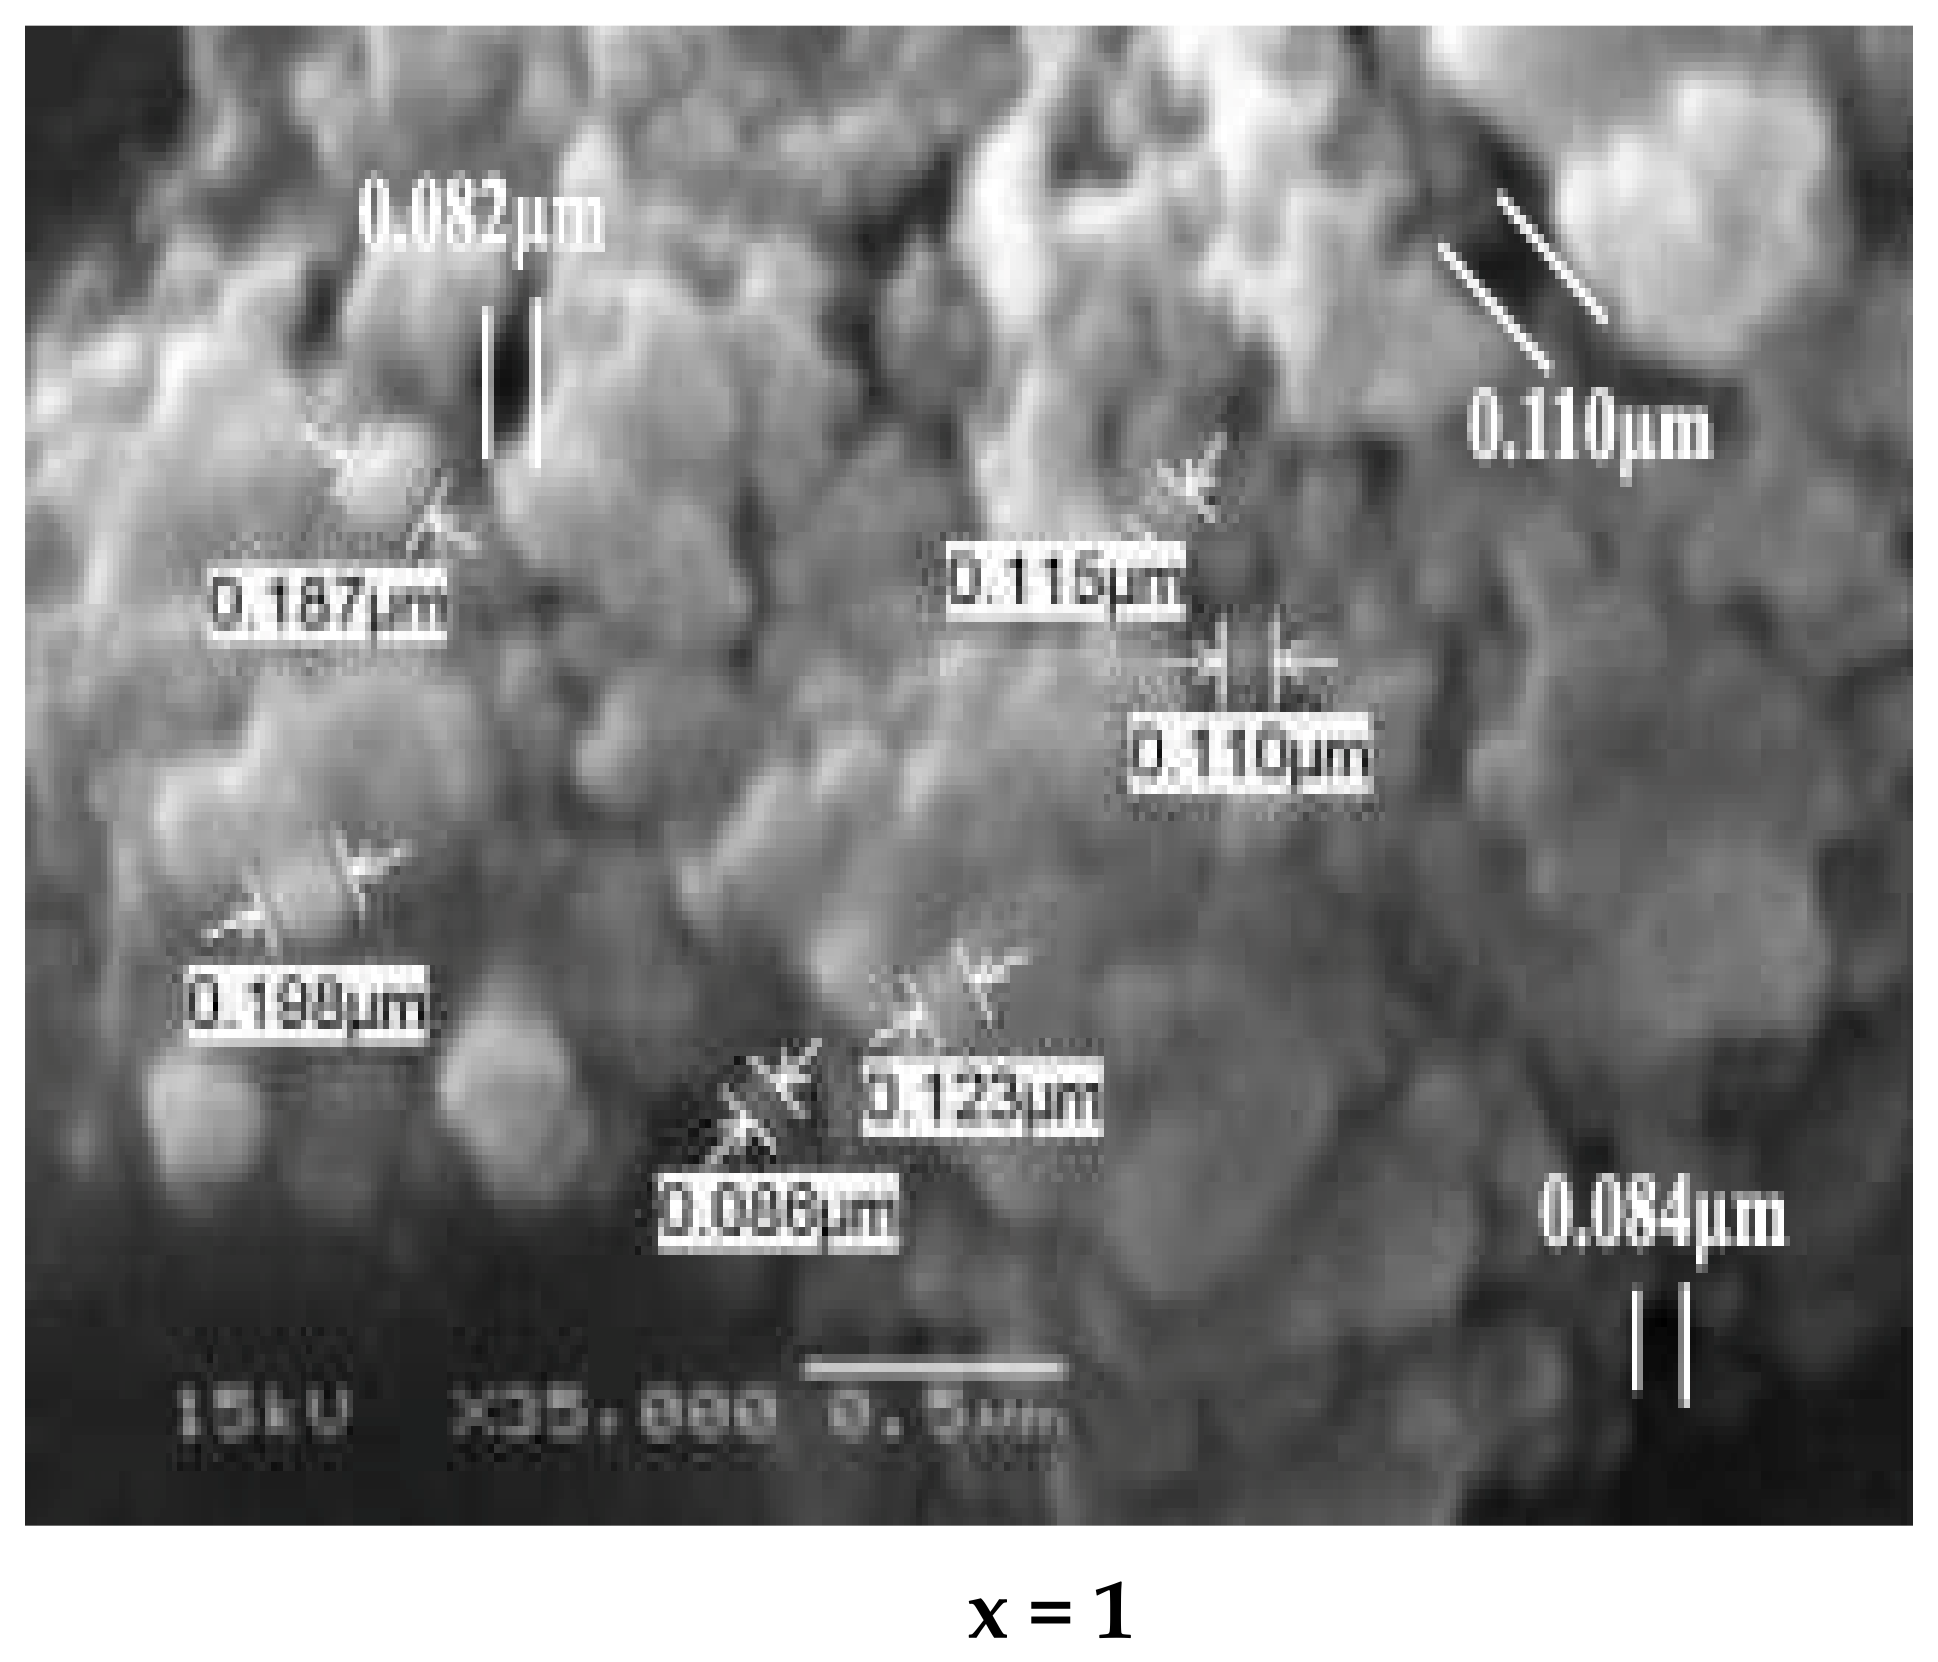
3.3. SEM (Scanning Electron Microscopy) Discussion

The surface morphology of the studied samples Ni 1 x + 2 Mg x + 2 Fe 2 + 3 O 4 (x = 0, 0.2, 0.6, 0.8, and 1) was inspected with scanning electron microscopy, shown in Figure 5. The grains manifest as a spherical shape with a highly compact state. An increasing trend from 84.2 nm to 13.65 nm was observed for the average grain size with increasing concentration of the Mg, as illustrated in Figure 6. A grain agglomeration occurs as the magnetic dipole moment increases by increasing Mg content because of the attractive force between grains [38]. Pores can be seen in all samples, as seen in the micrographs taken. The average grain size was determined [39] using the following equation:
Grain   size = 1.5   L M   N ;
where N, L, and M are the intercepts number in the SEM, the test line length, and the magnification, respectively. Furthermore, the size of the average pores was calculated and listed in Table 3; the pores’ size decreased with increasing Mg ions.

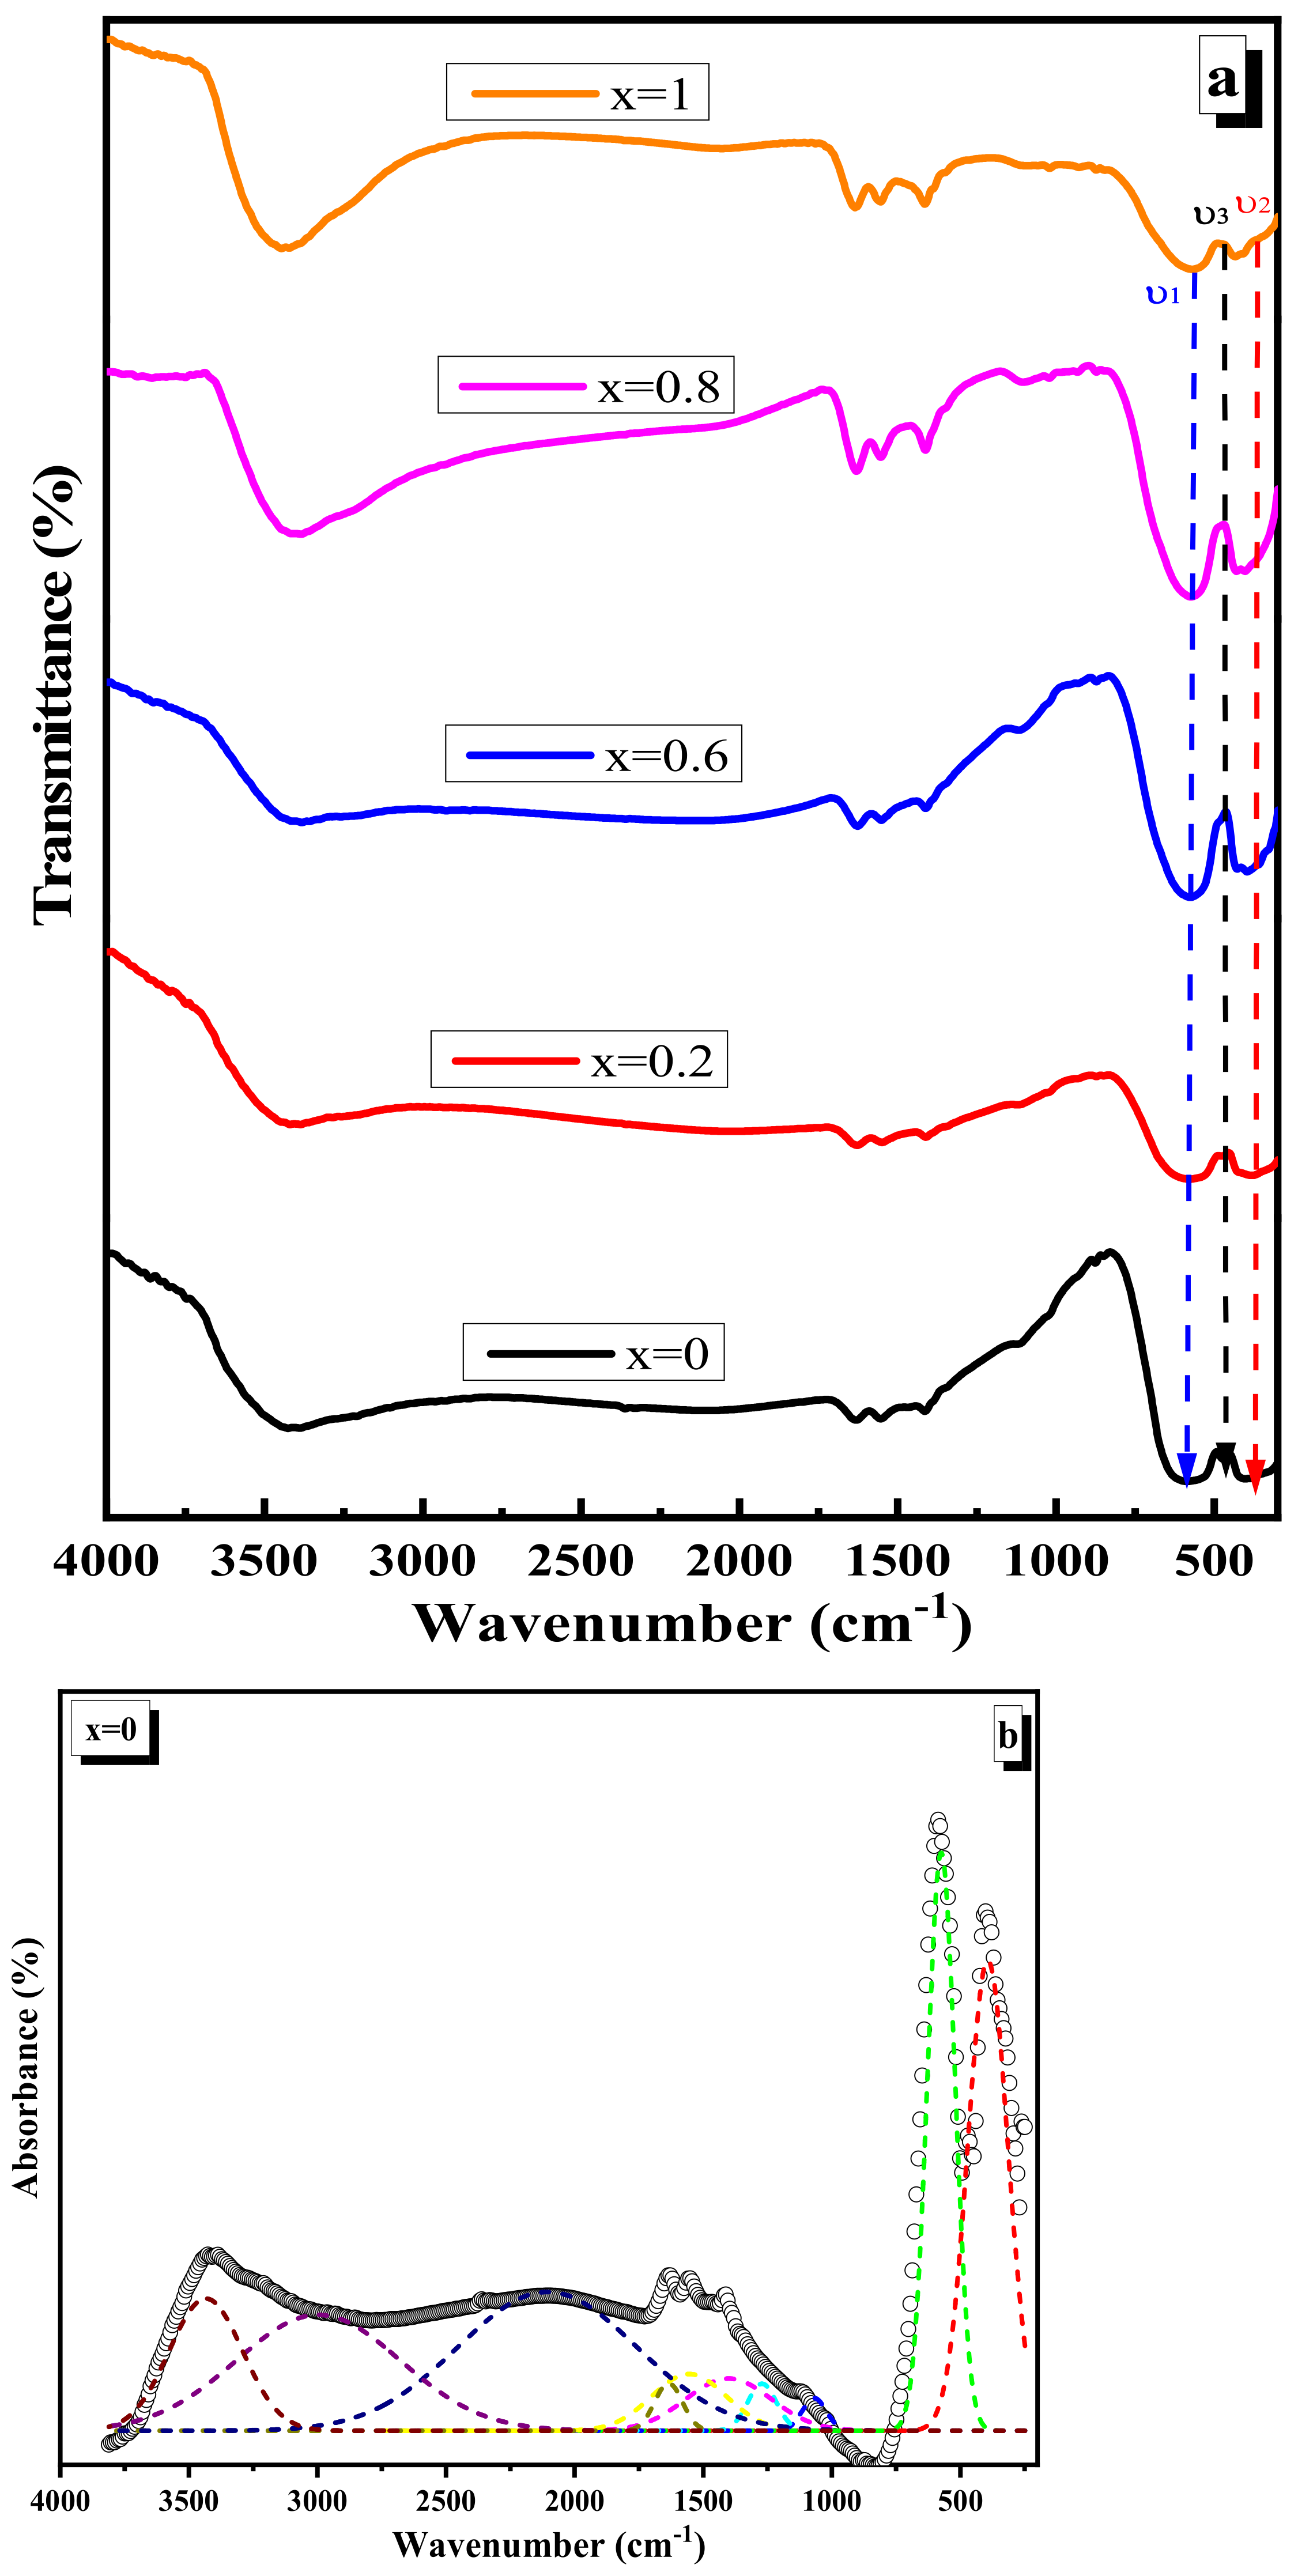
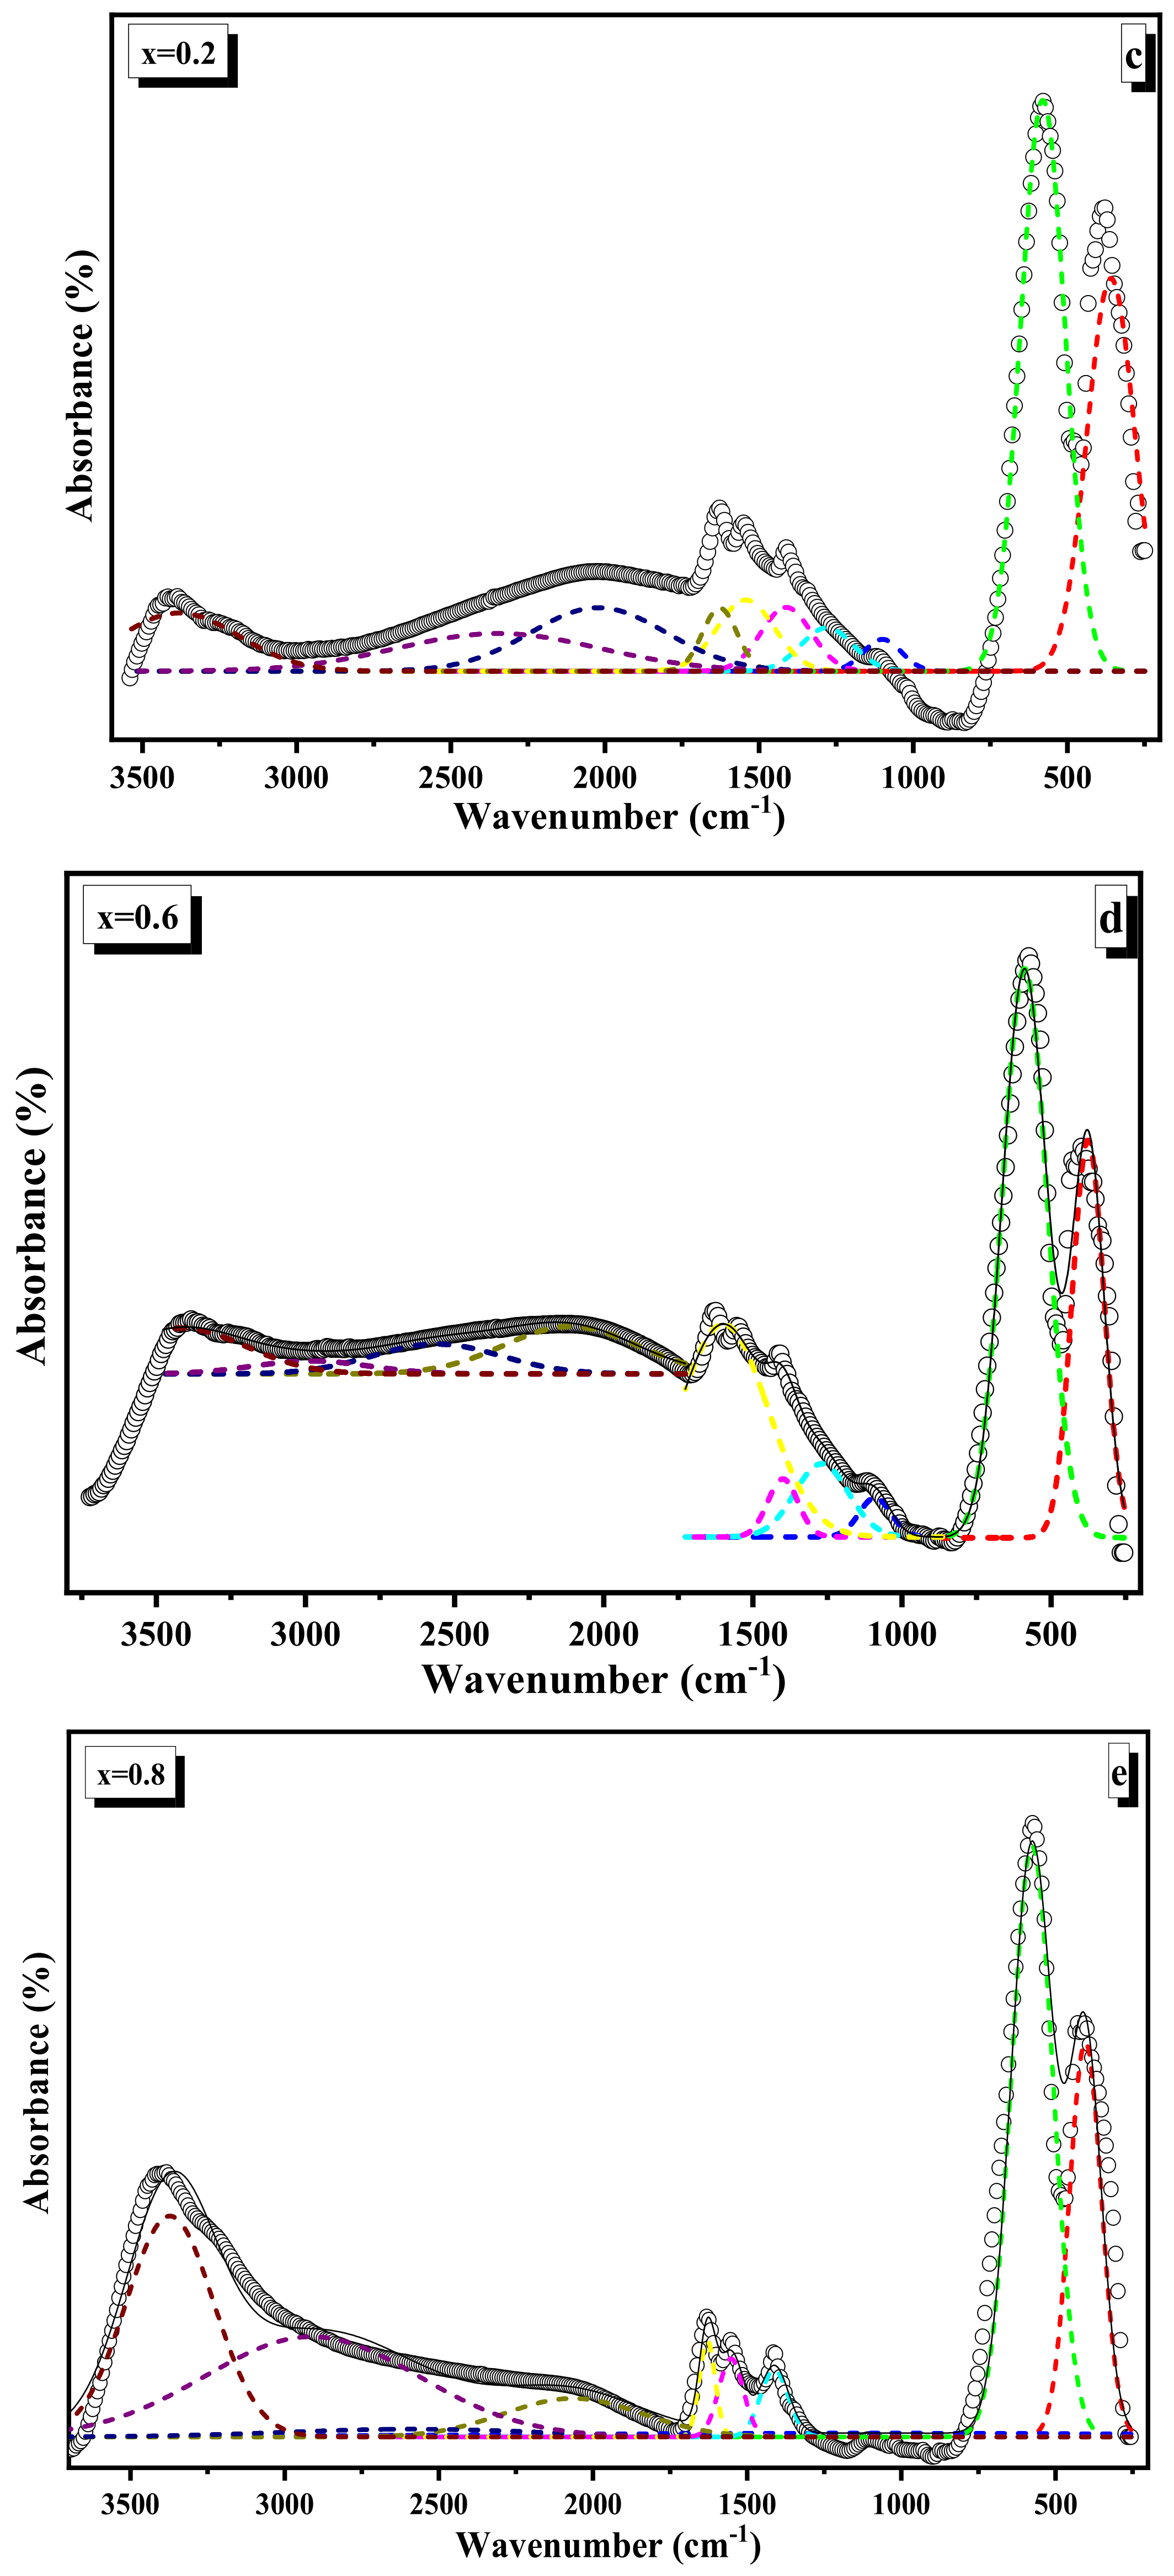
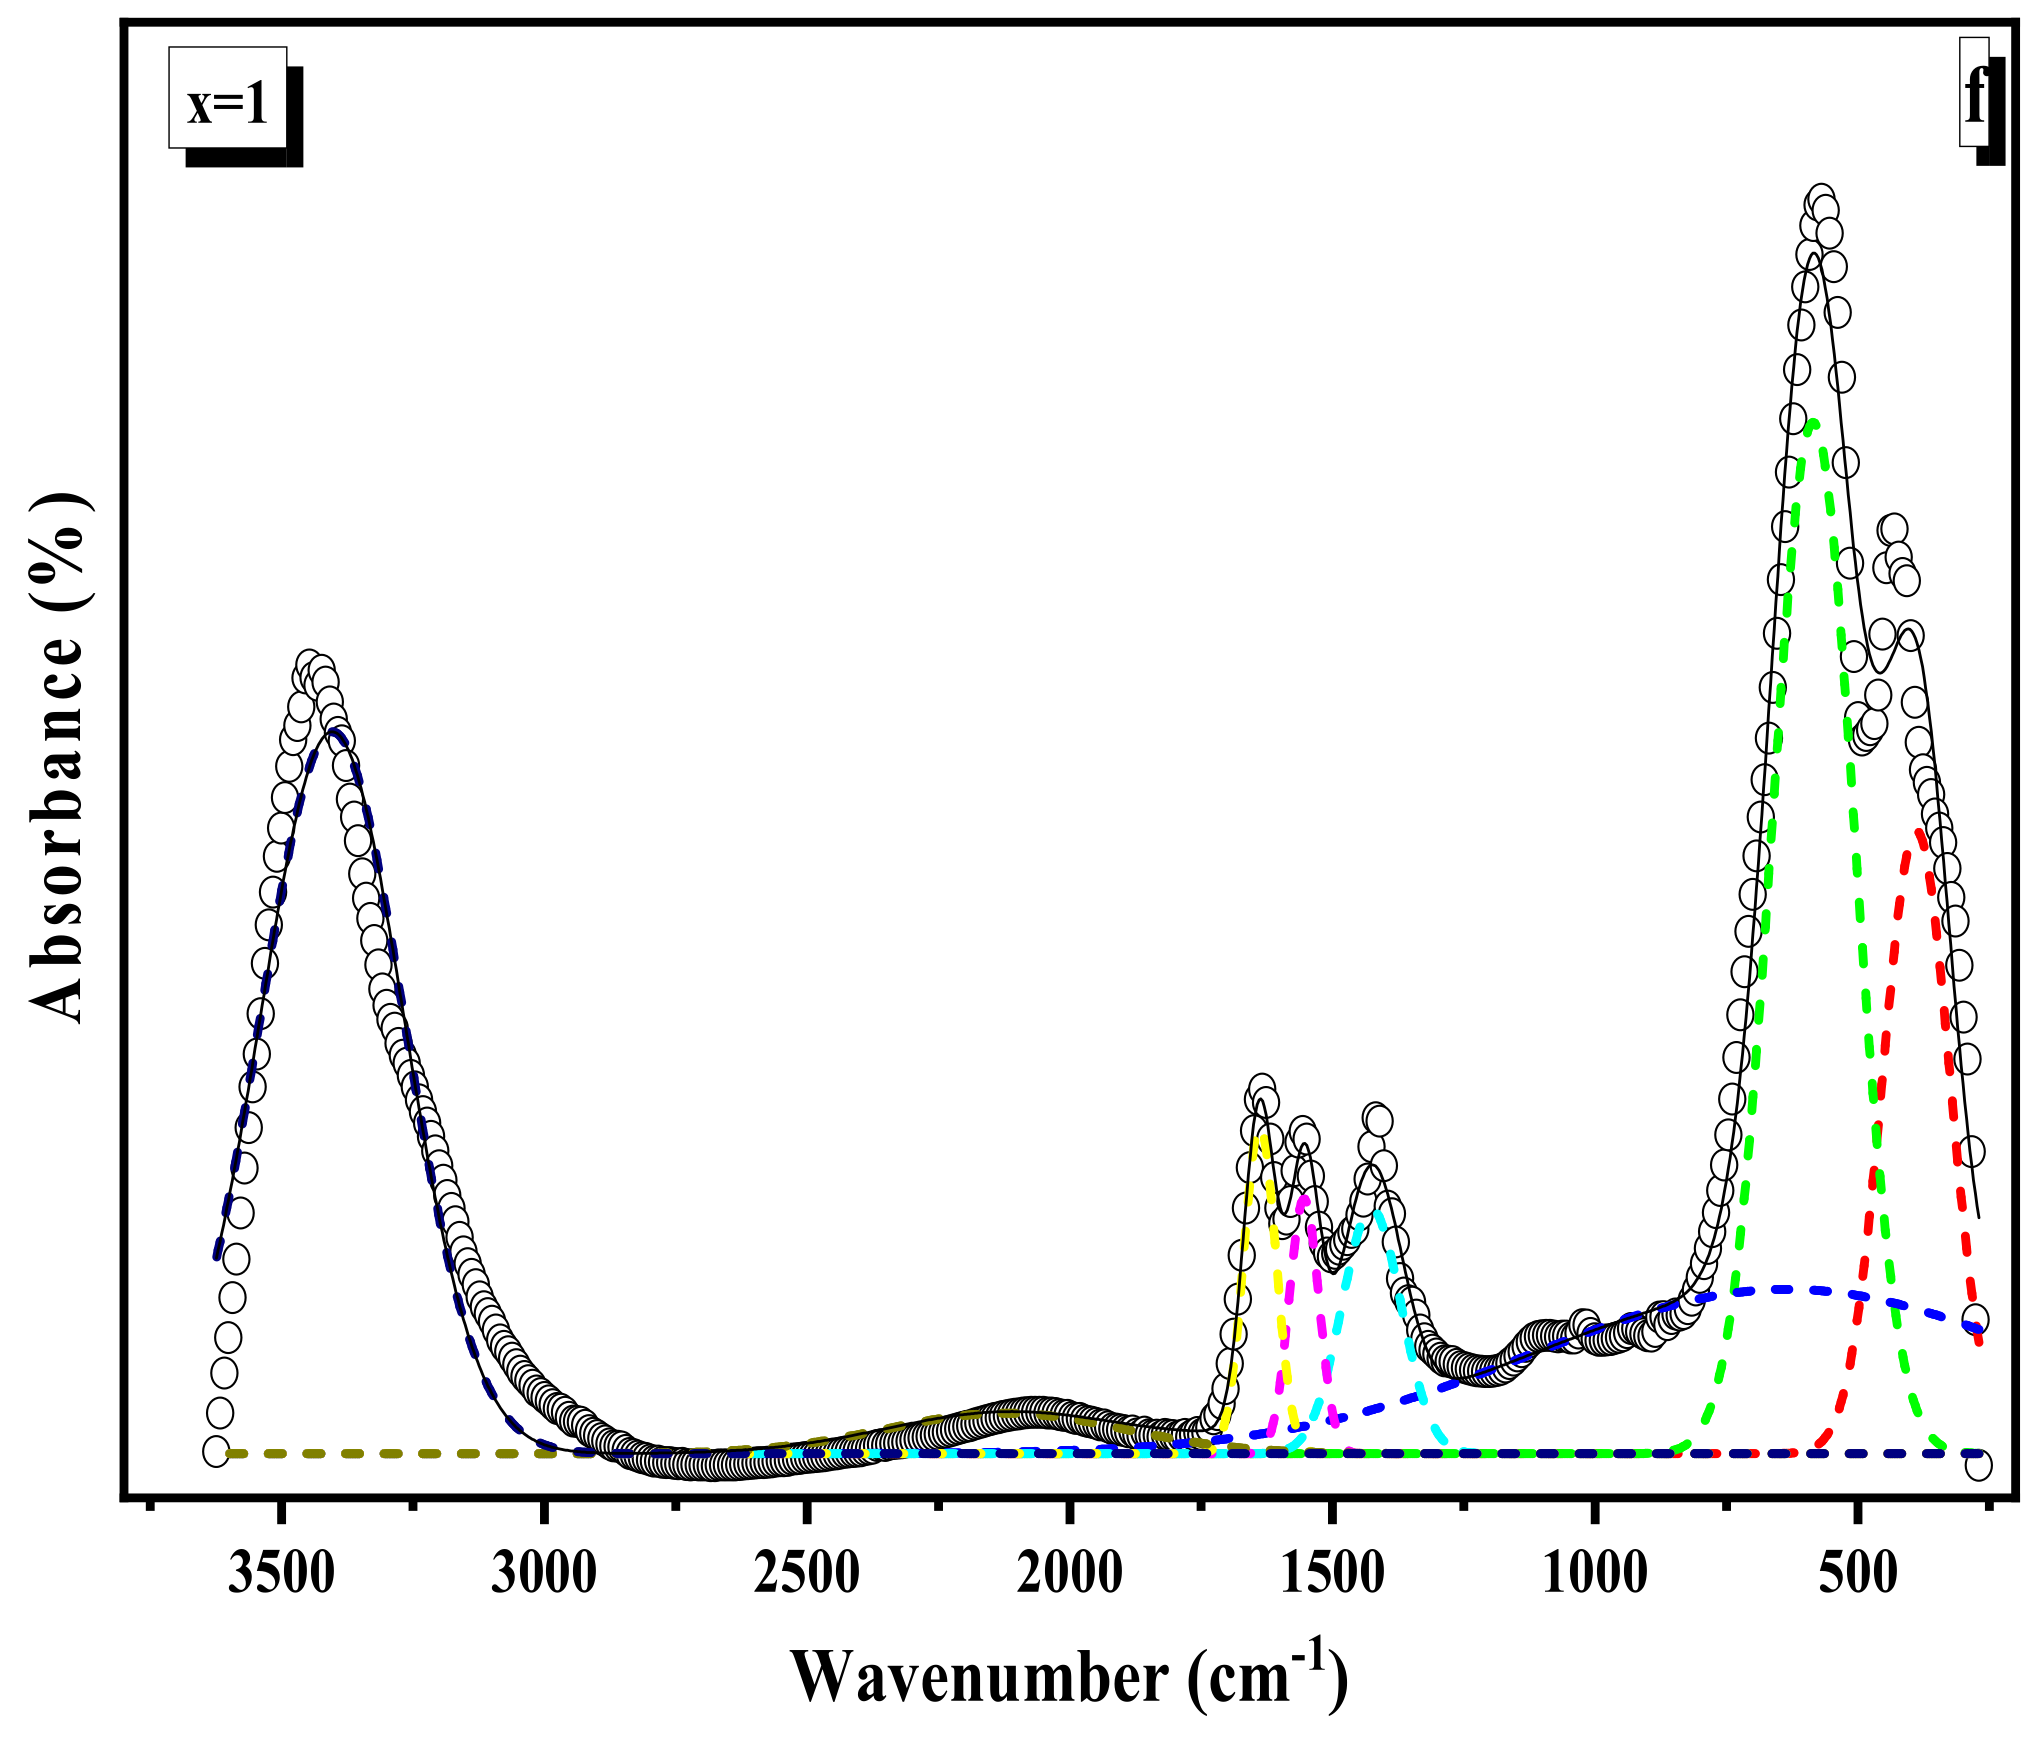
3.4. FTIR Spectroscopy Discussion

The FTIR spectra of the nano ferrite samples Ni 1 x + 2 Mg x + 2 Fe 2 + 3 O 4 (x = 0, 0.2, 0.6, 0.8, and 1) are given in Figure 7a. The absorption spectra show two major absorption bands, around 580 cm−1, and 382 cm−1. The first absorption band specified the stretching vibration of Fe+3–O−2 at the A-site, whereas the second absorption band was particular to the B-site bond vibration [40]. The peaks around 1414 cm−1 represent the vibration of O–H [41]. By contrast, the bands that appear at around 1600 cm−1 and 3500 cm−1 are caused by the bending vibration mode of water molecules and the stretching vibration mode of H–O–H [17]. Variation in the Fe+3 population results in numerous modes of vibration at both the A and B-sites, resulting in changes in the absorption band and widening [38,42].
From the X-ray analysis, the bond length of Fe+3–O−2 at the A-site increases, leading to the decrease of stretching vibration frequencies of the tetrahedral complex, as shown in Table 4. This trend suggests that both the A and B-sites occupy the Mg ion, which results in the displacement of Fe3+ ions away from the oxygen ion, i.e., increases the Fe+3–O−2 distance on both A and B-sites [32]. X-ray results confirmed this discussion.
The force constant (F) for Fe+3–O−2 bonds at both the A and B-sites was estimated using the formula F = 4π2C2μv2, where v is the frequency, μ is the reduced mass, and C is the speed of light in cm/sec [43]. As seen in Table 4, the F of the A-site decreases as the Mg level increases. This is due to the A-site’s vibrating frequency decreasing as the Mg amount increases. The F of the B-site decreases as the Mg content increases up to x = 0.2 and then increases, mimicking the absorption frequency ν2.
Due to the overlapping absorption bands, the experimental spectra have to be deconvolved. This technique was carried out with the use of a Gaussian function. The deconvolution approach enabled more accurate identification of FTIR bands in experimental spectra. Figure 7b–f shows an example representation of the deconvoluted FTIR spectrum of the ferrite sample with ten Gaussian components. Table 5 shows the peak positions and relative area (%) assignments.

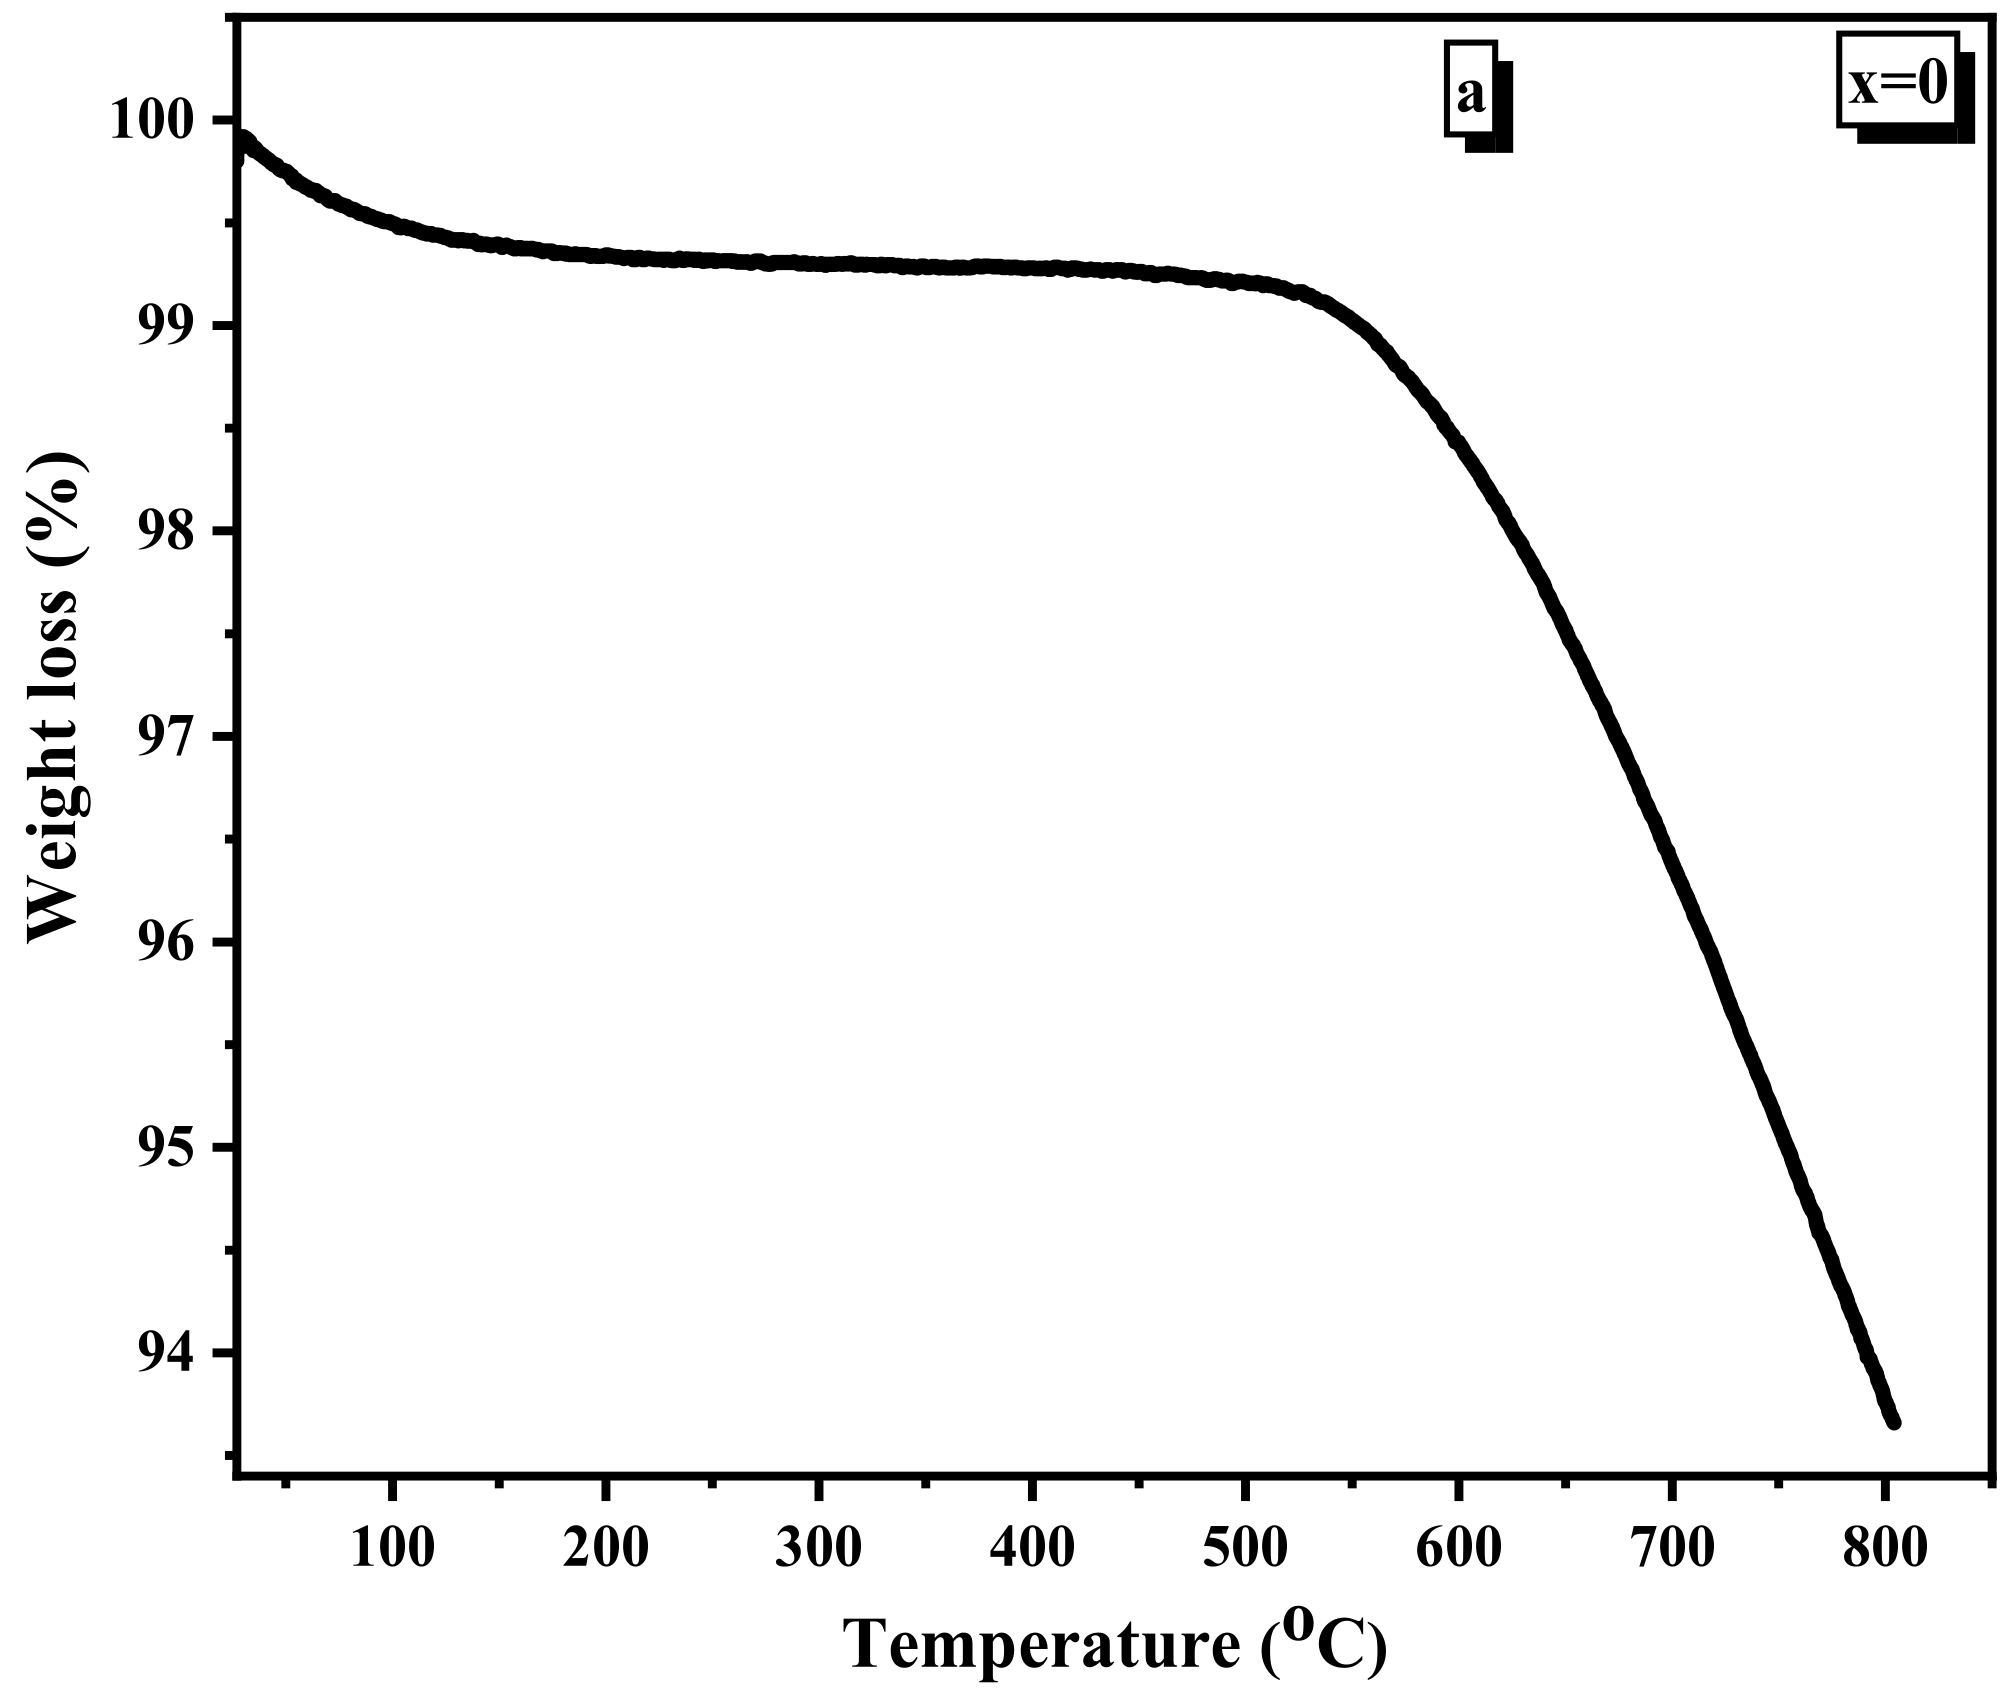
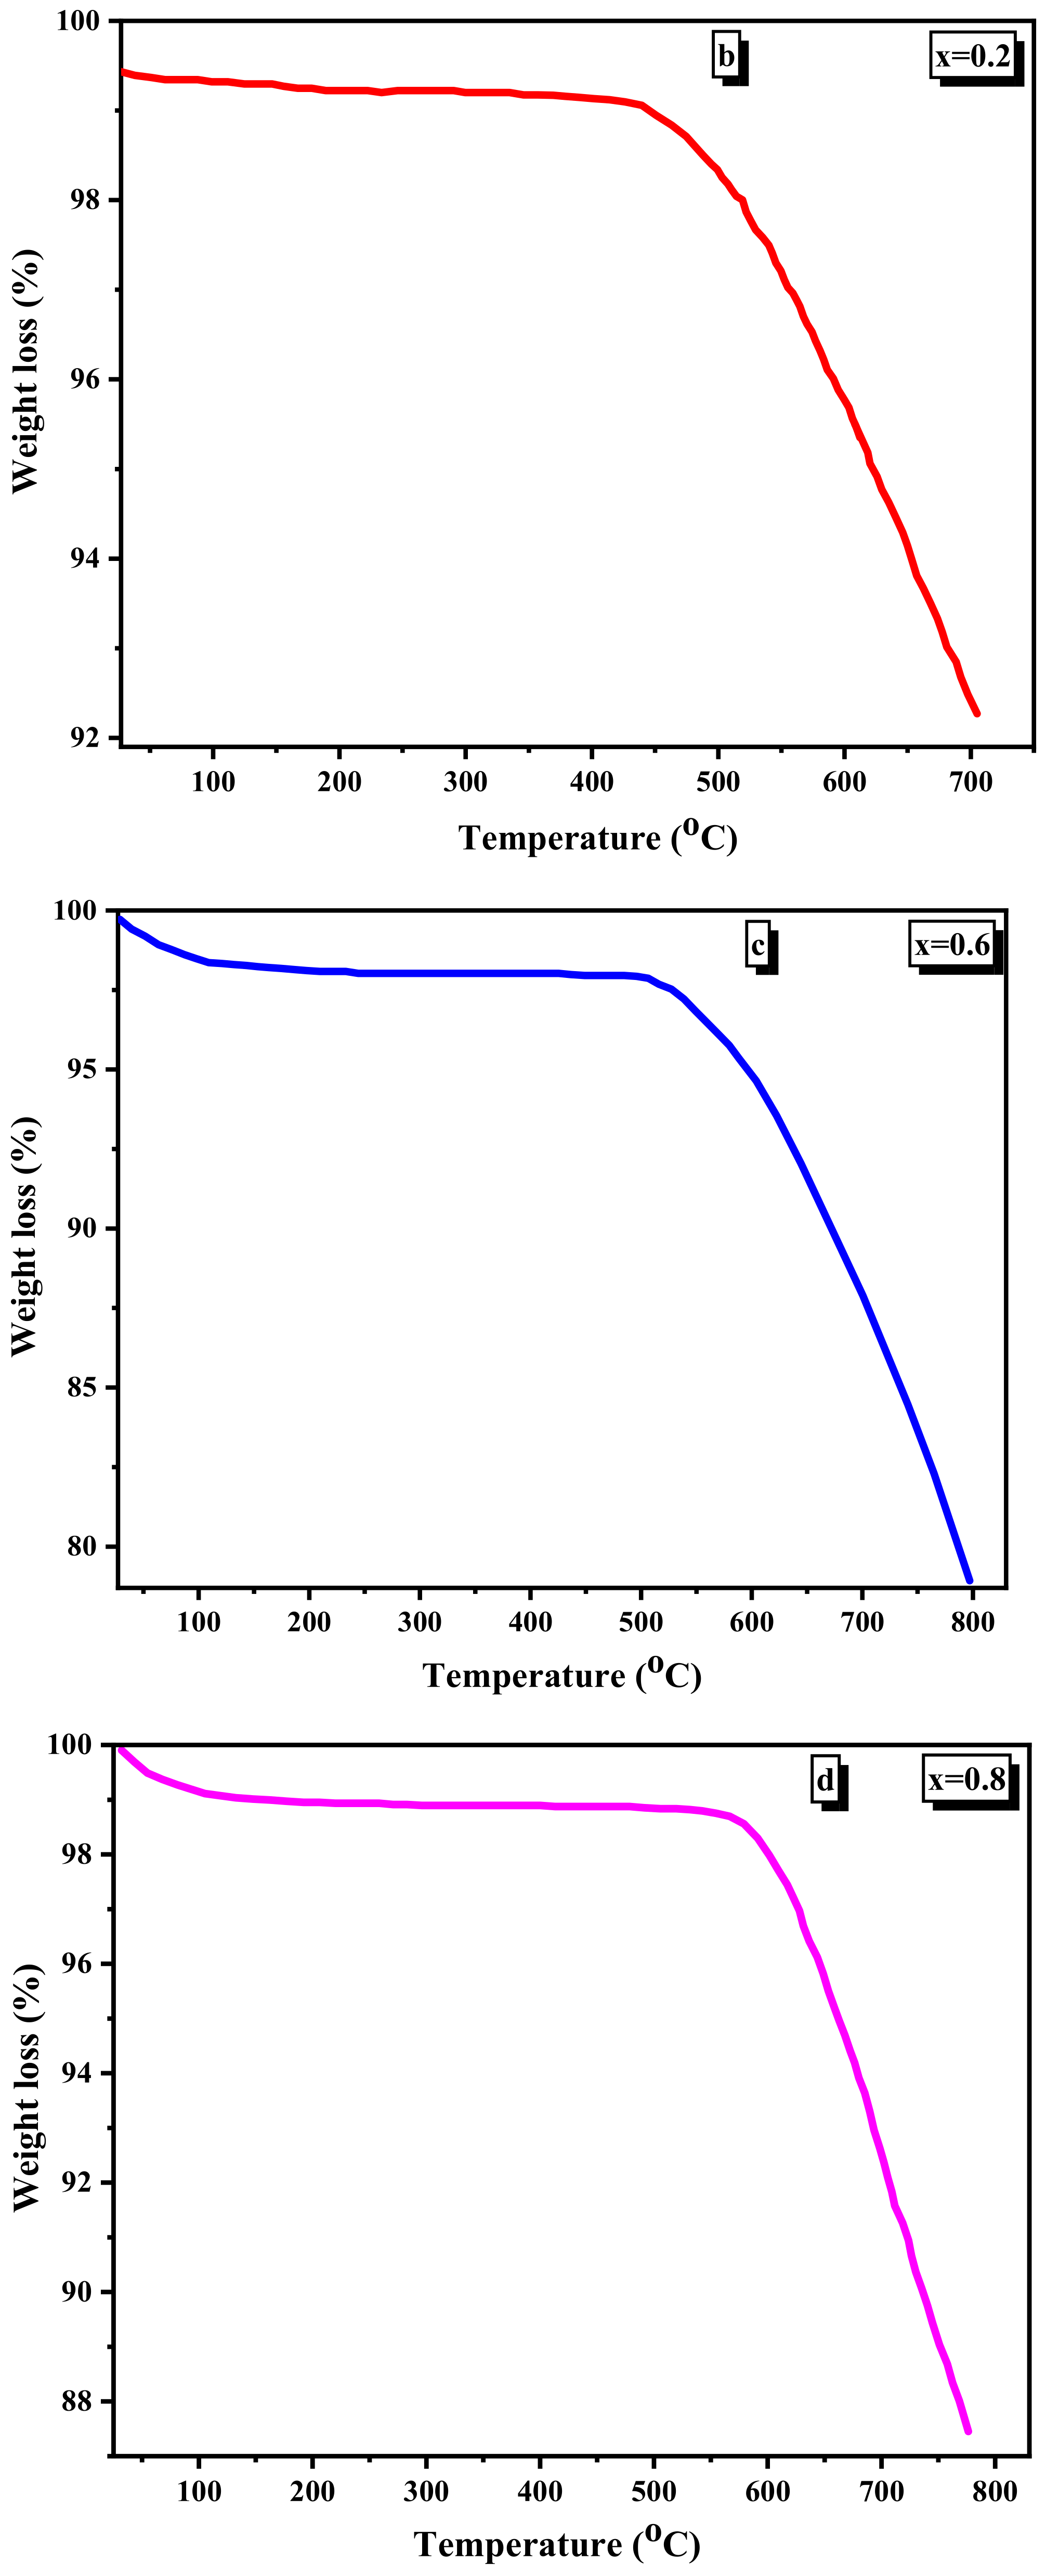
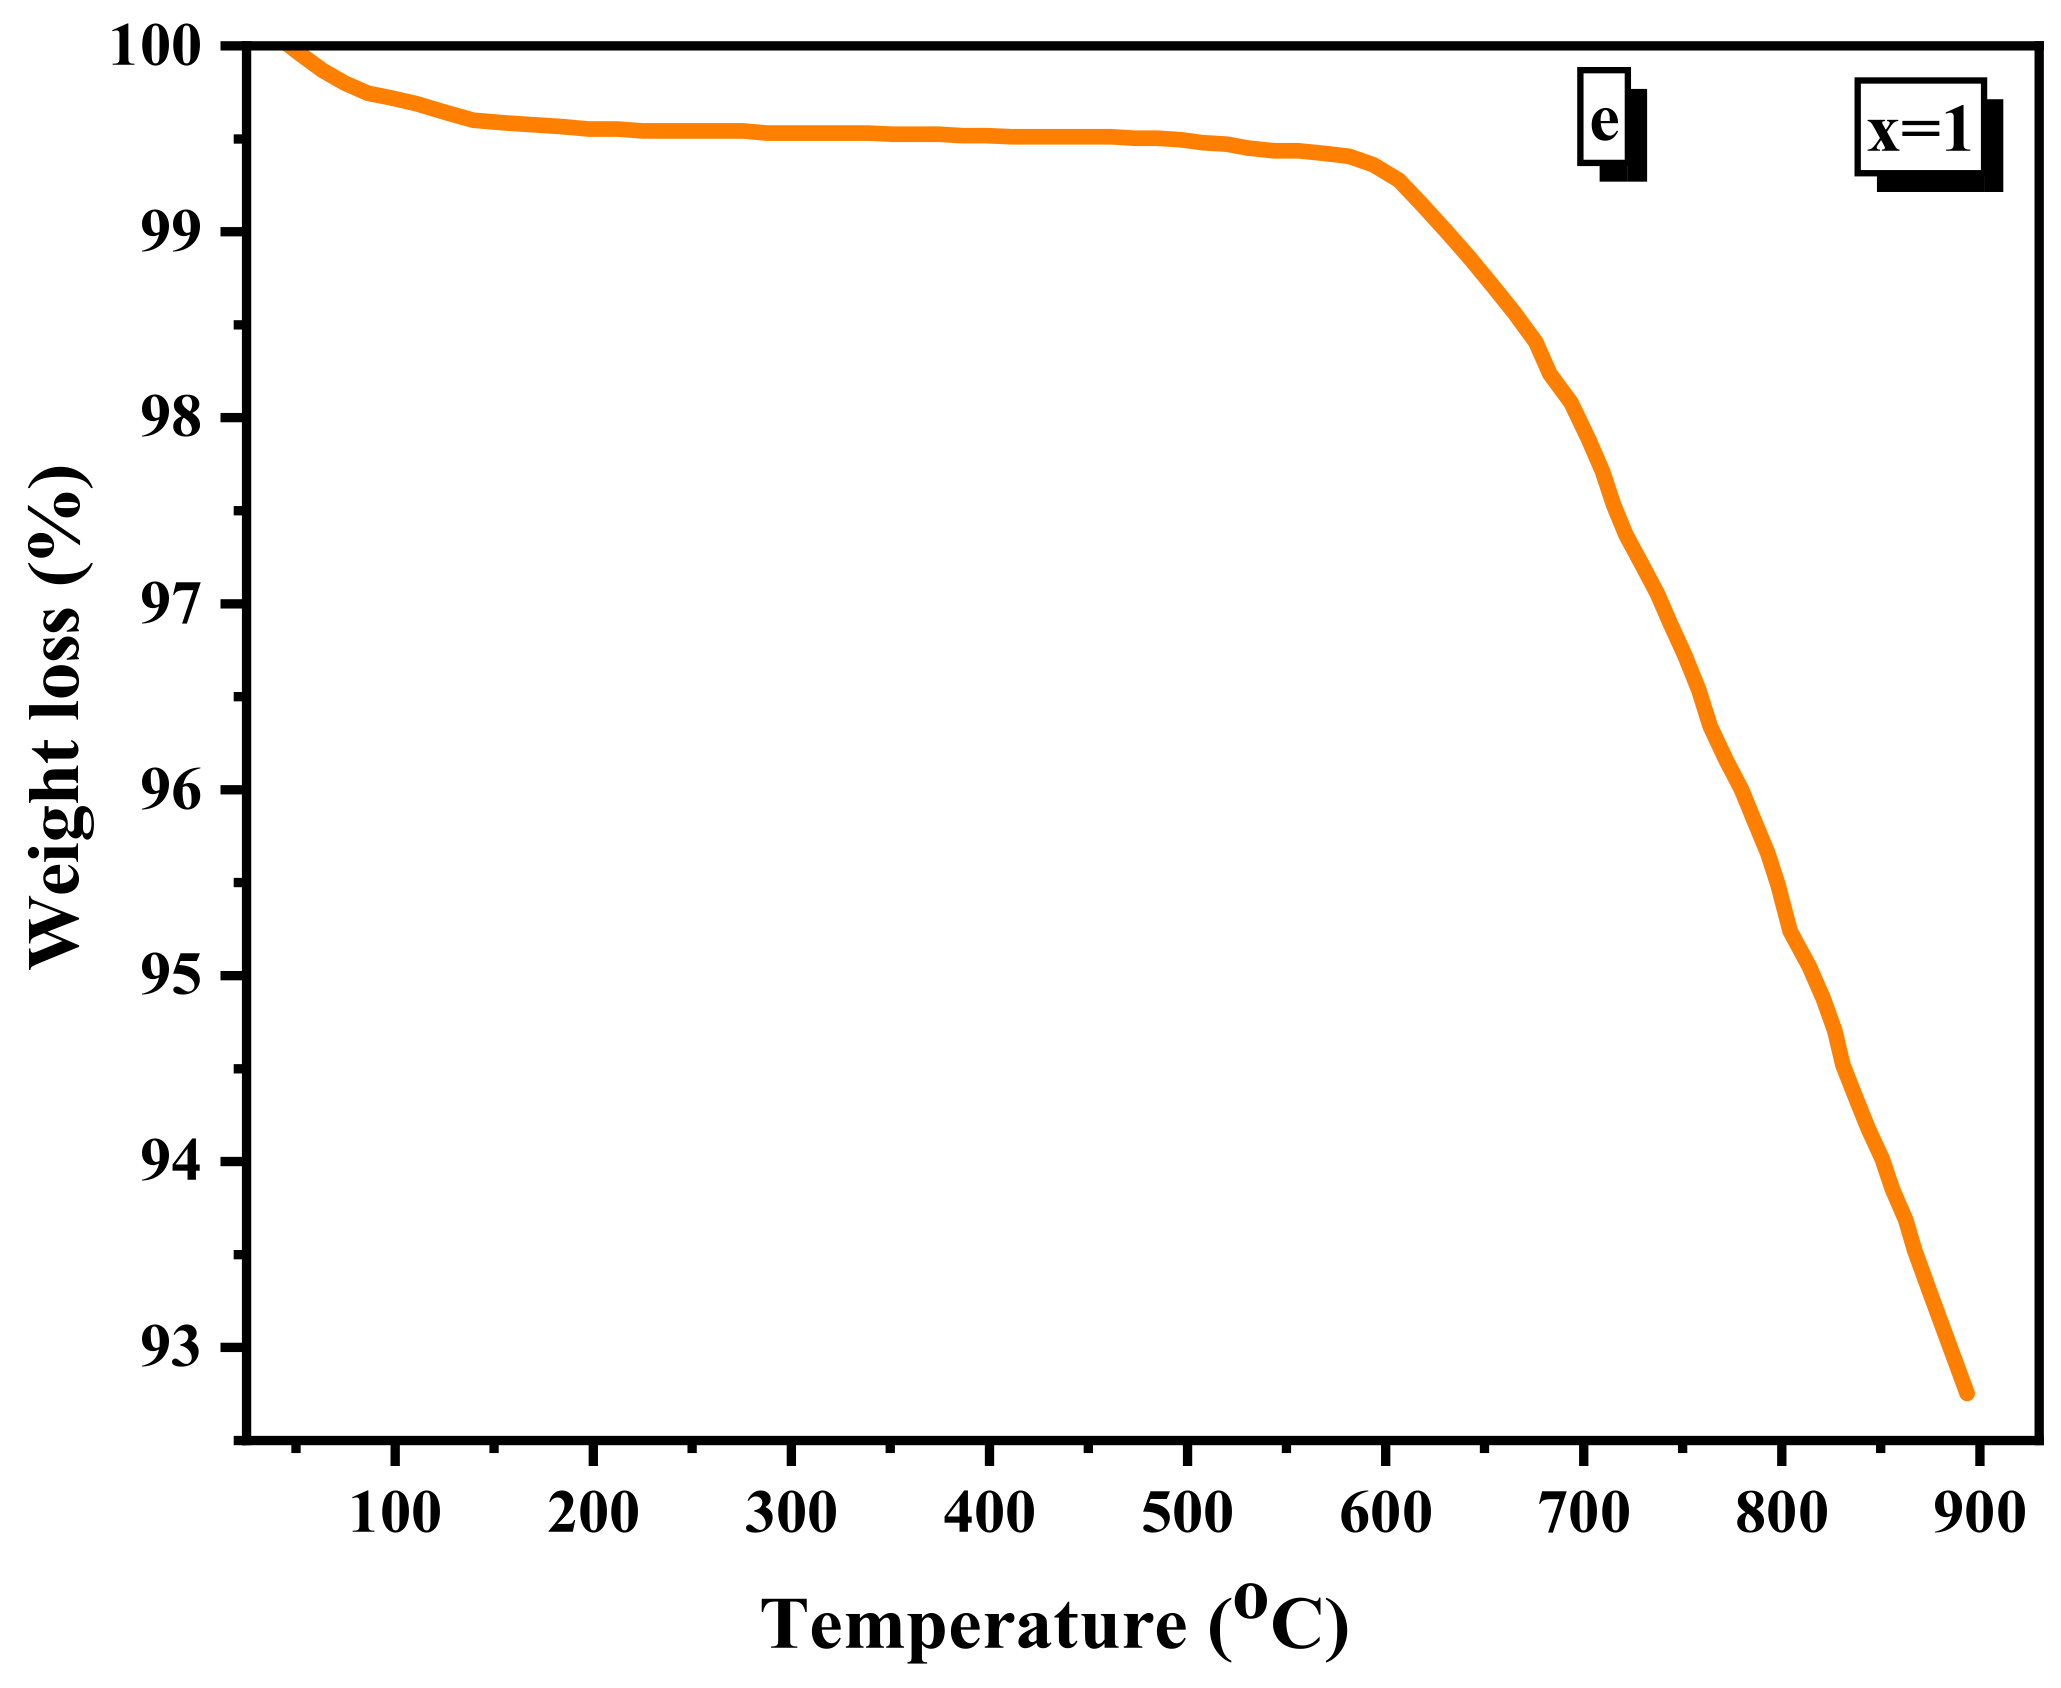
3.5. TGA (Thermogravimetric Analysis) Discussion

Figure 8a–e shows the TGA curves of Ni 1 x + 2 Mg x + 2 Fe 2 + 3 O 4 (x = 0, 0.2, 0.6, 0.8, and 1) at temperatures changing from room temperature (RT) to 1173 K. The TGA curves indicated that weight loss happens in two stages. The first stage from room temperature to 373 K is due to H2O evaporation. In comparison, the second from 773 K up to 1073 K is due to the degradation and decomposition of the organic components that resulted during the preparation of the samples by the flash auto combustion method. Weight loss in the first stage is about 1%, while it is roughly 9% in the second stage. There is a shift from 723 K to 893 K when Mg concentration is increased in the samples, which implies that the temperature stability improves due to increasing the Mg concentration [44].

3.6. Magnetic Properties of the Prepared Samples

3.6.1. VSM (Vibrating Sample Magnetometer) Discussion

The magnetic hysteresis loop, which shows the magnetization vs. magnetic field for the Ni 1 x + 2 Mg x + 2 Fe 2 + 3 O 4 (x = 0, 0.2, 0.6, 0.8, and 1), is shown in Figure 9, which shows that the material has ferrimagnetic properties with a soft character. The magnetic parameters such as saturation magnetization (Ms), remnant magnetization (Mr), area of the hysteresis loop, coercive field (Hc), squares, and magnetic moment can be deduced from the hysteresis loop.
The value of Ms, Mr, and Hc decrease by increasing Mg concentration, as given in Table 6. The magnetic moment of Ni ions is 2μB due to the two unpaired electrons in the outer shell.
In contrast, Mg ions have no unpaired electrons, and their magnetic moment equals zero. Additionally, Mg ions prefer to substitute for Ni ions at the B-site, which decreases the magnetization of the B-site, resulting in a drop in the net magnetization of the produced ferrite samples when the Mg content is increased. When some Mg ions occupy the A-site, it causes some shift of Fe3+ ions to the B-site with 5μB magnetic moments. This migration of Fe3+ ions leads to an initial increase of Ms at x = 0.2. So, we can say that two factors control magnetization in these nanoparticle samples. The first is the substitution of Mg instead of Ni at the B-site, the second is the occupation of Mg at the A-site, and the migration of Fe3+ from A to B-sites.
As given in Table 6, the Hc decreases with increasing Mg content. The Hc in nano-ferrites is influenced by many factors like crystallite size, canting angle, and anisotropy. Mg ions have zero orbital magnetic moments and zero spin angular moments compared with Ni and Fe3+, i.e., no anisotropy. By increasing Mg content, the magnetic anisotropy decreases, leading to the decrease of Hc value. The prepared samples have a multidomain structure that permits Hc reduction when the D reduces by increasing the Mg concentration. The non-saturation in the magnetic hysteresis loop can be attributed to several factors [17].
The D of the prepared samples is small, and it is equal to 12–19 nm, so the presence of superparamagnetic grains in these samples contributes to the non-saturation. On the other hand, the surface anisotropy of the small grain also contributes to the non-saturation of the magnetic moment. The μexp (experimental magnetic moment) in Bohr magneton ( μ B ) was determined [44] using Equation (10):
μ e x p = M w × M s 5585  
The μexp increases with increasing Mg content from x = 0 to x = 0.2 and decreases at higher Mg content, as given in Table 6. μexp behaves identically to Ms. The cation distribution may help to explain the prepared samples’ magnetization behavior. Neal’s theory was used to compute the net magnetic moment of the manufactured ferrite samples based on the X-ray cation distribution. Increased Mg concentration causes an increase in the X-ray magnetic moment, as seen in Table 6; this is owing to a rise in Fe3+ migration from B to A-site, which decreases net magnetization.

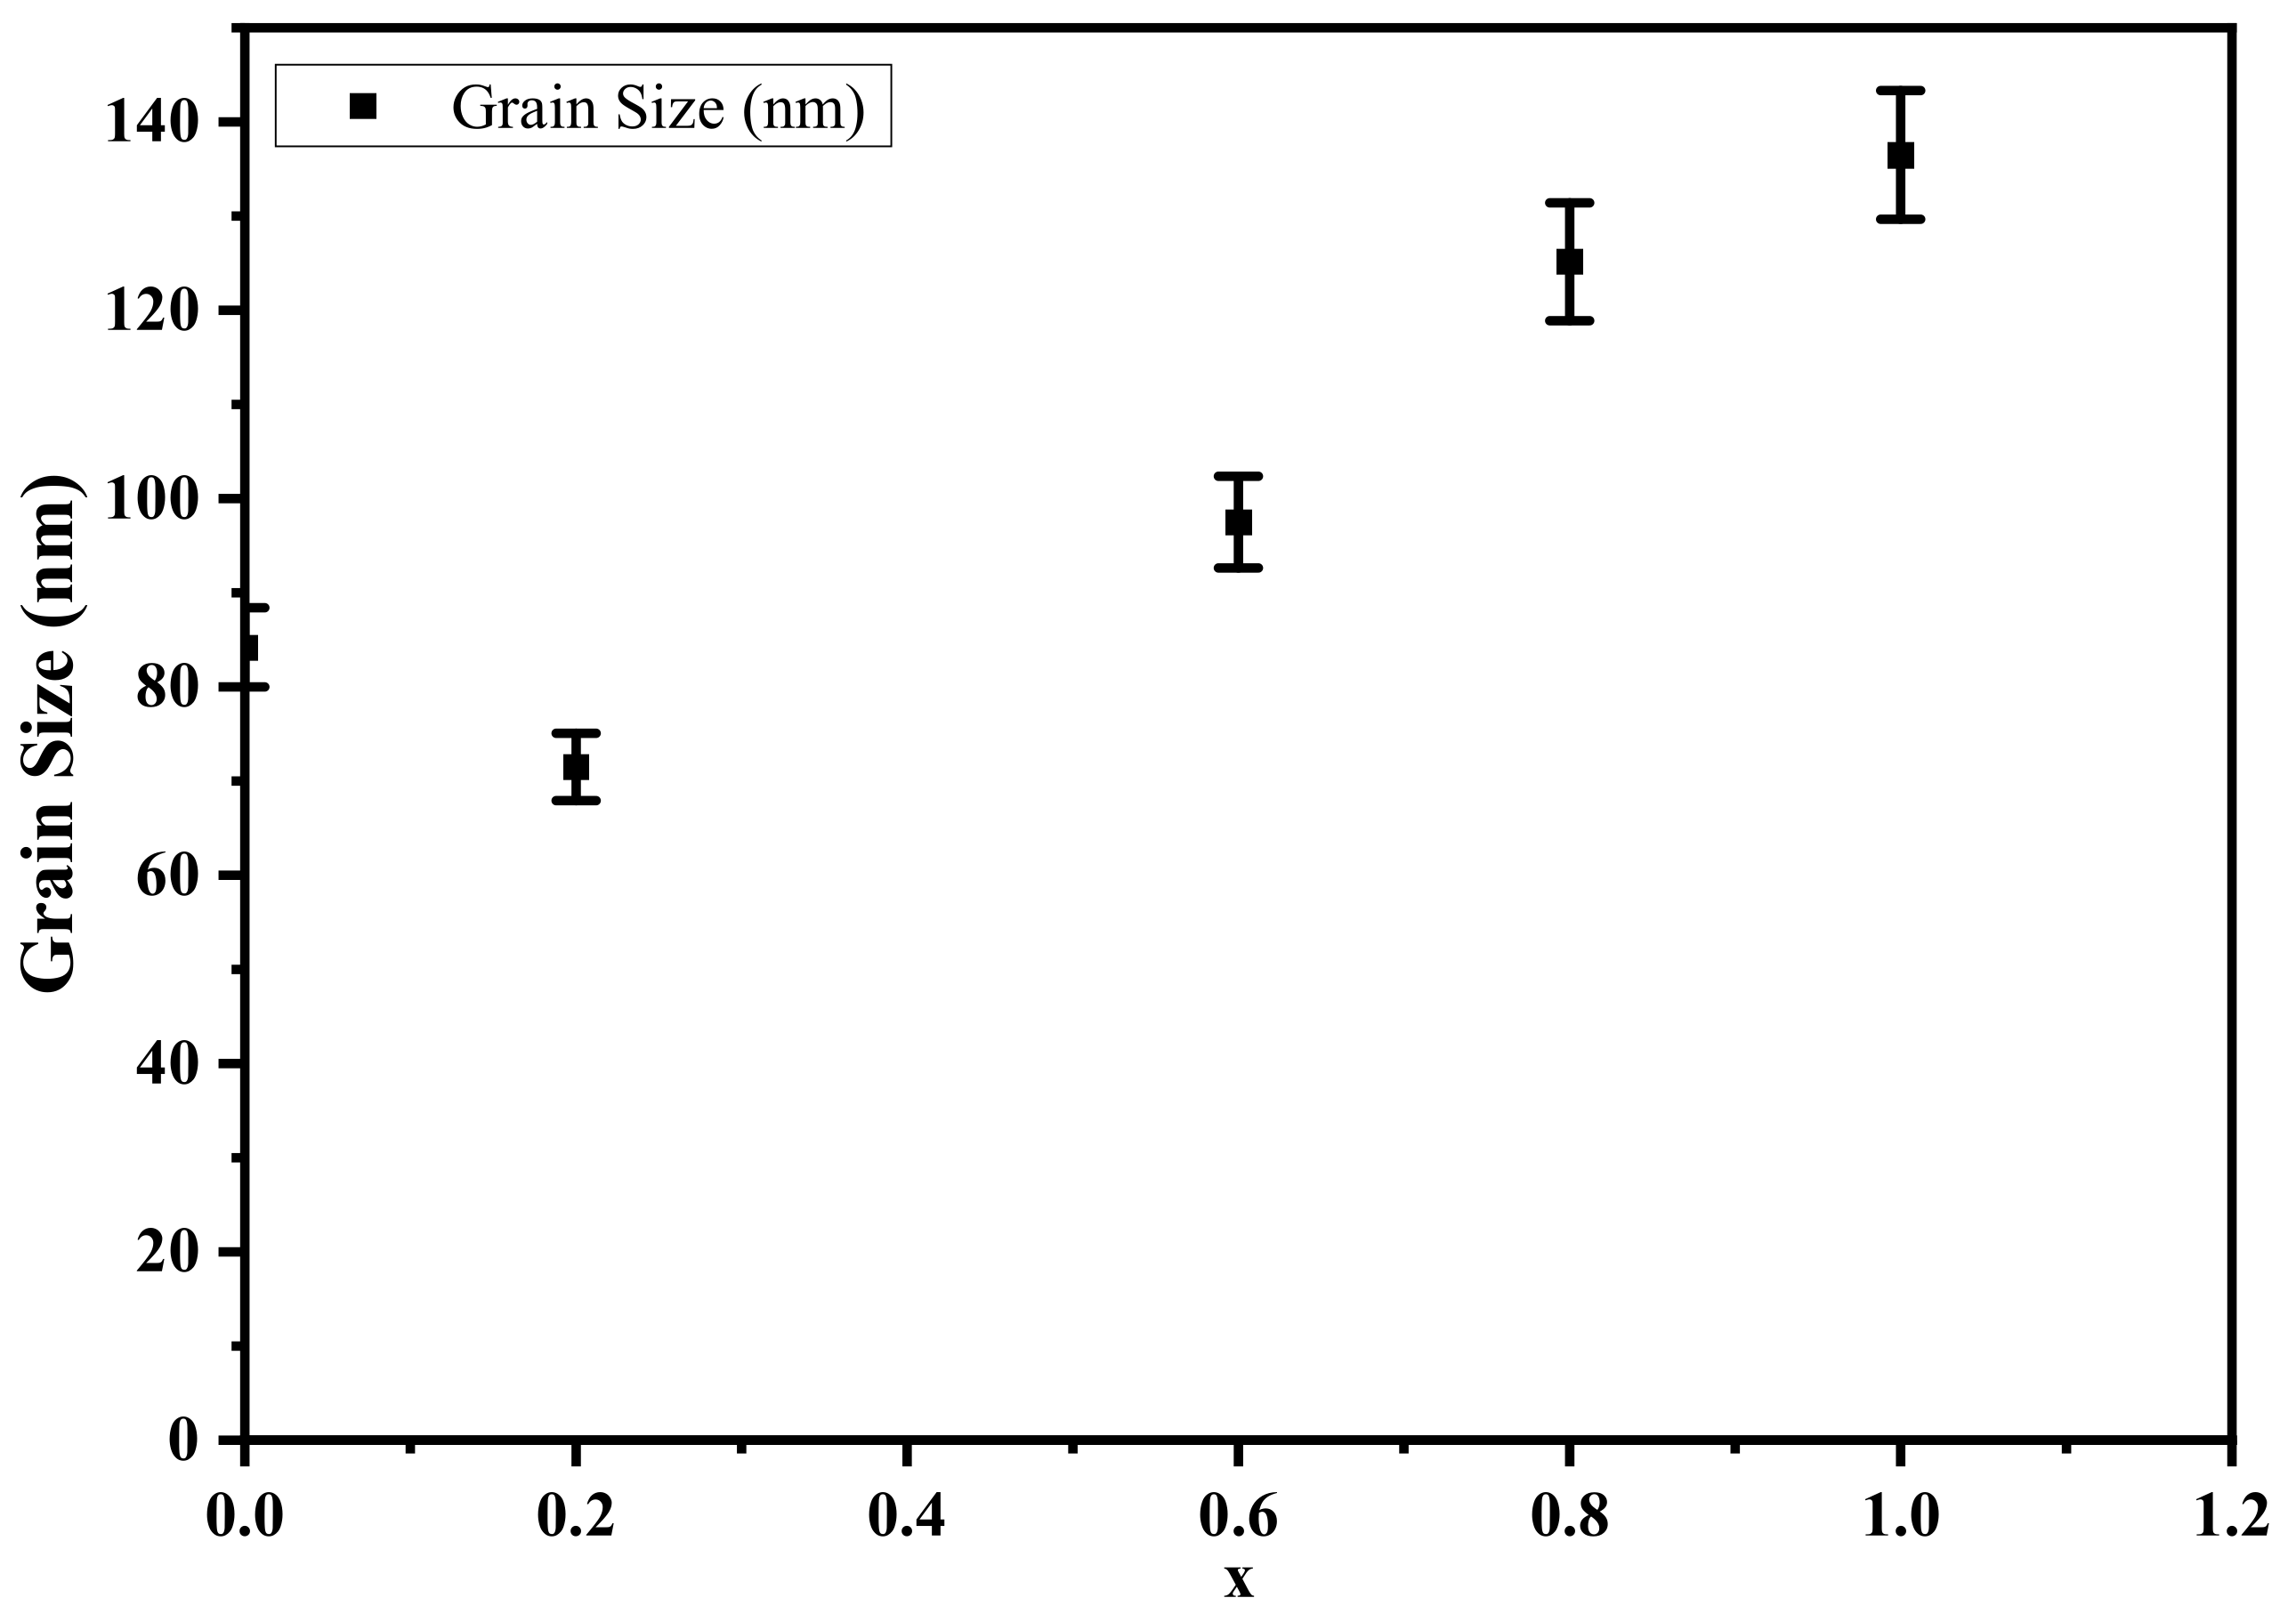
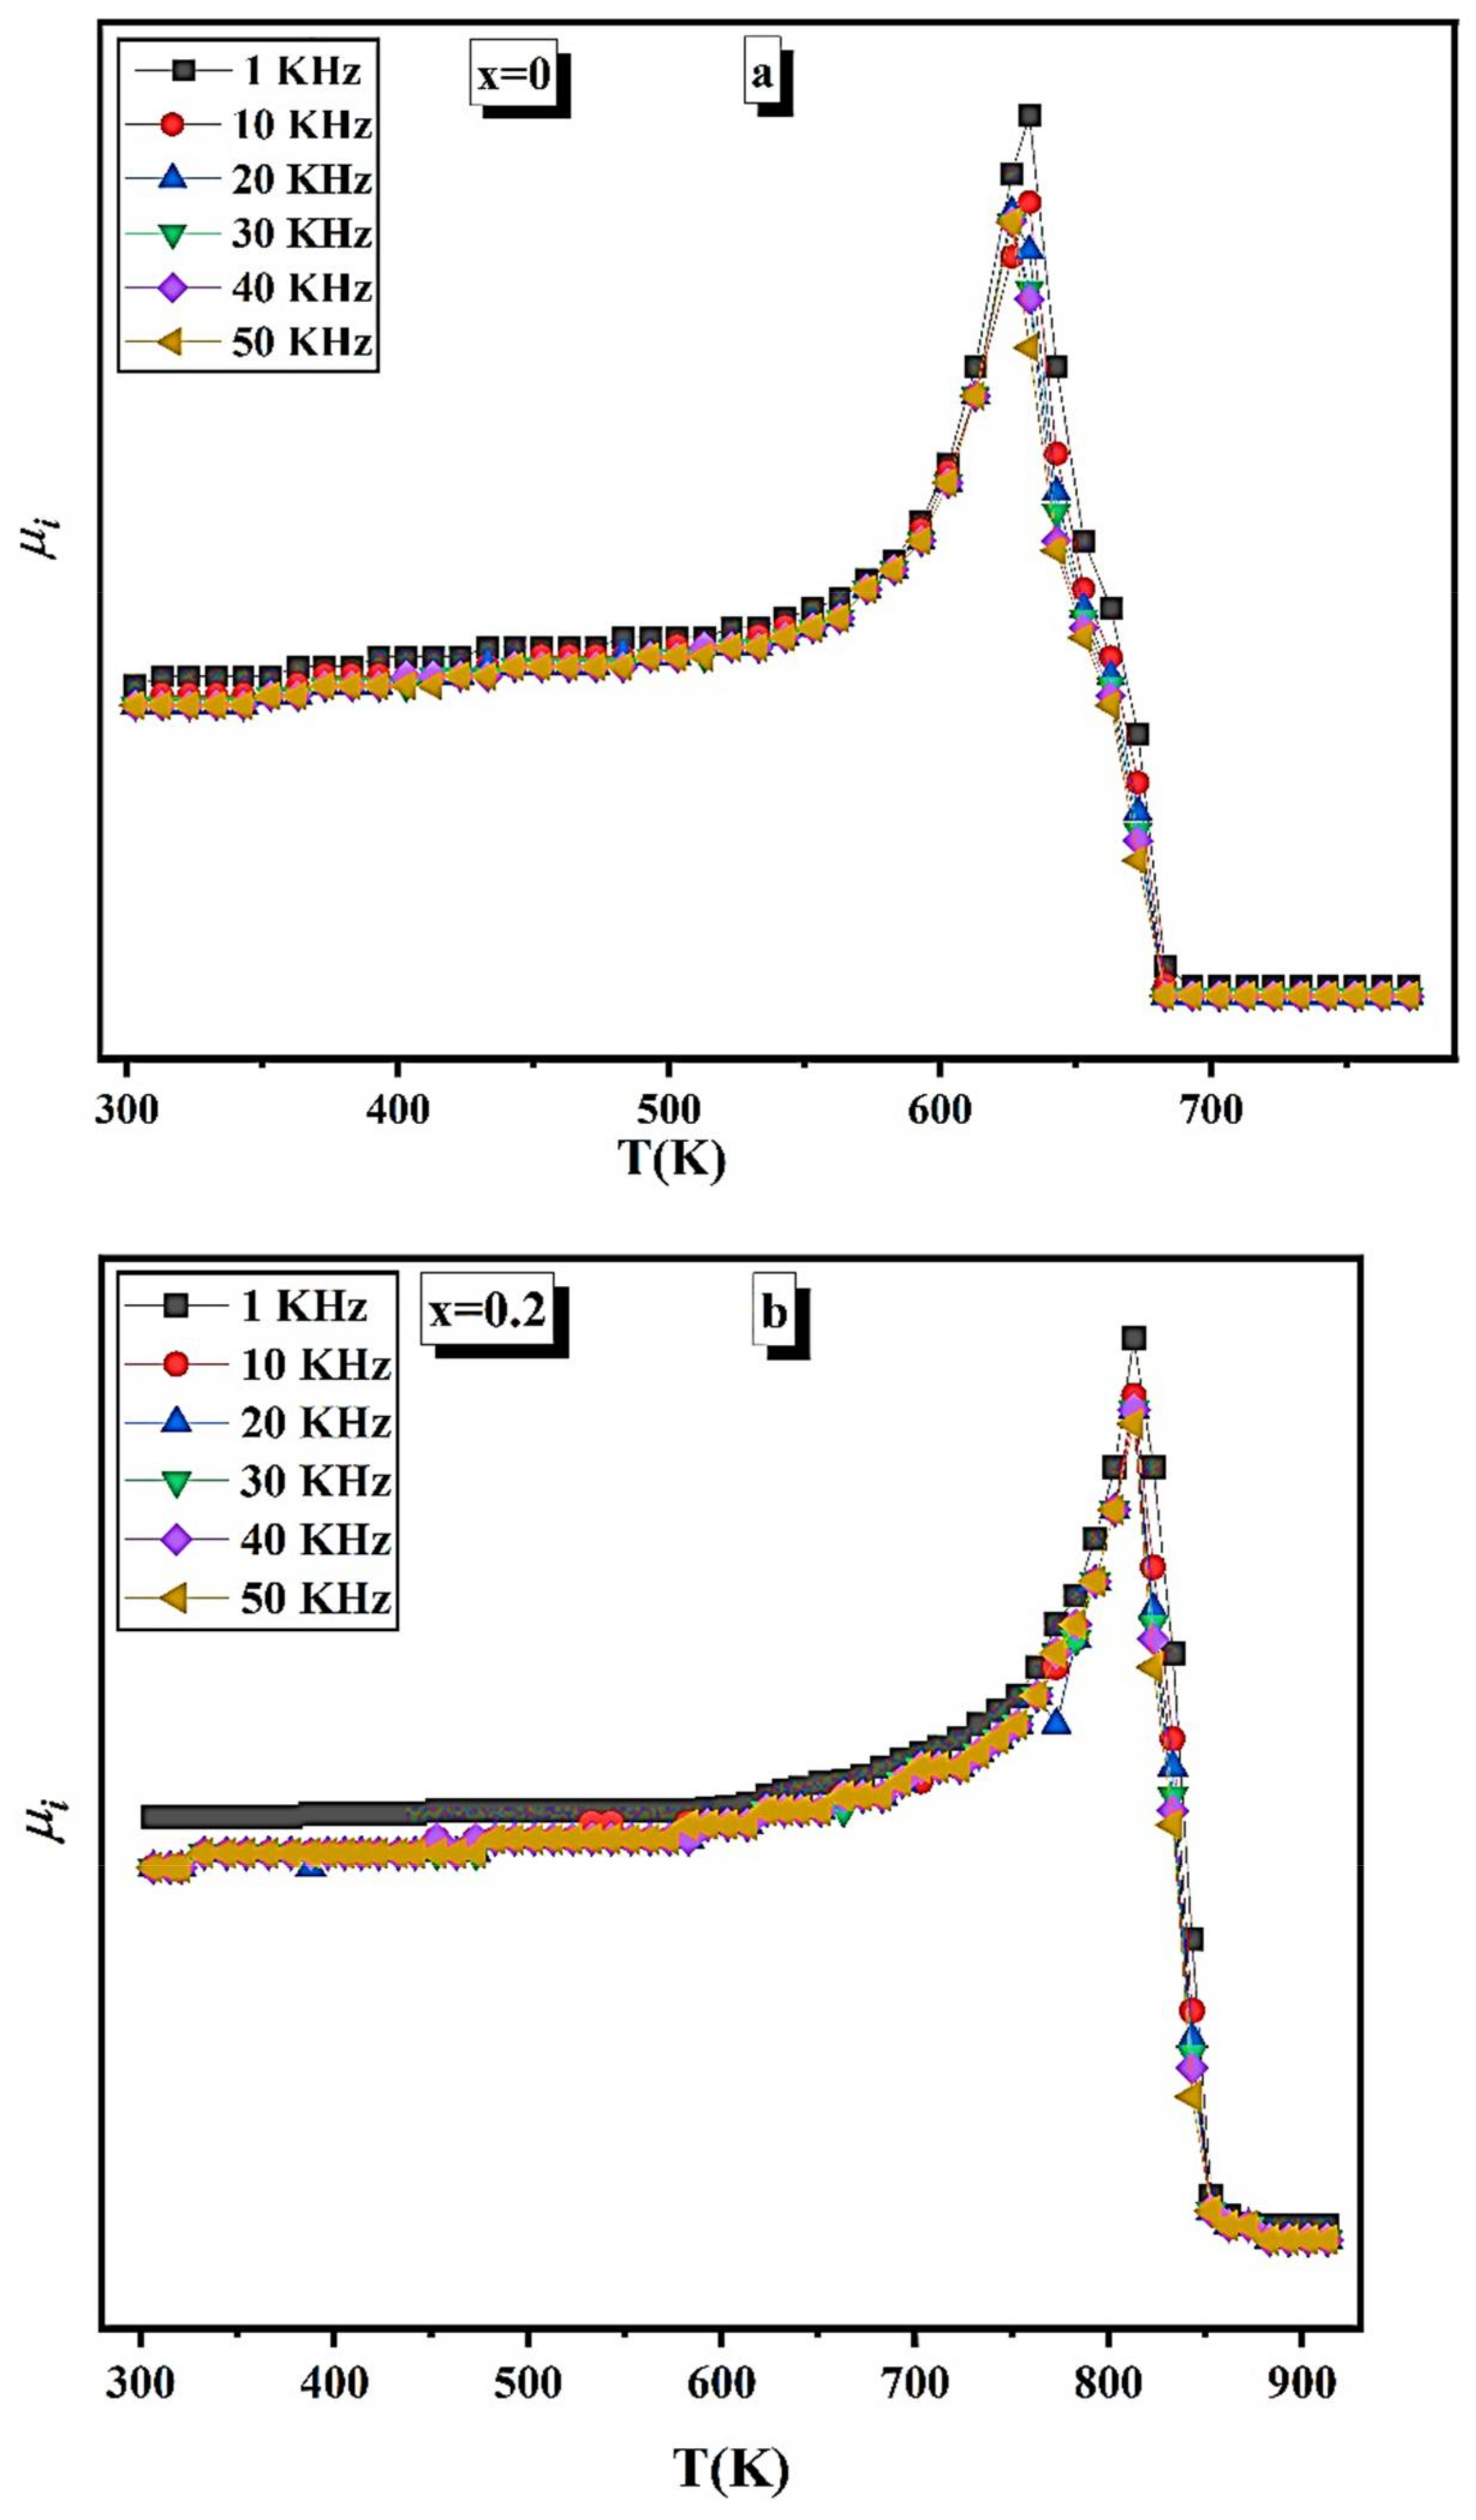
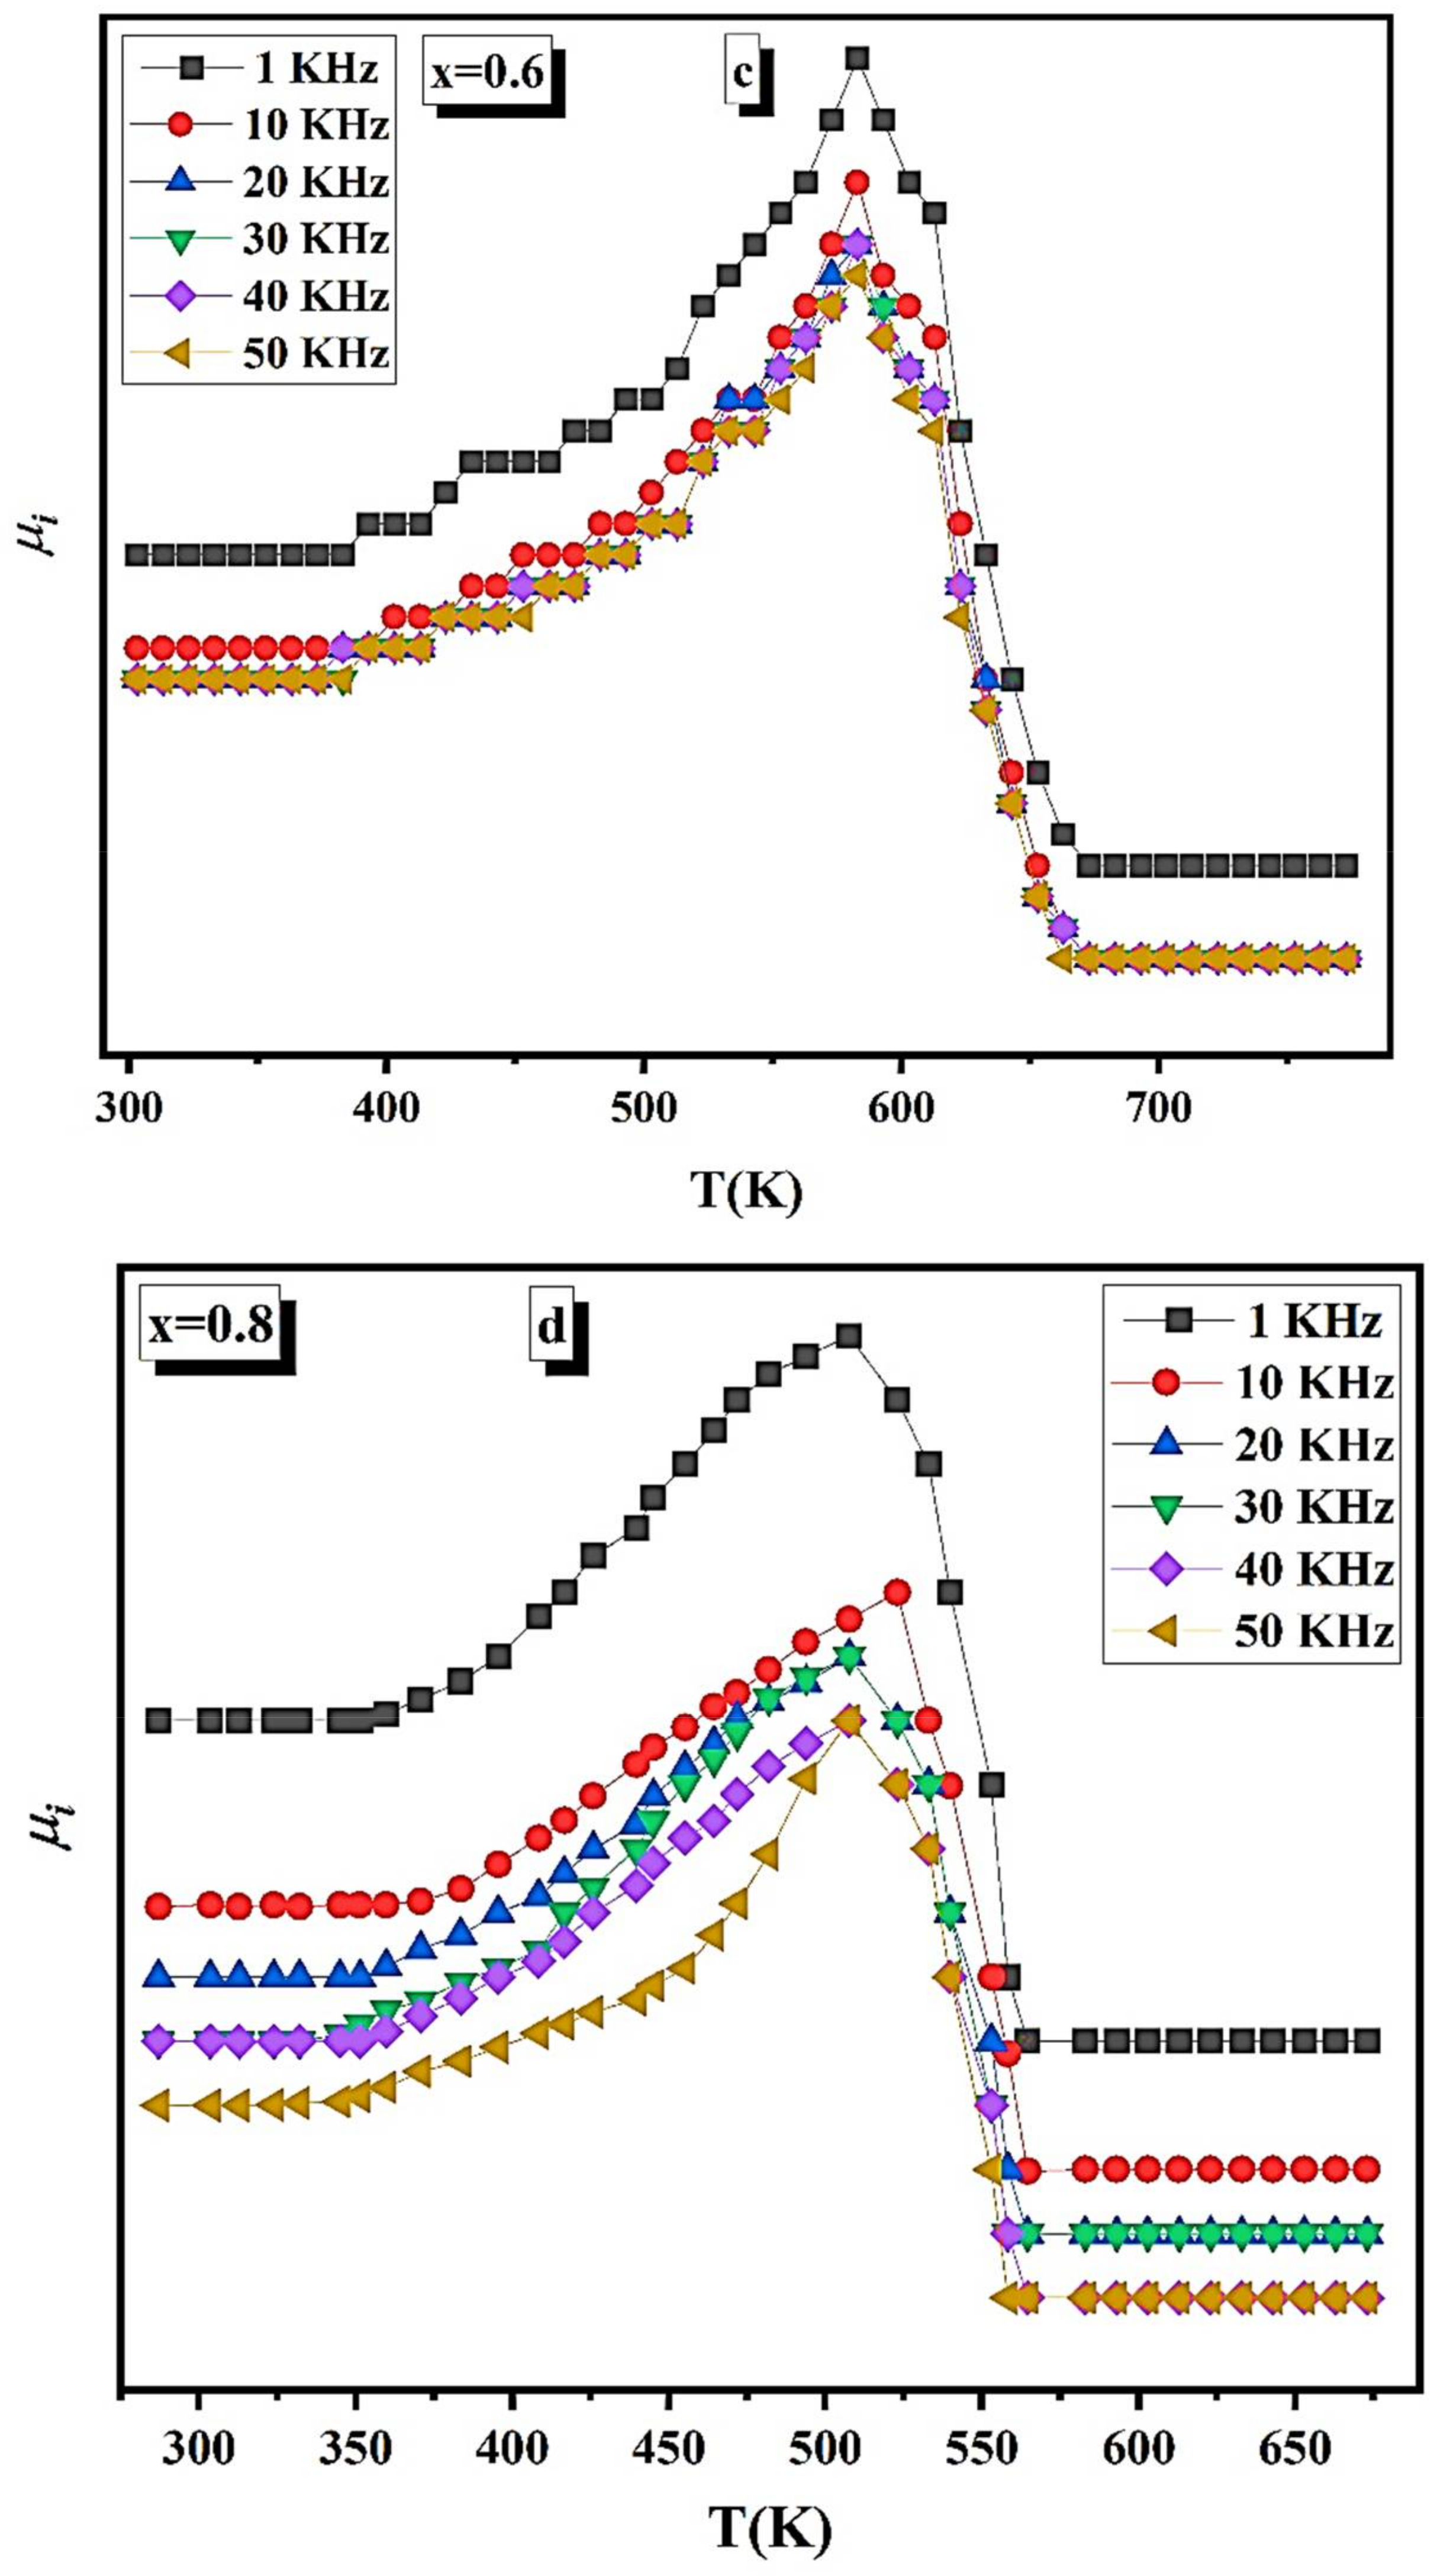
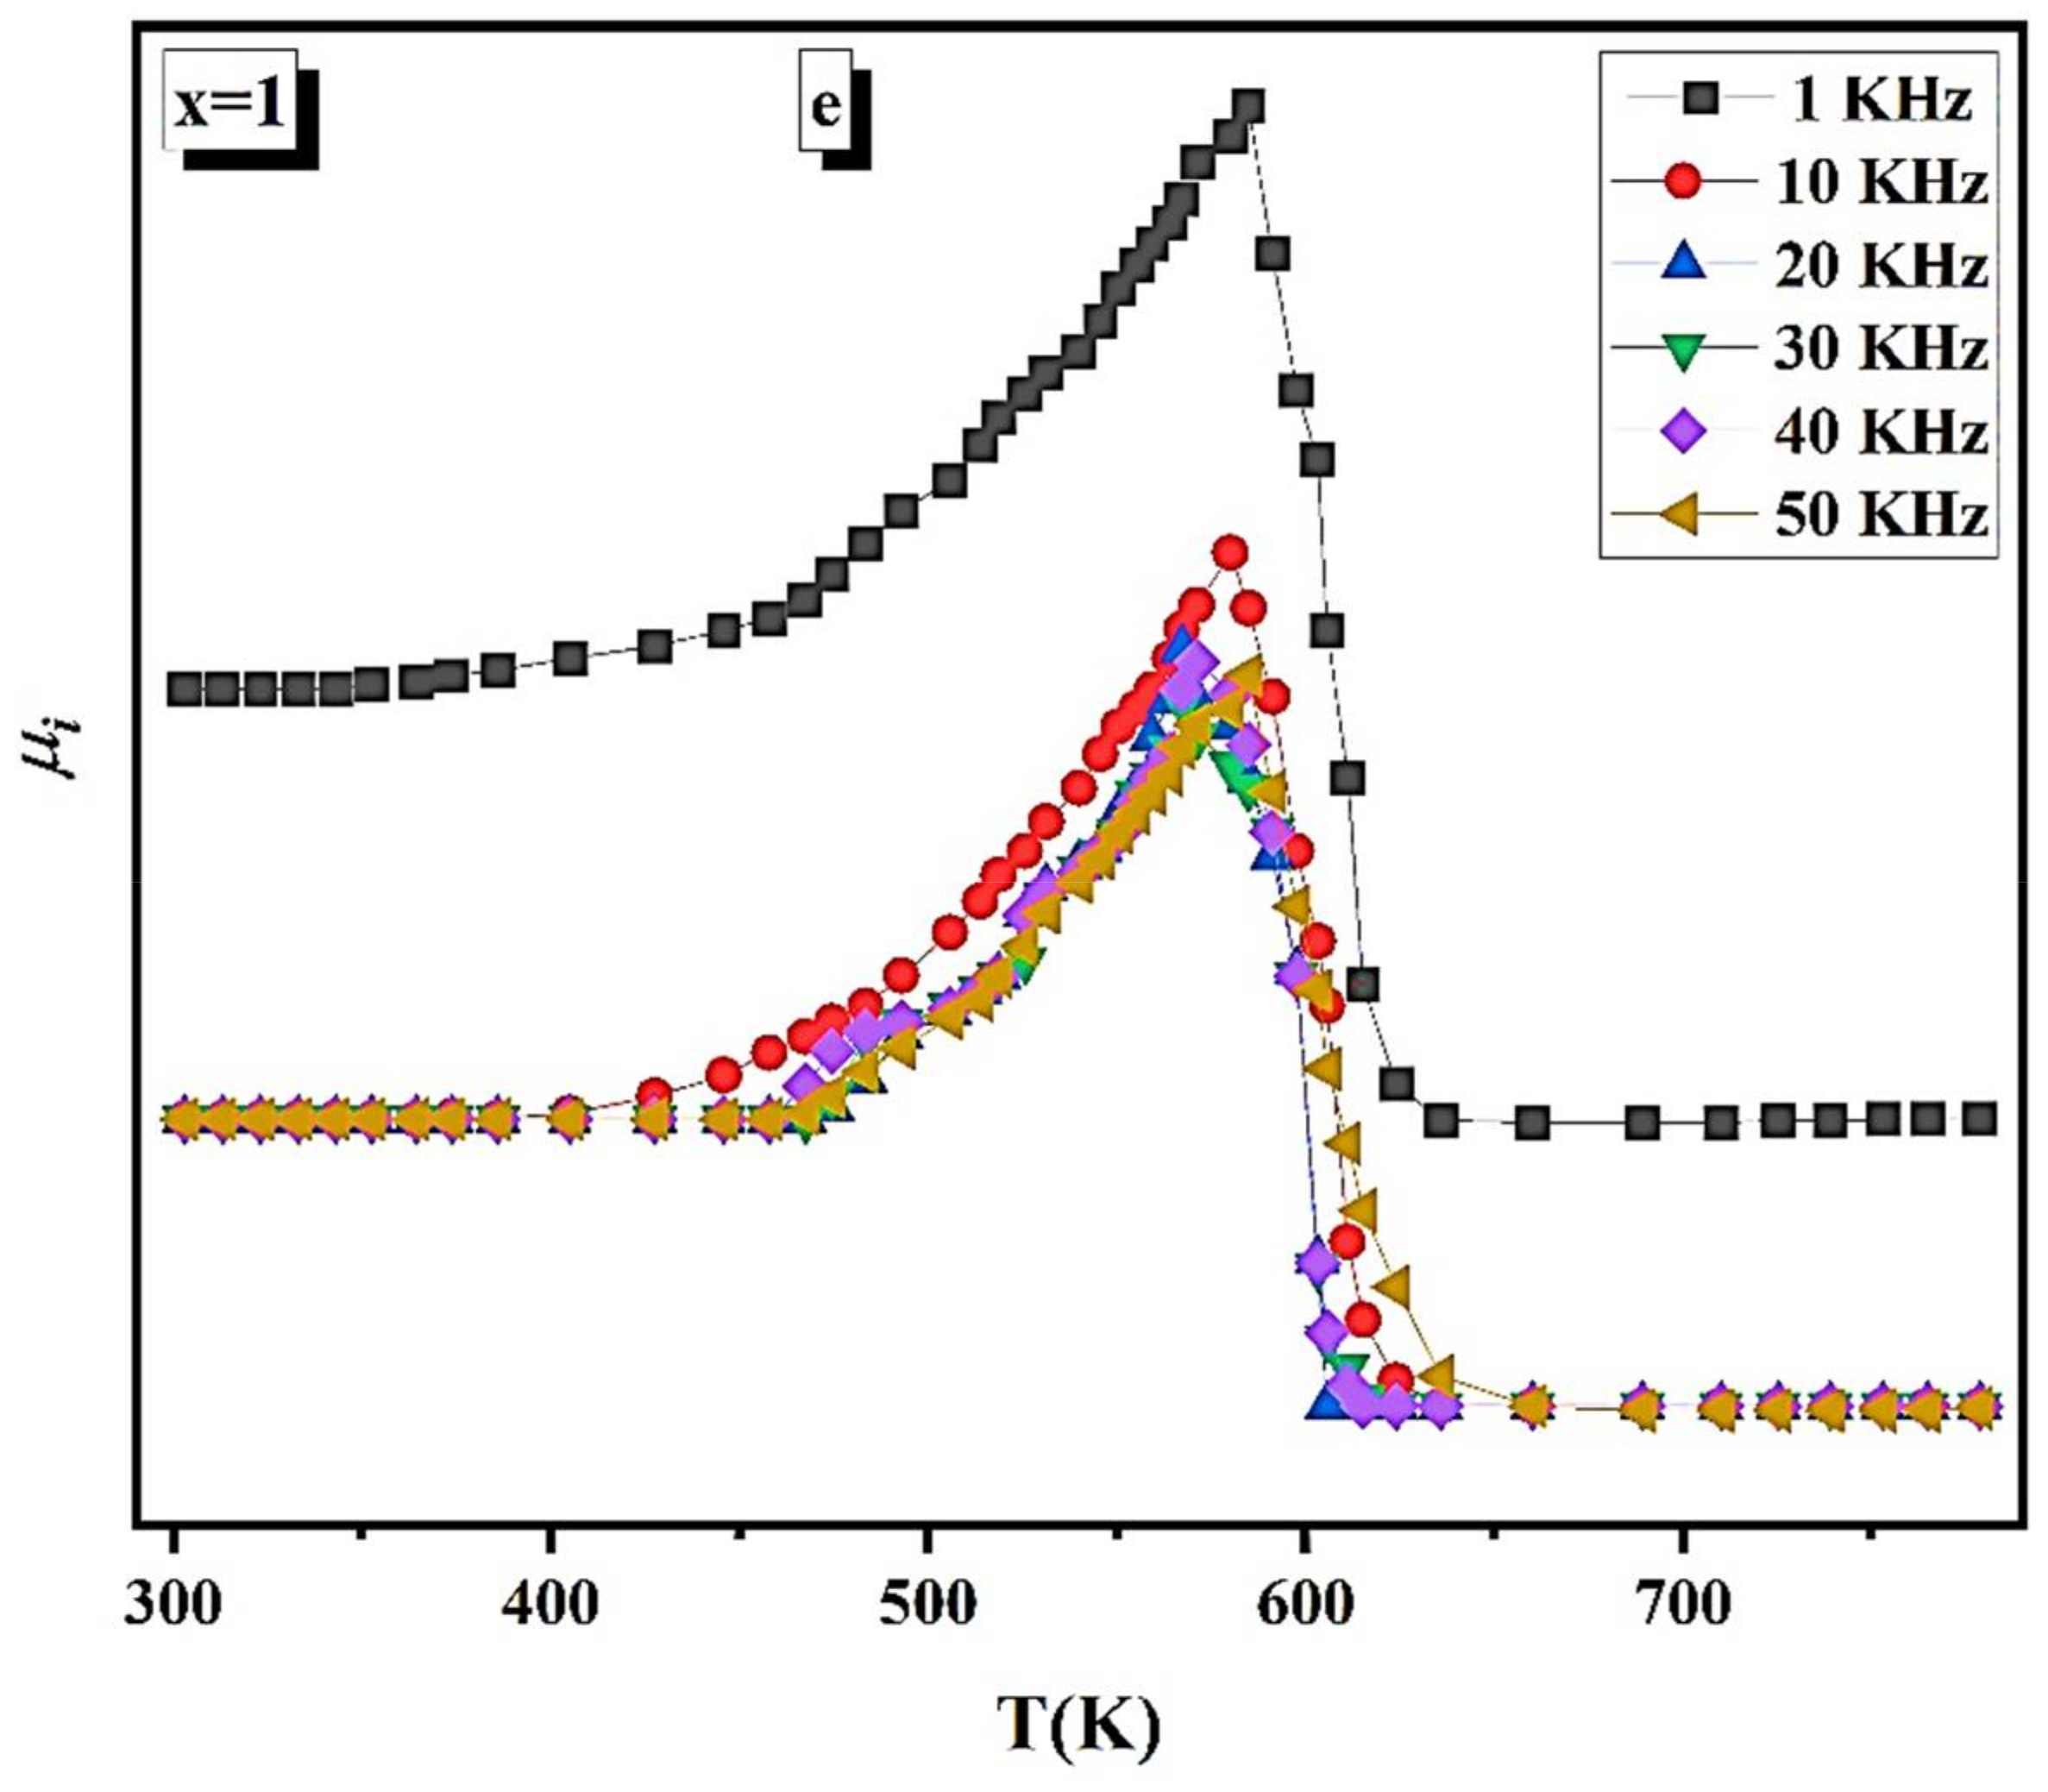
3.6.2. Initial Permeability Discussion

Figure 10a–e shows the variation of initial permeability (μi) of Ni 1 x + 2 Mg x + 2 Fe 2 + 3 O 4 (x = 0, 0.2, 0.6, 0.8, 1) at different frequencies from 1 kHz to 50 kHz. The μi increases with temperature up to a certain peak, i.e., Hopkinson peak (HP), which indicates the presence of a monodomain for the prepared samples. This peak has occurred near the Curie temperature of the material, which was determined from Figure 10a–e and tabulated in Table 7.
It was noted from Figure 10a–e that the μi decreased by increasing the applied frequency. The origin of magnetic permeability is the domain wall motion. However, at these sizes, the NPs are single magnetic domains. The factors that affect permeability are saturation magnetization (Ms), crystallite size (D), and magnetic anisotropy constant (K). The initial permeability can be computed [36] according to the relation:
μ i = M s 2   D k ;
The first two parameters (Ms and D) do not affect the permeability. In contrast, the predominant factor is magnetic anisotropy. The HP humps may reduce the magnetic anisotropy field, which is faster than the decrease in Ms.
The μi sharply decreases at TC, making the prepared samples an extreme candidate for magnetic switch devices. The height of the HP peak decreases as the Mg content increases. Near TC, the samples transform to a paramagnetic state, leading to the decrease of μi. Furthermore, the μi increases by increasing the porosity, facilitating the domain wall motion.
The value of TC and the permeability change rate, i.e., the slope of the linear part of μi vs. TC, is given in Table 7. The TC has a maximum at the x = 0.2, which is the same behavior as Ms. At this sample x = 0.2, the material has a maximum magnetic exchange interaction. As the TC varies between 513 K and 813 K, it is simple to obtain magnetic material with the necessary TC by adjusting the Mg content.
The rate of permeability change with a temperature near the Curie point was calculated and given in Table 7. The higher the rate, the better the material can be used as a magnetic temperature transducer.

3.7. Electrical Properties of the Prepared Samples

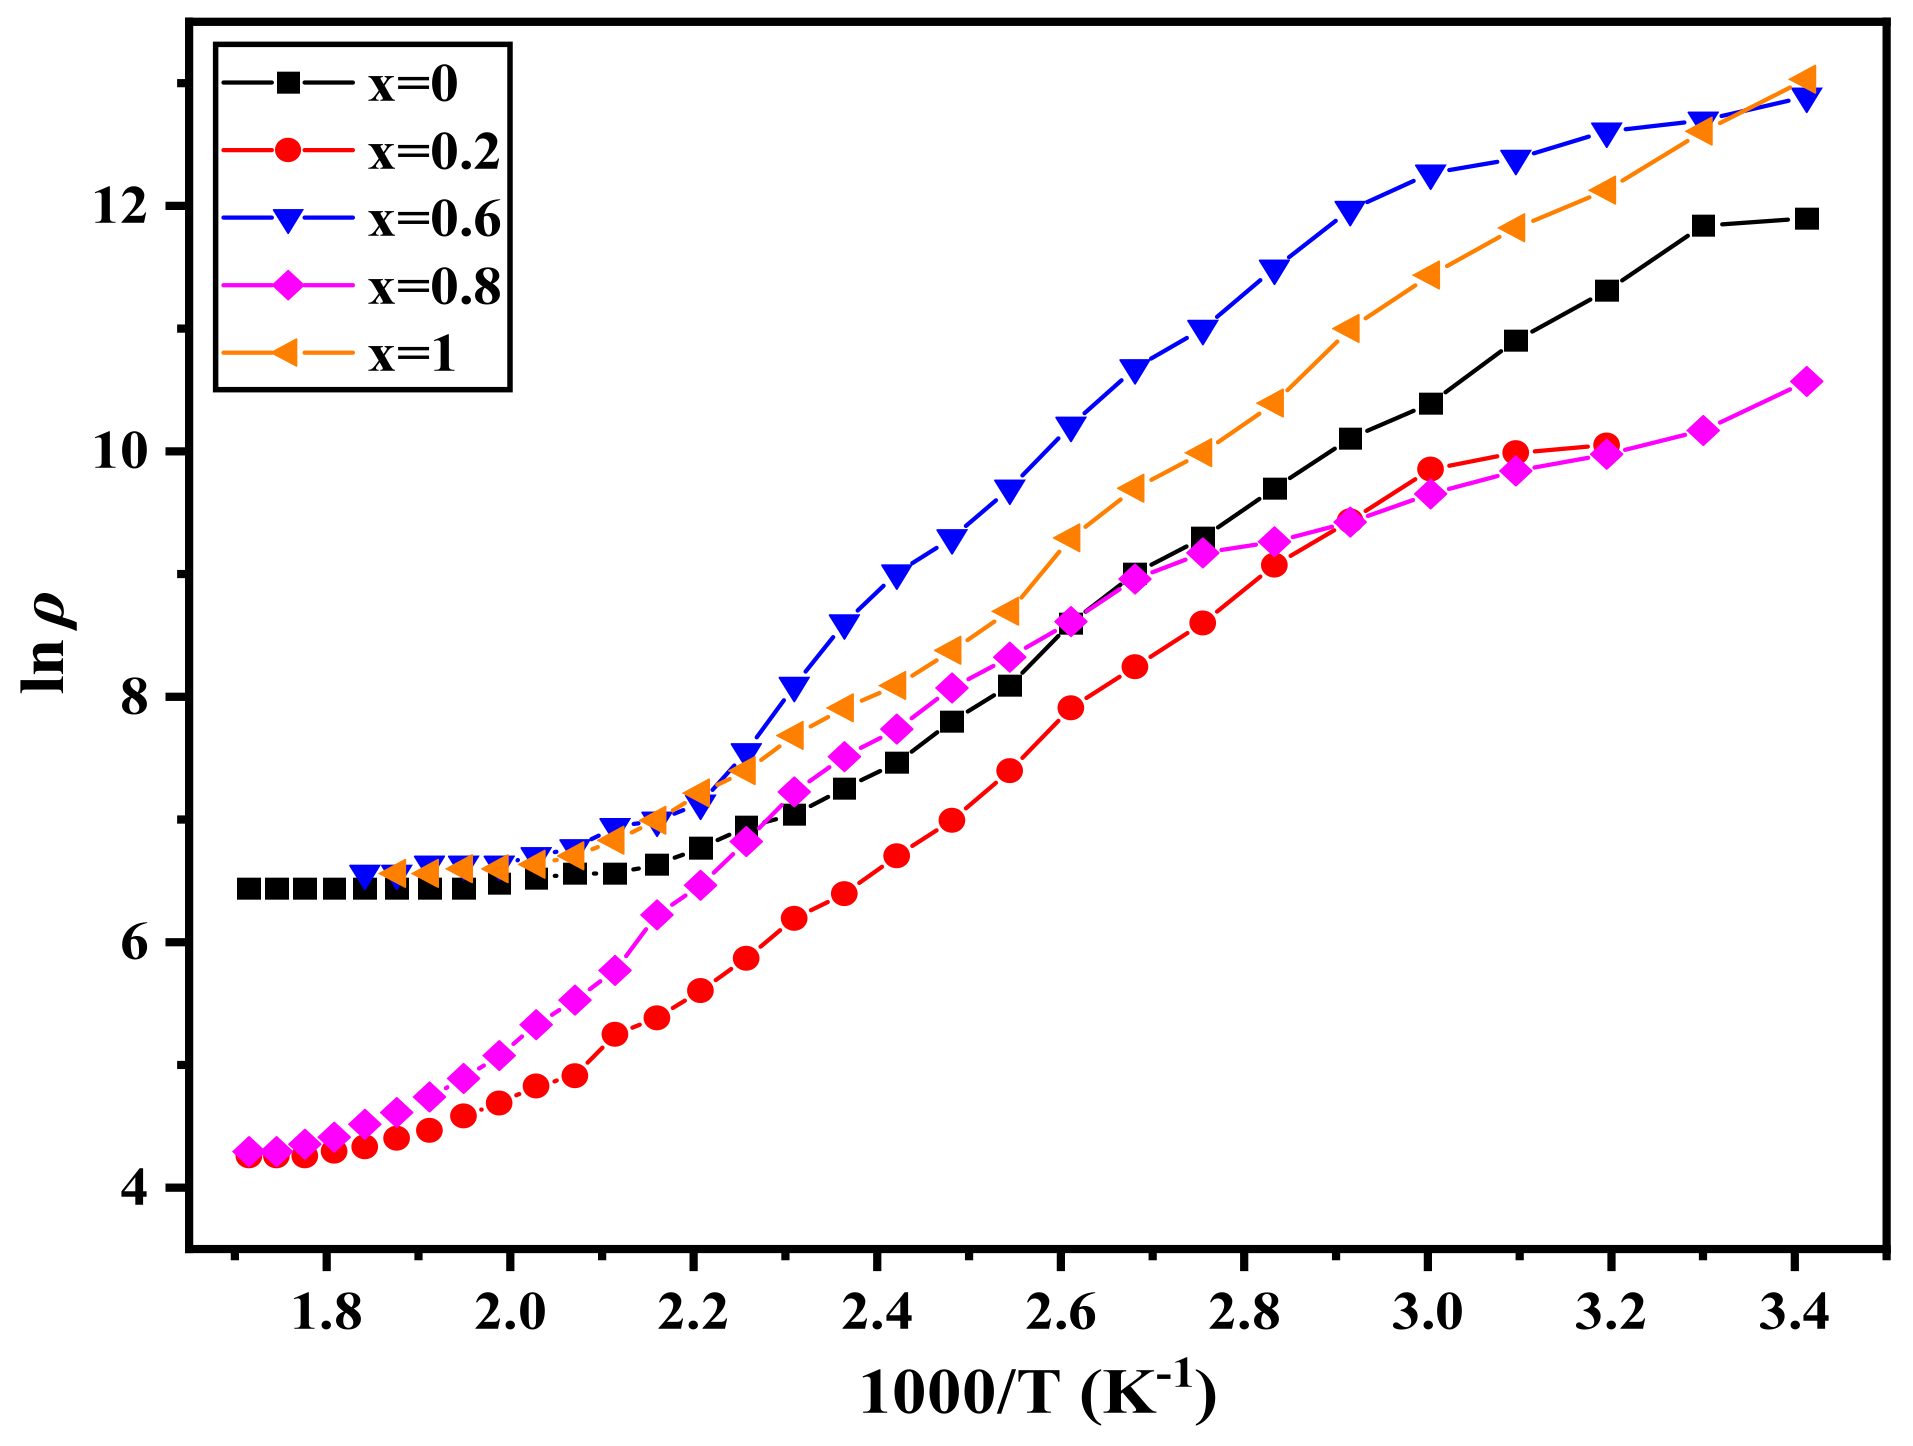
3.7.1. DC Resistivity Discussion

The DC electrical resistivity (ρ) of the nano-ferrites system Ni 1 x + 2 Mg x + 2 Fe 2 + 3 O 4 (x = 0, 0.2, 0.6, 0.8, and 1) presented in Figure 11 was determined using the two-probe method as a function of reciprocal absolute temperature (1000/T). It is noted that a linear relationship exists between two regions and that it terminates at TC. This is the moment at which the ferrimagnetic state changes to paramagnetic. Increased magnesium content shifted the TC to a higher temperature. The increase in TC with increasing Mg concentration, as seen in Table 8, can be explained by the A–B exchange interaction, which is dependent on the Fe+3 distribution between A and B-sites. The first region is ferrimagnetic and conducted via hopping (hopping conduction mechanism). The second region is a paramagnetic area that belongs to the disordered state. The electrical resistance of all samples decreases with increasing temperature, confirming the semiconductor nature but not the semiconducting process. Numerous studies have also discovered that ferrite’s DC electrical resistivity is dependent on such a tendency [45,46,47]. The Verwey–de-Boer hopping process is used to describe the ferrite conduction mechanism [48], in which electrons hop between identical ions but in different valence states. Another aspect influencing resistivity behavior with temperature is thermally stimulated mobility of the charge carrier, which leads to a decrease in resistivity.
The activation energy (Ea) was determined [49] using the following equation from the temperature dependence of resistivity (ρ):
l n ρ = l n ρ 0 + E a K B   T ;
where ρ0 is the pre-exponential factor, the Ea increases from 0.27 eV to 0.53 eV as the Mg content increases, as illustrated in Table 8. Ea behaves similarly to resistivity. The sample with high resistivity exhibits high activation energy. The EP is higher than the Ef (the activation energy for the ferrimagnetic state), which indicates the influence of magnetic order on the conduction behavior. The values of Ea show the presence of a hopping conduction mechanism.

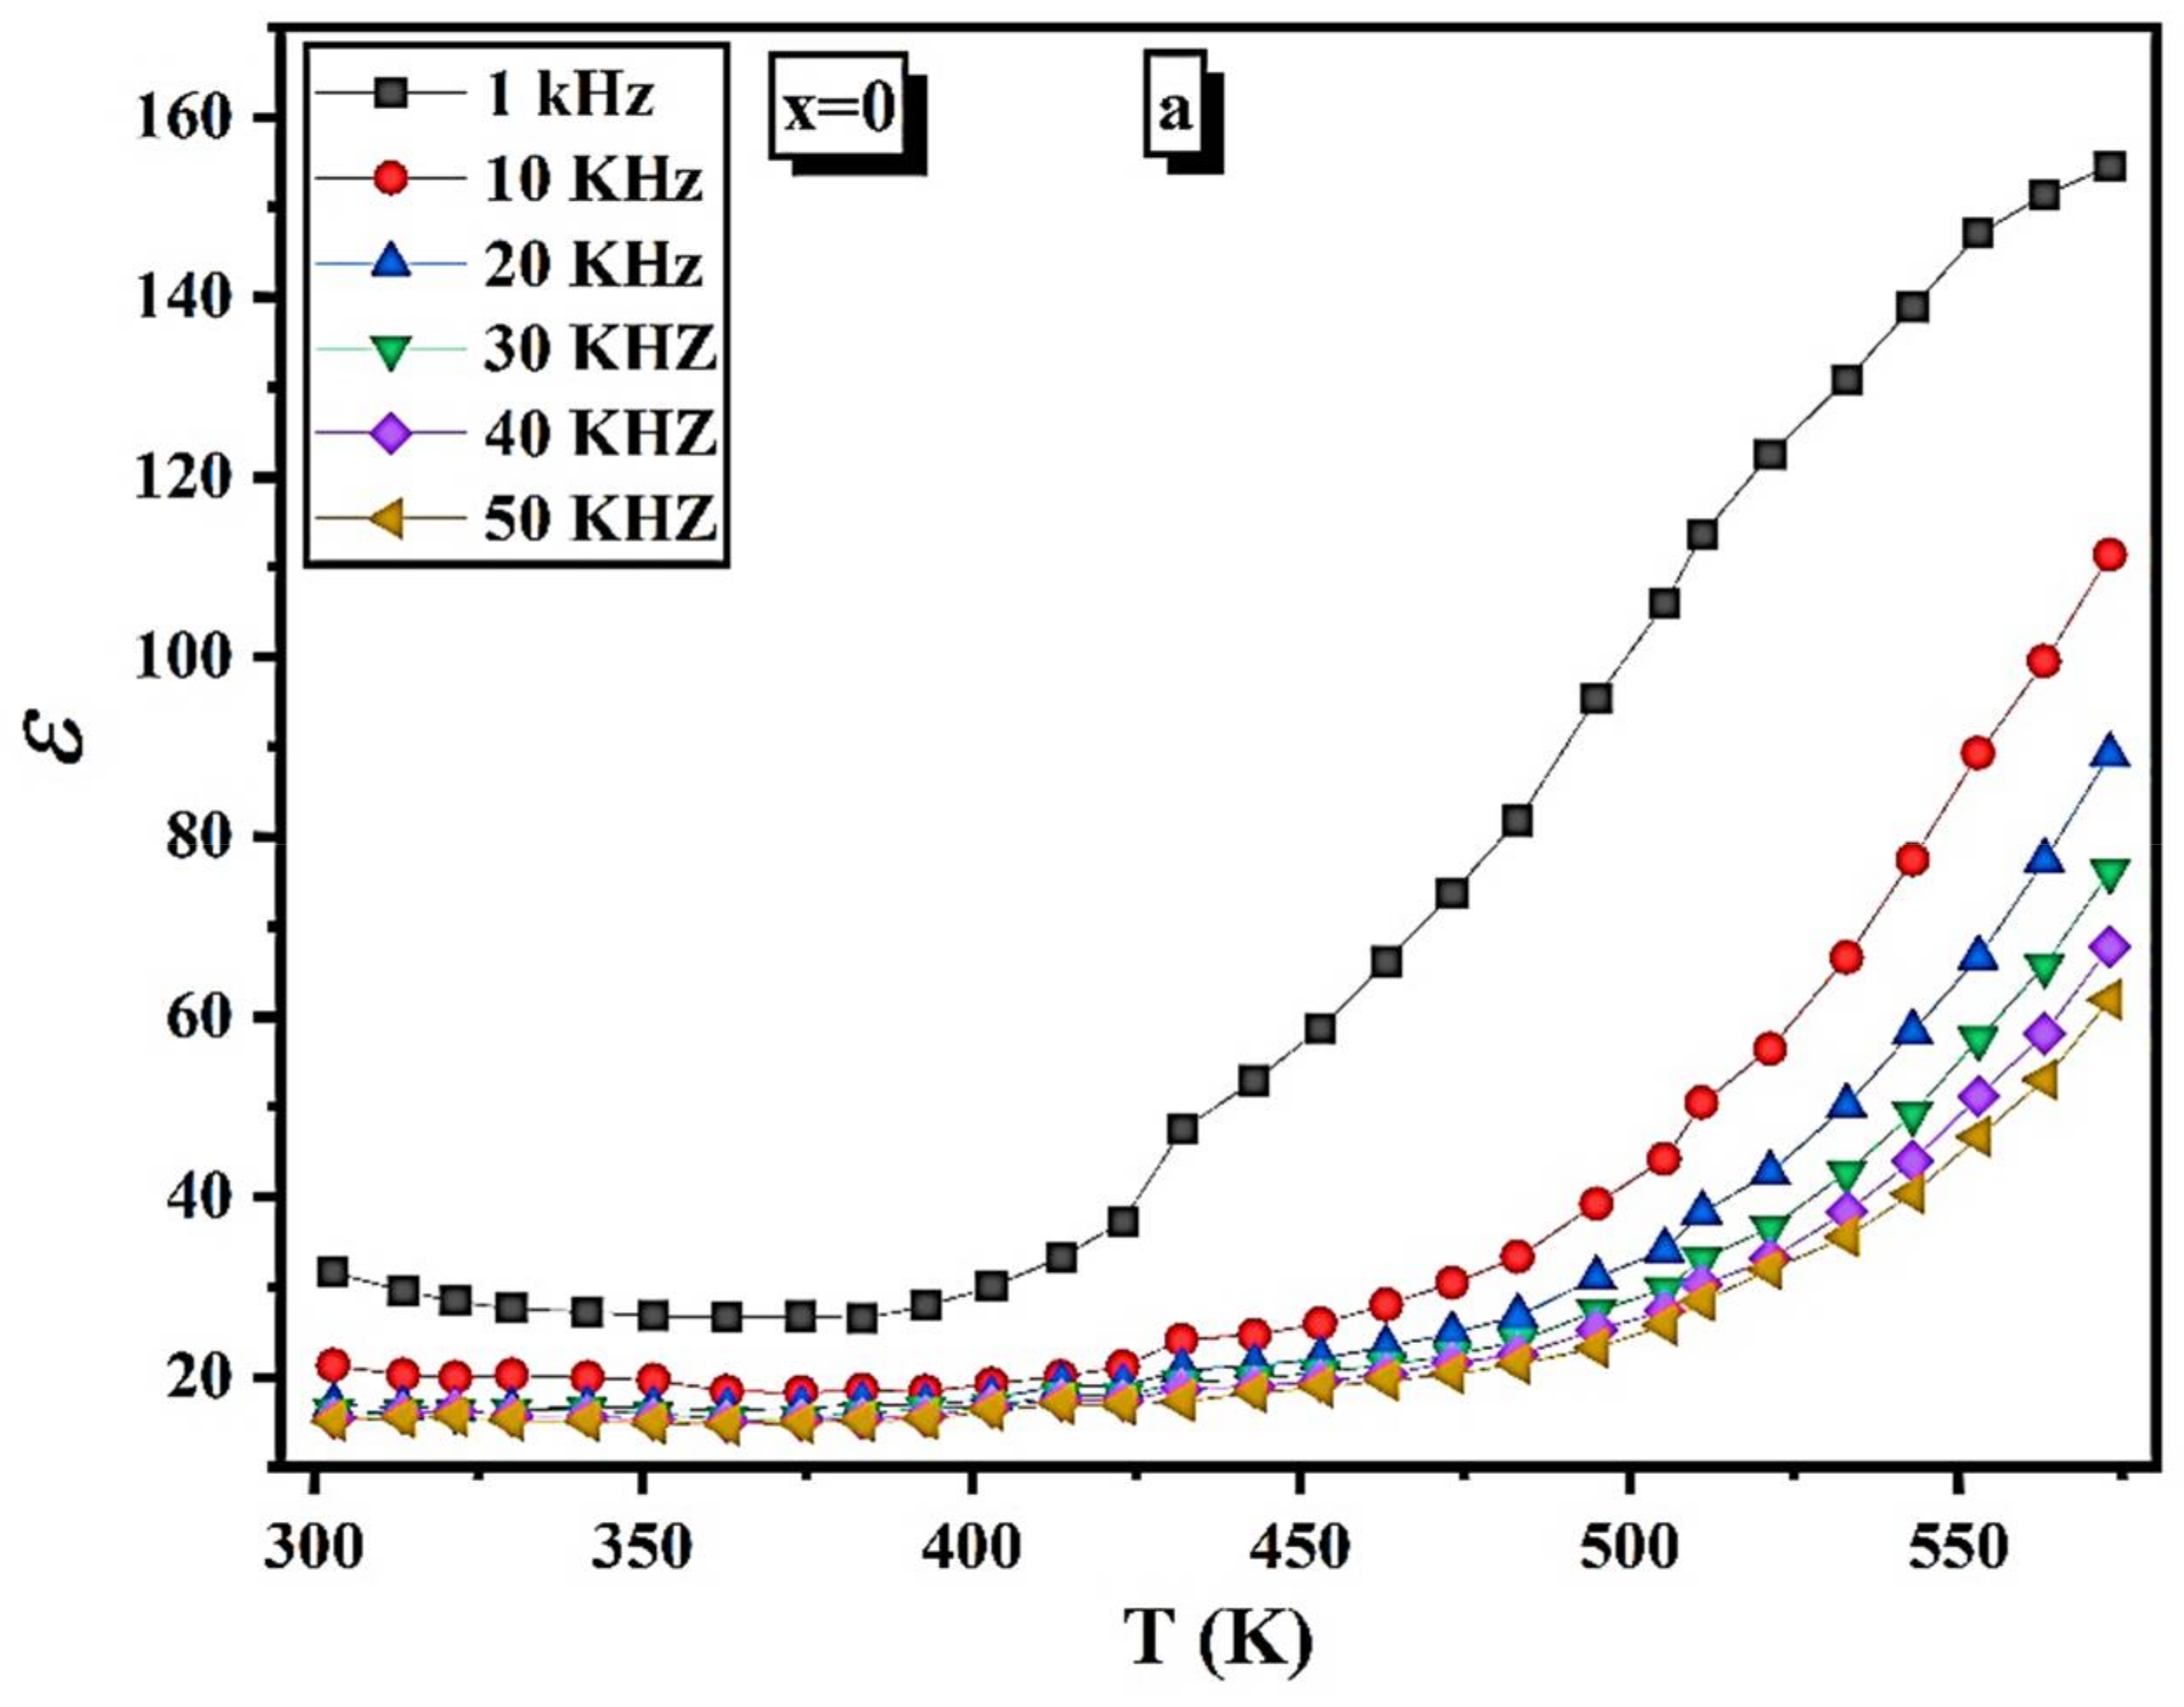
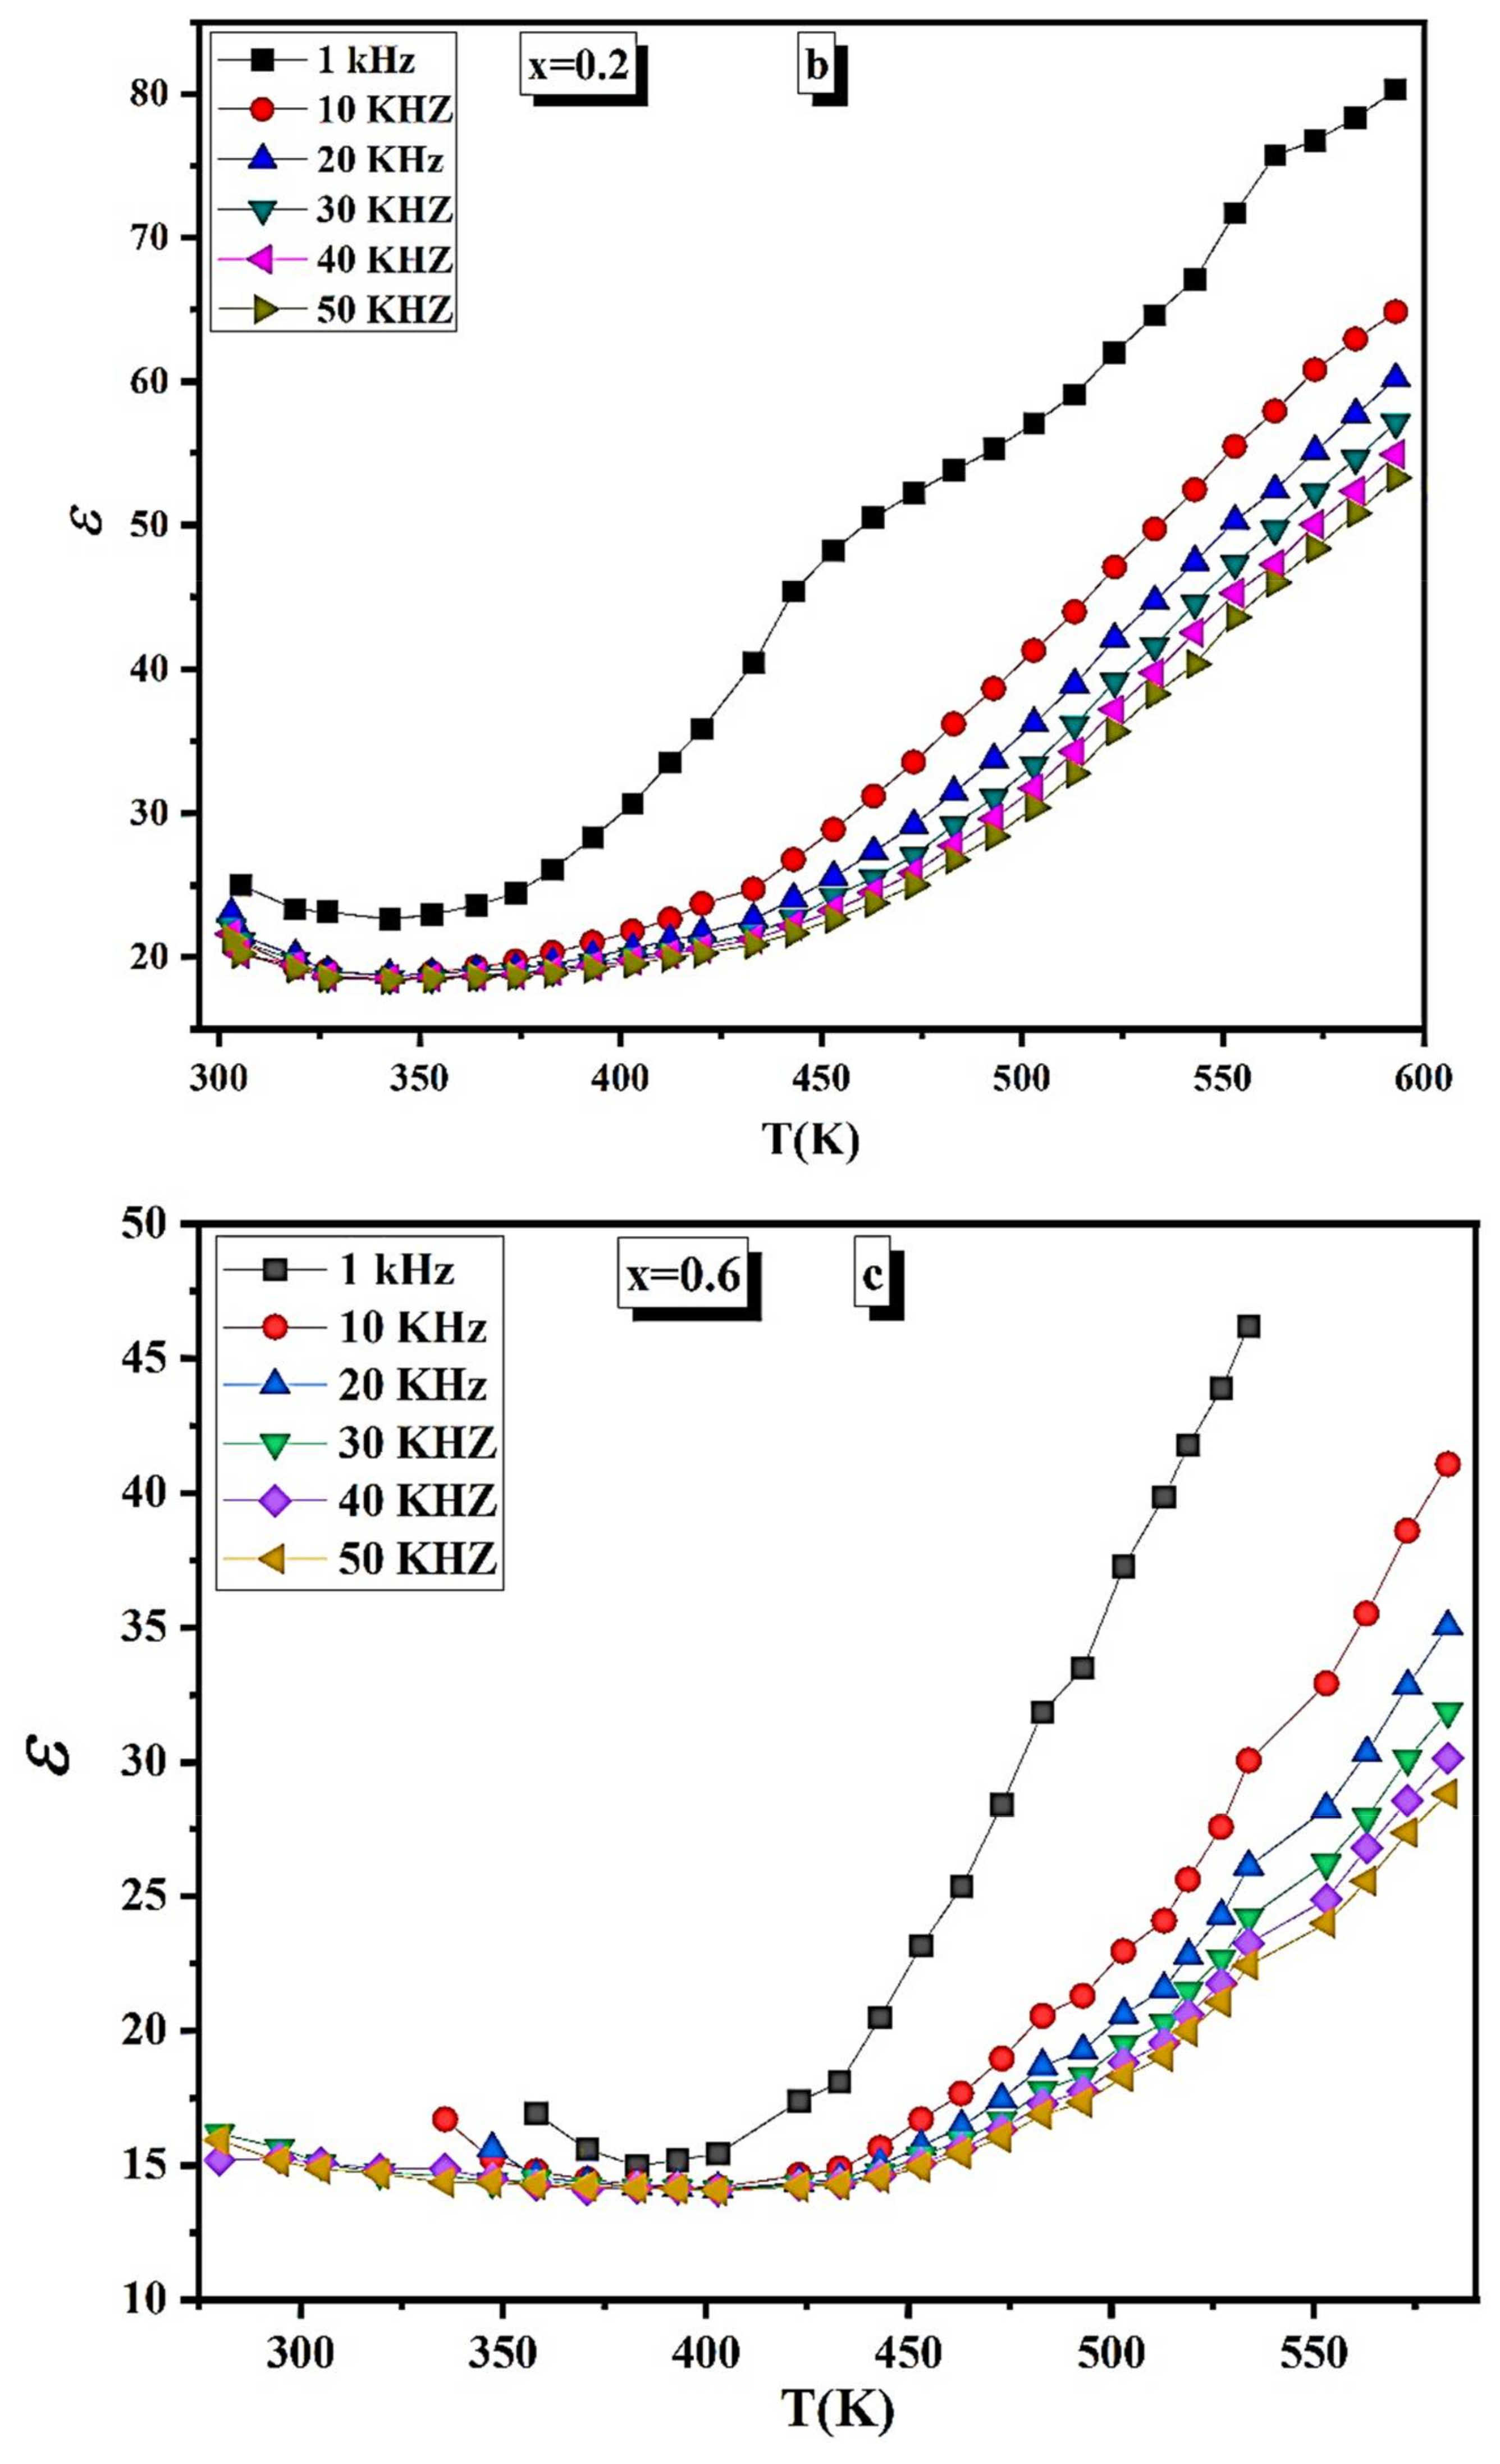
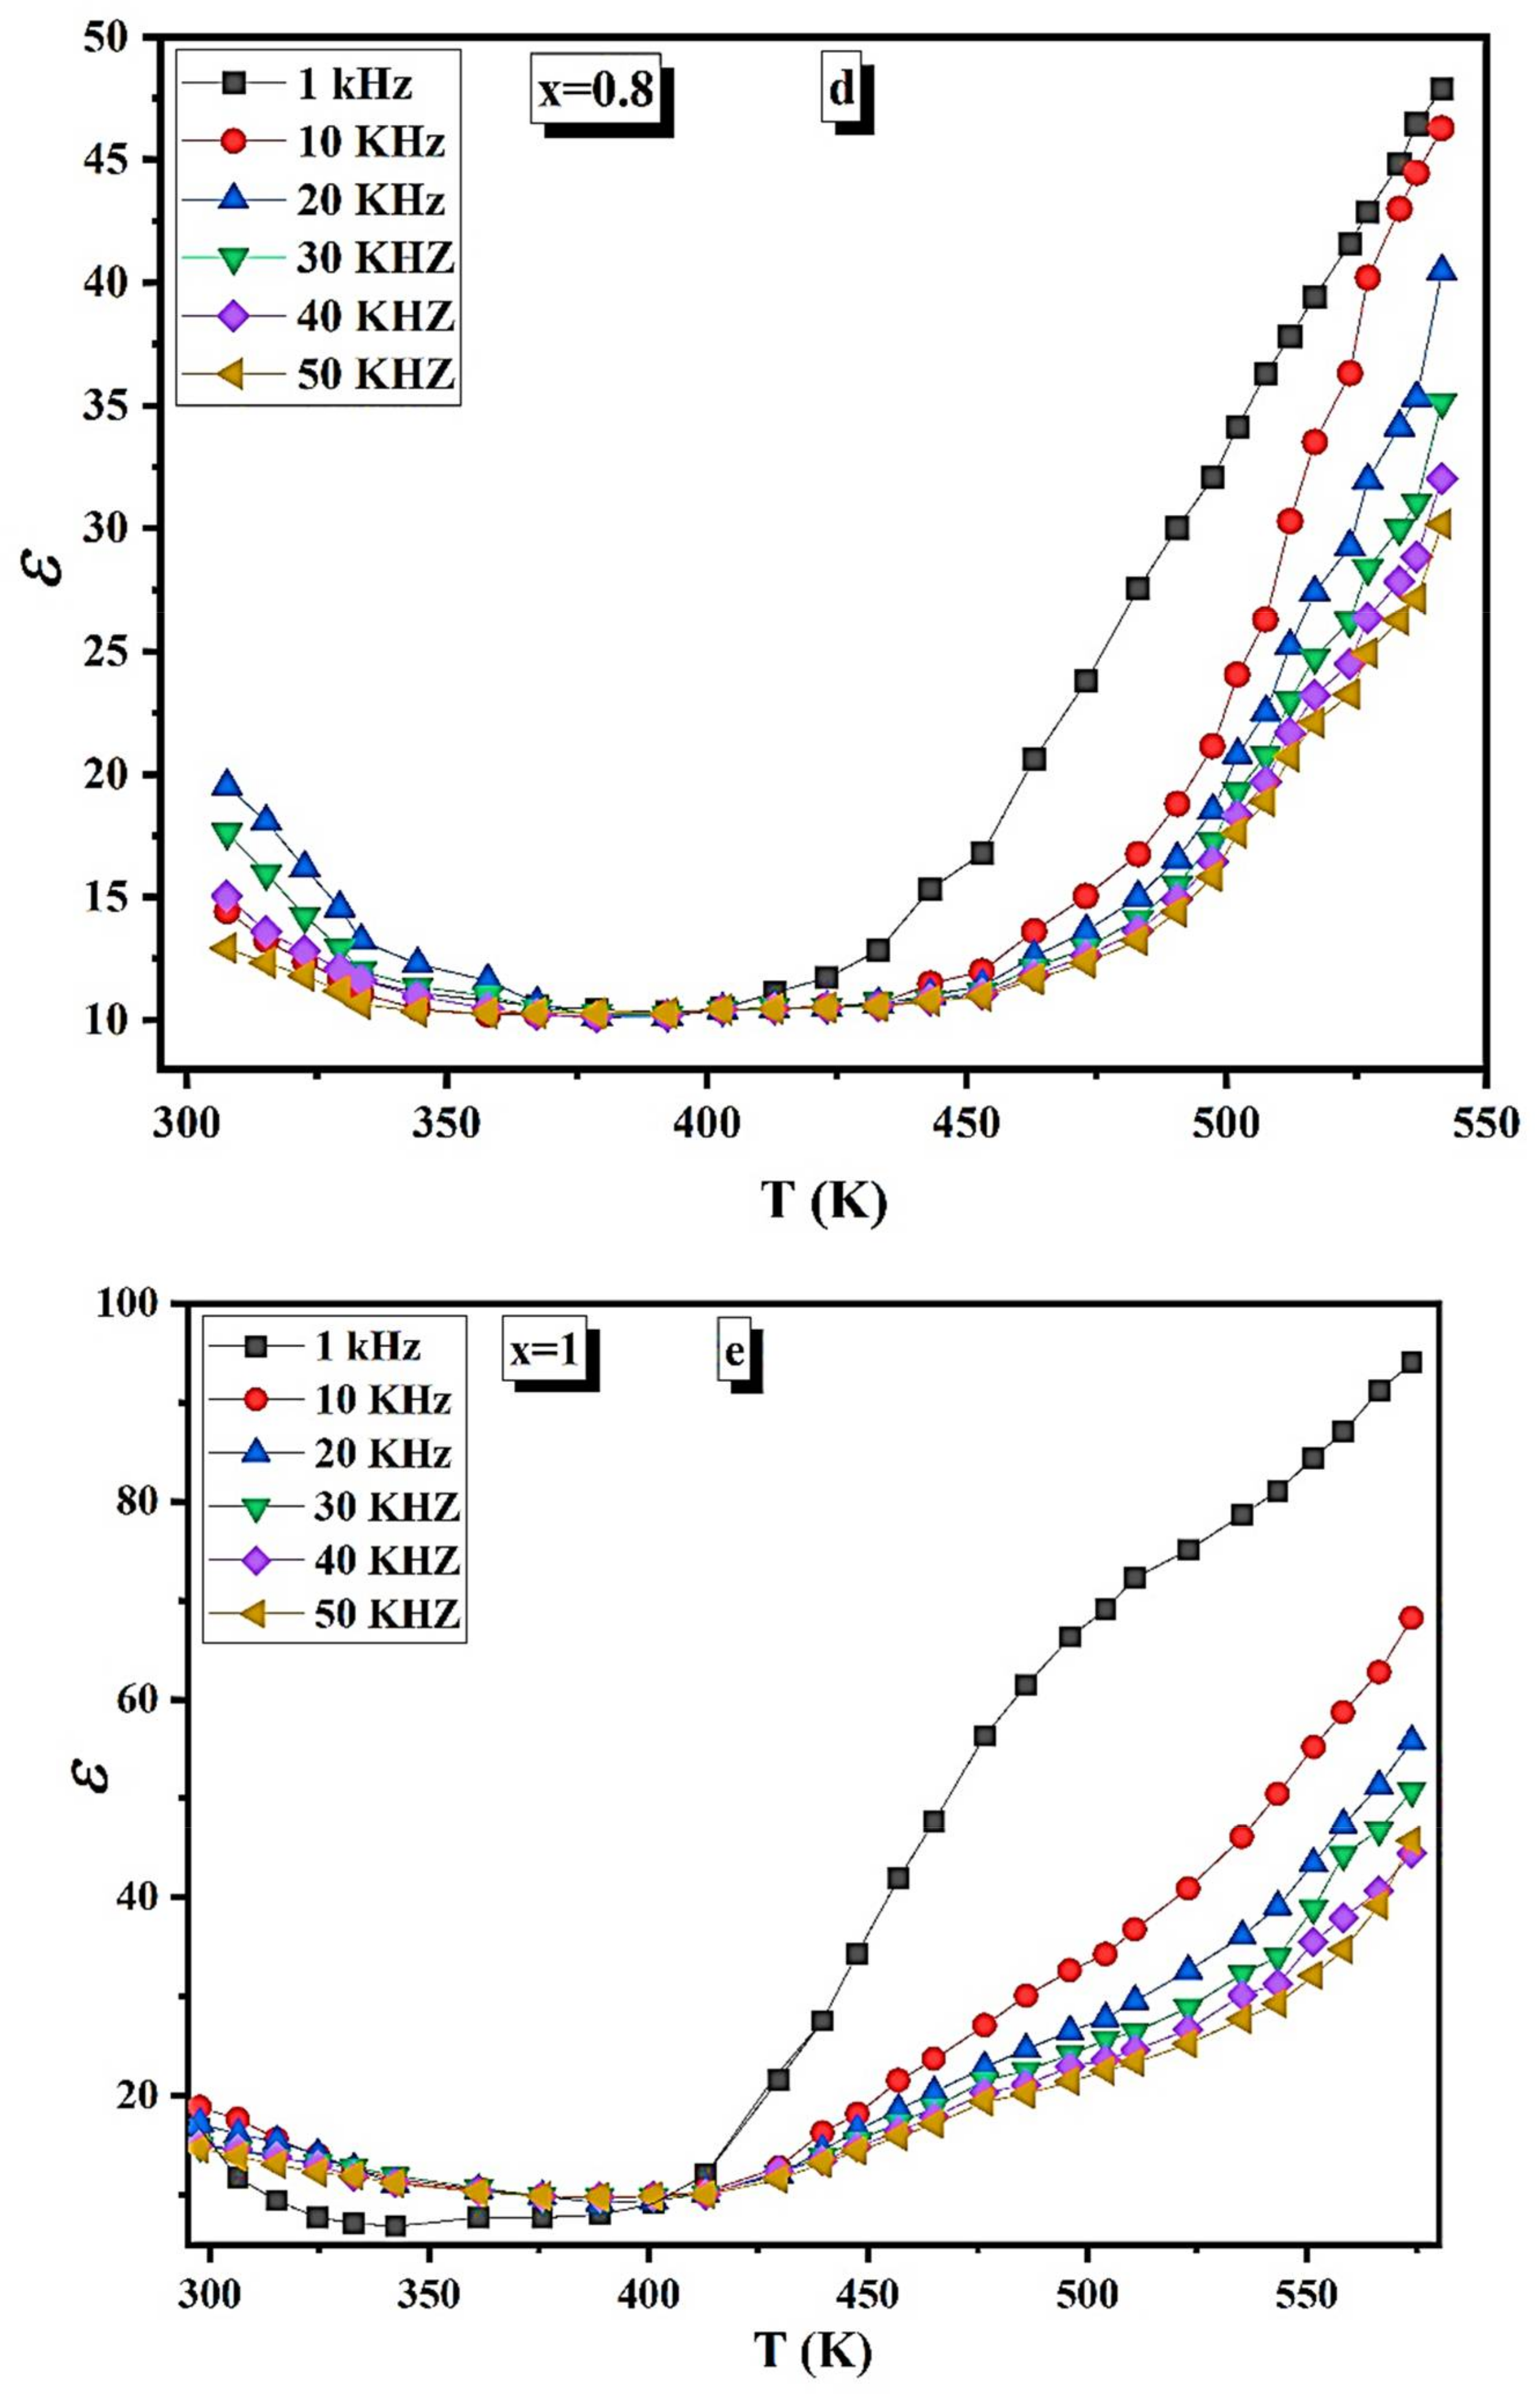
3.7.2. Dielectric Constant (The Real Part of Permittivity) Discussion

The temperature behavior of the dielectric constant (ε) was studied from room temperature up to 550 K at different frequencies (1–50 kHz, Δ = 10 kHz,) for all the prepared samples. The changing of ε with temperature is represented in Figure 12a–e.
The ε increases very slowly up to 400 K, and above this temperature, the ε rises rapidly. Furthermore, it is found that the ε decreases with increasing frequency. According to Koop’s model, ε is inversely proportional to the resistivity’s square root. As a result, the increase in ε is projected as the temperature rises. The value of ε increases dramatically when the temperature approaches the TC of ferrite, as seen in Table 8. For the ferrites, the source of the ε is due to four polarization types [50,51], which are interfacial (Pi), dipolar (Pd), atomic (Pa), and electronic (Pe). At low temperatures, the four types of polarization contributed to the ε, whereas the rapid increase of ε with increasing temperature is primarily due to the Pi and Pd, which are temperature-dependent [50]—the Pi results from charge accumulation at grain boundaries. The Pe is increased by increasing the temperature at which the hopping electrons are thermally activated, which requires a quick increase in the dielectric constant. The intriguing dielectric properties of oxide composites have recently been reported and analyzed [52,53,54].
Table 9 shows the effect of Mg content on ε at a fixed temperature of 500 K and a frequency of 10 kHz. The maximum ε value is at x = 0.2, making this sample a candidate for capacitor fabrication. After x = 0.2, the ε decreases up to the sample x = 0.6 and increases with increasing Mg concentration. We can say that the conduction mechanism is similar to the polarization mechanism in ferrite. The local displacement arises from the hopping electron between adjacent octahedral ions in the spinel lattice, contributing to electric polarization and dielectric constant.

4. Conclusions

The flash auto combustion approach was used to create nano-ferrites Ni 1 x + 2 Mg x + 2 Fe 2 + 3 O 4 (x = 0, 0.2, 0.6, 0.8, and 1). XRD and TEM proved the single-phase cubic spinel. Images of the SEM micrographs of each sample reveal a consistent grain growth in terms of particle size. The EDX images shown alongside SEM contain no impurity peaks. The Ftetra drops when the Mg content increases, whereas the Focta decreases when the Mg content increases to x = 0.2 and then increases. TGA curves have two weight loss regions. The first stage ranges from RT up to 373 K, and the second stage ranges from 773 K up to 1073 K. The weight loss for the first region is equal to 1%, whereas, for the second region, it is equal to 9%. It can be said from the VSM results that the studied samples have multidomain structure (superparamagnetic grains which contribute to the non-saturation), which permits the decrease of Hc when the crystallite size decreases by increasing Mg content. The TC changes from 513 K to 813 K, so the desired magnetic materials can be easily obtained with the required Curie temperature simply by changing the Mg content. The electrical resistance of all samples decreases with increasing temperature, confirming the semiconductor nature. The obtained values of Ea suggest the existence of a hopping conduction mechanism. The Ni 1 x + 2 Mg x + 2 Fe 2 + 3 O 4 samples that recorded the higher rate of permeability change with a temperature near the Curie point are candidates for use as magnetic temperature transducer devices.

Author Contributions

Conceptualization, R.G., A.M.D., E.L.T., D.Z. and M.A.D.; methodology, M.M., A.M.H., S.A.A.E.-K., O.S., R.G., A.M.D., A.H.A., H.A.-G., D.Z. and M.I.S.; validation, M.M., S.A.A.E.-K., O.S., A.M.H., R.G., O.M.H., A.M.D., A.H.A., H.A.-G. and M.I.S.; formal analysis, M.M., A.M.H., A.M.D., A.H.A., H.A.-G., D.Z. and M.I.S.; investigation, O.S., A.M.H., S.A.A.E.-K., R.G., O.M.H., S.V.T., E.L.T. and A.V.T.; resources, O.M.H., M.A.D., A.H.A. and M.I.S.; data curation, A.M.H., S.V.T., E.L.T. and A.V.T.; writing—original draft preparation, R.G., E.L.T. and M.A.D.; writing—review and editing, M.A.D., E.L.T., S.V.T. and A.V.T.; visualization, M.M., O.S., A.H.A. and M.I.S.; supervision, S.V.T., A.V.T. and M.A.D.; project administration, S.V.T., A.V.T., M.I.S., D.Z. and M.A.D.; funding acquisition, M.I.S. and M.A.D. All authors have read and agreed to the published version of the manuscript.

Funding

The authors express their gratitude to Princess Nourah bint Abdulrahman University Researchers Supporting Project number (PNURSP2022R28), Princess Nourah bint Abdulrahman University, Riyadh, Saudi Arabia.

Institutional Review Board Statement

Not applicable.

Informed Consent Statement

Not applicable.

Data Availability Statement

Not applicable.

Acknowledgments

The authors express their gratitude to Princess Nourah bint Abdulrahman University Researchers Supporting Project number (PNURSP2022R28), Princess Nourah bint Abdulrahman University, Riyadh, Saudi Arabia. Alex V. Trukhanov thanks NUST MISIS for support within the framework of the «Priority 2030».

Conflicts of Interest

The authors declare no conflict of interest.

References

  1. Thomas, N.; Jithin, P.V.; Sudheesh, V.D.; Sebastian, V. Magnetic and dielectric properties of magnesium substituted cobalt ferrite samples synthesized via one step calcination free solution combustion method. Ceram. Int. 2017, 43, 7305–7310. [Google Scholar] [CrossRef]
  2. Sun, L.; Zhang, R.; Ni, Q.; Cao, E.; Hao, W.; Zhang, Y.; Ju, L. Magnetic and dielectric properties of MgxCo1−xFe2O4 ferrites prepared by the sol-gel method. Phys. B Condens. Matter 2018, 545, 4–11. [Google Scholar] [CrossRef]
  3. Mund, H.S.; Ahuja, B.L. Structural and magnetic properties of Mg doped cobalt ferrite nano particles prepared by sol-gel method. Mater. Res. Bull. 2017, 85, 228–233. [Google Scholar] [CrossRef]
  4. Deraz, N.M. Glycine-assisted fabrication of nanocrystalline cobalt ferrite system. J. Anal. Appl. Pyrolysis 2010, 88, 103–109. [Google Scholar] [CrossRef]
  5. Deraz, N.M. Size and crystallinity-dependent magnetic properties of copper ferrite nano-particles. J. Alloys Compd. 2010, 501, 317–325. [Google Scholar] [CrossRef]
  6. Costa, A.C.F.M.; Silva, V.J.; Cornejo, D.R.; Morelli, M.R.; Kiminami, R.H.G.A.; Gama, L. Magnetic and structural properties of NiFe2O4 ferrite nanopowder doped with Zn2+. J. Magn. Magn. Mater. 2008, 320, e370–e372. [Google Scholar] [CrossRef]
  7. Kapse, V.D.; Ghosh, S.A.; Raghuwanshi, F.C.; Kapse, S.D. Nanocrystalline spinel Ni0.6Zn0.4Fe2O4: A novel material for H2S sensing. Mater. Chem. Phys. 2009, 113, 638–644. [Google Scholar] [CrossRef]
  8. Kapse, V.D.; Ghosh, S.A.; Raghuwanshi, F.C.; Kapse, S.D.; Khandekar, U.S. Nanocrystalline Ni0.6Zn0.4Fe2O4: A novel semiconducting material for ethanol detection. Talanta 2009, 78, 19–25. [Google Scholar] [CrossRef] [PubMed]
  9. Albino, M.; Fantechi, E.; Innocenti, C.; López-Ortega, A.; Bonanni, V.; Campo, G.; Pineider, F.; Gurioli, M.; Arosio, P.; Orlando, T.; et al. Role of Zn2+ Substitution on the Magnetic, Hyperthermic, and Relaxometric Properties of Cobalt Ferrite Nanoparticles. J. Phys. Chem. C 2019, 123, 6148–6157. [Google Scholar] [CrossRef] [Green Version]
  10. Ukoba, K.O.; Eloka-Eboka, A.C.; Inambao, F.L. Review of nanostructured NiO thin film deposition using the spray pyrolysis technique. Renew. Sustain. Energy Rev. 2018, 82, 2900–2915. [Google Scholar] [CrossRef]
  11. Hankare, P.P.; Sankpal, U.B.; Patil, R.P.; Mulla, I.S.; Lokhande, P.D.; Gajbhiye, N.S. Synthesis and characterization of CoCrxFe2−xO4 nanoparticles. J. Alloys Compd. 2009, 485, 798–801. [Google Scholar] [CrossRef]
  12. Giri, S.; Samanta, S.; Maji, S.; Ganguli, S.; Bhaumik, A. Magnetic properties of α-Fe2O3 nanoparticle synthesized by a new hydrothermal method. J. Magn. Magn. Mater. 2005, 285, 296–302. [Google Scholar] [CrossRef]
  13. George, M.; Mary John, A.; Nair, S.S.; Joy, P.A.; Anantharaman, M.R. Finite size effects on the structural and magnetic properties of sol–gel synthesized NiFe2O4 powders. J. Magn. Magn. Mater. 2006, 302, 190–195. [Google Scholar] [CrossRef]
  14. Singjai, P.; Wongwigkarn, K.; Laosiritaworn, Y.; Yimnirun, R.; Maensiri, S. Carbon encapsulated nickel nanoparticles synthesized by a modified alcohol catalytic chemical vapor deposition method. Curr. Appl. Phys. 2007, 7, 662–666. [Google Scholar] [CrossRef]
  15. Krishnakanth, R.; Jayakumar, G.; Albert Irudayaraj, A.; Dhayal Raj, A. Structural and Magnetic Properties of NiO and Fe-doped NiO Nanoparticles Synthesized by Chemical Co-precipitation Method. Mater. Today Proc. 2016, 3, 1370–1377. [Google Scholar] [CrossRef]
  16. Hammad, T.M.; Salem, J.K.; Amsha, A.A.; Hejazy, N.K. Optical and magnetic characterizations of zinc substituted copper ferrite synthesized by a co-precipitation chemical method. J. Alloys Compd. 2018, 741, 123–130. [Google Scholar] [CrossRef]
  17. Hemeda, O.M.; Tawfik, A.; Mostafa, M.; Zaki, M.; Abd El Ati, M.I. Structural and Magnetic Properties of Nano Ferrite for Magnetoelectric Applications. J. Phys. Conf. Ser. 2019, 1253, 12026. [Google Scholar] [CrossRef]
  18. Jalaly, M.; Enayati, M.H.; Karimzadeh, F. Investigation of structural and magnetic properties of nanocrystalline Ni0.3Zn0.7Fe2O4 prepared by high energy ball milling. J. Alloys Compd. 2009, 480, 737–740. [Google Scholar] [CrossRef]
  19. Deraz, N.M.; Hessien, M.M. Structural and magnetic properties of pure and doped nanocrystalline cadmium ferrite. J. Alloys Compd. 2009, 475, 832–839. [Google Scholar] [CrossRef]
  20. Li, S.; Qin, J.; Fornara, A.; Toprak, M.; Muhammed, M.; Kim, D.K. Synthesis and magnetic properties of bulk transparent PMMA/Fe-oxide nanocomposites. Nanotechnology 2009, 20, 185607. [Google Scholar] [CrossRef]
  21. Angermann, A.; Töpfer, J. Synthesis of nanocrystalline Mn–Zn ferrite powders through thermolysis of mixed oxalates. Ceram. Int. 2011, 37, 995–1002. [Google Scholar] [CrossRef]
  22. Ozkaya, T.; Toprak, M.S.; Baykal, A.; Kavas, H.; Köseoğlu, Y.; Aktaş, B. Synthesis of Fe3O4 nanoparticles at 100 °C and its magnetic characterization. J. Alloys Compd. 2009, 472, 18–23. [Google Scholar] [CrossRef]
  23. Gözüak, F.; Köseoğlu, Y.; Baykal, A.; Kavas, H. Synthesis and characterization of CoxZn1−xFe2O4 magnetic nanoparticles via a PEG-assisted route. J. Magn. Magn. Mater. 2009, 321, 2170–2177. [Google Scholar] [CrossRef]
  24. Rezlescu, E.; Rezlescu, N.; Popa, P.D.; Rezlescu, L.; Pasnicu, C.; Craus, M.L. Effect of Copper Oxide Content on Intrinsic Properties of MgCuZn Ferrite. Mater. Res. Bull. 1998, 33, 915–925. [Google Scholar] [CrossRef]
  25. Sertkol, M.; Köseoğlu, Y.; Baykal, A.; Kavas, H.; Bozkurt, A.; Toprak, M.S. Microwave synthesis and characterization of Zn-doped nickel ferrite nanoparticles. J. Alloys Compd. 2009, 486, 325–329. [Google Scholar] [CrossRef]
  26. Kumar, S.; Singh, R.R.; Barman, P.B. Reitveld Refinement and Derivative Spectroscopy of Nanoparticles of Soft Ferrites (MgNiFe). J. Inorg. Organomet. Polym. Mater. 2021, 31, 528–541. [Google Scholar] [CrossRef]
  27. Shobana, M.K.; Kim, K.; Kim, J.-H. Impact of magnesium substitution in nickel ferrite: Optical and electrochemical studies. Phys. E Low-Dimens. Syst. Nanostructures 2019, 108, 100–104. [Google Scholar] [CrossRef]
  28. Ravinder, D.; Hashim, M.; Upadhyay, A.; Ismail, M.M.; Kumar, S.; Kumar, R.; Meena, S.S.; Khalilullah, A. Investigation of structural and magnetic properties of La doped Co–Mn ferrite nanoparticles in the presence of α-Fe2O3 phase. Solid State Commun. 2022, 342, 114629. [Google Scholar] [CrossRef]
  29. Anumol, C.N.; Chithra, M.; Rout, S.; Sahoo, S.C. Effect of Magnesium Substitution on Structural and Magnetic Properties of Nickel Ferrite Nanoparticles. J. Supercond. Nov. Magn. 2020, 33, 1611–1617. [Google Scholar] [CrossRef]
  30. Rostami, M.; Majles Ara, M.H. The dielectric, magnetic and microwave absorption properties of Cu-substituted Mg-Ni spinel ferrite-MWCNT nanocomposites. Ceram. Int. 2019, 45, 7606–7613. [Google Scholar] [CrossRef]
  31. Boon, M.; Rickard, W.D.A.; Rohl, A.L.; Jones, F. Stabilization of Aragonite: Role of Mg2+ and Other Impurity Ions. Cryst. Growth Des. 2020, 20, 5006–5017. [Google Scholar] [CrossRef]
  32. Gabal, M.A.; Al Angari, Y.M.; Zaki, H.M. Structural, magnetic and electrical characterization of Mg–Ni nano-crystalline ferrites prepared through egg-white precursor. J. Magn. Magn. Mater. 2014, 363, 6–12. [Google Scholar] [CrossRef]
  33. Raghuvanshi, S.; Tiwari, P.; Kane, S.N.; Avasthi, D.K.; Mazaleyrat, F.; Tatarchuk, T.; Mironyuk, I. Dual control on structure and magnetic properties of Mg ferrite: Role of swift heavy ion irradiation. J. Magn. Magn. Mater. 2019, 471, 521–528. [Google Scholar] [CrossRef]
  34. Chandra Babu Naidu, K.; RoopasKiran, S.; Madhuri, W. Investigations on transport, impedance and electromagnetic interference shielding properties of microwave processed NiMg ferrites. Mater. Res. Bull. 2017, 89, 125–138. [Google Scholar] [CrossRef]
  35. Naeem, M.; Shah, N.A.; Gul, I.H.; Maqsood, A. Structural, electrical and magnetic characterization of Ni–Mg spinel ferrites. J. Alloys Compd. 2009, 487, 739–743. [Google Scholar] [CrossRef]
  36. Mazen, S.; Abu-Elsaad, N.I.; Nawara, A.S. The Influence of Various Divalent Metal Ions (Mn2+, Co2+, and Cu2+) Substitution on the Structural and Magnetic Properties of Nickel–Zinc Spinel Ferrite. Phys. Solid State 2020, 62, 1183–1194. [Google Scholar] [CrossRef]
  37. Debnath, S.; Das, R. Study of the optical properties of Zn doped Mn spinel ferrite nanocrystals shows multiple emission peaks in the visible range—A promising soft ferrite nanomaterial for deep blue LED. J. Mol. Struct. 2020, 1199, 127044. [Google Scholar] [CrossRef]
  38. Sharma, R.; Thakur, P.; Sharma, P.; Sharma, V. Ferrimagnetic Ni2+ doped Mg-Zn spinel ferrite nanoparticles for high density information storage. J. Alloys Compd. 2017, 704, 7–17. [Google Scholar] [CrossRef]
  39. Akhtar, M.N.; Khan, M.A.; Ahmad, M.; Nazir, M.S.; Imran, M.; Ali, A.; Sattar, A.; Murtaza, G. Evaluation of structural, morphological and magnetic properties of CuZnNi (CuxZn0.5−xNi0.5Fe2O4) nanocrystalline ferrites for core, switching and MLCI’s applications. J. Magn. Magn. Mater. 2017, 421, 260–268. [Google Scholar] [CrossRef]
  40. Deepty, M.; Srinivas, C.; Kumar, E.R.; Mohan, N.K.; Prajapat, C.L.; Rao, T.V.C.; Meena, S.S.; Verma, A.K.; Sastry, D.L. XRD, EDX, FTIR and ESR spectroscopic studies of co-precipitated Mn–substituted Zn–ferrite nanoparticles. Ceram. Int. 2019, 45, 8037–8044. [Google Scholar] [CrossRef]
  41. Moradmard, H.; Farjami Shayesteh, S.; Tohidi, P.; Abbas, Z.; Khaleghi, M. Structural, magnetic and dielectric properties of magnesium doped nickel ferrite nanoparticles. J. Alloys Compd. 2015, 650, 116–122. [Google Scholar] [CrossRef]
  42. El Maalam, K.; Ben Ali, M.; El Moussaoui, H.; Mounkachi, O.; Hamedoun, M.; Masrour, R.; Hlil, E.K.; Benyoussef, A. Magnetic properties of tin ferrites nanostructures doped with transition metal. J. Alloys Compd. 2015, 622, 761–764. [Google Scholar] [CrossRef]
  43. Noor, A.; Akhtar, M.N.; Khan, S.N.; Nazir, M.S.; Yousaf, M. Synthesis, morphological and electromagnetic evaluations of Ca doped Mn spinel nanoferrites for GHz regime applications. Ceram. Int. 2020, 46, 13961–13968. [Google Scholar] [CrossRef]
  44. Henaish, A.M.A.; Mostafa, M.; Salem, B.I.; Hemeda, O.M. Improvement of magnetic and dielectric properties of magnetoelectric BST-NCZMF nano-composite. Phase Transit. 2020, 93, 470–490. [Google Scholar] [CrossRef]
  45. Chandramouli, K.; Rao, P.A.; Suryanarayana, B.; Raghavendra, V.; Mercy, S.J.; Parajuli, D.; Taddesse, P.; Mulushoa, S.Y.; Mammo, T.W.; Murali, N. Effect of Cu substitution on magnetic and DC electrical resistivity properties of Ni–Zn nanoferrites. J. Mater. Sci. Mater. Electron. 2021, 32, 15754–15762. [Google Scholar] [CrossRef]
  46. Chandramouli, K.; Suryanarayana, B.; Phanidhar Varma, P.V.S.K.; Raghavendra, V.; Emmanuel, K.A.; Taddesse, P.; Murali, N.; Wegayehu Mammo, T.; Parajuli, D. Effect of Cr3+ substitution on dc electrical resistivity and magnetic properties of Cu0.7Co0.3Fe2−xCrxO4 ferrite nanoparticles prepared by sol-gel auto combustion method. Results Phys. 2021, 24, 104117. [Google Scholar] [CrossRef]
  47. Zhivulin, V.E.; Trofimov, E.A.; Gudkova, S.A.; Pashkeev, I.Y.; Punda, A.Y.; Gavrilyak, M.; Zaitseva, O.V.; Taskaev, S.V.; Podgornov, F.V.; Darwish, M.A.; et al. Polysubstituted High-Entropy [LaNd](Cr0.2Mn0.2Fe0.2Co0.2Ni0.2)O3 Perovskites: Correlation of the Electrical and Magnetic Properties. Nanomaterials 2021, 11, 1014. [Google Scholar] [CrossRef]
  48. Verwey, E.J.W.; De Boer, J.H. Cation arrangement in a few oxides with crystal structures of the spinel type. Recl. Trav. Chim. Pays-Bas 1936, 55, 531–540. [Google Scholar] [CrossRef]
  49. Javed Iqbal, M.; Rukh Siddiquah, M. Structural, electrical and magnetic properties of Zr–Mg cobalt ferrite. J. Magn. Magn. Mater. 2008, 320, 845–850. [Google Scholar] [CrossRef]
  50. Fawzi, A.S.; Sheikh, A.D.; Mathe, V.L. Structural, dielectric properties and AC conductivity of Ni(1−x)ZnxFe2O4 spinel ferrites. J. Alloys Compd. 2010, 502, 231–237. [Google Scholar] [CrossRef]
  51. Darwish, M.A.; Trukhanov, A.V.; Senatov, O.S.; Morchenko, A.T.; Saafan, S.A.; Astapovich, K.A.; Trukhanov, S.V.; Trukhanova, E.L.; Pilyushkin, A.A.; Sombra, A.S.B.; et al. Investigation of AC-Measurements of Epoxy/Ferrite Composites. Nanomaterials 2020, 10, 492. [Google Scholar] [CrossRef] [PubMed] [Green Version]
  52. Boiko, O.; Koltunowicz, T.N.; Zukowski, P.; Fedotov, A.K.; Larkin, A.V. The effect of sputtering atmosphere parameters on dielectric properties of the ferromagnetic alloy–ferroelectric ceramics nanocomposite (FeCoZr)x(PbZrTiO3)(100−x). Ceram. Int. 2017, 43, 2511–2516. [Google Scholar] [CrossRef]
  53. Czarnacka, K.; Koltunowicz, T.N.; Zukowski, P.; Fedotov, A.K. Dielectric properties of multi-layer nanocomposites SiOx/ZrO2 after high temperature annealing. Ceram. Int. 2019, 45, 6499–6502. [Google Scholar] [CrossRef]
  54. Zukowski, P.; Koltunowicz, T.N.; Czarnacka, K.; Fedotov, A.K.; Tyschenko, I.E. Carrier transport and dielectric permittivity of SiO2 films containing ion-beam synthesized InSb nanocrystals. J. Alloys Compd. 2020, 846, 156482. [Google Scholar] [CrossRef]
Figure 1. XRD patterns of Ni 1 x + 2 Mg x + 2 Fe 2 + 3 O 4 (x = 0, 0.2, 0.6, 0.8, and 1).
Nanomaterials 12 01045 g001
Figure 2. a e x p and a t h vs. Mg content (x = 0, 0.2, 0.6, 0.8, and 1) for Ni 1 x + 2 Mg x + 2 Fe 2 + 3 O 4 .
Nanomaterials 12 01045 g002
Figure 3. HRTEM images and the corresponding fringing spacing of Ni 1 x + 2 Mg x + 2 Fe 2 + 3 O 4 (x = 0, 0.2, 0.6, 0.8, and 1).
Nanomaterials 12 01045 g003aNanomaterials 12 01045 g003bNanomaterials 12 01045 g003c
Figure 4. SAED patterns of Ni 1 x + 2 Mg x + 2 Fe 2 + 3 O 4 (x = 0.2, and 0.8).
Nanomaterials 12 01045 g004
Figure 5. SEM micrograph of Ni 1 x + 2 Mg x + 2 Fe 2 + 3 O 4 (x = 0, 0.2, 0.6, 0.8, and 1).
Nanomaterials 12 01045 g005aNanomaterials 12 01045 g005b
Figure 6. Grain size of Ni 1 x + 2 Mg x + 2 Fe 2 + 3 O 4 (x = 0, 0.2, 0.6, 0.8, and 1).
Nanomaterials 12 01045 g006
Figure 7. (a) FTIR spectra of Ni 1 x + 2 Mg x + 2 Fe 2 + 3 O 4 (x = 0, 0.2, 0.6, 0.8, and 1). (b) Deconvolution of FTIR absorbance spectra of Ni 1 x + 2 Mg x + 2 Fe 2 + 3 O 4 (x = 0). (c) Deconvolution of FTIR absorbance spectra of Ni 1 x + 2 Mg x + 2 Fe 2 + 3 O 4 (x = 0.2). (d) Deconvolution of FTIR absorbance spectra of Ni 1 x + 2 Mg x + 2 Fe 2 + 3 O 4 (x = 0.6). (e) Deconvolution of FTIR absorbance spectra of Ni 1 x + 2 Mg x + 2 Fe 2 + 3 O 4 (x = 0.8). (f) Deconvolution of FTIR absorbance spectra of Ni 1 x + 2 Mg x + 2 Fe 2 + 3 O 4 (x = 1).
Nanomaterials 12 01045 g007aNanomaterials 12 01045 g007bNanomaterials 12 01045 g007c
Figure 8. (a) TGA curve of Ni 1 x + 2 Mg x + 2 Fe 2 + 3 O 4 (x = 0). (b) TGA curve of Ni 1 x + 2 Mg x + 2 Fe 2 + 3 O 4 (x = 0.2). (c) TGA curve of Ni 1 x + 2 Mg x + 2 Fe 2 + 3 O 4 (x = 0.6). (d) TGA curve of Ni 1 x + 2 Mg x + 2 Fe 2 + 3 O 4 (x = 0.8). (e) TGA curve of Ni 1 x + 2 Mg x + 2 Fe 2 + 3 O 4 (x = 1).
Nanomaterials 12 01045 g008aNanomaterials 12 01045 g008bNanomaterials 12 01045 g008c
Figure 9. Magnetic hysteresis loops of Ni 1 x + 2 Mg x + 2 Fe 2 + 3 O 4 (x = 0, 0.2, 0.6, 0.8, and 1).
Nanomaterials 12 01045 g009
Figure 10. (a) μi as a function of temperature at different frequencies of Ni 1 x + 2 Mg x + 2 Fe 2 + 3 O 4 (x = 0). (b) μi as a function of temperature at different frequencies of Ni 1 x + 2 Mg x + 2 Fe 2 + 3 O 4 (x = 0.2). (c) μi as a function of temperature at different frequencies of Ni 1 x + 2 Mg x + 2 Fe 2 + 3 O 4 (x = 0.6). (d) μi as a function of temperature at different frequencies of Ni 1 x + 2 Mg x + 2 Fe 2 + 3 O 4 (x = 0.8). (e) μi as a function of temperature at different frequencies of Ni 1 x + 2 Mg x + 2 Fe 2 + 3 O 4 (x = 1).
Nanomaterials 12 01045 g010aNanomaterials 12 01045 g010bNanomaterials 12 01045 g010c
Figure 11. The variation of DC resistivity as a function of the reciprocal temperature of Ni 1 x + 2 Mg x + 2 Fe 2 + 3 O 4 (x = 0, 0.2, 0.6, 0.8, and 1).
Nanomaterials 12 01045 g011
Figure 12. (a) ε as a function of the temperature of Ni 1 x + 2 Mg x + 2 Fe 2 + 3 O 4 (x = 0). (b) ε as a function of the temperature of Ni 1 x + 2 Mg x + 2 Fe 2 + 3 O 4 (x = 0.2). (c) ε as a function of the temperature of Ni 1 x + 2 Mg x + 2 Fe 2 + 3 O 4 (x = 0.6). (d) ε as a function of the temperature of Ni 1 x + 2 Mg x + 2 Fe 2 + 3 O 4 (x = 0.8). (e) ε as a function of the temperature of Ni 1 x + 2 Mg x + 2 Fe 2 + 3 O 4 (x = 1).
Nanomaterials 12 01045 g012aNanomaterials 12 01045 g012bNanomaterials 12 01045 g012c
Table 1. X-ray cation distribution, ionic radius of the (A) position ( r A ), ionic radius of the (B) position ( r B ), oxygen positional parameter ( u ), inversion parameter ( δ ), and bond length of A-site ( R A ) and B-site ( R B ) for Ni 1 x + 2 Mg x + 2 Fe 2 + 3 O 4 (x = 0, 0.2, 0.6, 0.8, and 1).
x Cation Distribution r A
(Å)
r B
(Å)
u (Å) δ (Å) Bond Length (Å) μ t h   ( μ B )
A-SiteB-Site R A R B
0 Fe 1 + 3 ( Ni 1 + 2 Fe 1 + 3 ) 0.640.66500.38610.01111.95991.9882.00
0.2 Mg 0.004 + 2 Fe 0.996 + 3 ( Mg 0.196 + 2 Ni 0.8 + 2 Fe 1.004 + 3 ) 0.64030.66700.38600.01101.95961.9921.64
0.6 Mg 0.012 + 2 Fe 0.988 + 3 Mg 0.588 + 2 Ni 0.4 + 2 Fe 1.012 + 3 0.64090.67300.38580.01081.96091.9980.92
0.8 Mg 0.016 + 2 Fe 0.984 + 3 Mg 0.784 + 2 Ni 0.2 + 2 Fe 1.016 + 3 0.64130.67600.38570.01071.96122.0000.56
1 Mg 0.02 + 2 Fe 0.98 + 3 Mg 0.98 + 2 Fe 1.02 + 3 0.64160.67900.38560.01061.96152.0110.2
Table 2. Crystallite size ( D ), theoretical X-ray density ( ρ x ), bulk density ( ρ b u l k ), porosity ( P ), and crystallite size, lattice parameter, and theoretical magnetic moment from HRTEM for Ni 1 x + 2 Mg x + 2 Fe 2 + 3 O 4 (x = 0, 0.2, 0.6, 0.8, and 1).
xD
(nm)
ρ x
(g/cm3)
ρ b u l k
(g/cm3)
P
(%)
D
(nm)
a t h
(Å)
μ t h ( μ B )
XRDHRTEM
0215.3593.75929.8520.928.3102.00
0.2195.1263.62129.3617.648.3191.64
0.6144.8253.35730.4213.798.3350.92
0.8124.7233.15833.1314.628.3430.56
1174.5863.16131.0717.708.3510.20
Table 3. Average pores size (μm) for Ni 1 x + 2 Mg x + 2 Fe 2 + 3 O 4 (x = 0, 0.2, 0.6, 0.8, and 1).
xAverage of Pores Size (μm)
00.23
0.20.07
0.60.15
0.80.144
10.09
Table 4. ν1 (the absorption spectra of the A-site) and ν2 (the absorption spectra of the B-site), R’A (the bond length) and F for Ni 1 x + 2 Mg x + 2 Fe 2 + 3 O 4 (x = 0, 0.2, 0.6, 0.8, and 1).
xν1ν2   R A Ftetra (dyne/cm) × 105Focta (dyne/cm) × 105
05894051.95992.541.20
0.25803821.95962.461.07
0.65763961.96092.431.15
0.85744031.96122.411.19
15714341.96152.391.38
Table 5. Deconvolution parameter of the FTIR spectra of the prepared ferrites, where (C) is the component band center, and (A) denotes the relative area of the component band.
x = 0x = 0.2x = 0.6x = 0.8x = 1
IC393358376403389
A19.0022.0017.0012.0019.00
IIC574579588576585
A 16.00 29.0034.0042.0028.00
IIIC1068109910901112974
A0.771.301.602.301.50
IVC127112791269--
A1.3025.005.00--
VC14011412139914111425
A4.403.702.304.10 19.00
VIC1554154315991552 1554
A4.2013.0025.002.1022.00
VIIC16341627- 1629 1638
A1.202.50-3.00 4.00
VIIIC21052021 2111 2064 2123
A24.60 10.00 8.303.002.70
IXC2996234625592911-
A18.90 9.00 5.102.60-
XC34333380298133723403
A9.60 8.00 1.9029.0012.00
Table 6. The magnitudes of saturation magnetization (Ms), coercivity (Hc), remnant magnetization (Mr), and experimental and theoretical magnetic moments (µexp, µth) of Ni 1 x + 2 Mg x + 2 Fe 2 + 3 O 4 (x = 0, 0.2, 0.6, 0.8, and 1).
xMs
(emu/g)
Hc
(Oe)
Mr
(emu/g)
µexp
(µB)
µth
(µB)
028.385192.606.721.19122.00
0.229.256178.966.391.19171.64
0.616.252111.732.220.62190.92
0.810.52795.4620.960.38990.56
19.019488.3440.580.32290.2
Table 7. The Curie temperature (TC) determined from the initial permeability data, permeability change rate dµi/dT, and grain size of Ni 1 x + 2 Mg x + 2 Fe 2 + 3 O 4 (x = 0, 0.2, 0.6, 0.8, and 1).
xTC
(K)
Permeability Change Rate dµi/dT, (K−1)Grain Size
(D), (nm)
06332.24384
0.28131.74071
0.65840.97797
0.85130.514125
16140.447136
Table 8. The Curie temperature (TC) determined from the DC electrical resistivity data and the activation energy for ferrimagnetic (Ef) and paramagnetic (EP) of Ni 1 x + 2 Mg x + 2 Fe 2 + 3 O 4 (x = 0, 0.2, 0.6, 0.8, and 1).
xTC (K)Ep (eV)Ef (eV)
06560.270.39
0.26660.400.43
0.66860.530.40
0.87050.510.19
16660.410.34
Table 9. ε value at temperature 500 K and frequency of 10 kHz of Ni 1 x + 2 Mg x + 2 Fe 2 + 3 O 4 (x = 0, 0.2, 0.6, 0.8, and 1).
x00.20.60.81
ε40.4240.9322.7124.1633.74
Publisher’s Note: MDPI stays neutral with regard to jurisdictional claims in published maps and institutional affiliations.

