Article

CFD Development of a Silica Membrane Reactor during HI Decomposition Reaction Coupling with CO2 Methanation at Sulfur–Iodine Cycle

by
Milad Mohammad Alinejad
1,
Kamran Ghasemzadeh
1,*,
Adolfo Iulianelli
2,*,
Simona Liguori
3 and
Milad Ghahremani
1
1
Faculty of Chemical Engineering, Urmia University of Technology, Urmia 5756151818, Iran
2
Institute on Membrane Technology of the Italian National Research Council (CNR-ITM), Via P. Bucci Cubo 17/C, 87036 Rende, CS, Italy
3
Department of Chemical and Biomolecular Engineering, Clarkson University, Potsdam, NY 13699, USA
*
Authors to whom correspondence should be addressed.
Nanomaterials 2022, 12(5), 824; https://doi.org/10.3390/nano12050824
Submission received: 25 January 2022 / Revised: 23 February 2022 / Accepted: 26 February 2022 / Published: 28 February 2022
(This article belongs to the Special Issue Hybrid Porous Nanomaterials for Energy and Environment)

Abstract

:
In this work, a novel structure of a hydrogen-membrane reactor coupling HI decomposition and CO2 methanation was proposed, and it was based on the adoption of silica membranes instead of metallic, according to their ever more consistent utilization as nanomaterial for hydrogen separation/purification. A 2D model was built up and the effects of feed flow rate, sweep gas flow rate and reaction pressure were examined by CFD simulation. This work well proves the feasibility and advantage of the membrane reactor that integrates HI decomposition and CO2 methanation reactions. Indeed, two membrane reactor systems were compared: on one hand, a simple membrane reactor without proceeding towards any CO2 methanation reaction; on the other hand, a membrane reactor coupling the HI decomposition with the CO2 methanation reaction. The simulations demonstrated that the hydrogen recovery in the first membrane reactor was higher than the methanation membrane reactor. This was due to the consumption of hydrogen during the CO2 methanation reaction, occurring in the permeate side of the second membrane reactor system, which lowered the amount of hydrogen recovered in the outlet streams. After model validation, this theoretical study allows one to evaluate the effect of different operating parameters on the performance of both the membrane reactors, such as the pressure variation between 1 and 5 bar, the feed flow rate between 10 and 50 mm3/s and the sweep gas flow rate between 166.6 and 833.3 mm3/s. The theoretical predictions demonstrated that the best results in terms of HI conversion were 74.5% for the methanation membrane reactor and 67% for the simple membrane reactor.

1. Introduction

With the simultaneous increase in world energy demand and pressing concerns for reducing greenhouse gases (GHGs) emissions, today, hydrogen has become the most important energy vector. As a result of fast world industrialization, the GHGs emissions resulted are responsible for the climate change, global warming, ocean acidification, and other environmental issues [1]. Carbon dioxide (CO2), methane (CH4), perfluorinated compounds (PFCs), and nitrogen dioxide (NO) are the main components of GHGs, even though CO2 represents the greatest portion among them. Hence, significant efforts have been made to develop effective CO2 capture and sequestration (CCS) systems [2]. Hydrogen is considered as a clean and efficient energy vector, playing an important role coupled with the fuel cells for the world’s and developing nations’ energy crises [3]. The use of hydrogen in an economy powered by renewable energy sources will minimize reliance on fossil fuels. It is critical to establish a long-term strategy for massive hydrogen energy generation using non-fossil fuels. The thermochemical splitting of water utilizing high temperature energy from the sun or nuclear sources is one of the potential approaches to create hydrogen in a sustainable manner [4]. The iodine sulphur (IS) thermochemical cycle has been recognized as one of the most promising pathways for hydrogen generation because of its capacity to create hydrogen from water by nuclear heat, which can be provided by high-temperature nuclear reactors [5,6].
The chemical reactions related to the IS thermochemical cycle process are as follows:
Bunsen reaction (T = 100 °C):
SO2(g) + 2H2O(l) + I2(l) → H2SO4(aq) + 2HI(aq)
Sulfuric acid decomposition (T = 850 °C):
H2SO4(g) → H2O(g) + SO2(g) + 0.5O2(g)
Hydrogen iodide decomposition (T = 500 °C):
2HI(g) → H2(g) + I2(g)
The HI decomposition process (3) is responsible for the production of I2 and H2. The former represents the major product, while I2 is recycled to the Bunsen reaction (1). The equilibrium decomposition ratio of HI, which is calculated from the Gibbs free energy of the components (about 20% at 400 °C), is low in this system. As a result of the low breakdown ratio, the quantity of recycled materials (HI and I2) increases, lowering the cycle’s thermal performance. A fruitful approach to favor the HI decomposition reaction could be represented by the utilization of hydrogen perm-selective membrane reactors (MRs), where H2 is removed from the reaction side through an inorganic membrane [7,8,9,10]. The MRs technology allows that the hydrogen generation and separation may take place simultaneously under an intensified process, reducing the need for extra equipment and lowering the hydrogen separation/purification expenses. The requirement for a separate hydrogen production plant as well as the energy expenditure for hydrogen compression for transportation may be removed by employing hydrogen generators on-site. To carry out the HI decomposition in a MR, membranes with both high H2 permeability and H2/HI selectivity, as well as strong heat and corrosion resistance in the process environment, are required. In the specialized literature, metallic and silica-based membranes result to be the most investigated systems for hydrogen generation and purification [11,12,13,14]. As demonstrated by Myagmarjav et al. [14], silica membranes offer several benefits over metallic membranes, such as chemical and mechanical resistance, as they are built up on porous ceramic supports. Furthermore, unlike the metallic membranes, such as palladium, tantalum, etc., silica membranes allow a physical separation process (solid-sate diffusion) without any need of superficial reactions, where the hydrogen molecules are dissociated into atoms and then recombined again. Mesoporous silica nanoparticles have been intensively studied as the available nanomaterial in the last decade due to its many promising advantages, such as its extensive multi-functionality, based on its high specific surface, uniform and tuneable pore size, high pore volume, and facile functionalization [15]. For example, Nwogua et al. [16] performed an experimental campaign adopting a novel nano-porous silica ceramic membrane manufactured through an alternative, dip coating method to separate hydrogen from N2, Ar, and CH4 at at low-pressure and elevated temperatures. Amanipour et al. [17] synthesized a hydrogen-selective silica nano-composite ceramic membrane by depositing a dense layer composed of SiO2 and Al2O3 on the top of a graded multilayer substrate using co-current chemical vapor deposition (CVD).
Hence, the adoption of silica membranes for hydrogen separation may currently represent a more advantageous choice also to carry out the HI decomposition reaction in MRs. To enhance the hydrogen removal from the reaction side of a MR towards the permeate side, where it is collected, a sweep gas or vacuum is frequently employed in this MR zone, in order to favor the enhancement of the hydrogen permeation driving force across the membrane. An alternative option to increase the hydrogen permeation driving force is to perform a secondary reaction in the permeate side that consumes the permeated hydrogen. Hence, the CO2 methanation reaction, described in Equation (4), can be utilized to keep the hydrogen concentration in the permeate side low.
CO2 + 4H2 → CH4 + 2H2O    ΔH = −165 KJ/mol
The CO2 methanation, also known as the Sabatier reaction, represents—therefore—a fruitful method to mitigate the GHGs and, at the same time, to convert CO2 into synthetic natural gas (SNG) [17,18,19]. Internal combustion engines could use SNG directly as a fuel. Nevertheless, the availability of pure hydrogen, which is extremely costly, is the reaction’s primary stumbling block. The synergistic impact of combining the CO2 methanation and HI decomposition processes in a MR may improve the performance of both processes. The use of a CO2 methanation reaction on the permeate side of the MR would result in continuous hydrogen consumption, allowing for a constant chemical potential difference across the membrane while reducing the need for additional vacuum and/or sweep gas to maintain a constant hydrogen concentration gradient. The operating temperature requested for the CO2 methanation is regulated by coupling the processes. The hybrid MR coupling the hydrogen generation via HI decomposition and the CO2 methanation to generate SNG will address three key issues: (1) overcoming the equilibrium constraint of the HI decomposition process, (2) aiding CO2 mitigation, and (3) maintaining a stable hydrogen permeation driving force across the membrane.
It is widely accepted that the theoretical methods are used to find the optimal operating conditions to carry out whatever chemical process, consequently favoring the cost savings in terms of reduced experimental tests. The computational fluid dynamic (CFD) method is a feasible tool for simulating the gas flow characteristics of an industrial system. Based on a control volume technique, it may be adopted to prototype equipment in chemical engineering, such as reformers and separators [20]. Unlike other theoretical models, CFD modeling enables the theoretical visualization of local fluid changes, as well as thermal and mass transport properties. Some of the authors of this manuscript used CFD model to analyze several reaction processes carried out in MRs, such as the esterification [21,22] or hydrogen generation reactions [23,24,25], taking into account variables, such as temperature, product concentration, and velocity distributions in both reaction and permeate sides, as a result of mass and heat transfer, as well as flow resistance. In earlier studies, theoretical models were also used to simulate the HI decomposition reaction in conventional [26,27] and MRs [28,29]. In particular, Goswami et al. [28] used a CFD modeling to simulate the HI decomposition reaction in coated wall MRs, demonstrating that the utilization of membrane into a coated wall reactor can enhance the HI decomposition conversion. Tandon et al. [29] developed a non-isothermal mathematical model by combining the reaction kinetics with the microscopic material and energy balance along with the length of the MR used for the HI decomposition reaction. They performed the simulations comparing the developed model with other already existing isothermal models, optimizing the operating and design parameters.
The novelty of this work deals with the development of the CFD method to analyze the HI decomposition reaction performed in the core of a silica MR, coupling the CO2 methanation reaction in the permeate side of the methanation membrane reactor (MMR), meanwhile studying the effect of some operating parameters, such as reaction pressure, feed flow and sweep gas flow rates, for achieving the best performance in terms of HI decomposition conversion, as well as hydrogen recovery. Furthermore, a theoretical comparison between the MMR and the equivalent MR (without conversion of hydrogen and CO2 into methane in the permeate side) was proposed and discussed.

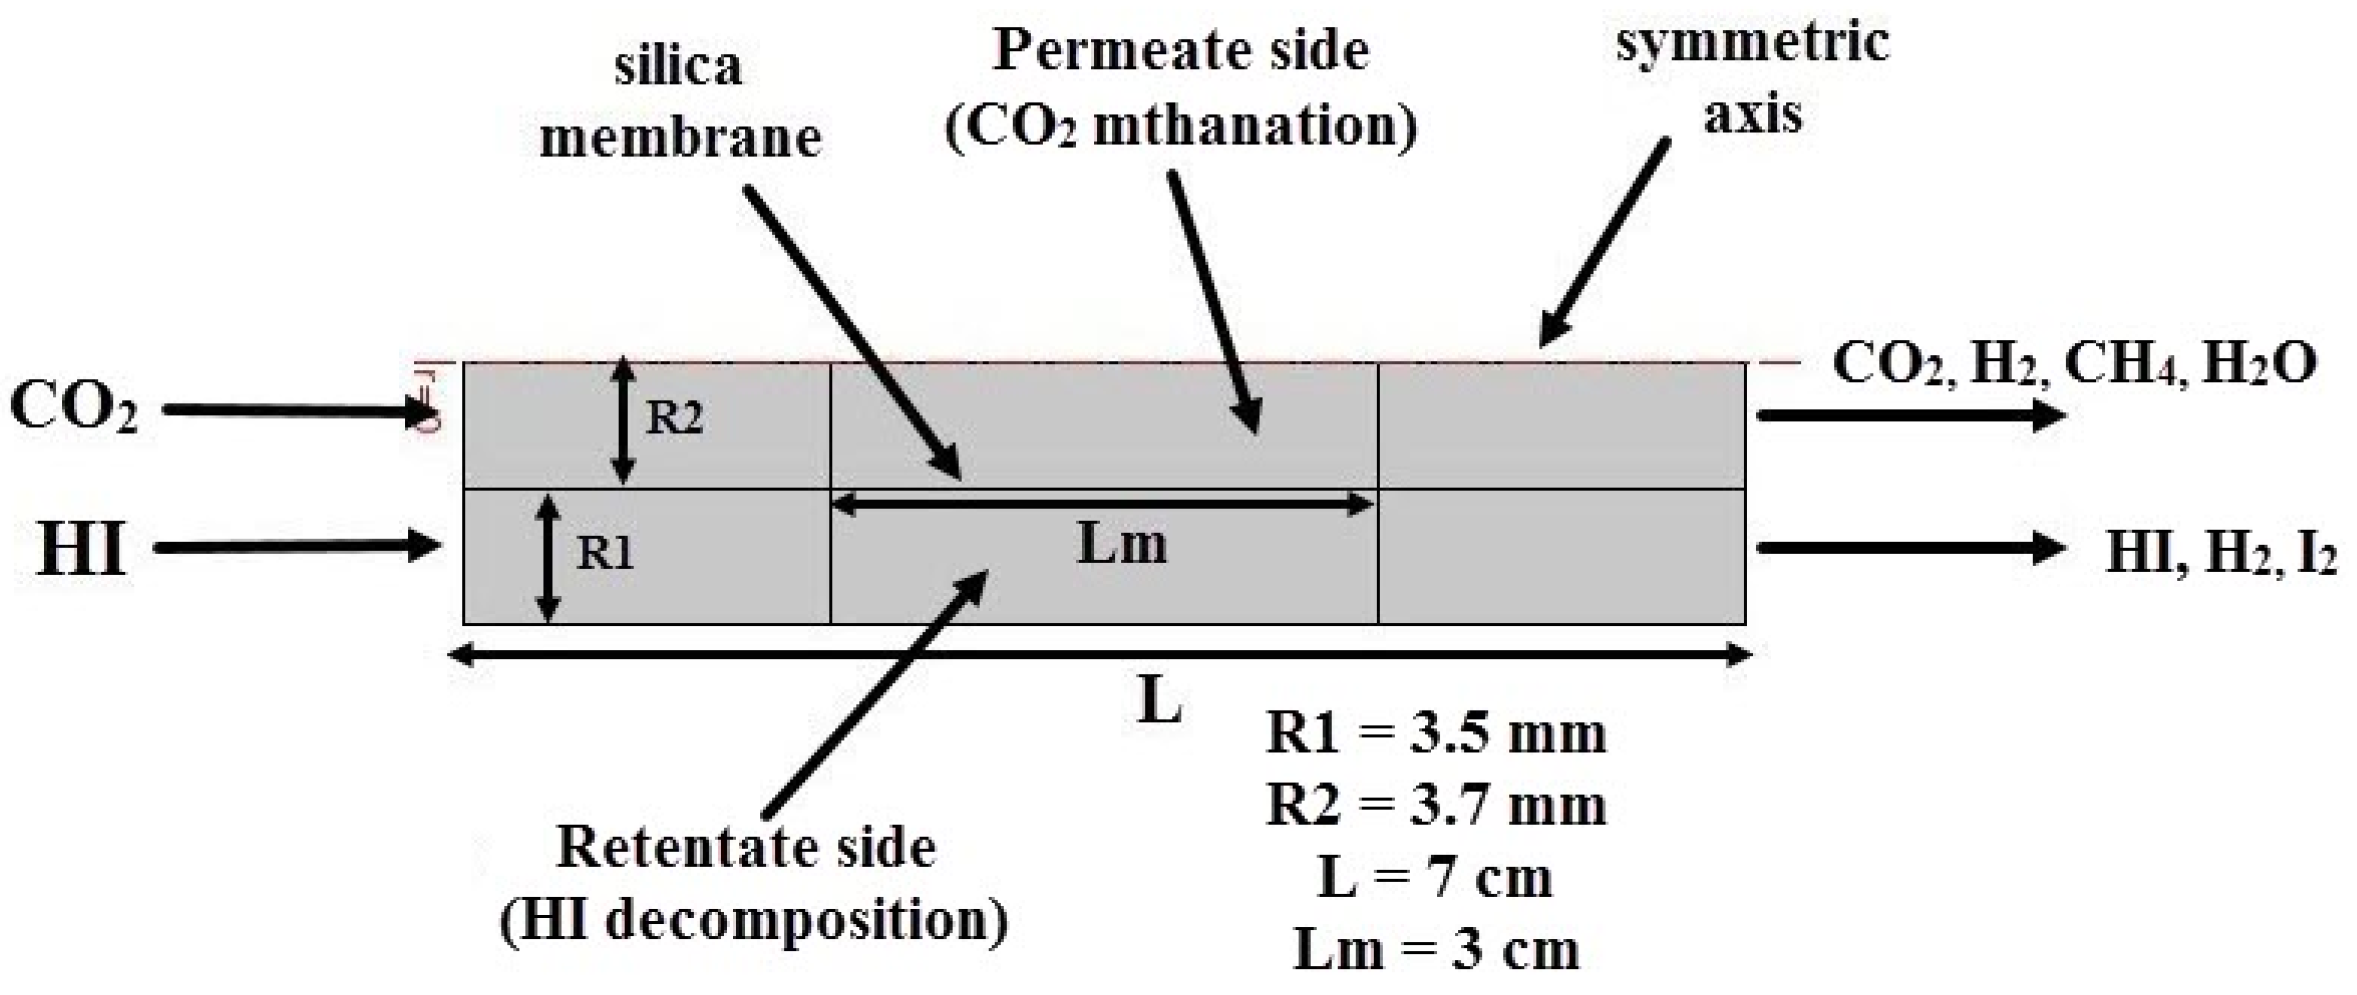
2. Model Development Using CFD Method

A CFD model was developed using the COMSOL Multiphysics 5.5 software in order to predict the MR module housing a single tubular silica membrane as illustrated in Figure 1, based on the following assumptions:
-
Isothermal and steady-state process.
-
Consistent membrane and catalytic performance without deactivation or concentration polarization.
-
Components with constant physical characteristics.
-
Both the retentate and permeate sides have a plug flow pattern.
-
In the reaction zone, a pseudo-homogeneous situation is considered.
-
At the gas/membrane contact, there is no mass transfer barrier.
Figure 1. The simplified MR module scheme as a 2D-axisymmetric geometry.
Nanomaterials 12 00824 g001
According to Figure 1, the “Feed” represents the inlet stream flowing into the silica MR, “Retentate” is the non-permeating outlet stream, and “Permeate” is the stream permeated through the membrane. A 2D axisymmetric model was created using the silica MR-modified shape.

2.1. Governing Equations

Continuity equation, Equation (5), momentum balance, Equation (6), and species transport-reaction equation, Equation (7), are the basic expressions used for modeling both permeate and retentate sides of the MR:
( ρ f . ε . u ) = S i
( ρ f . u . u ) = p β u + τ + ρ f g  
( ρ f . u i . ε ) = ( ρ f D i , e x i ) + ( 1 ε ) ρ M i j v i j r j + S i  
where ρf is the fluid density, ε is the void fraction of the catalytic bed defined 0.4, ρ is the catalyst density, rj is the reaction rate of components, vij is the stoichiometric coefficients, and Mi, xi, and Di,e are the molar weight, the mass fraction, and the diffusion coefficient of the component “i”, respectively [12]. β is the friction coefficient, calculated by Ergun’s equation:
β = 150   μ f ( 1   ε ) 2 ε 3 d p 2 + 1.75   ( 1 ε ) ρ f ε 3 d p | u |
In this equation, dp is the particle diameter equal to 0.5 mm, ε is the catalyst bed void fraction equal to 0.4, and μf is the effective viscosity of the gaseous mixture, which is chosen by the equation proposed by Buddenburg et al. [30]. Moreover, fluid density has been calculated by ideal gas correlation. On the other hand, the Maxwell-Stefan diffusion model was used for calculating the diffusion coefficients.
Si is the sink/source terms of component “i”, which accounts for the addition or removal of the component “i” into the system for permeation through the membrane. Here, as a first approximation, hydrogen is considered as the unique gas permeating from the retentate to the permeate side. This term appears as a sink term in the retentate side and a source term in permeate side. In other words, Si = 0 for all components except for hydrogen, which is calculated as:
S H 2 = A   J H 2 M H 2 V  
A is the membrane surface, V is the computational cell volume, MH2 is the hydrogen molar weight, and JH2 is the hydrogen permeating flux, calculated by Equation (10).
J H 2 = Pe H 2 ( p H 2 , ret   p H 2 , perm )  
PeH2 (3.8 × 10⁻⁷ [mol/m2/s/Pa]) is the hydrogen permeance for the silica membrane [25], pH2,ret is the hydrogen partial pressure in the retentate side, and pH2,perm is the hydrogen partial pressure in the permeate side. In Equation (7), rj is the rate of reaction j, and vij is the stoichiometric coefficient of component “i” in reaction. HI decomposition kinetic reaction on carbon active catalyst may be described according to the equations reported below [13]:
rHI = −kp RHI
  R HI = X HI 1 + K I 2 PX I 2 X H 2 + X I 2 ( 1 + K I 2 P ( φ e 2 )   ) K p ( 1 + K I 2 PX I 2 )
k = 1.58 × 10⁻¹ exp(−Ea1/RT)
KI2 = 5.086 × 10⁻¹¹ exp(−Ea2/RT)
where Ea1 is equal to 34.31 × 10³ J/mol and Ea2 is equal to 86.66 × 10³ J/mol, φe is the equilibrium conversion. The equilibrium constant, Kp for the decomposition of HI, is obtained by the free energy values given in the JANAF, using Equation (10).
Kp = exp(−∆G(11.5 kJ/mol at 923 °C)/RT)
CO2 methanation kinetic reaction on Pt/Al2O3 catalyst at the permeate side may be expressed according to the equations reported below [12]:
r m = ρ cat kK CO 2 K H 2 4 P CO 2 P H 2 4 ( 1 + K CO 2 P CO 2 + K H 2 P H 2 ) 5 ( 1 β )  
β = P CH 4 P H 2 O 2 P CO 2 P H 2 4 K eq  
k = 1.0635 × 10¹¹ exp(−113,497.4/RT)
KCO2 = 9.099 × 10⁻⁷ exp(69,691.8/RT)
KH2 = 9.6104 × 10⁻⁴ exp(39,942.0/RT)
Keq = exp((28,183/T2 + 17,430/T−8.2536log(T) + 2.8032 × 10⁻³T) + 33.165)
where T is the reaction temperature and R is the ideal gas constant.

2.2. Boundary Conditions and Solving Method

The boundary conditions used in the simulations for both permeate and retentate streams are summarized in Table 1. The key parameters (HI conversion and hydrogen recovery), helpful for assessing the silica MR performance during the HI decomposition reaction, are defined in the following equations:
HI   conversion   ( % ) = HI in   HI out HI in 100  
Hydrogen   recovery   ( % ) = H 2 Permeate H 2 Permeate + H 2 retentate 100  
where HIin and HIout represent the inlet and outlet hydrogen iodide molar flow rates, respectively, and H2retentate and H2permeate represent the hydrogen molar flow rates in the retentate and permeate streams, respectively.
As a simulator and to solve the governing equations, the commercial CFD program COMSOL Multiphysics 5.5 was utilized. The finite element approach was utilized to solve the defined two-dimensional CFD model in this program. Pressure-velocity correction has also been conducted using the SIMPLE technique. Standard definitions incorporated in the COMSOL program were used to examine the fluid properties’ dependence on temperature, pressure, and composition over the CFD model domain. The numerical solution was continued until all of the variable’s tolerance values were less than 10−4.

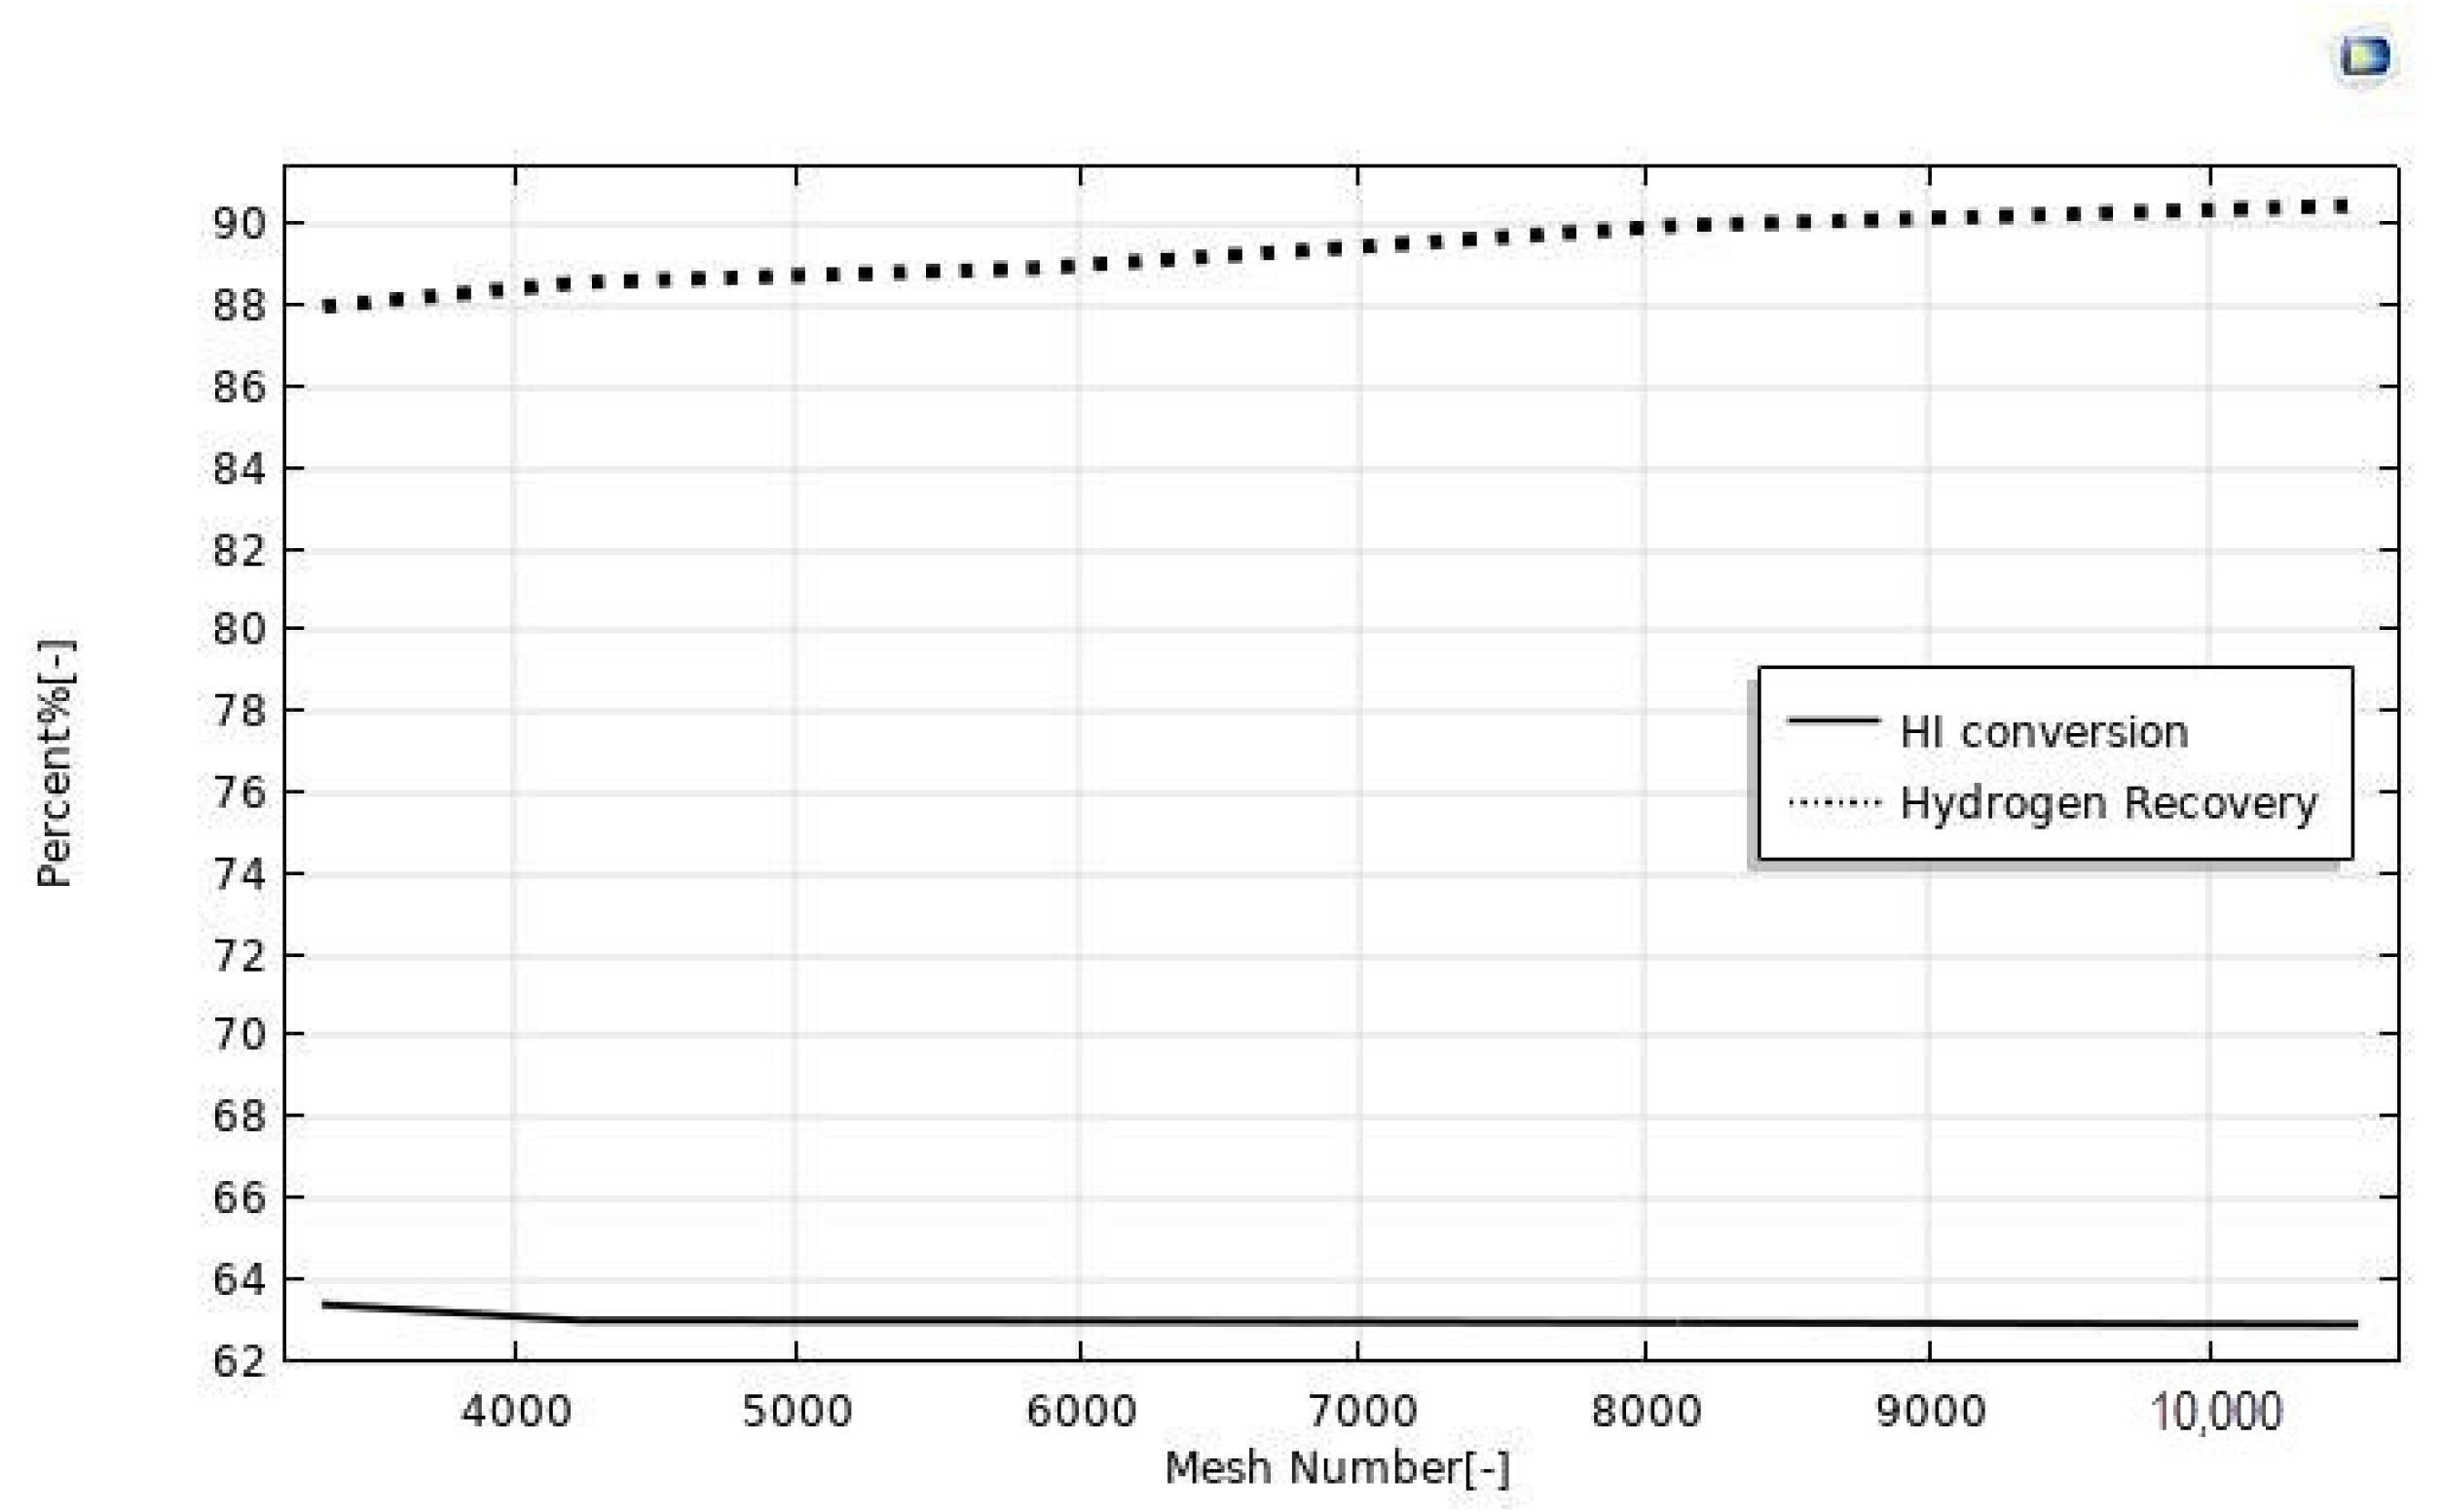
2.3. Mesh Independency

The CFD modeling was carried out considering, at first, various mesh numbers in order to find the optimal value to achieve reasonable results with the lowest solving time. In literature, various criteria were used to optimize the choice of the mesh number, in order to ensure the validity of the simulation results [31,32]. In our case, as already validated in our previous publications [21,22,23,24], we followed an approach to establish the optimized mesh number as a function of a convergence loop. In this regard, the mesh number was optimized when the discrepancies between simulated HI conversion and hydrogen recovery as a function of the mesh number were less than 3%, and this happened in the mesh number range between 3325 and 10,527, Figure 2. Furthermore, beyond the mesh number of 8000, the simulated values became independent of the mesh number itself, owing to insignificant changes. Consequently, a mesh number of 8000 was set in all the simulations of this work.

3. Results and Discussion

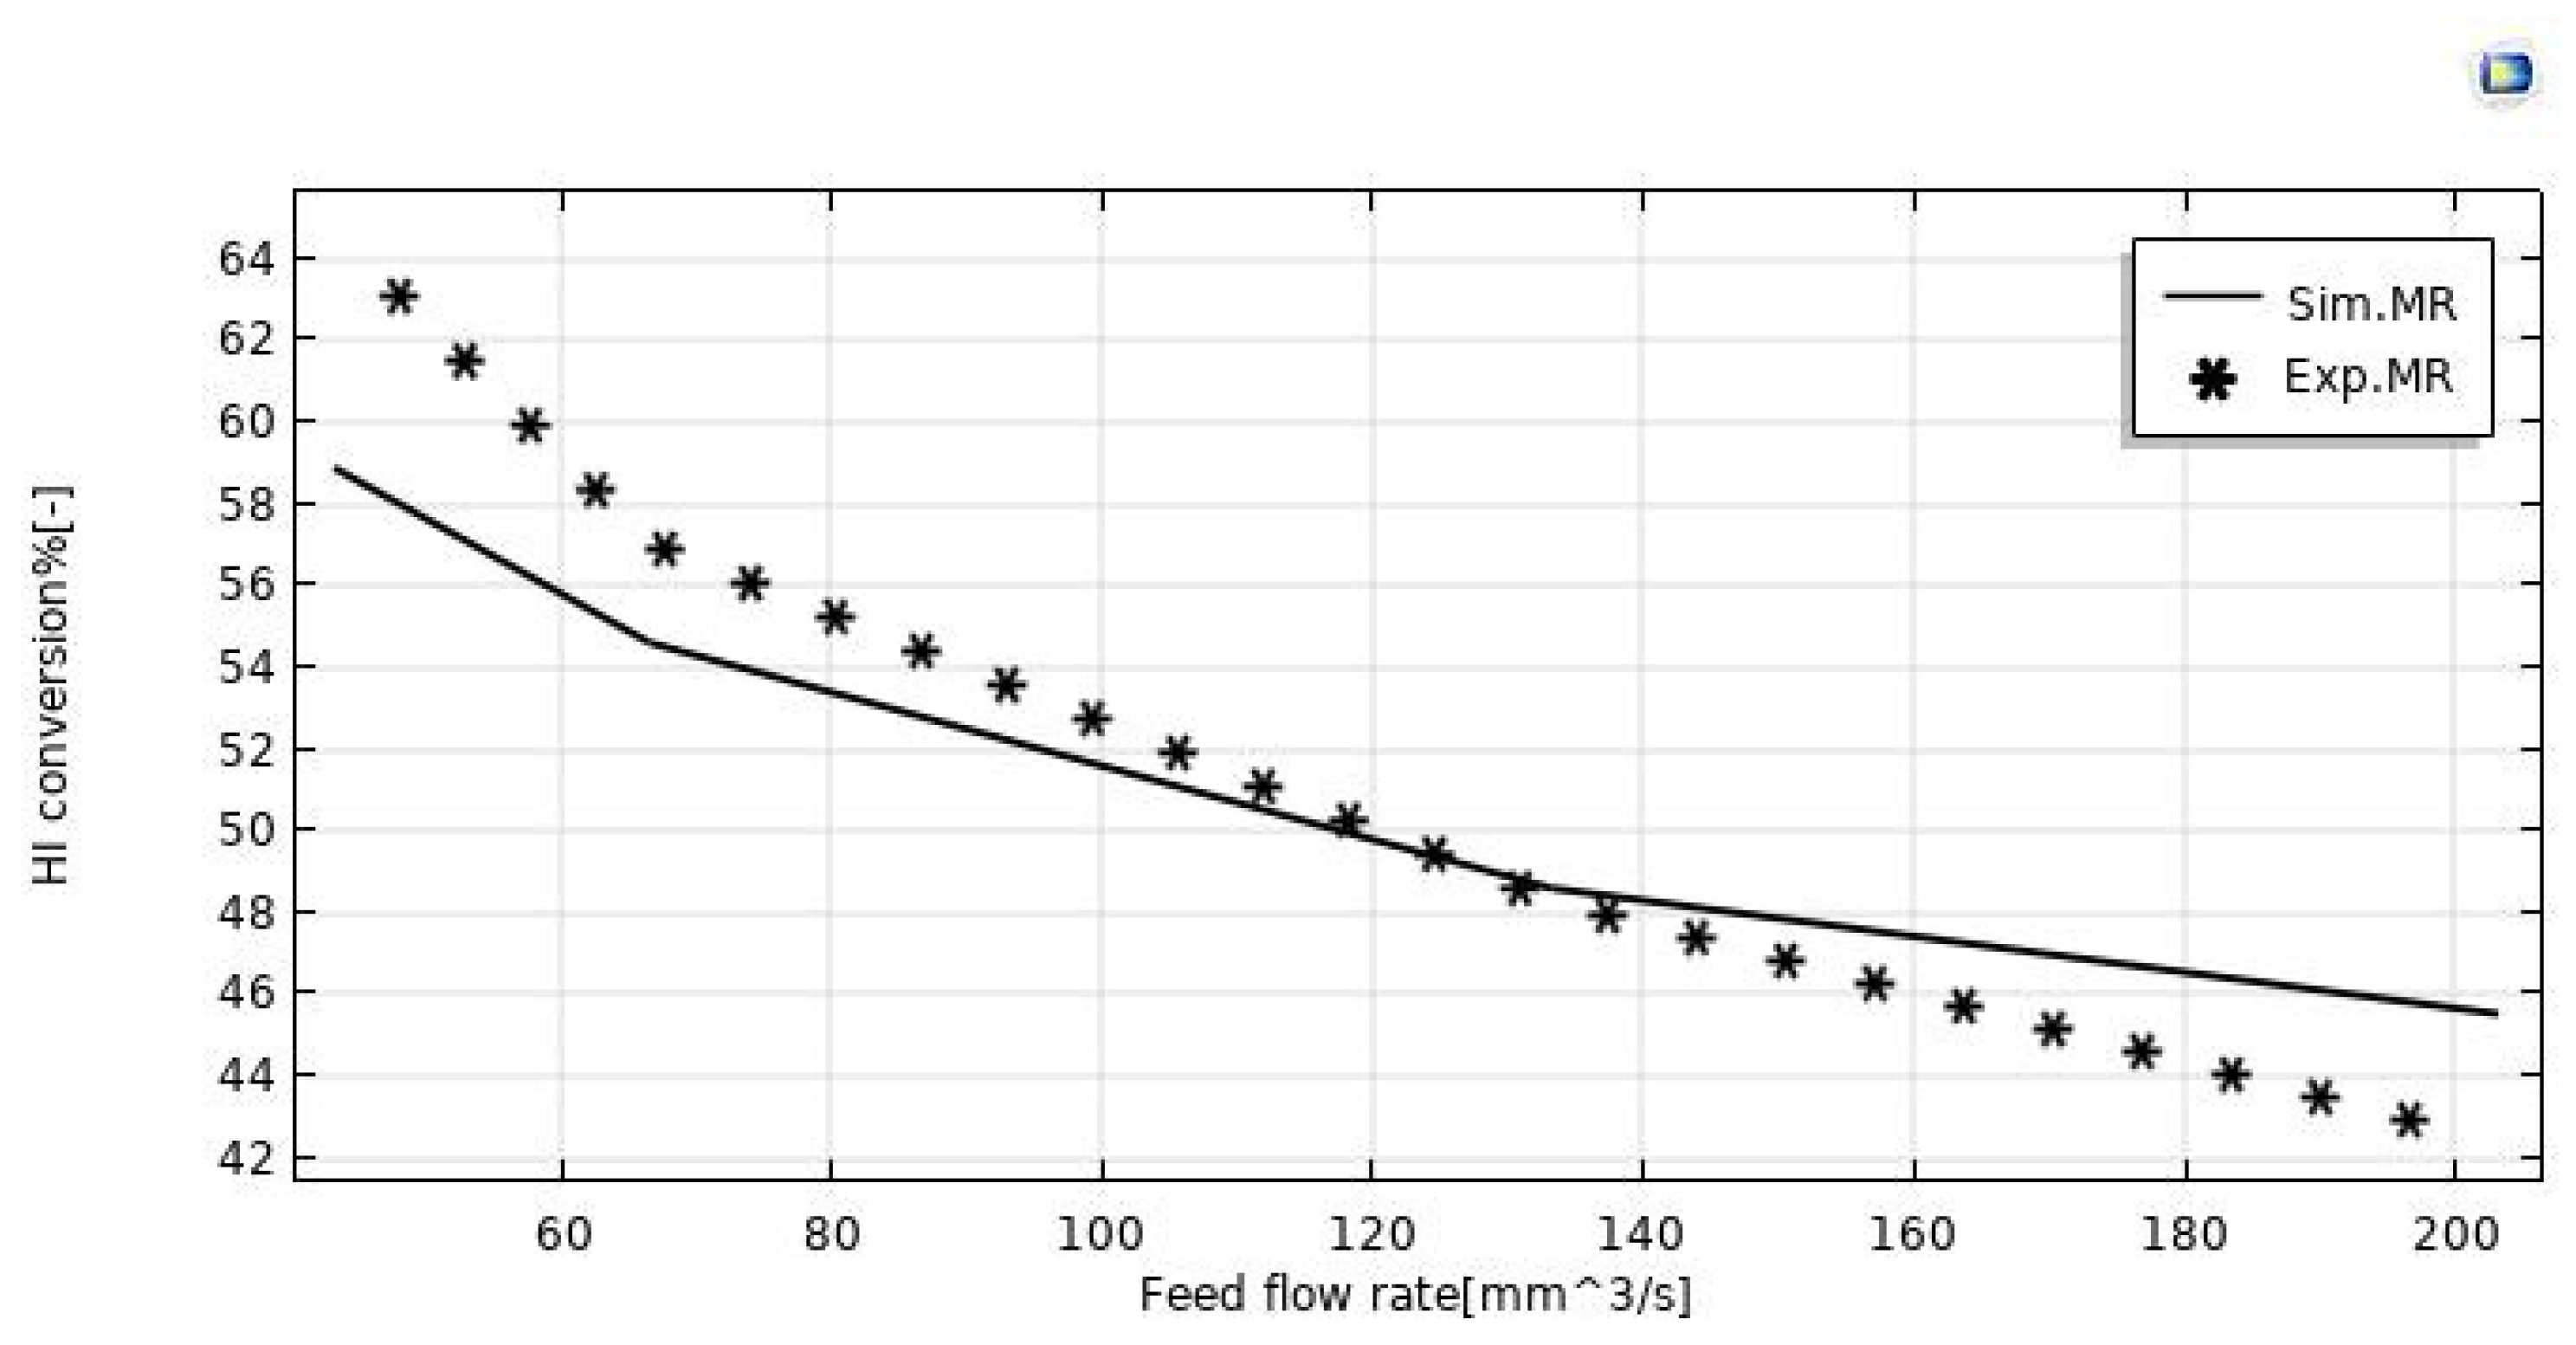
3.1. Model Validation

The model validation was done in terms of HI conversion to explain the behavior of the silica MR. The validity of the model outputs was confirmed in this case by experimental data taken from Myagmarjav et al. [25]. In this regard, Figure 3 shows both the experimental and modeling results of the HI conversion variations as a function of the feed flow rate during the HI decomposition reaction in the silica MR operated at 400 °C, with 1 bar and sweep gas flow rate equal to 333.33 mm3/s. By matching the numerical and experimental data, it was detected an error variation between 7% and 9%. The discrepancies were observed particularly for feed flow rates below 80 mm3/s and above 160 mm3/s.

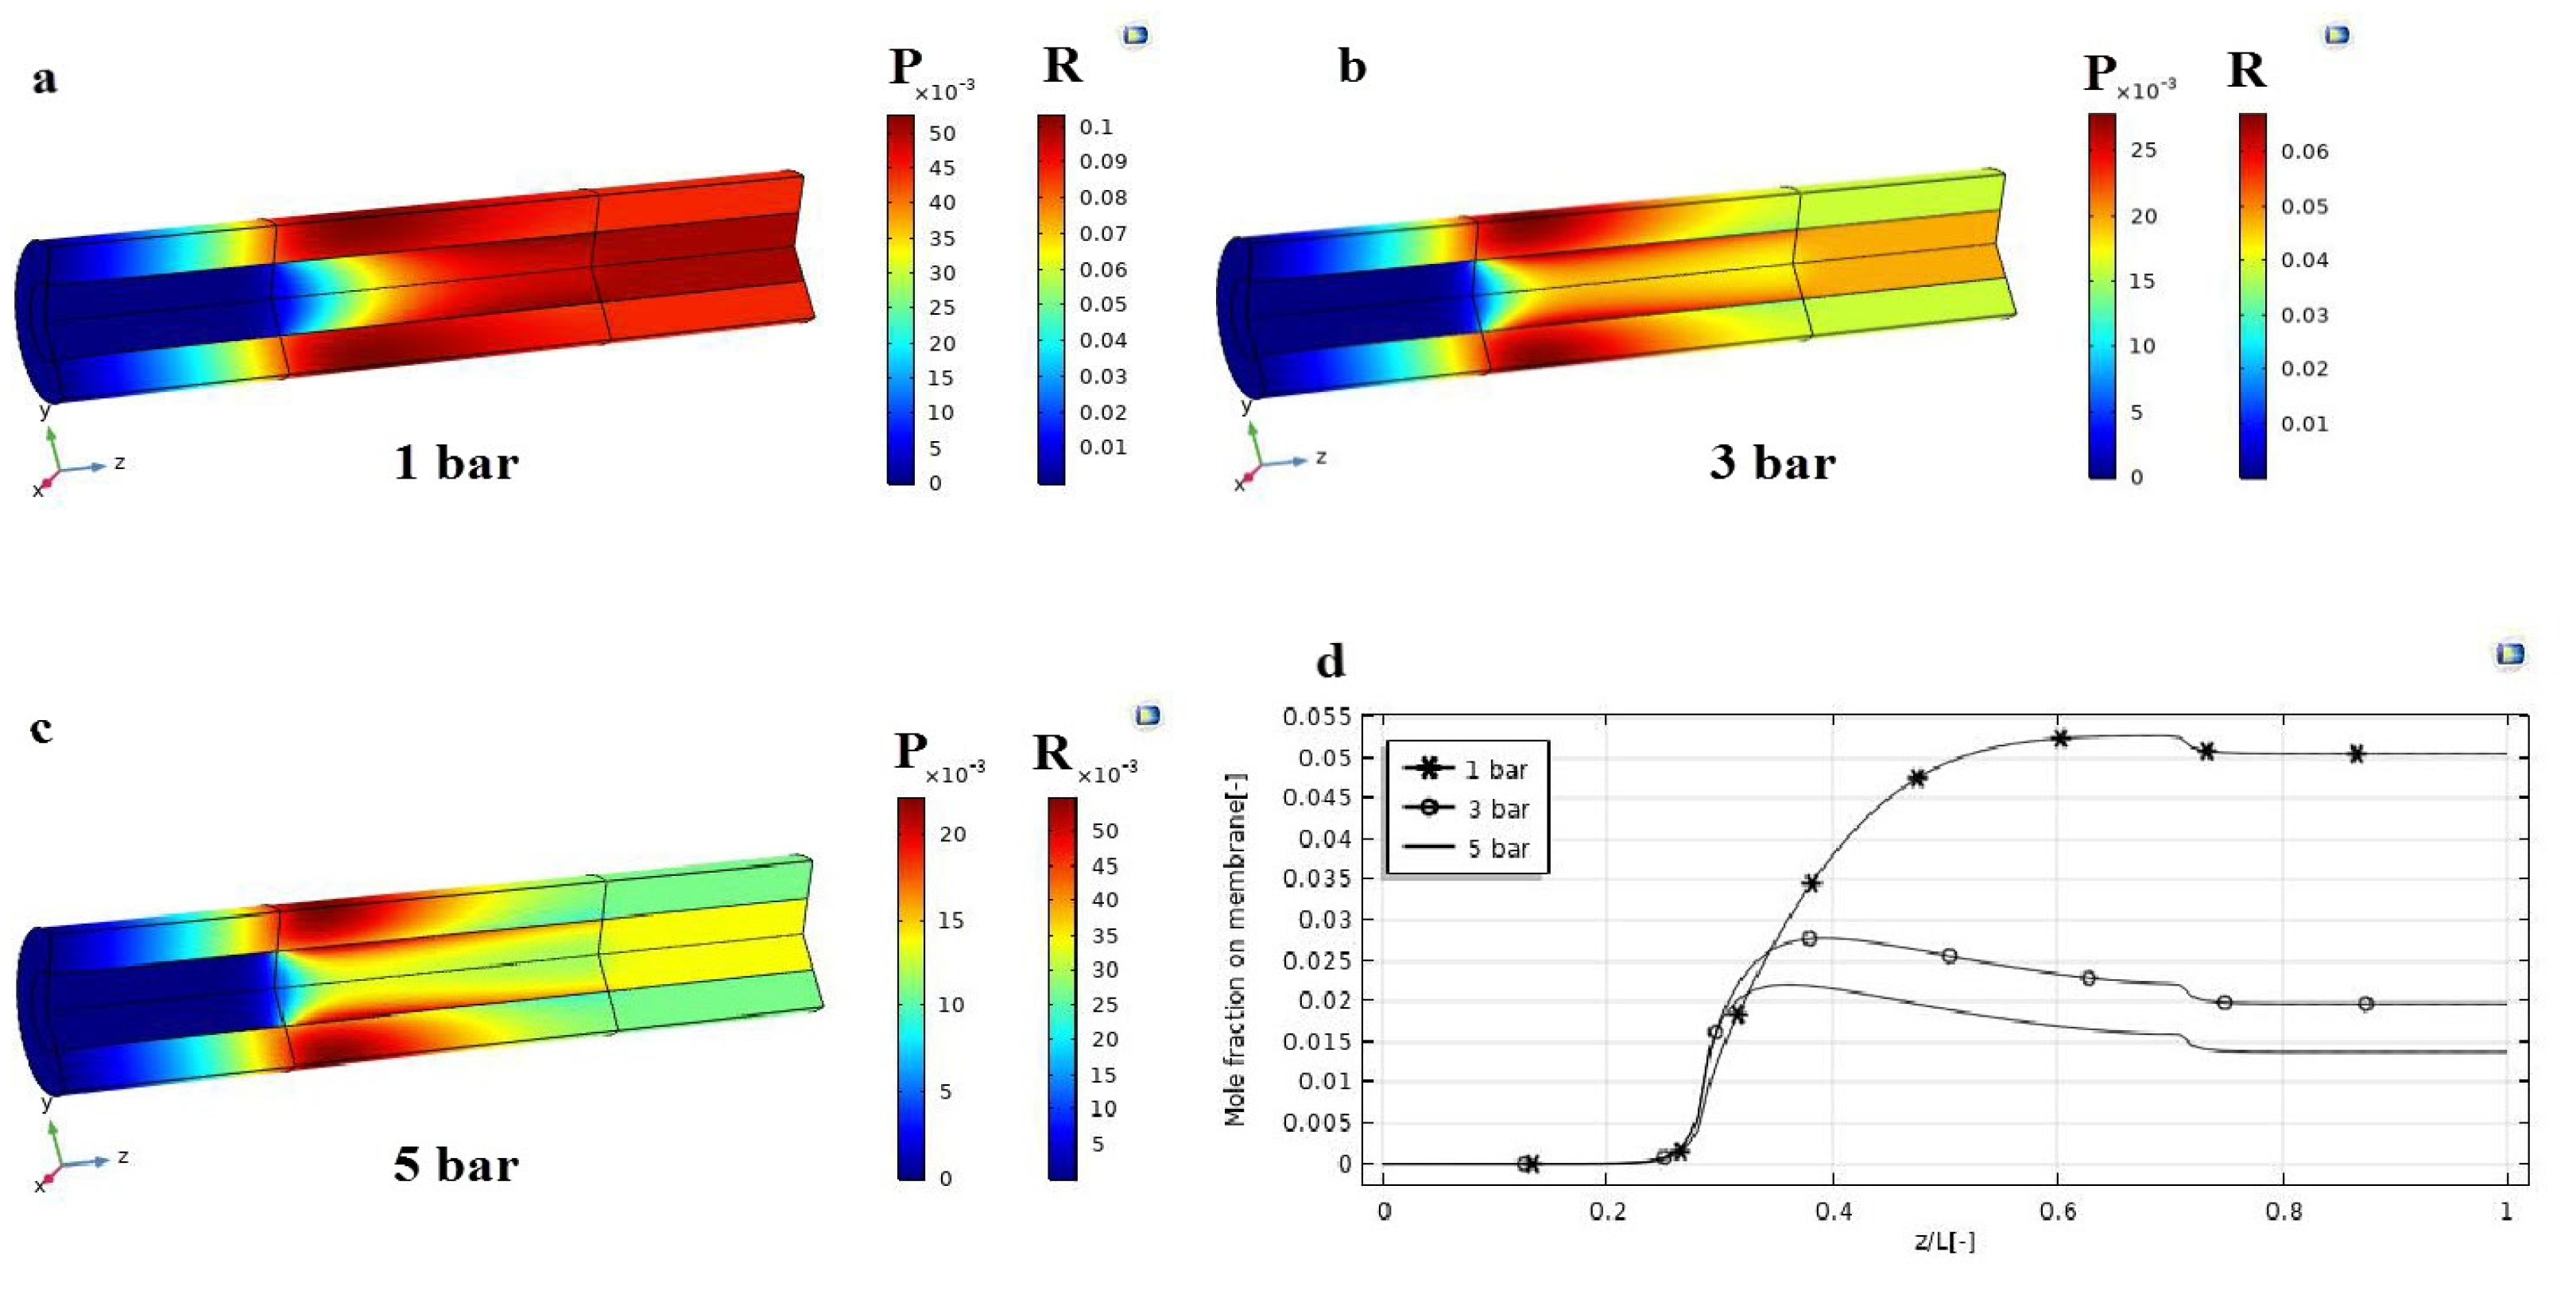
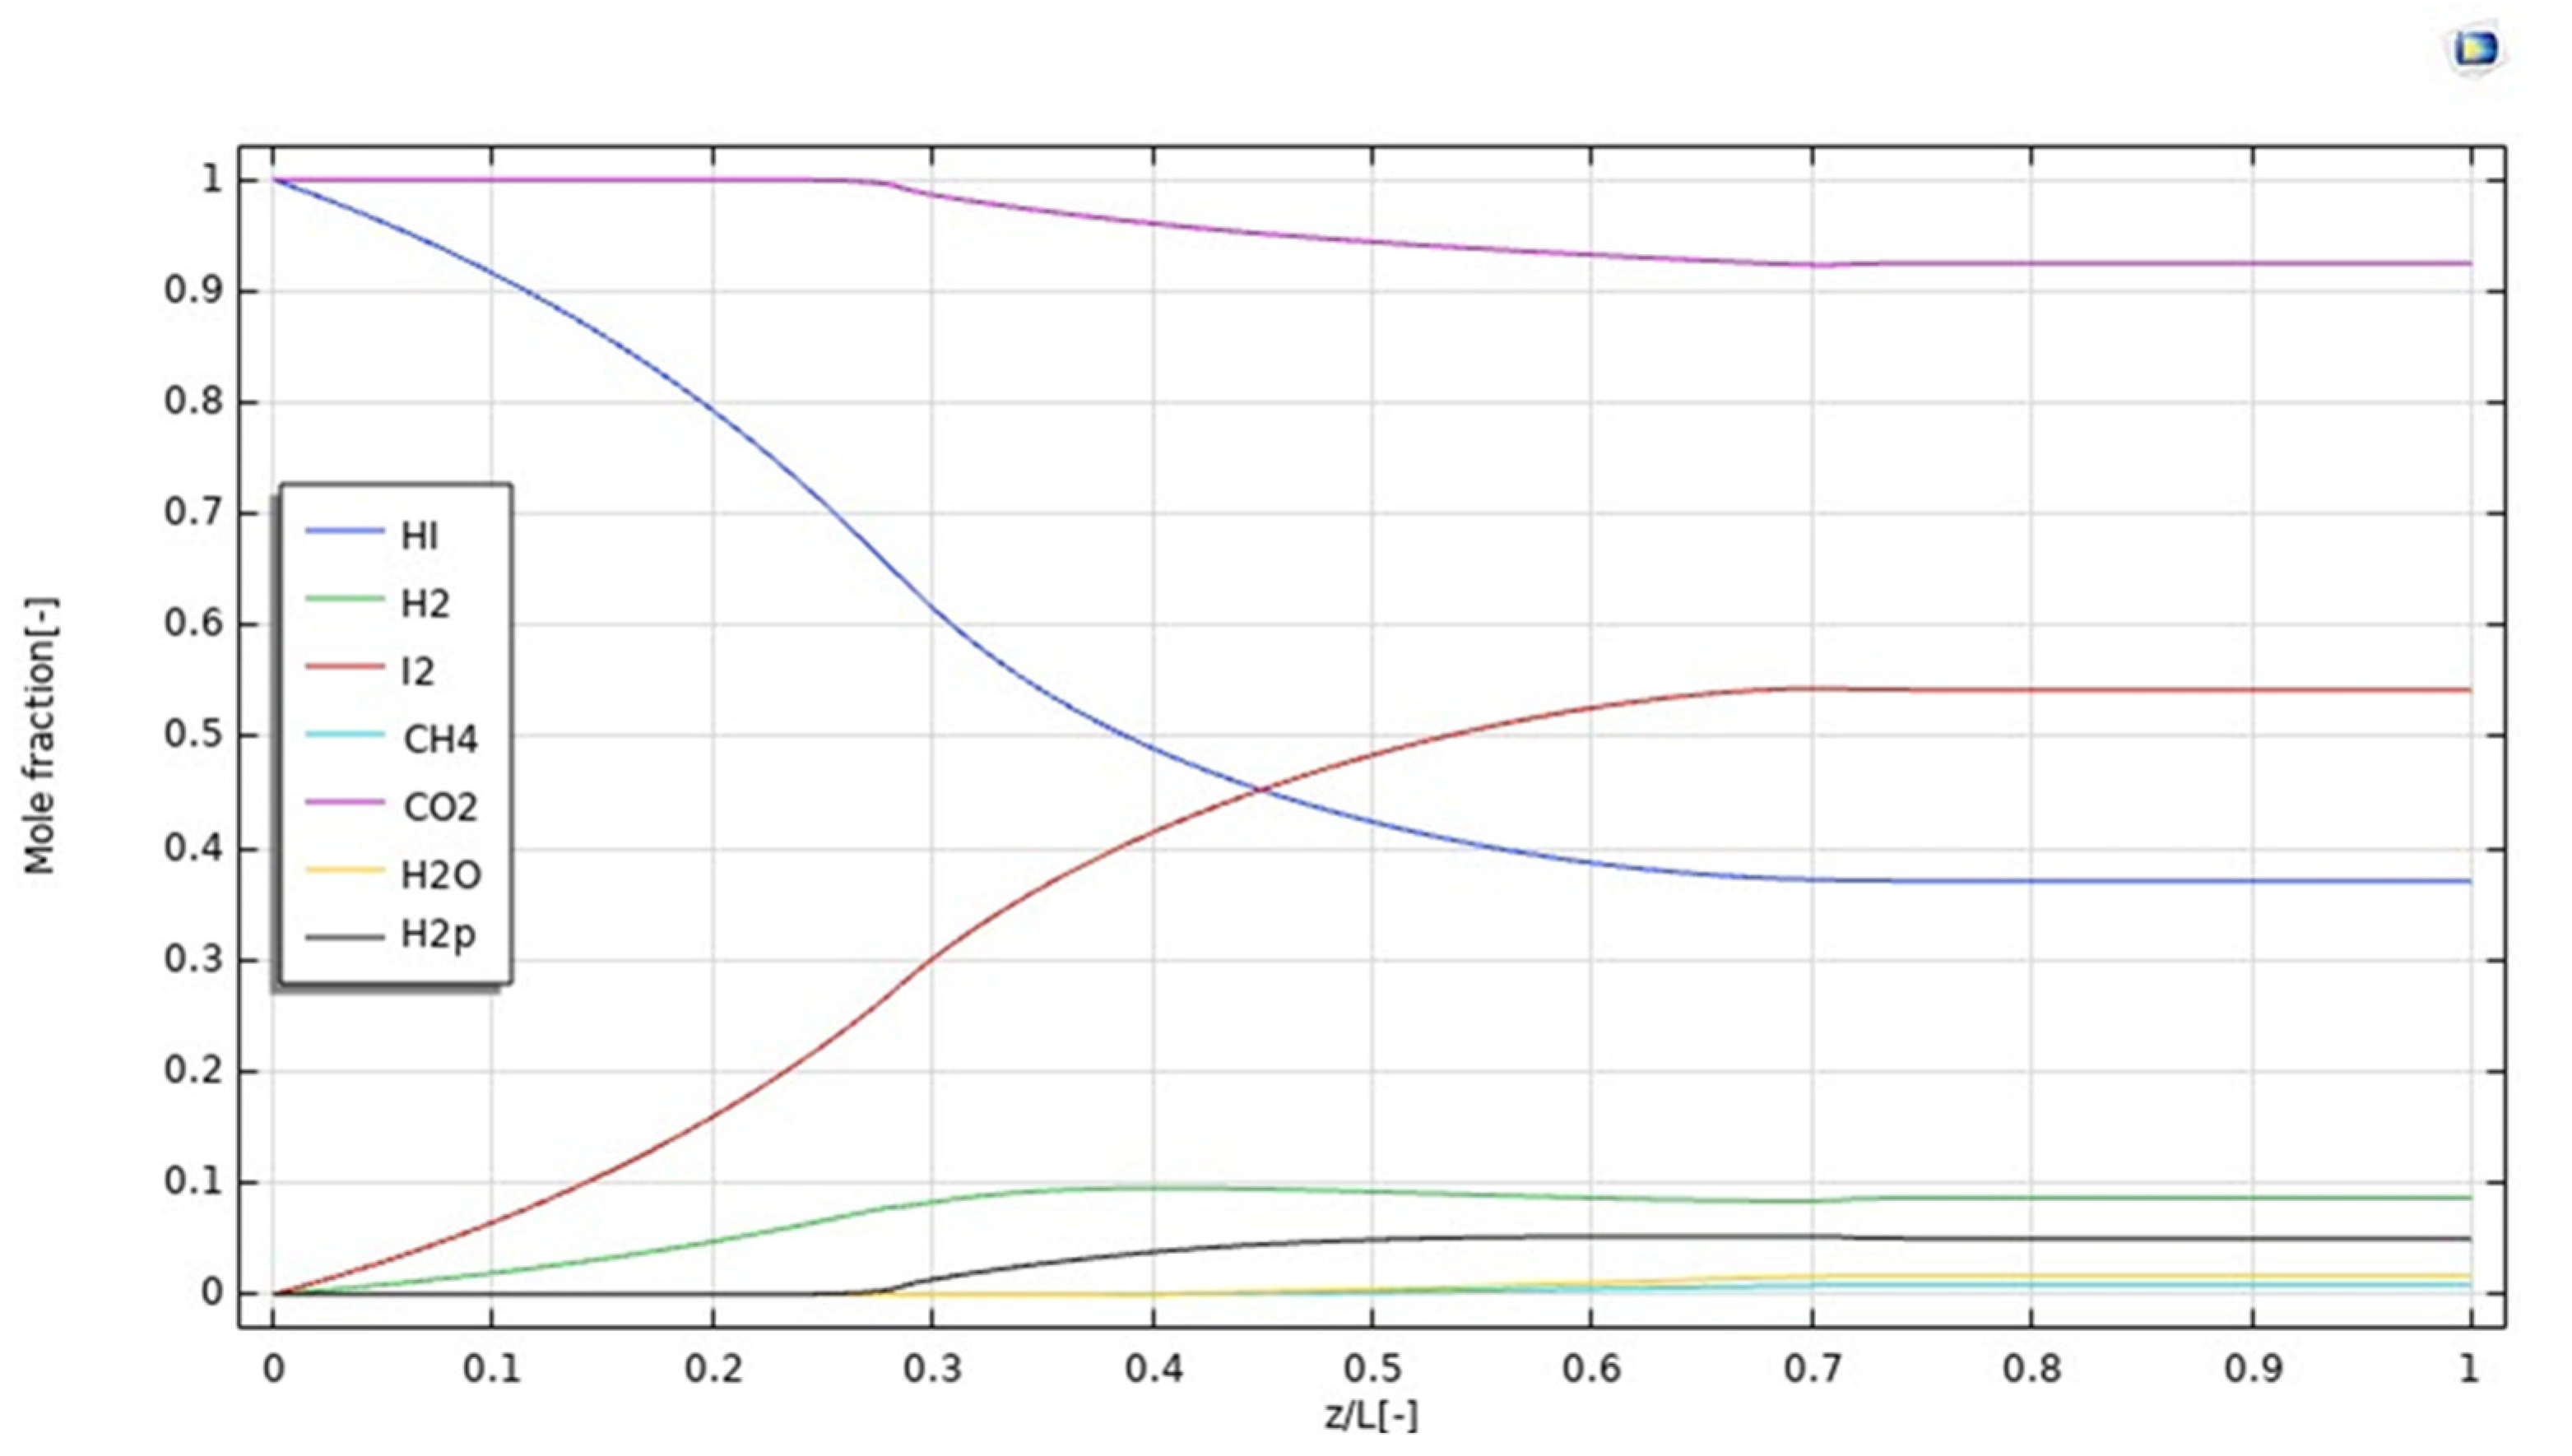
3.2. Influence of the Reaction Pressure on Component Distributions

During the HI decomposition reaction, an important analysis on the effects of the pressure difference (1, 3, and 5 bar) on the concentration contours of hydrogen in MMR was theoretically performed, as shown in Figure 4. In particular, the hydrogen molar fraction contours were analyzed in both axial and radial directions, as shown in Figure 4a–c. It is evident that, also at 1 bar as the pressure gradient, the hydrogen concentration in the retentate side is always above that in the permeate side along the z-axis, confirming that the driving force (expressed by the difference of hydrogen partial pressure across the membrane) acts continuously to guarantee the efficient permeation of hydrogen. This is responsible for a raise of the hydrogen molar fraction in the permeate side, as shown in Figure 4a. At a higher pressure difference, the hydrogen permeation driving force is enhanced, favoring a larger removal of hydrogen from the reaction towards the permeate side. This is responsible for the shift of the HI decomposition reaction towards the products, allowing consequently higher conversions. Figure 4b,c showed the change of the hydrogen mole fraction in z and r directions, both in the retentate and permeate sides. At lower pressure in the retentate side, where the HI decomposition reaction takes place, hydrogen is poorly removed from the reaction towards the permeate side due to a reduced driving force. This is why the profile of the hydrogen concentration, shown in Figure 4a, looks quite uniform with a slow reduction along the z-axis in both sides. Consequently, the variation of the radial hydrogen concentration is smooth. On the other hand, the higher the pressure, the higher the hydrogen concentration gradient along the z-axis, because hydrogen is removed as it is produced, Figure 4d. Hence, the hydrogen concentration in the permeate side is higher near the membrane interface; then, it decreases radially as soon as it reacts with CO2 into CH4. Along the z direction, the radial profile becomes smoother, achieving a constant gradient due the constant hydrogen permeation driving force.
Furthermore, Figure 5 illustrates the simulation of the molar fraction distribution of reactants and products along the z-axis at 400 °C, 1 bar, 20 mm3/s as the feed flow rate, and 333.33 mm3/s as the sweep gas flow rate. In particular, it is worth of noting that all the molar fractions assume a constant value at z/L > 0.7.
In Figure 6, the H2 permeating flux is plotted as a function of z/L. It increases up to z = 0.4, according to the increasing trend of H2 production due to the HI decomposition reaction, which is particularly relevant in the first part of the MMR, as evidenced by the pronounced decreasing trend of the HI molar fraction in Figure 5. In this part of the MMR, the H2 permeation driving force is hence high because no H2 is present in the permeate side and, as soon as it is collected, it is converted with CO2 into CH4, due to the methanation reaction. At 0.4 < z/L < 0.7, the molar fraction of HI assumes a slight decreasing trend, meaning that the generation of H2 is not consistent, such as at z/L < 0.4. Therefore, as the molar fractions trends of H2 in the retentate and permeate sides, and the unconverted CO2 and formed CH4 in the permeate side become constant, the H2 permeating flux slightly decreases, accordingly. Nevertheless, at z/L > 0.7 the molar fraction trend of HI in the retentate side becomes constant, meaning the further H2 is not produced and, then, the H2 permeating flux drops down rapidly.

3.3. Assessment of Operating Parameters Effects

The performance of both the MMR and MR were investigated in terms of HI conversion and hydrogen recovery under various operating conditions, analyzing the effects of the reaction pressure and feed and sweep gas flow rate variations, as reported in Table 2.

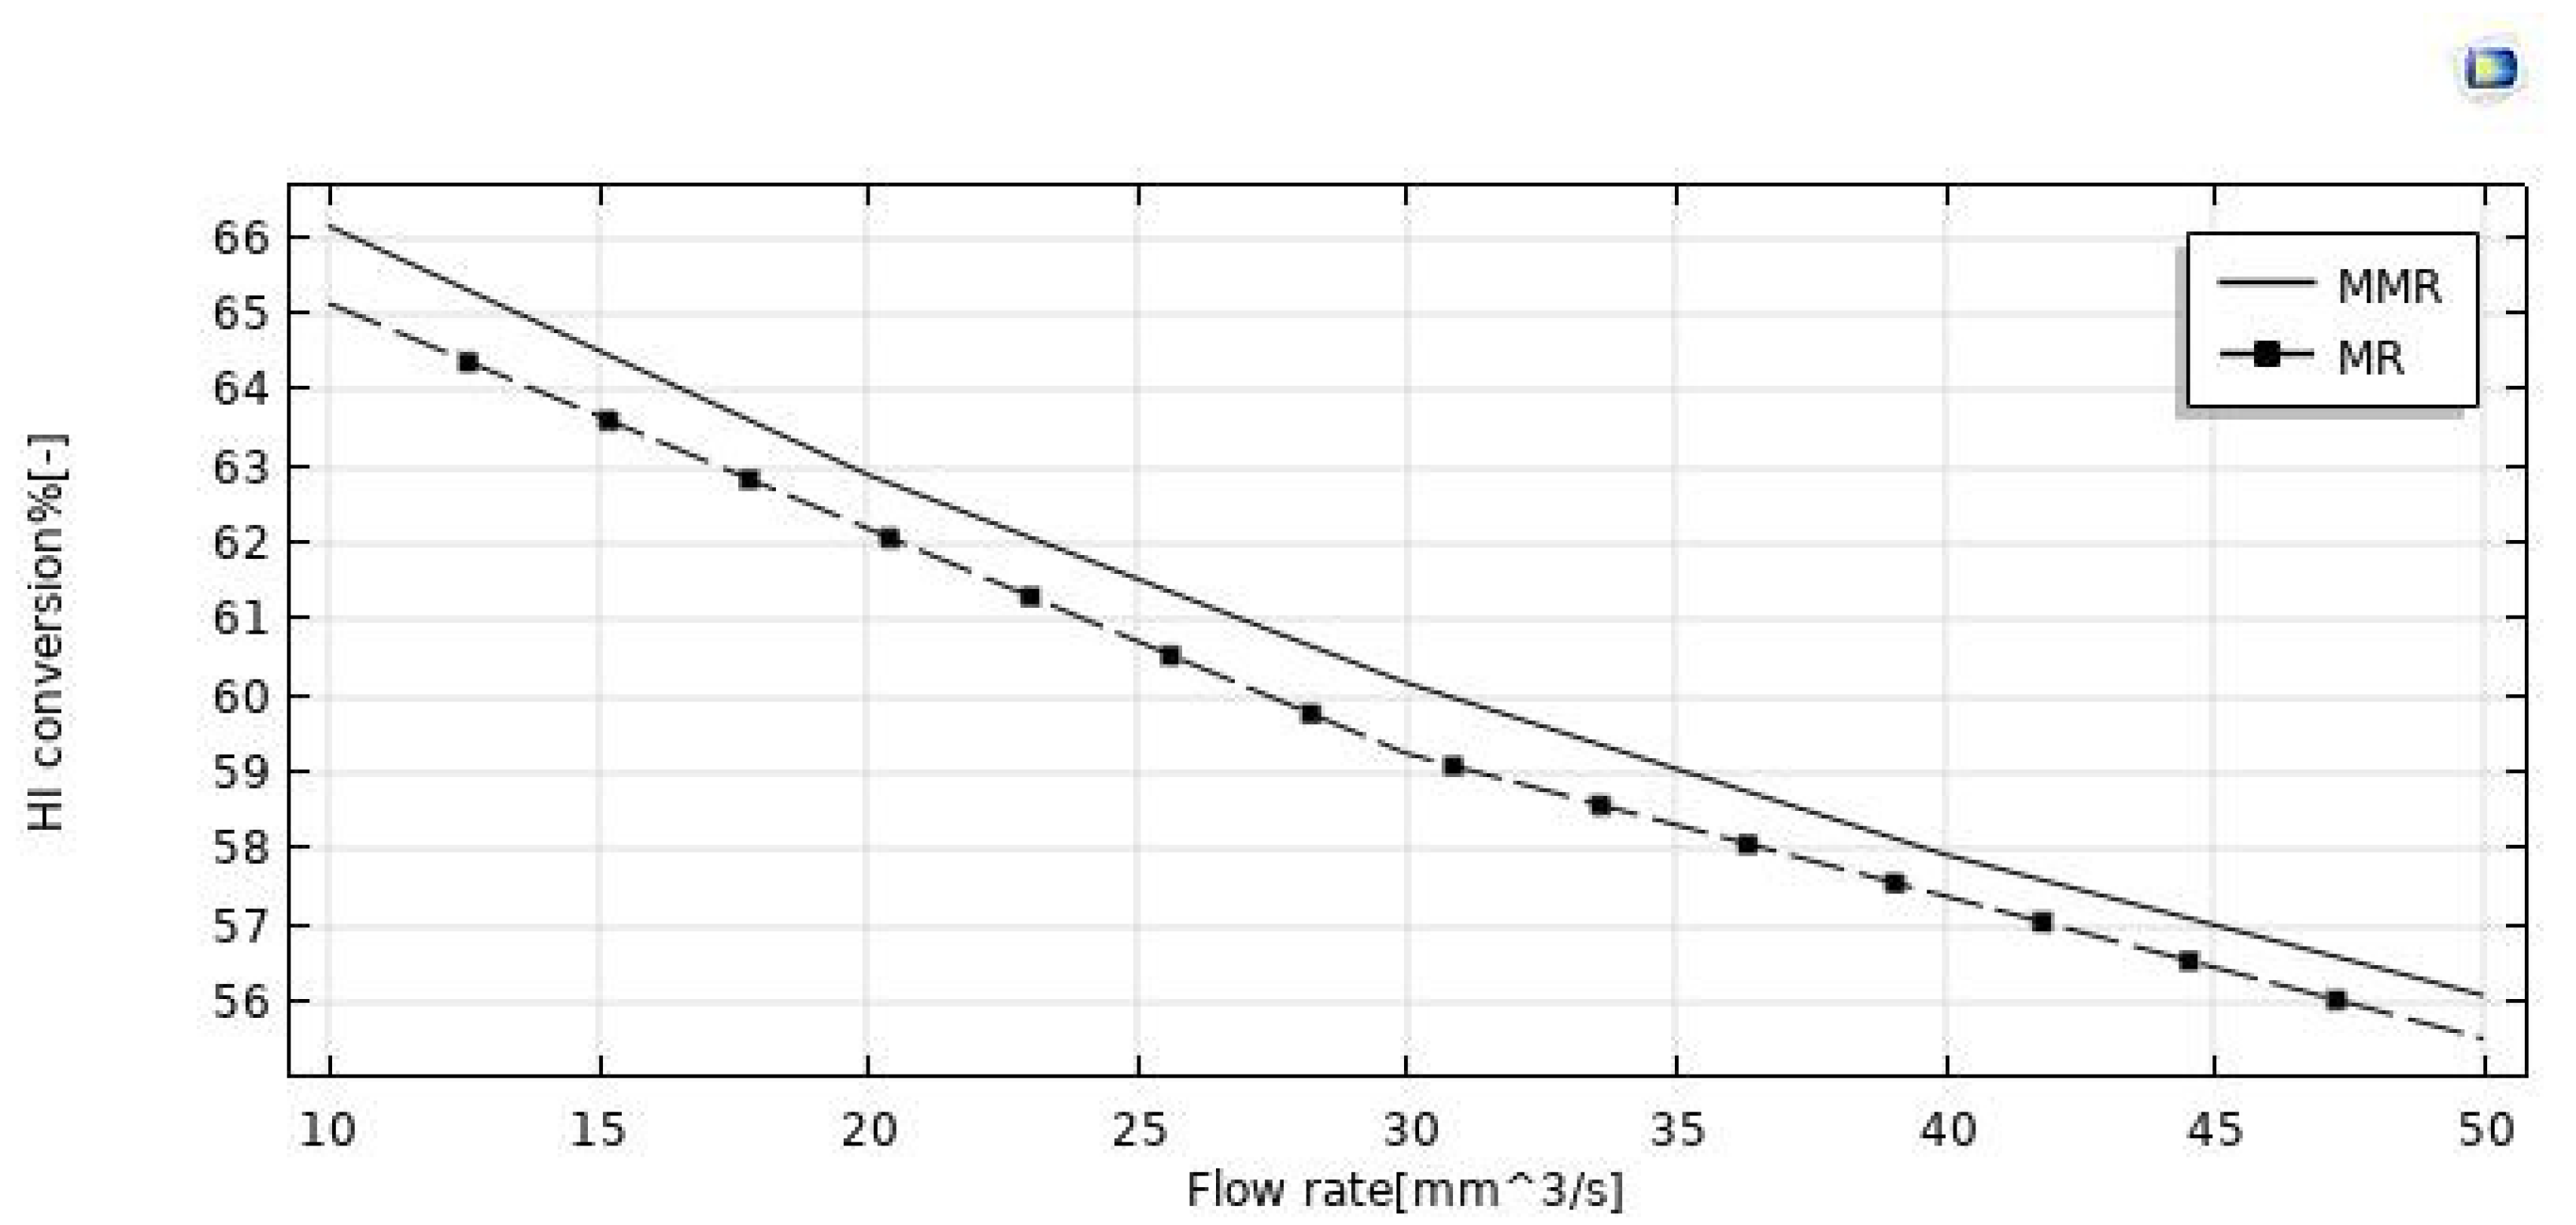
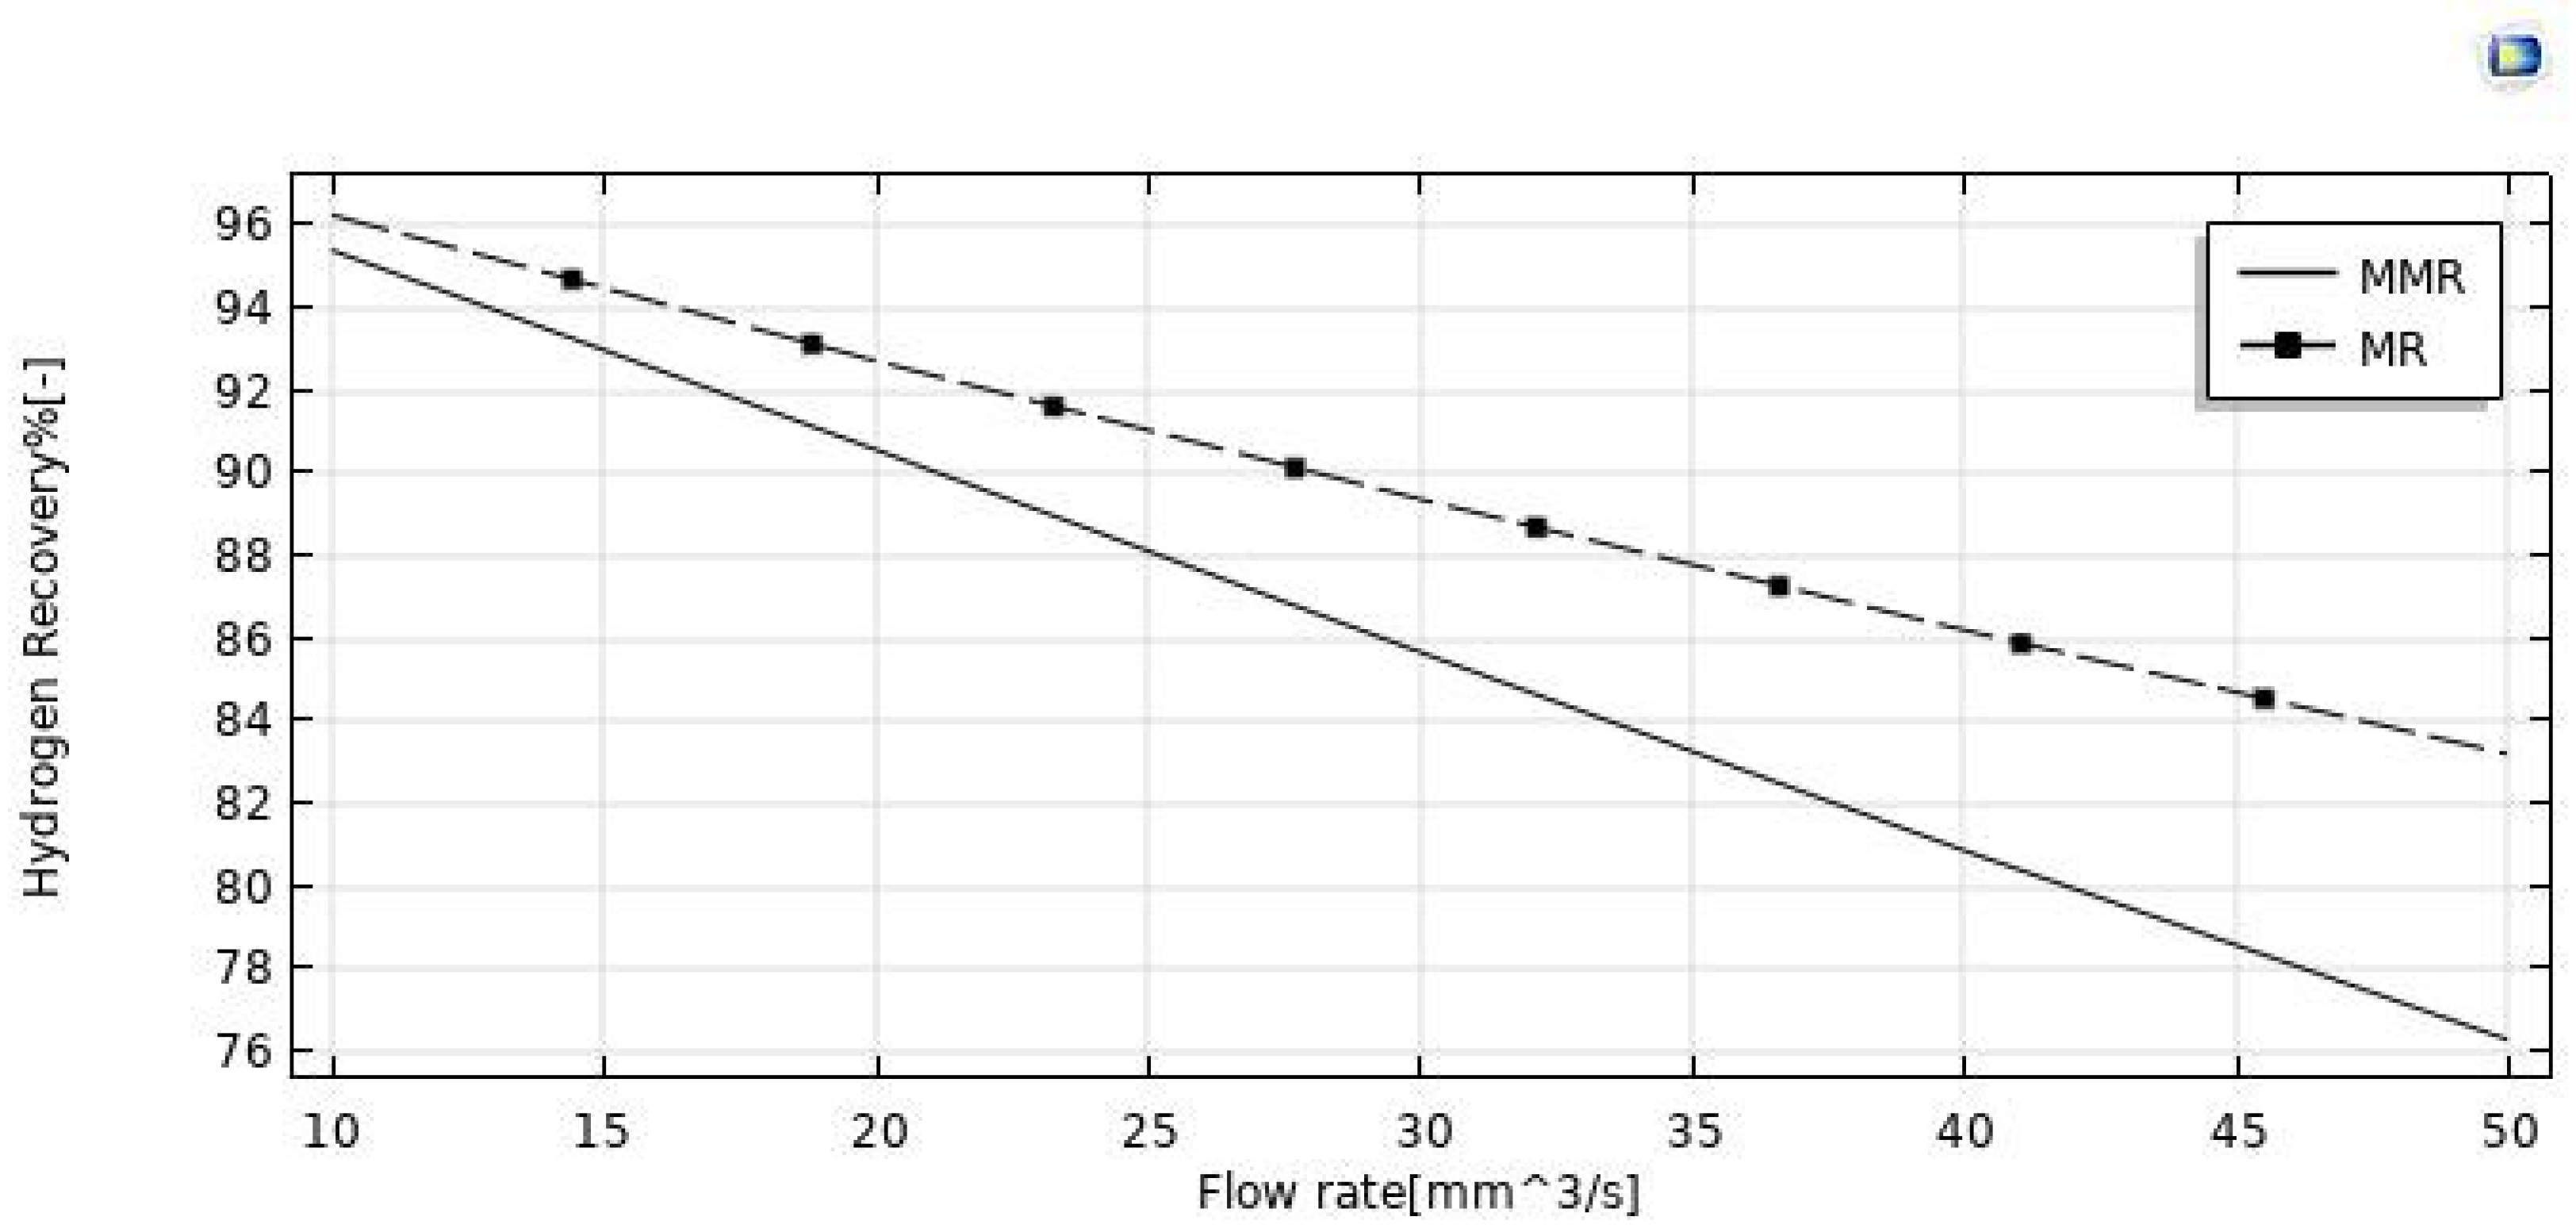
3.3.1. Effect of Feed Flow Rate

The effect of the feed flow rate on the HI conversion was theoretically evaluated at T = 400 °C, reaction pressure = 1 bar, sweep gas flow rate = 333.33 mm3/s, and the modeling results between the MR and MMR were compared in Figure 5. By increasing the feed flow rate, HI conversion decreased in both MR configurations, as a consequence of a decreased contact time between the reactants and the catalyst (higher space velocity). Comparing the HI conversions of the two MR configurations, the MR demonstrated lower values in the whole feed flow rates range investigated. Indeed, the hydrogen removed for permeation through the membrane in the MMR was partially transformed in the CO2 methanation reaction, resulting in a hydrogen permeation driving force higher than that of the MR. Figure 7 shows the hydrogen recovery as a function of the feed flow rate for both the MR and the MMR. It decreased from ~95.5% to 76% in the MMR and from 96% to 83.5% in the MR. The lower hydrogen recovery values in the MMR with respect to the MR is due to the permeated hydrogen consumption in the MMR permeate side during the CO2 methanation reaction.

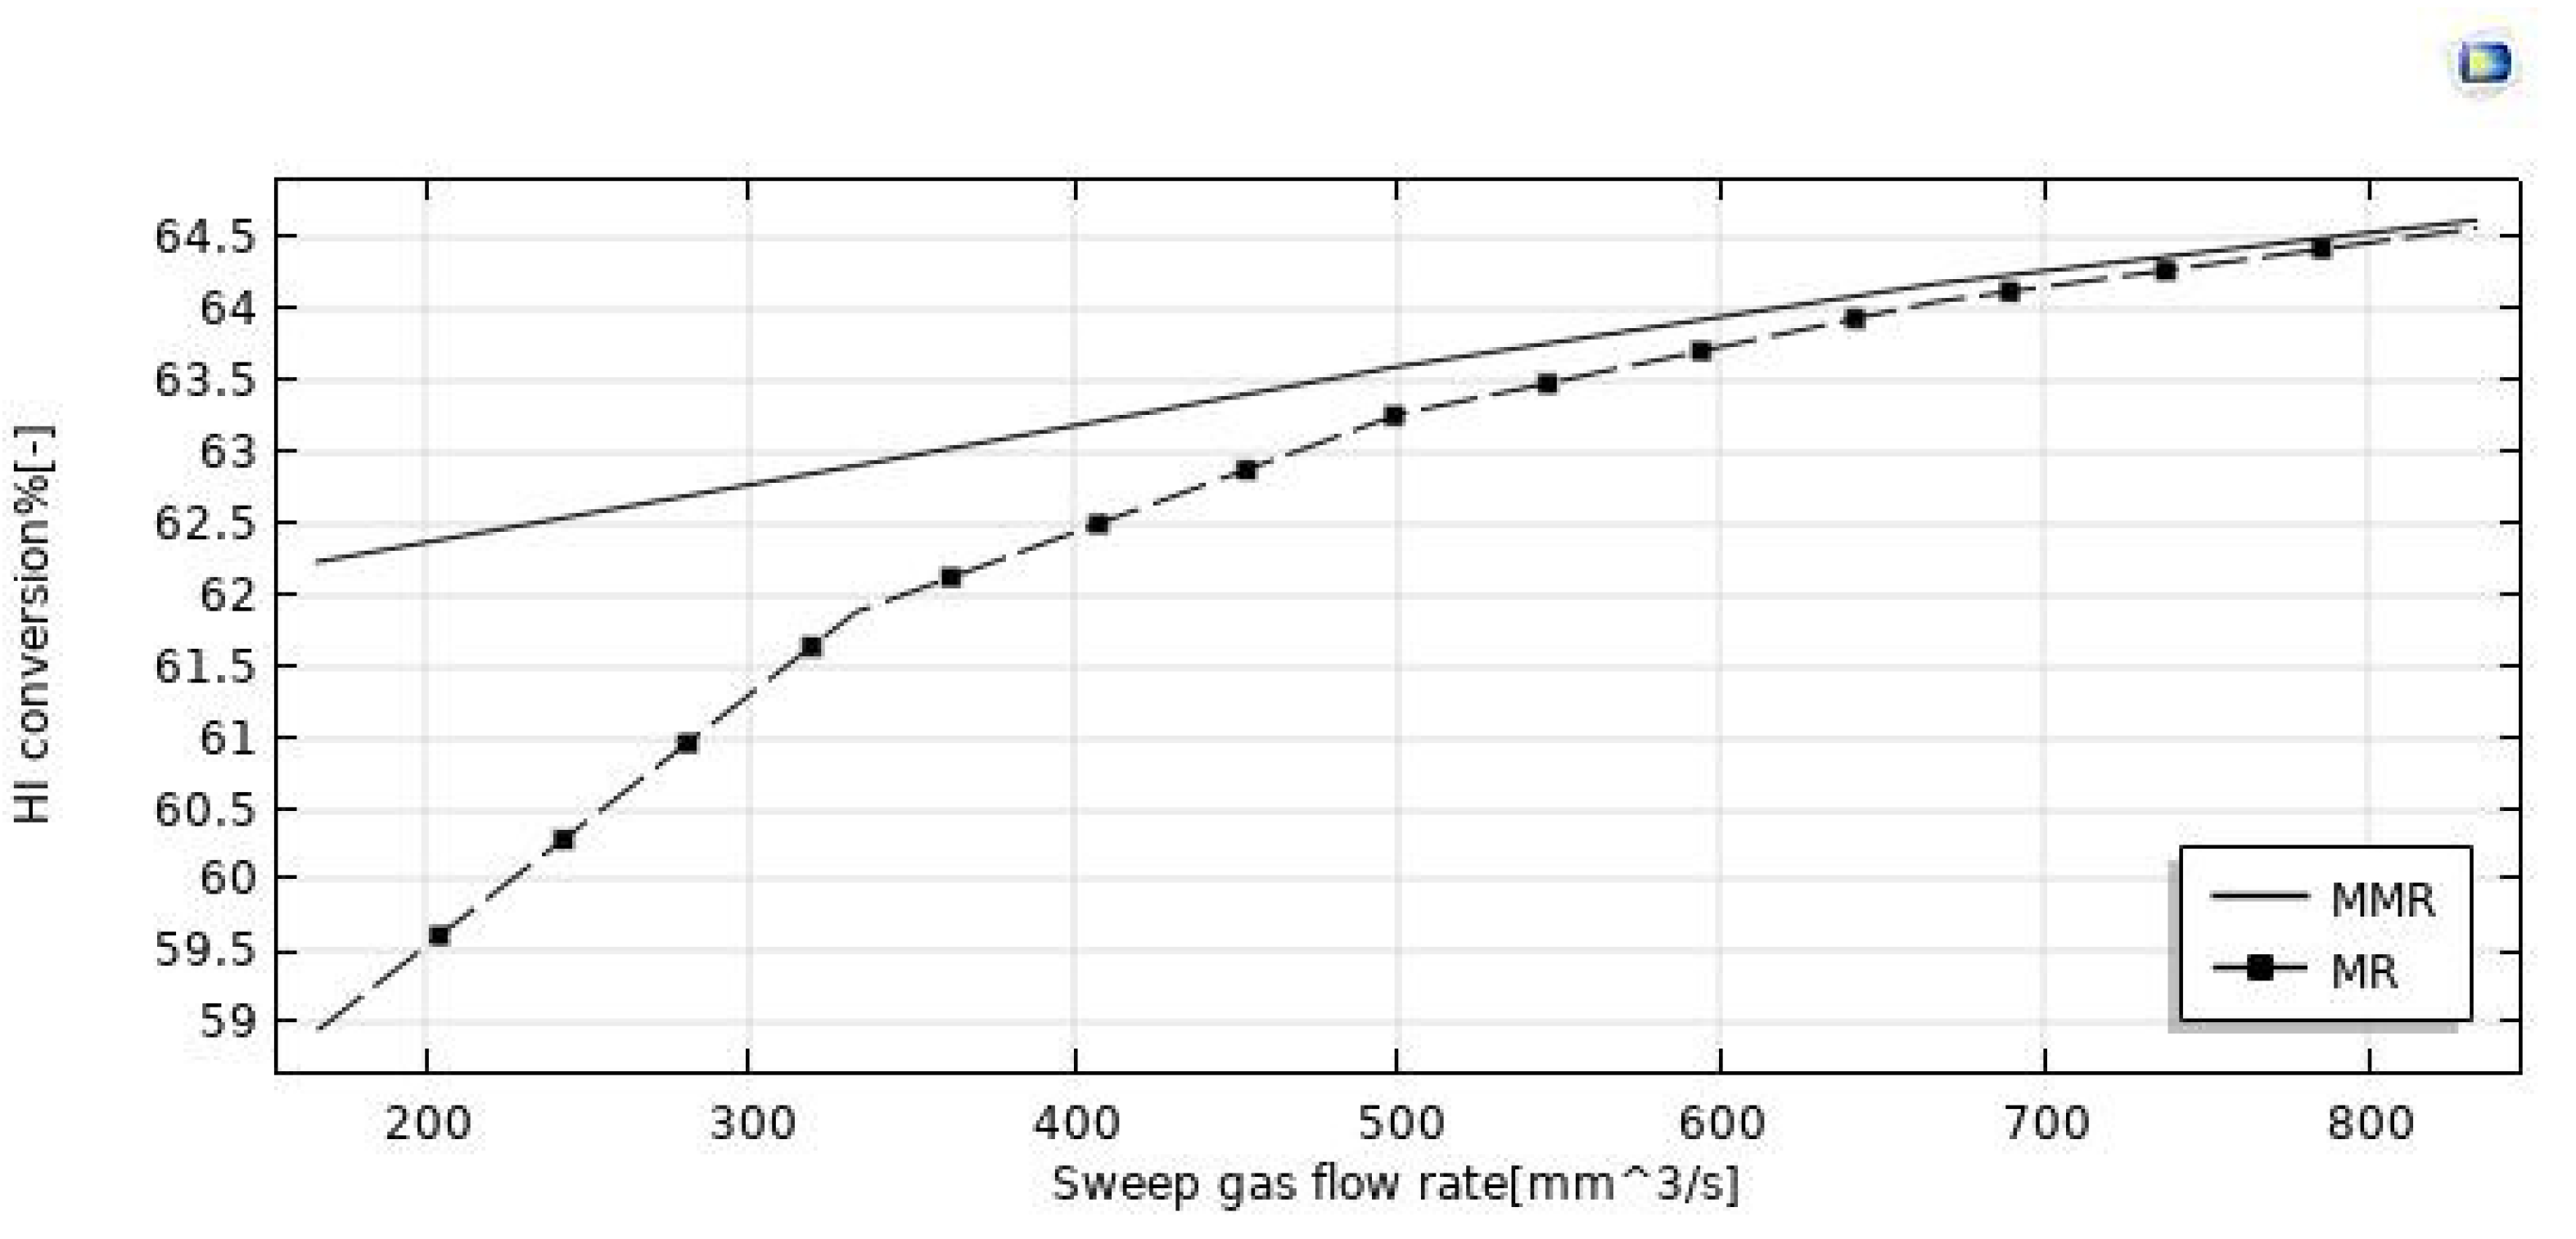
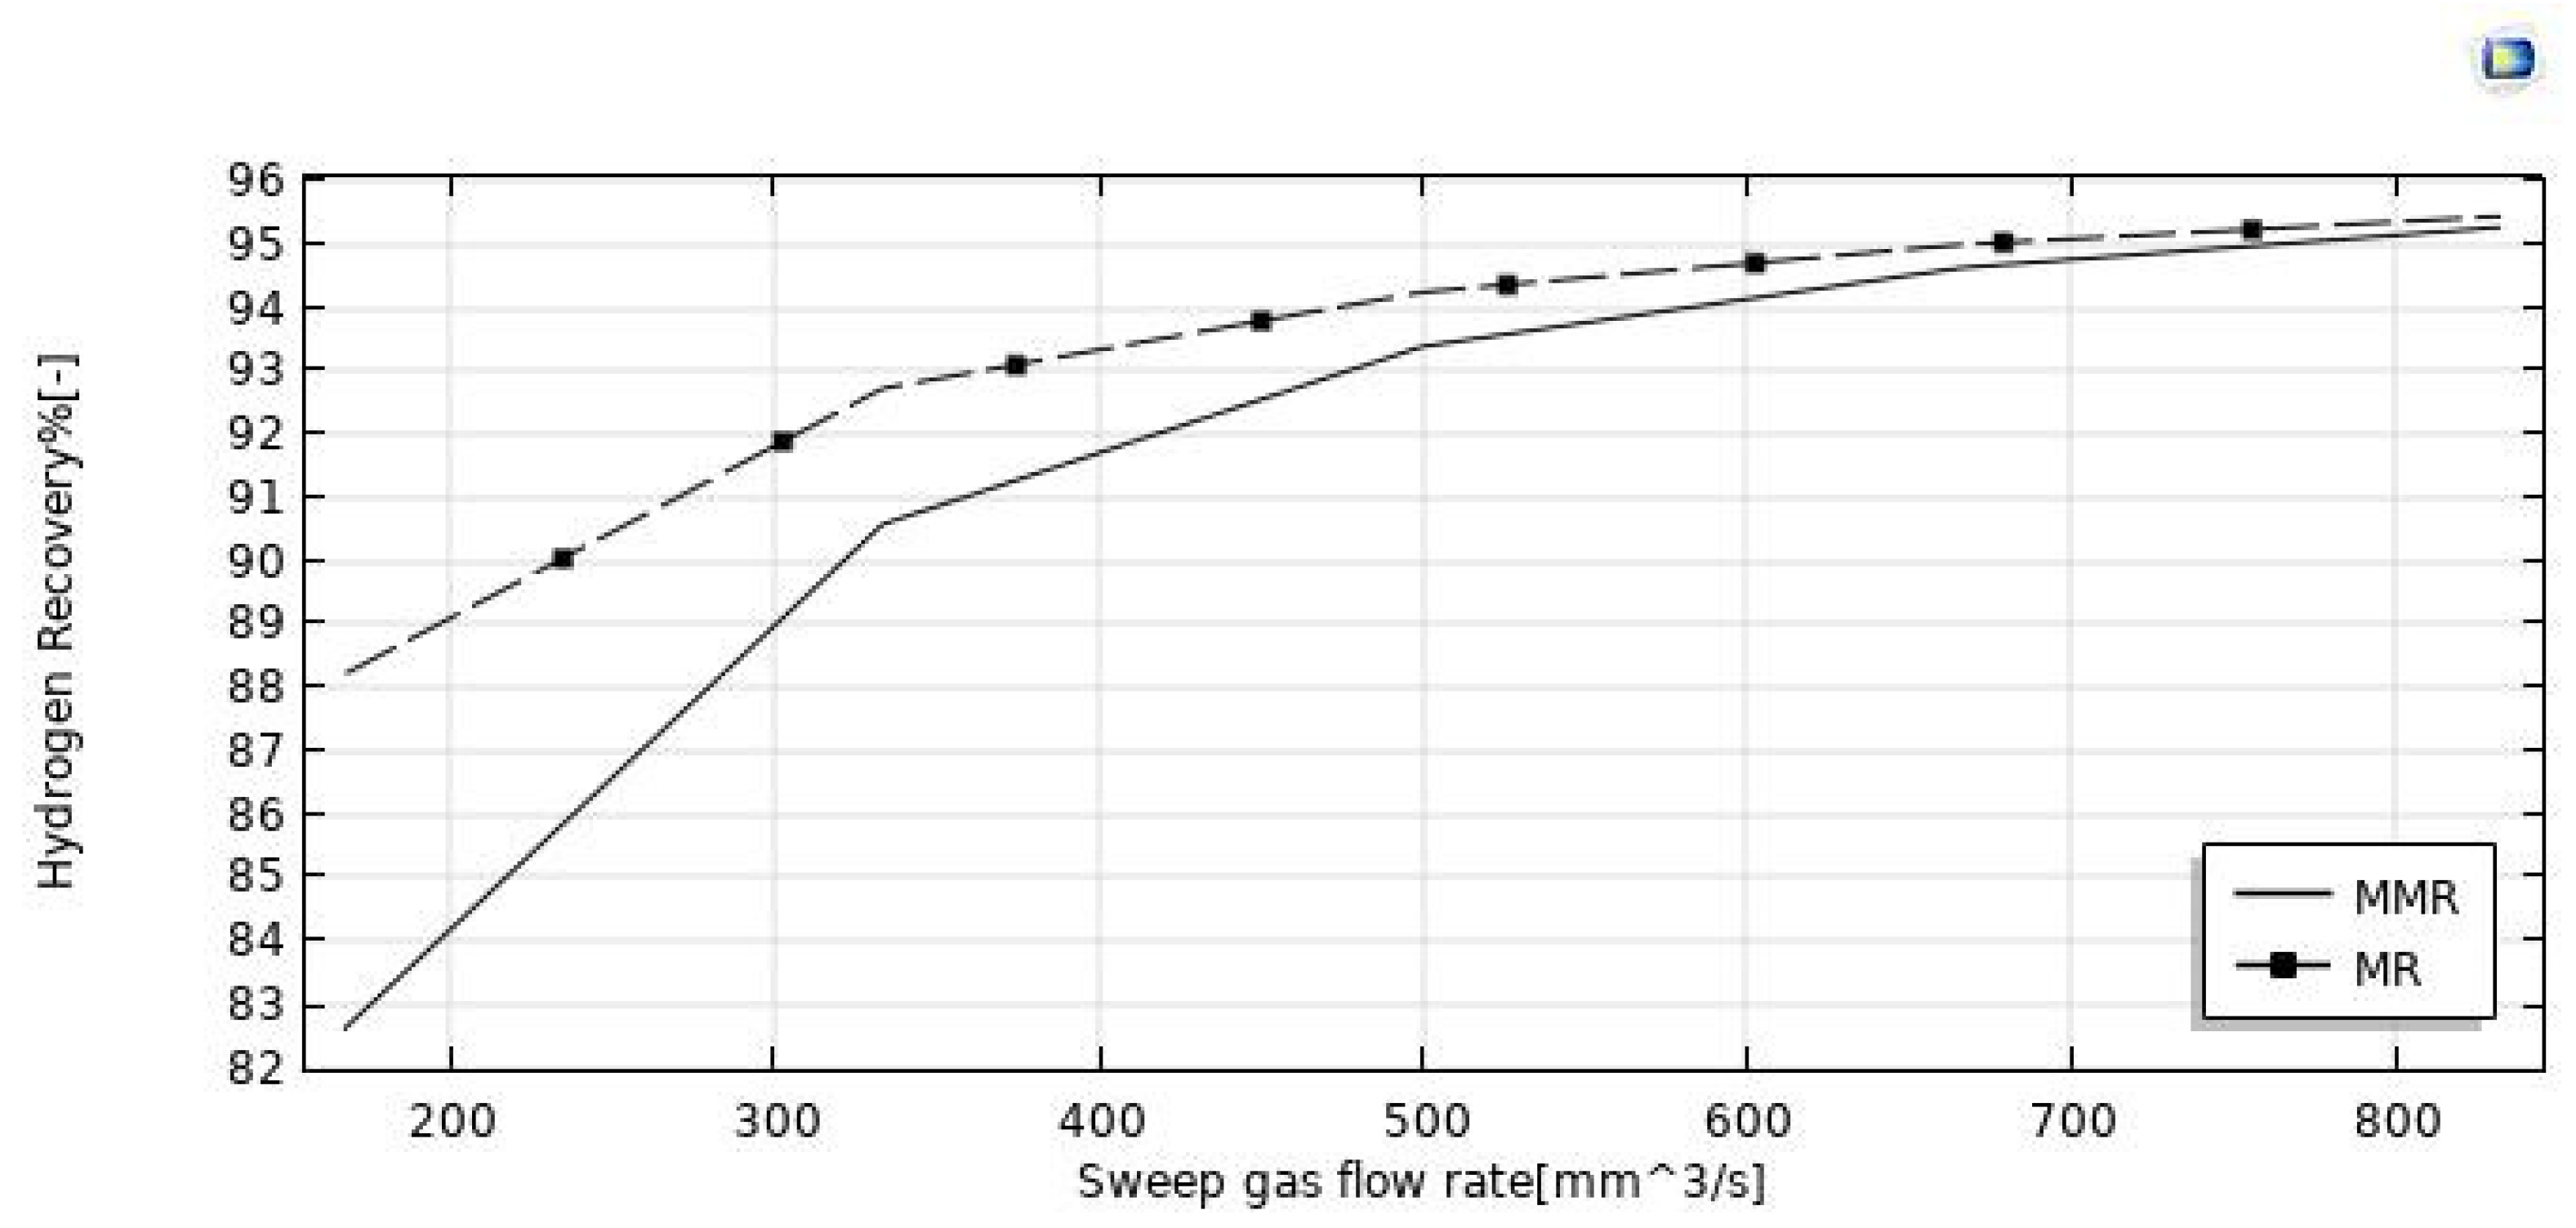
3.3.2. Effect of Sweep Gas Flow Rate

The simulations reported in Figure 8 illustrate the increase of HI conversion as the sweep-gas flow rate increases in both the MMR and MR. It may be attributed to the effect of the H2 removal from the reaction side towards the permeate side for permeation through the membrane. Indeed, by increasing the sweep gas flow rate, HI conversion and hydrogen recovery (Figure 9 and Figure 10) were enhanced. It may be attributed to the depletion of the hydrogen partial pressure in the permeate side. This induced an increment of the hydrogen partial pressure difference across the membrane, enhancing the hydrogen permeating flux. Meanwhile, it allowed a larger amount of hydrogen to be collected in the permeate side, with a consequently more pronounced shift effect on the HI decomposition reaction (higher conversions) and a higher hydrogen recovery. In the MMR, the depletion of the hydrogen concentration in the permeate side was greater due to the utilization of hydrogen during the CO2 methanation reaction. This involved a higher hydrogen permeation driving force than that present in the MR, and consequently higher conversions were reached. Nevertheless, at a sweep gas flow rate superior to 700 mm3/s, no difference was observed between the MMR and MR systems because the depletion of the hydrogen concentration in the permeate side became irrelevant. Obtaining better performance by increasing the sweep gas flow rate is not very attractive, because higher sweep gas flow rates mean higher costs.

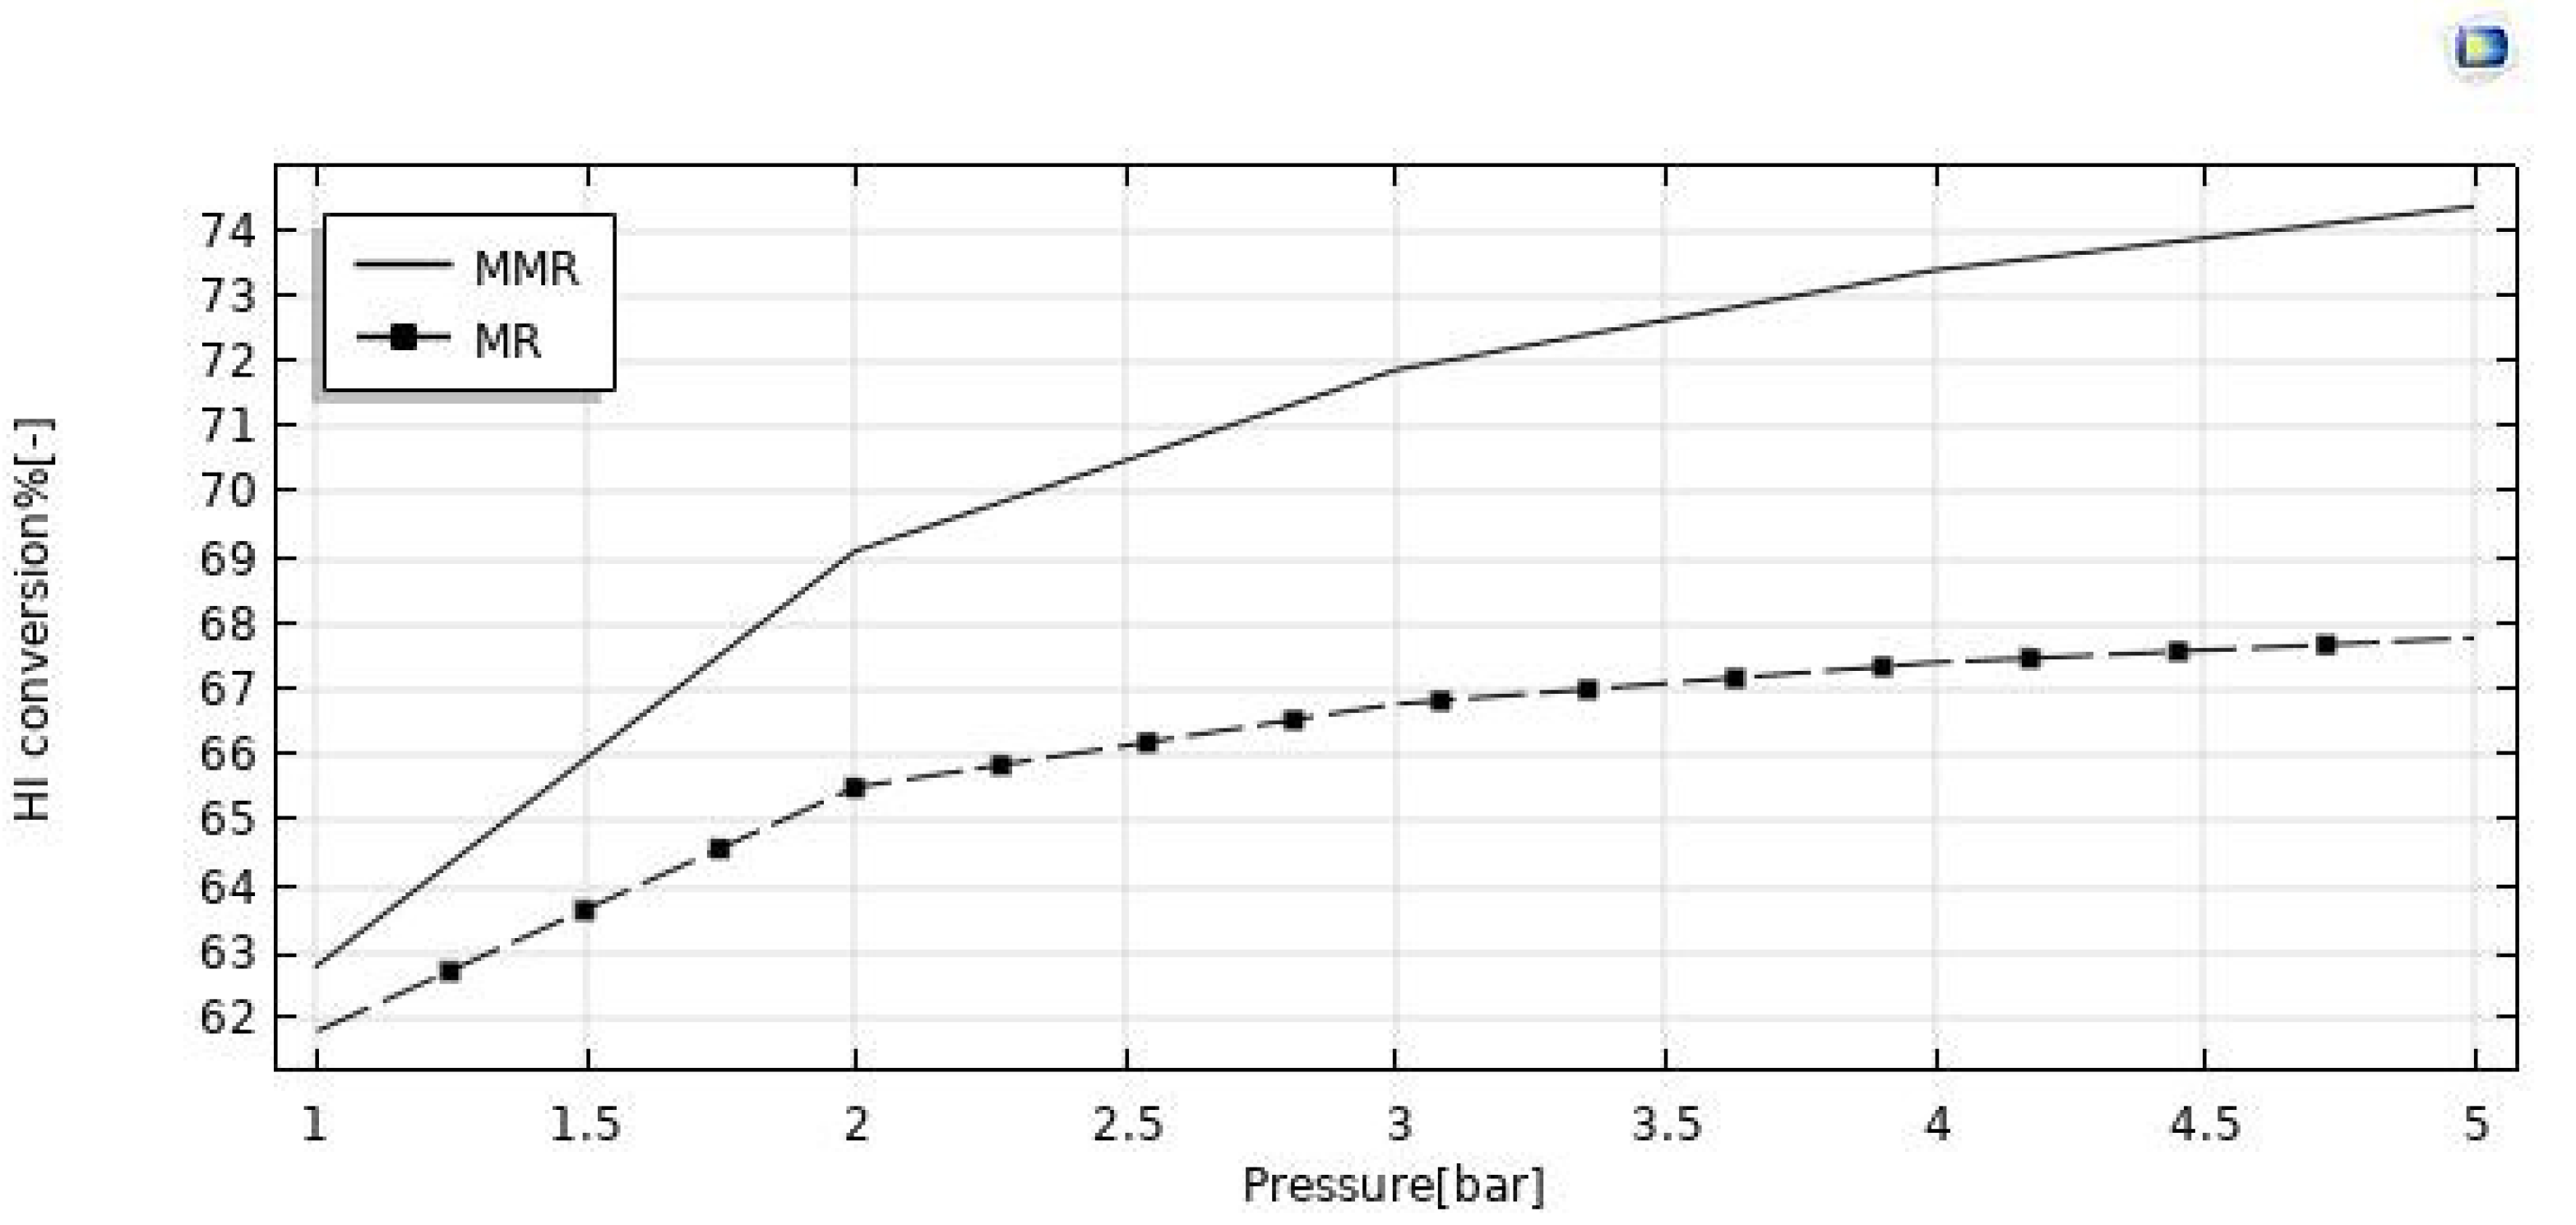
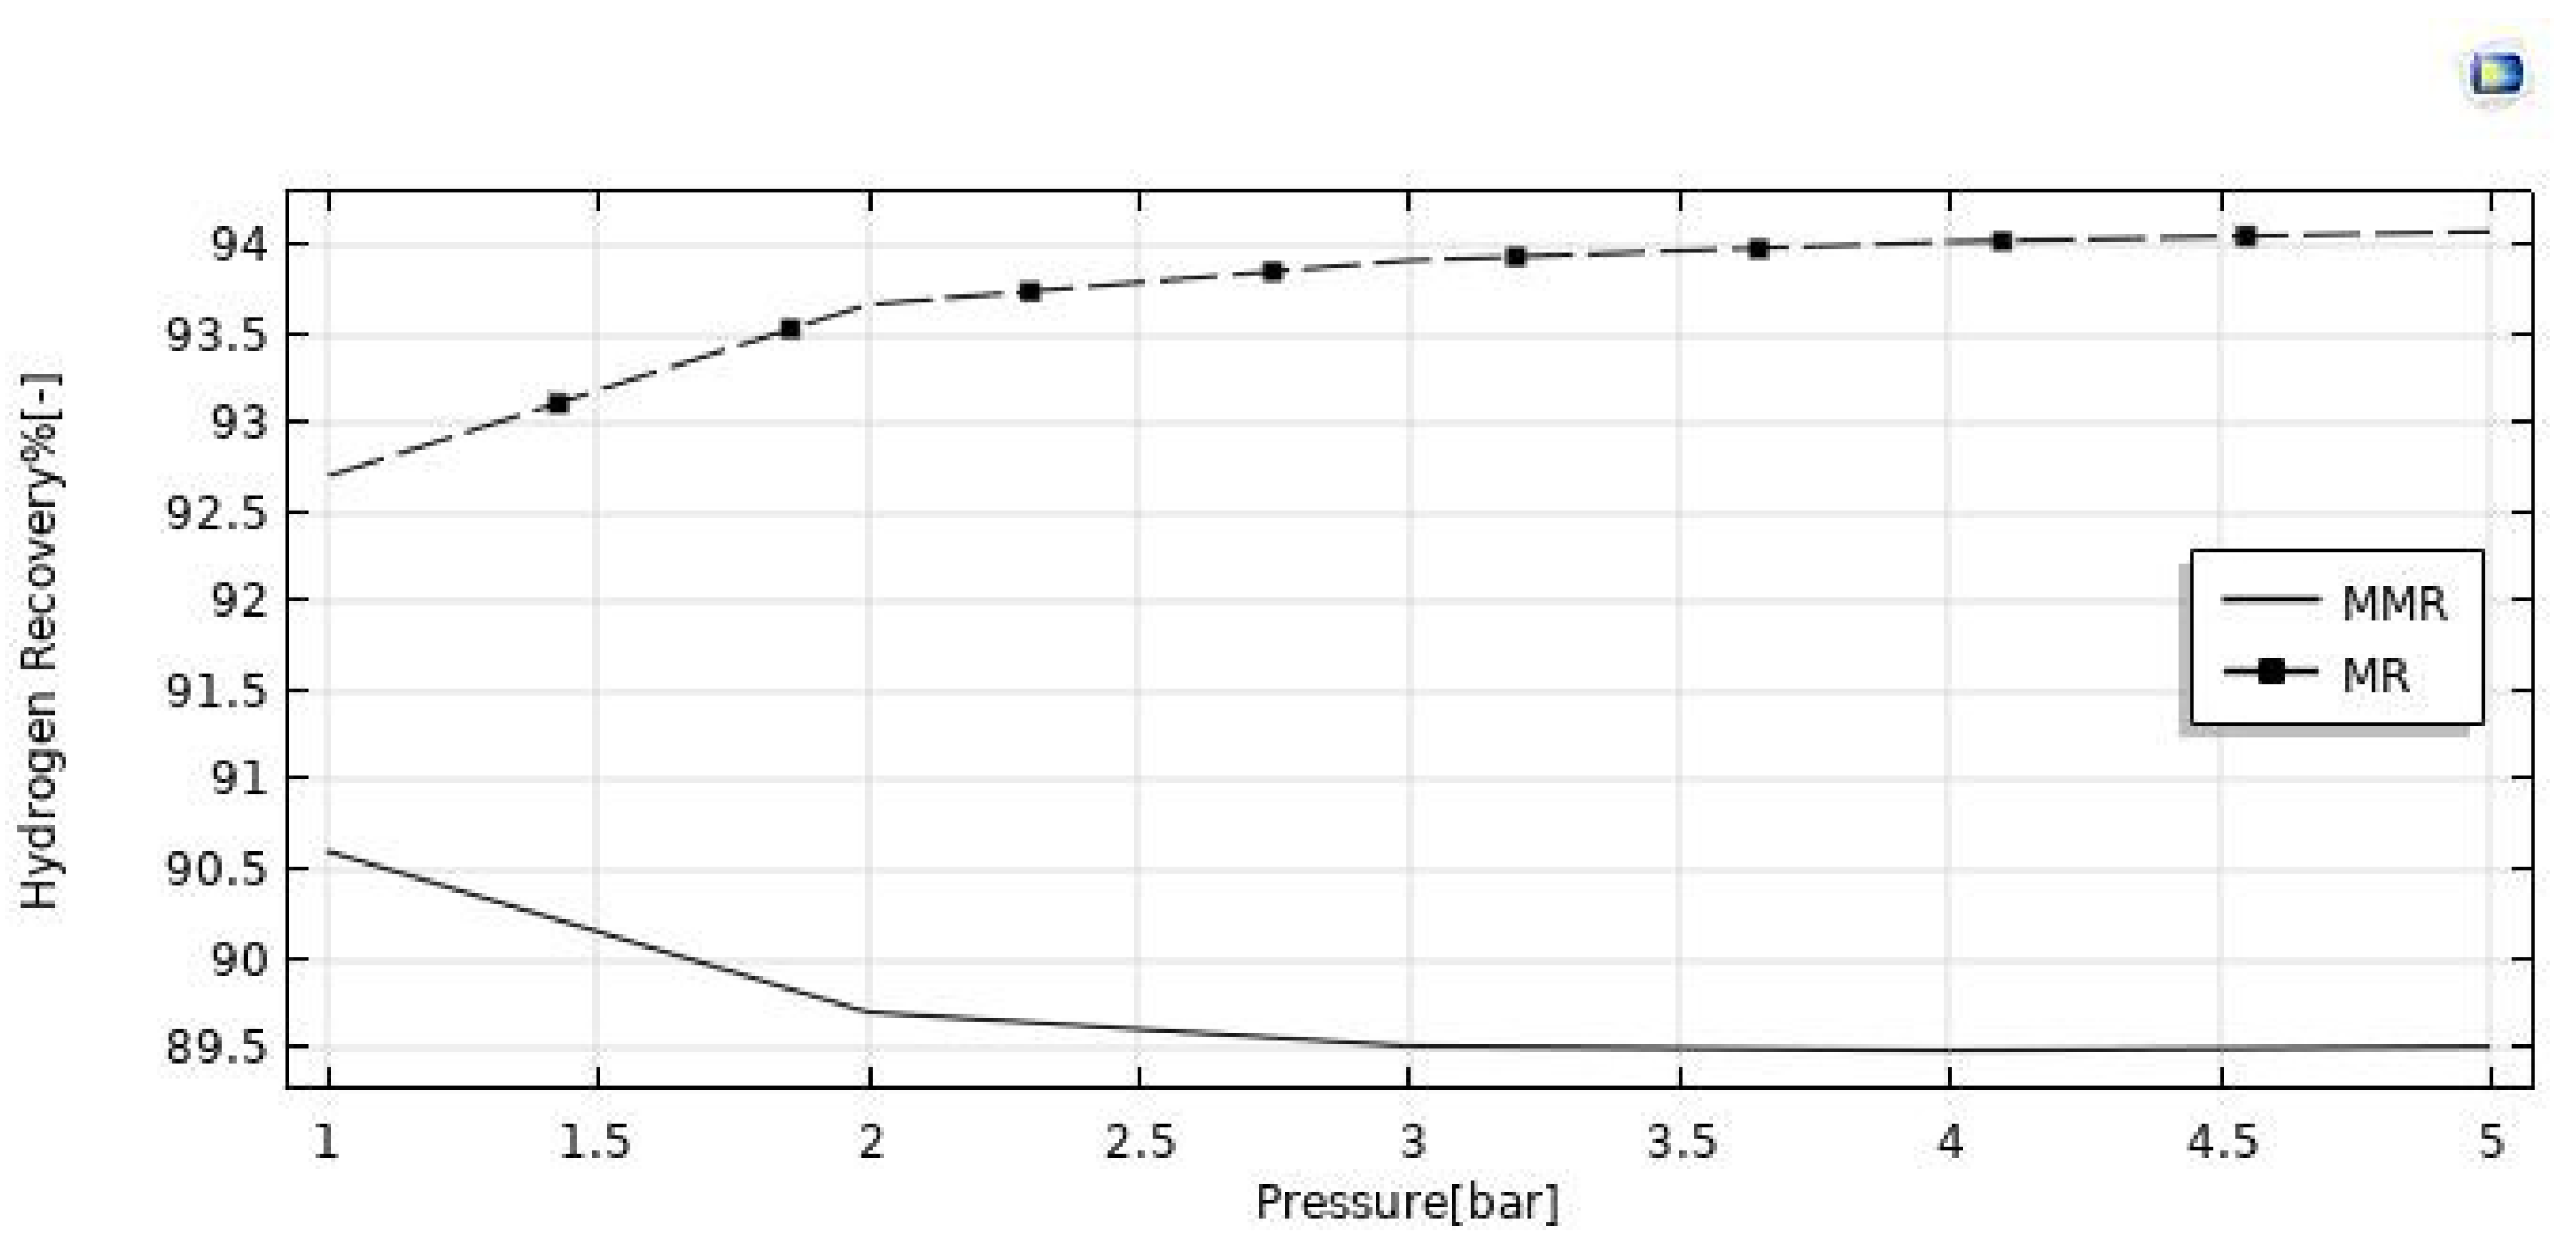
3.3.3. Effect of Reaction Pressure

The reaction pressure effects on the HI conversion and hydrogen recovery are illustrated in Figure 11 and Figure 12. By increasing the retentate pressure, the driving force of the hydrogen permeation through the membrane is enhanced for both the reactors, but the hydrogen recovery demonstrated opposite trends as a function of the reaction pressure in the MR (increasing) and in the MMR (reducing). When removing hydrogen from the reaction zone for the Le Chatelier’s principle, the forward reaction of HI decomposition is thermodynamically favored, and this led to higher conversions of HI. On the other hand, the conversion in the MMR was higher than that in the MR due to an enhanced hydrogen permeation driving force, caused by a lower hydrogen partial pressure in the permeate side determined by the hydrogen consumed in the CO2 methanation reaction. The same reason can be considered for the hydrogen recovery, which was enhanced in the MMR as a consequence of a pressure increase, whereas in the MR the detrimental effect due to a pressure increase was not completely counterbalanced by the “shift effect” related to the membrane permeation, causing a decreasing trend globally.

3.3.4. Optimized Operating Conditions

The analyses on the performance of both the MR and MMR systems evidenced that the best results were obtained considering—as main guidelines—the achievement of the best compromise within the highest hydrogen recovery and the highest HI conversion. For the MMR system, the main objective was to favor the highest transformation of CO2 into SNG in the MMR system. In this regard, a relevant role was played by the recovery of hydrogen produced during the HI decomposition, which—permeating through the membrane—reacts with CO2 under the methanation reaction to produce SNG. Therefore, Table 3 illustrates that the optimized operating conditions able to allow the best performance for the MMR system, 66% of the HI conversion and 95.5% of the hydrogen recovery, were 400 °C, 1 bar, 10 mm3/s of the feed flow rate, and 333 mm3/s of the sweep-gas flow rate. On the other hand, for the MR system, the best compromise within HI conversion (65%) and hydrogen recovery (93.6%) was reached at 400 °C, 2 bar, 20 mm3/s of feed flow rate, and 333 mm3/s of sweep-gas flow rate.

4. Conclusions

A CFD model was developed and validated with experimental results for studying and understanding the performance of silica MRs in an HI decomposition reaction in depth. Based on the viable equations included in the MR model, it was observed that an increase in the feed flow rate from 10 mm3/s to 50 mm3/s led to a significant HI conversion decrease from 66% to 56% in the MMR and from 65% to 55.5% in the MR. On the other hand, the hydrogen recovery decreased from 95.5% to 76% in the MMR and from 96% to 83.5% in the MR. On the other hand, an increase of pressure from 1 to 5 bar determined an increase of HI conversion from 63% to 74% in the MMR and from 62% to 68% in the MR, while the hydrogen recovery remained substantially constant around 90% in the MMR, and a slight increase from 92.5% to 94% was reached in the MR. Globally, the simulations demonstrated better performance achievable in the MMR than in the MR under all the experimental conditions investigated, with the further advantage of transforming CO2 into SNG. Furthermore, the excellent performance in terms of HI conversion and hydrogen recovery in both the MMR and MR proved the high potential application of silica membranes in MRs for the simultaneous hydrogen generation and purification.

Author Contributions

Conceptualization and writing—original draft preparation, M.M.A., M.G. and K.G.; investigation, M.M.A. and M.G.; writing—review and editing, A.I., K.G. and S.L.; supervision, A.I. and K.G. All authors have read and agreed to the published version of the manuscript.

Funding

This research received no external funding.

Data Availability Statement

Not applicable.

Conflicts of Interest

The authors declare no conflict of interest.

References

  1. Dincer, I.; Acar, C. Smart energy solutions with hydrogen options. Int. J. Hydrogen Energy 2018, 43, 8579–8599. [Google Scholar] [CrossRef]
  2. Raza, A.; Gholami, R.; Rezaee, R.; Rasouli, V.; Rabiei, M. Significant aspects of carbon capture and storage—A review. Petroleum 2019, 5, 335–340. [Google Scholar] [CrossRef]
  3. Paturzo, L.; Basile, A.; Iulianelli, A.; Jansen, J.C.; Gatto, I.; Passalacqua, E. High temperature proton exchange membrane fuel cell using a sulfonated membrane obtained via H2SO4 treatment of PEEK-WC. Catal. Today 2005, 104, 213–218. [Google Scholar] [CrossRef]
  4. Yu, Z.; Duan, Y.; Feng, X.; Yu, X.; Gao, M.; Yu, S. Clean and Affordable Hydrogen Fuel from Alkaline Water Splitting: Past, Recent Progress, and Future Prospects. Adv. Mater. 2021, 33, 2007100. [Google Scholar] [CrossRef] [PubMed]
  5. Juárez-Martínez, L.; Espinosa-Paredes, G.; Vázquez-Rodríguez, A.; Romero-Paredes, H. Energy optimization of a Sulfur–Iodine thermochemical nuclear hydrogen production cycle. Nucl. Eng. Technol. 2021, 53, 2066–2073. [Google Scholar] [CrossRef]
  6. Cerri, G.; Salvini, C.; Corgnale, C.; Giovannelli, A.; De Lorenzo, D.L.; Martinez, A.O.; Le Duigou, A.; Borgard, J.-M.; Mansilla, C. Sulfur–Iodine plant for large scale hydrogen production by nuclear power. Int. J. Hydrogen Energy 2010, 35, 4002–4014. [Google Scholar] [CrossRef]
  7. Liguori, S.; Iulianelli, A.; Dalena, F.; Piemonte, V.; Huang, Y.; Basile, A. Methanol steam reforming in an Al2O3 supported thin Pd-layer membrane reactor over Cu/ZnO/Al2O3 catalyst. Int. J. Hydrogen Energy 2014, 39, 18702–18710. [Google Scholar] [CrossRef]
  8. Liguori, S.; Kian, K.; Buggy, N.; Anzelmo, B.H.; Wilcox, J. Opportunities and challenges of low-carbon hydrogen via metallic membranes. Prog. Energy Combust. Sci. 2020, 80, 100851. [Google Scholar] [CrossRef]
  9. Dalena, F.; Senatore, A.; Basile, M.; Knani, S.; Basile, A.; Iulianelli, A. Advances on methanol production and utilization, with particular emphasis toward hydrogen generation via membrane reactor technology: A review. Membranes 2018, 8, 98. [Google Scholar] [CrossRef] [Green Version]
  10. Liguori, S.; Iulianelli, A.; Dalena, F.; Pinacci, P.; Drago, F.; Broglia, M.; Huang, Y.; Basile, A. Performance and Long-Term Stability of Pd/PSS and Pd/Al2O3 Membranes for Hydrogen Separation. Membranes 2014, 4, 143–162. [Google Scholar] [CrossRef]
  11. Ghasemzadeh, K.; Morrone, P.; Iulianelli, A.; Liguori, S.; Babaluo, A.; Basile, A. H2 production in silica membrane reactor via methanol steam reforming: Modeling and HAZOP analysis. Int. J. Hydrogen Energy 2013, 38, 10315–10326. [Google Scholar] [CrossRef]
  12. Nailwal, B.C.; Goswami, N.; Lenka, R.K.; Singha, A.K.; Fani, H.Z.; Rao, A.S.; Kar, S. Multi-tube tantalum membrane reactor for HI processing section of IS thermochemical process. Int. J. Hydrogen Energy 2020, 45, 24341–24354. [Google Scholar] [CrossRef]
  13. Iulianelli, A.; Longo, T.; Liguori, S.; Basile, A. Production of hydrogen via glycerol steam reforming in a Pd-Ag membrane reactor over Co-Al2O3 catalyst. Asia-Pac. J. Chem. Eng. 2010, 5, 138–145. [Google Scholar] [CrossRef]
  14. Myagmarjav, O.; Tanaka, N.; Nomura, M.; Kubo, S. Hydrogen production tests by hydrogen iodide decomposition membrane reactor equipped with silica-based ceramics membrane. Int. J. Hydrogen Energy 2017, 42, 29091–29100. [Google Scholar] [CrossRef]
  15. Niculescu, V.-C. Mesoporous silica nanoparticles for bio-applications. Front. Mater. 2020, 7, 36. [Google Scholar] [CrossRef] [Green Version]
  16. Nwogu, N.C.; Anyanwu, E.E.; Gobina, E. An initial investigation of a nano-composite silica ceramic membrane for hydrogen gas separation and purification. Int. J. Hydrogen Energy 2016, 41, 8228–8235. [Google Scholar] [CrossRef] [Green Version]
  17. Amanipour, M.; Safekordi, A.; Babakhani, E.G.; Zamaniyan, A.; Heidari, M. Effect of synthesis conditions on performance of a hydrogen selective nano-composite ceramic membrane. Int. J. Hydrogen Energy 2012, 37, 15359–15366. [Google Scholar] [CrossRef]
  18. Lee, B.; Lee, H.; Kim, S.; Cho, H.-S.; Cho, W.-C.; Jeon, B.-H.; Kim, C.-H.; Lim, H. Quantification of economic uncertainty for synthetic natural gas production in a H2O permeable membrane reactor as simultaneous power-to-gas and CO2 utilization technologies. Energy 2019, 182, 1058–1068. [Google Scholar] [CrossRef]
  19. Bian, Z.; Xia, H.; Zhong, W.; Jiang, B.; Yu, Y.; Wang, Z.; Yu, K. CFD simulation on hydrogen-membrane reactor inte-grating cyclohexane dehydrogenation and CO2 methanation reactions: A conceptual study. Energy Convers. Manag. 2021, 235, 113989. [Google Scholar] [CrossRef]
  20. Raman, R.K.; Dewang, Y.; Raghuwanshi, J. A review on applications of computational fluid dynamics. Int. J. LNCT 2018, 2, 2456–9895. [Google Scholar]
  21. Ghahremani, M.; Ghasemzadeh, K.; Jalilnejad, E.; Iulianelli, A. A Theoretical Analysis on a Multi-Bed Pervaporation Membrane Reactor during Levulinic Acid Esterification Using the Computational Fluid Dynamic Method. Membranes 2021, 11, 635. [Google Scholar] [CrossRef] [PubMed]
  22. Ghahremani, M.; Ghasemzadeh, K.; Jalilnejad, E.; Basile, A.; Iulianelli, A. Vapor phase esterification of acetic acid with ethanol in a CHA zeolite membrane reactor: A CFD analysis. Chem. Eng. Sci. 2021, 236, 116536. [Google Scholar] [CrossRef]
  23. Ghasemzadeh, K.; Ghahremani, M.; Amiri, T.Y.; Basile, A.; Iulianelli, A. Hydrogen production by silica membrane reactor during dehydrogenation of methylcyclohexane: CFD analysis. Int. J. Hydrogen Energy 2020, 46, 19768–19777. [Google Scholar] [CrossRef]
  24. Ghasemzadeh, K.; Harasi, J.; Amiri, T.; Basile, A.; Iulianelli, A. Methanol steam reforming for hydrogen generation: A comparative modeling study between silica and Pd-based membrane reactors by CFD method. Fuel Process. Technol. 2020, 199, 106273. [Google Scholar] [CrossRef]
  25. Jabbari, B.; Jalilnejad, E.; Ghasemzadeh, K.; Iulianelli, A. Modeling and optimization of a membrane gas separation based bioreactor plant for biohydrogen production by CFD–RSM combined method. J. Water Process Eng. 2021, 43, 102288. [Google Scholar] [CrossRef]
  26. Nguyen, T.D.; Gho, Y.K.; Cho, W.C.; Kang, K.S.; Jeong, S.U.; Kim, C.H.; Bae, K.K. Kinetics and modeling of hydrogen iodide decomposition for a bench-scale sulfur–iodine cycle. Appl. Energy 2014, 115, 531–539. [Google Scholar] [CrossRef]
  27. Shin, Y.; Lee, T.; Lee, K.; Kim, M. Modeling and simulation of HI and H2SO4 thermal decomposers for a 50 NL/h sul-fur-iodine hydrogen production test facility. Appl. Energy 2016, 173, 460–469. [Google Scholar] [CrossRef]
  28. Goswami, N.; Singh, K.; Kar, S.; Bindal, R. Numerical simulations of HI decomposition in coated wall membrane reactor and comparison with packed bed configuration. Appl. Math. Model. 2016, 40, 9001–9016. [Google Scholar] [CrossRef]
  29. Tandon, P.; Jain, M. Modeling and simulation of non-isothermal packed-bed membrane reactor for decomposition of hydrogen iodide. Environ. Technol. Innov. 2020, 20, 101162. [Google Scholar] [CrossRef]
  30. Buddenberg, J.W.; Wilke, C.R. Calculation of Gas Mixture Viscosities. Ind. Eng. Chem. 1949, 41, 1345. [Google Scholar] [CrossRef]
  31. Sosnowski, M.; Krzywanski, J.; Scurek, R. A Fuzzy Logic Approach for the Reduction of Mesh Induced Error in CFD Analysis: A Case Study of an Impinging Jet. Entropy 2019, 21, 1047. [Google Scholar] [CrossRef] [Green Version]
  32. Krzywanski, J.; Sztekler, K.; Szubel, M.; Siwek, T.; Nowak, W.; Mika, L. A Comprehensive Three-Dimensional Analysis of a Large-Scale Multi-Fuel CFB Boiler Burning Coal and Syngas. Part 1. The CFD Model of a Large-Scale Multi-Fuel CFB Combustion. Entropy 2020, 22, 964. [Google Scholar] [CrossRef] [PubMed]
Figure 2. HI conversion and hydrogen recovery as a function of the mesh number. CFD simulations made at p = 1 bar, T = 400 °C, sweep gas flow rate = 333.33 mm3/s, and feed flow rate = 20 mm3/s.
Nanomaterials 12 00824 g002
Figure 3. HI conversion in the MR vs. feed flow rate at T = 400 °C, p = 1 bar, and sweep gas flow rate = 333.33 mm3/s.
Nanomaterials 12 00824 g003
Figure 4. Distributions of hydrogen mole fraction profile in the MMR at T = 400 °C, feed flow rate = 20 mm3/s, and sweep gas flow rate = 333.33 mm3/s: (a) 1 bar; (b) 3 bar; (c) 5 bar; (d) hydrogen mole fraction in the MMR permeate side as a function of z/L.
Nanomaterials 12 00824 g004
Figure 5. Reactants and products distributions along z-axis in the MMR at T = 400 °C, 1 bar, feed flow rate = 20 mm3/s, and sweep gas flow rate = 333.33 mm3/s.
Nanomaterials 12 00824 g005
Figure 6. H2 permeating flux distribution along z axis in the MMR at T = 400 °C and 1 bar.
Nanomaterials 12 00824 g006
Figure 7. HI conversion vs. the feed flow rate in both the MR and MMR at p = 1 bar, T = 400 °C, and sweep gas flow rate = 333.33 mm3/s.
Nanomaterials 12 00824 g007
Figure 8. Hydrogen recovery vs. feed flow rate for both the MMR and the MR at p = 1 bar, T = 400 °C, and sweep gas flow rate = 333.33 mm3/s.
Nanomaterials 12 00824 g008
Figure 9. Effect of feed flow rate on the HI conversion at p = 1 bar, T = 400 °C, and feed flow rate = 20 mm3/s.
Nanomaterials 12 00824 g009
Figure 10. Effect of feed flow rate on the hydrogen recovery at p = 1 bar, T = 400 °C, and feed flow rate = 20 mm3/s.
Nanomaterials 12 00824 g010
Figure 11. HI conversion vs. reaction pressure at T = 400 °C, feed flow rate = 20 mm3/s, and sweep gas flow rate = 333.33 mm3/s.
Nanomaterials 12 00824 g011
Figure 12. Hydrogen recovery vs. reaction pressure at T = 400 °C, feed flow rate = 20 mm3/s, and sweep gas flow rate = 333.33 mm3/s.
Nanomaterials 12 00824 g012
Table 1. Boundary condition at retentate and permeate sides.
PositionRetentate SidePermeate Side
Z = 0inflowInflow
Z = LoutflowOutflow
r = R1fluxFlux
r = R2 c r = 0 c r = 0
Table 2. The investigated operating conditions for parametric analyses of the MMR and MR performance during the HI decomposition reaction.
Operating Parameters PressureFeed Flow Rate Sweep Factor
Temperature (°C)400400400
Pressure (bar)1–511
Feed flow rate (mm3/s)2010–5020
Sweep gas flow rate (mm3/s)333.336.22166.6–833.3
Table 3. Optimized operating condition to reach the best performance in the MR and MMR systems.
MMR MR
Operating
Parameters
HI Conversion [%]H2 Recovery [%]Operating Parameters HI Conversion [%]H2 Recovery [%]
Temperature (°C)4006695.5Temperature (°C)4006593.6
Pressure (bar)1Pressure (bar)2
Feed flow rate (mm3/s)10Feed flow rate (mm3/s)20
Sweep gas flow rate (mm3/s)333Sweep gas flow rate (mm3/s)333
Publisher’s Note: MDPI stays neutral with regard to jurisdictional claims in published maps and institutional affiliations.

