Article

Preparation and Adsorption Performance Study of Graphene Quantum Dots@ZIF-8 Composites for Highly Efficient Removal of Volatile Organic Compounds

1
School of Materials Science and Engineering, Northwestern Polytechnical University, Xi’an 710072, China
2
Faculty of Printing, Packaging Engineering and Digital Media Technology, Xi’an University of Technology, Xi’an 710048, China
3
Laboratoire de Mécanique Paris-Saclay, Université Paris-Saclay, CentraleSupélec, ENS Paris-Saclay, CNRS, 91190 Gif-sur-Yvette, France
*
Authors to whom correspondence should be addressed.
Nanomaterials 2022, 12(22), 4008; https://doi.org/10.3390/nano12224008
Submission received: 19 October 2022 / Revised: 6 November 2022 / Accepted: 12 November 2022 / Published: 14 November 2022

Abstract

:
Based on the large specific surface area and excellent adsorption potential of graphene quantum dots (GQDs) and zeolitic imidazolate framework-8 (ZIF-8) materials, a GQDs@ZIF-8 composite was constructed to achieve optimal matching of the microstructure and to acquire efficient adsorption of volatile organic compounds (VOCs). GQDs and ZIF-8 were synthesized and then compounded by the solution co-deposition method to obtain GQDs@ZIF-8 composites. GQDs were uniformly decorated on the surface of the ZIF-8 metal-organic framework (MOF), effectively restraining the agglomeration, improving the thermal stability of ZIF-8 and forming abundant active sites. Thus, the VOC removal percentage and adsorption capacity of the GQDs@ZIF-8 composites were significantly improved. Toluene and ethyl acetate were chosen as simulated VOC pollutants to test the adsorption performance of the composites. The results showed that, after the addition of GQDs, the adsorption property of GQDs@ZIF-8 composites for toluene and ethyl acetate was obviously improved, with maximum adsorption capacities of 552.31 mg/g and 1408.59 mg/g, respectively, and maximum removal percentages of 80.25% and 93.78%, respectively, revealing extremely high adsorption performance. Compared with raw ZIF-8, the maximum adsorption capacities of the composites for toluene and ethyl acetate were increased by 53.82 mg/g and 104.56 mg/g, respectively. The kinetics and isotherm study revealed that the adsorption processes were in accordance with the pseudo-first-order kinetic model and the Freundlich isotherm model. The thermodynamic results indicated that the adsorption process of the GQDs@ZIF-8 composites was a spontaneous, endothermic and entropy increase process. This study provides a new way to explore MOF-based adsorption materials with high adsorption capacity which have broad application prospects in VOC removal fields.

1. Introduction

At present, volatile organic compounds (VOCs) are increasingly generated in the field of industrial production, home decoration, coatings, etc., causing great harm to the environment and human health [1,2]. The removal and degradation of VOCs has become a key problem to be solved. The terminal treatment of VOCs mainly includes adsorption, combustion and other chemical methods. Among them, adsorption methods using activated carbon, molecular sieves and a variety of nanoporous materials are widely adopted due to their simplicity and convenient features [3,4,5]. However, these methods still have problems such as low adsorption capacity, ease of blockage and low thermal stability [6,7]. Therefore, ascertaining how to obtain new adsorption materials with high VOC adsorption capacity, high thermal stability and good regeneration performance is the focus of current research.
Metal-organic frameworks (MOFs) with high specific surface area and developed porosity are widely used in gas separation [8], water purification [9], catalyzation [10] and other fields. As a major MOF subfamily, zeolite imidazole framework-8 (ZIF-8) has attracted extensive interest from researchers due to its simple synthesis and high chemical and thermal stability [11,12,13,14]. Zhou et al. [15] prepared hybrid composites of ZIF-8 and graphene oxide (GO) in methanol at room temperature, showing their adjustable nanoscale morphology and porosity. Due to the synergistic effect between ZIF-8 and GO, the composite had a higher absorption capacity of VOCs than ordinary ZIF-8 crystals. When the GO content was 15 wt%, the maximum adsorption capacity of ZIF-8/GO for methylene chloride reached 240 mg/g. Qiu et al. [16] prepared ZIF-8 and its derived nitrogen-rich, porous carbon with different average sizes and proved that their specific surface area and pore volume decreased with increasing particle size. For porous carbon derived from ZIF-8, nitrogen-containing functional groups greatly improved the affinity for CO2 and VOCs. Meng et al. [17] prepared N-functionalized porous carbon (NFPC) with a high specific surface area from ZIF-8 and applied it to the adsorption and removal of gaseous acetone and toluene. NFPC-1000 had the best adsorption performance for acetone and toluene, and the equilibrium adsorption capacities were 203.4 mg/g and 297.1 mg/g, respectively. Song et al. [18] prepared ZIF-8 with methanol, deionized water and triethylamine (Et3N) mixed solution as the medium and modified ZIF-8 with sodium alginate (SA) and CaCl2 ZIF-8@CA, which greatly improved the adsorption property of Pb2+, and the maximum adsorption capacity was 1321.21 mg/g. Wang et al. [19] used ZIF-8 and fly ash (FA) to prepare a low-cost, small-volume and high-stability nanocomposite ZIF-8/FA, which was used to remove heavy metal ions in water, effectively solving the problems of low FA adsorption performance and difficult recovery of ZIF-8. In the field of aqueous solution treatment, current research is mainly focused on the combination of ZIF-8 with organic carriers and metal ions, while research on VOC adsorption still needs more attention to continuously improve VOC adsorption capacity. Thus, the adsorption of ZIF-8 material on various VOC pollutants needs to be deeply investigated to make full use of its excellent performance.
As a zero-dimensional carbon nanomaterial, graphene quantum dots (GQDs) have special luminous properties [20], low toxicity [21] and good biocompatibility [22,23]. They have good application value in photovoltaic cells, biological imaging and medical fields [24]. Meanwhile, their large specific surface area, good dispersion, rich active centers (edges, functional groups, dopants, etc.) and good adjustability of chemical and physical properties [25] also lay the foundation for their application in the adsorption field. GQDs also have the advantages of rich surface functional groups and many active sites [26]. They can improve the adsorption capacity for specific substances by functionalizing other specific functional groups. Mahmoud et al. [27] further modified rice-hull-based GQDs with barium hydroxide to prepare a GQDOs-Ba nanobiosorbent for the microwave-enhanced removal of Pb2+ and La3+ from water. The increase in GQDOs-Ba dosage improved the removal efficiency of Pb2+ and La3+ ions. Manna et al. [28] prepared a GQD-coated biological matrix for removing azo dyes, methylene blue, etc. Compared with GQDs, the removal capacity of the GQD-coated biological matrix was increased by 2–3 times. Nagaraj et al. [29] covalently linked GQDs to functional ionic liquids (IL) to prepare a highly stable IL-GQDs adsorbent for removing Cr6+ from contaminated water. An alkaline medium was used as the eluent for the regeneration study, and the removal efficiency of Cr6+ by IL-GQDs was still more than 80% after five cycles. Shao et al. [30] synthesized GQDs-TiO2 nanofilms by a hydrothermal method. The highest sensitivity was 13.8, and the response time was 18 s when detecting 50 ppm isopropanol gas at room temperature. Alivand et al. [31] prepared GQDs by embedding them in the self-assembly process of material of institute Lavoisier-101 (MIL-101) and obtained MIL-101@GQD composites. Compared with conventional MIL-101, MIL-101@GQD-3 showed 300.0% and 53.3% greater mesopore and total pore volumes, respectively, resulting in 1.7 and 2.8 times more benzene and toluene loading, respectively. At present, GQDs still have some shortcomings such as low stability and easy agglomeration. In addition, low-cost production and purification still have not been realized, which restricts the large-scale application of GQDs.
ZIF-8 has the advantages of structural adjustability and ultrahigh specific surface area. Both acidic and alkaline functional groups exist in its structures, which can adsorb pollutants with different properties. GQDs also have rich surface functional groups and abundant active sites, which can be grafted with other specific functional groups to improve the adsorption capacity for specific substances. However, GQDs easily agglomerate during the service process, which leads to the failure of the adsorbent. In the face of this shortage, new types of GQDs@ZIF-8 complex structures are expected to be designed. For this novel composite, GQDs were uniformly dispersed on the surface of ZIF-8 to achieve optimal matching of the microstructure, which takes synergetic advantage of GQDs and ZIF-8, improving the adsorption performance of the composite and further realizing the pH-value-regulated adsorption efficiency through the adjustment of surface functional groups. Based on this new concept, GQDs and ZIF-8 were prepared by the direct pyrolysis method and liquid-phase synthesis method, respectively, and then GQDs@ZIF-8 composites were synthesized by further combination of GQDs and ZIF-8 via the solution co-deposition method. Characterizations, including those by transmission electron microscope (TEM), X-ray diffractometer (XRD), X-ray photoelectron spectrometer (XPS), Fourier-transform infrared spectrometer (FT-IR), thermal gravimetric analyzer (TGA) and N2 adsorption-desorption, were used to investigate the morphology, crystal structure, components and pore structures of the composites. Toluene and ethyl acetate were chosen as simulated VOC pollutants to test the adsorption performance of the composites, revealing maximum adsorption capacities of 552.31 mg/g and 1408.59 mg/g, respectively. GQDs@ZIF-8 composites with high adsorption capacity were obtained in this work, which can be used for the highly efficient removal of VOCs.

2. Materials and Methods

2.1. Materials and Reagents

Citric acid (C6H8O7, purity ≥ 99.8%), used as the precursor material for preparing GQDs, was purchased from Tianjin Jiayu Fine Chemical Co., Ltd. (Tianjin, China). 2-Methylimidazole (C4H6N2, purity ≥ 98%) and zinc nitrate hexahydrate (Zn(NO3)2·6H2O, purity ≥ 99%), used as the precursor materials for preparing ZIF-8, were purchased from Beijing Boyu Gaoxin New Materials Co., Ltd. (Beijing, China) and Luoyang Haohua Chemical Reagent Co., Ltd. (Luoyang, China), respectively. Toluene (C7H8, purity ≥ 99.5%), ethyl acetate (C4H8O2, purity ≥ 99.5%), methanol (CH4O, purity ≥ 99.7%), ethanol (C2H6O, purity ≥ 99.7%), sodium hydroxide (NaOH, purity ≥ 99%), hydrochloric acid (HCl, 37%) and deionized water (H2O, 99.9%) were purchased from Sinopharm Chemical Reagent Co., Ltd. (Shanghai, China). Dialysis bag (molecular weight cutoff: 3000 Da) was purchased from Nanjing Dulai Biotechnology Co., Ltd. (Nanjing, China).

2.2. Preparation of GQDs

In this study, GQDs were prepared by the direct pyrolysis method, referring to a previous procedure [32] with a small amount of modification. Citric acid was used as the precursor, and the carbonization degree of citric acid was adjusted by controlling the reaction time and temperature to synthesize GQDs. The typical preparation process was as follows: 10 g citric acid was added to a flask, which was placed in an oil bath and heated to 200 °C for 30 min. When all the color of the solution had turned to pale yellow, the flask was taken out and cooled to room temperature. After that, 100 mL of NaOH solution with a concentration of 0.5 mol/L was dropped into the flask and stirred until the solution was evenly dispersed. Then, the pH value of the solution was adjusted to 7 using hydrochloric acid with a concentration of 2 mol/L. The obtained solution was further dialyzed for 48 h using a dialysis bag, for which the molecular weight cutoff was 3000 Da. Finally, the synthesized GQD solution was stored at 4 °C for further use.

2.3. Preparation of ZIF-8

ZIF-8 was prepared by a liquid-phase synthesis method [33] from the coordination of zinc ions with 2-methylimidazole. First, 1 mmol of zinc nitrate hexahydrate and 4 mmol of 2-methylimidazole were dissolved in 25 mL of methanol to prepare two types of solutions. The obtained solutions were stirred until the color turned transparent. Then, the methanol solution of 2-methylimidazole was poured into the methanol solution of zinc nitrate hexahydrate. The mixture was evenly dispersed, was left to stand for 24 h and was further washed via centrifugation at 10,000 rpm for 5 min. The centrifugal solvent had a 1:1 ratio of water and methanol. After three rounds of centrifugation, the residue powder was dried at 60 °C to obtain ZIF-8.

2.4. Preparation of GQDs@ZIF-8 Composites

GQDs@ZIF-8 composites were prepared from the combination of GQDs and ZIF-8 by a solution co-deposition method. First, 10 wt% of ZIF-8 powder was dissolved in methanol solution and dispersed with an ultrasonic cell pulverizer for 10 min. Then, 10 mg/mL of GQD solution was dropped into the prepared ZIF-8 solution, with a GQD content of 5%. After magnetic stirring for 30 min, the mixture was washed via centrifugation for 3 rounds, with a centrifugation time of 20 min and a rotating speed of 10,000 rpm. Then, the obtained samples were dried at 60 °C to obtain GQDs@ZIF-8 composites with a water content of zero.

2.5. Characterization of GQDs@ZIF-8 Composites

The crystal structure of the GQDs@ZIF-8 composites was measured by XRD (Shimadzu Limited, XRD-7000) with a scanning rate of 4°/min. The chemical structure was investigated by FT-IR (Shimadzu, IRSpirt) in the range of 400–4000 cm−1. The microstructure and morphologies were observed by TEM (JEOL, JEM 2100F). The components of the composite were determined by XPS (Thermo Scientific, K-Alpha). The thermal stability was investigated by TGA (Netzsch, TG 209F3) in the range of 25–800 °C at a heating rate of 5 °C/min. The Brunauer-Emmett-Teller (BET) N2 adsorption-desorption isotherms were measured by a surface area and porosimetry system (Quantachrome, NOVA) at 77 K to determine the specific surface area and pore structure of the composites.

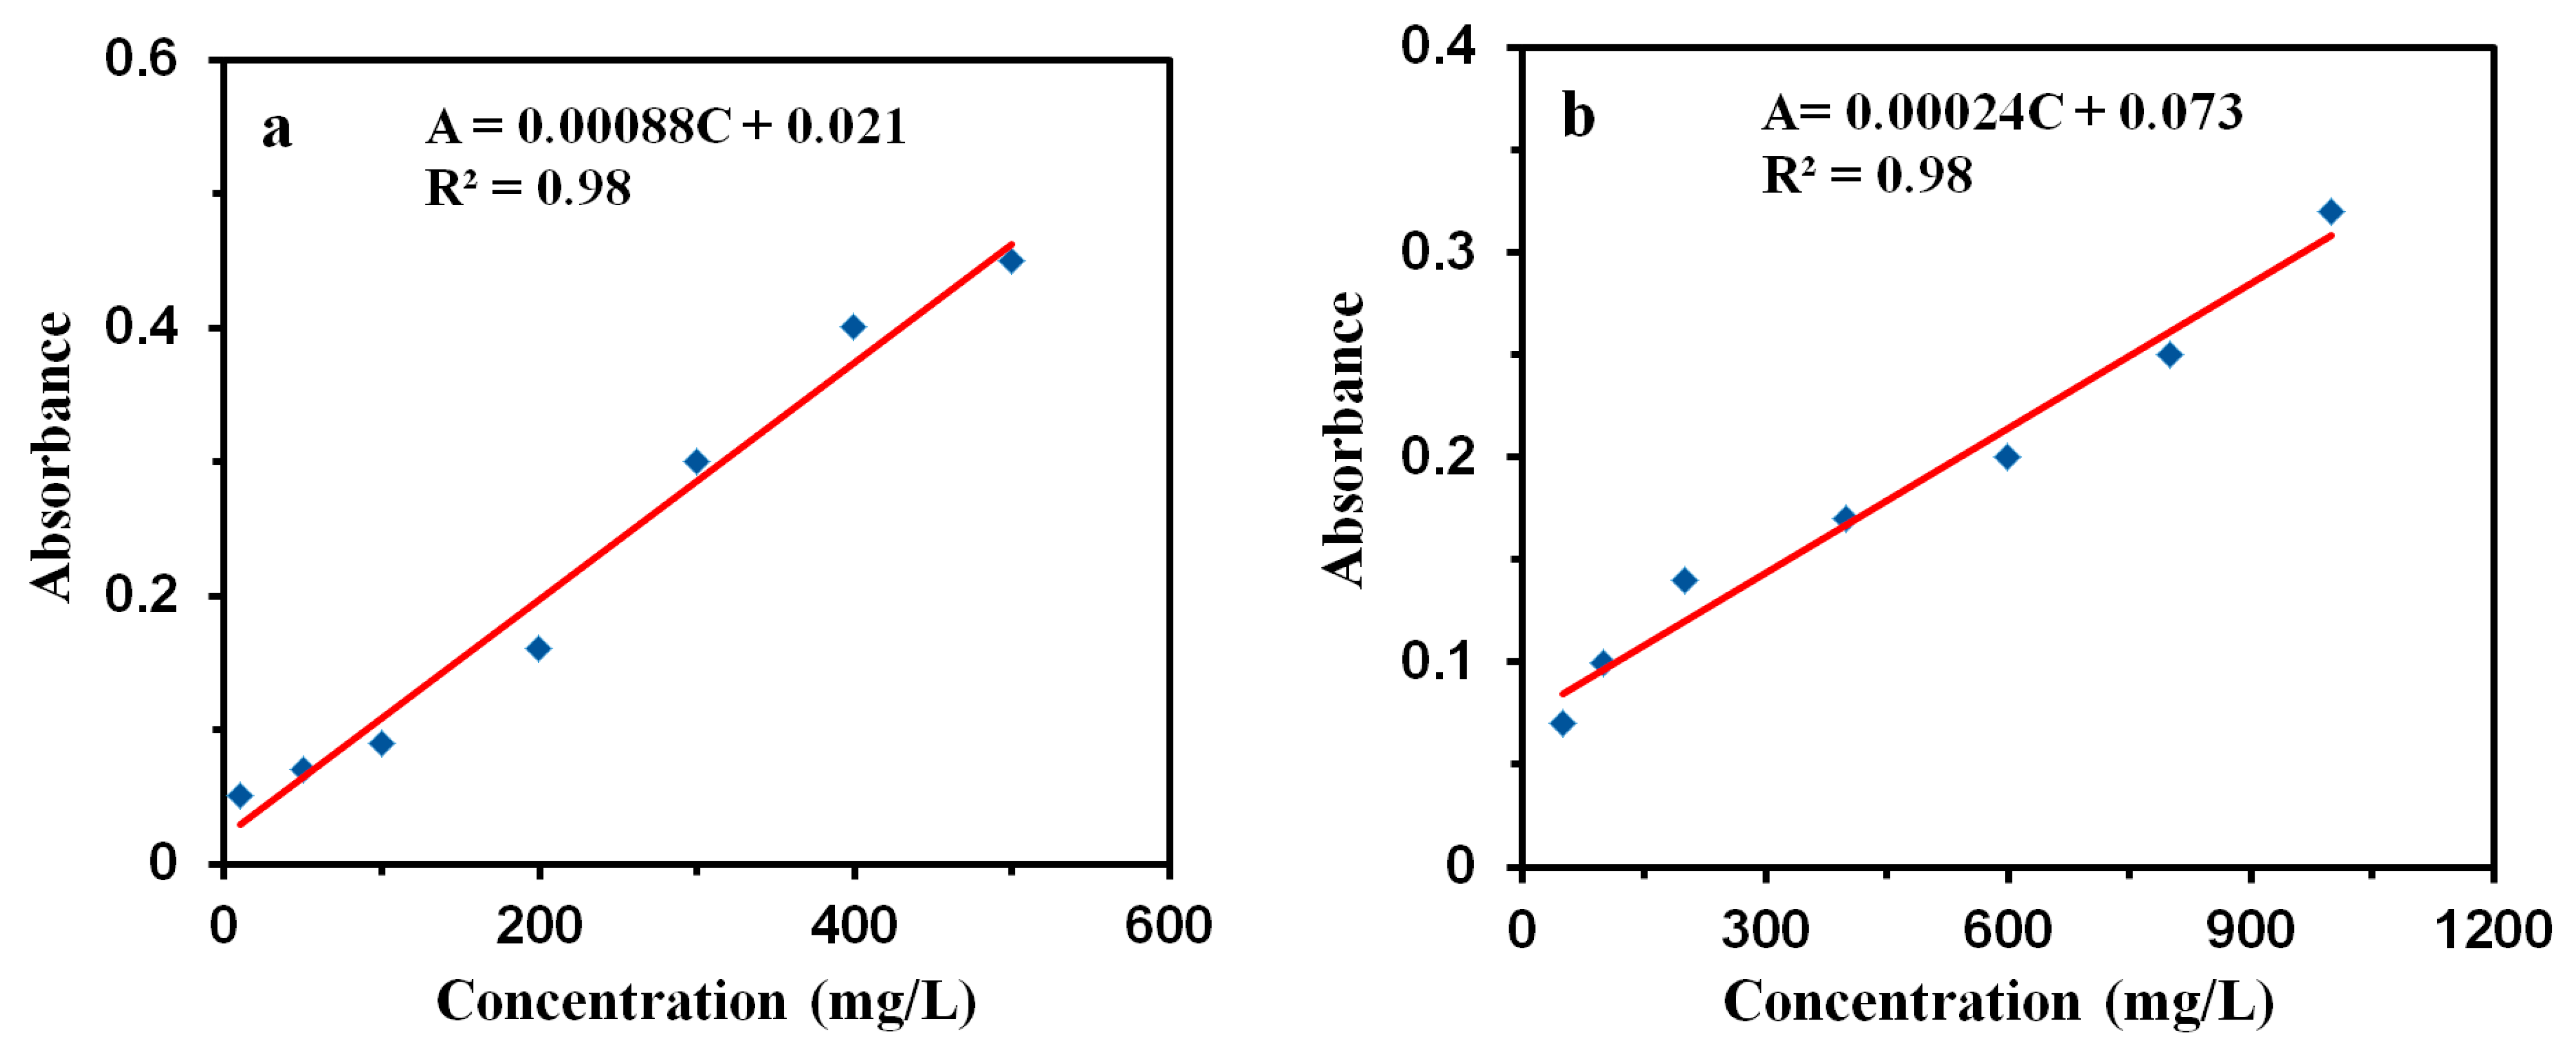
2.6. Adsorption Test of GQDs@ZIF-8 Composites for Toluene and Ethyl Acetate

Toluene and ethyl acetate were taken as the target VOC pollutants to determine the adsorption performance of GQDs@ZIF-8 composites. Different concentrations of toluene solution and ethyl acetate solution were prepared. UV-1800 ultraviolet spectrophotometer (Persee, TU-1810) was used to measure the absorbance of toluene at 261 nm and ethyl acetate at 256 nm. The absorbance-concentration curves of toluene and ethyl acetate were drawn to obtain the standard working curve, as shown in Figure 1. Then, the concentrations of the solution after each adsorption experiment were calculated based on the measured absorbance and the standard working curve.
Toluene solution with a concentration of 400 mg/L and ethyl acetate solution with a concentration of 800 mg/L were prepared. Different quantities of GQDs@ZIF-8 composites were put into the above solutions for the adsorption test. Moreover, the pH value of the solution was adjusted to 3, 5, 7, 9 and 11, respectively. The adsorption performance of the composites under different pH values was measured using an ultraviolet spectrophotometer and then the concentrations of toluene and ethyl acetate solution at different times were calculated according to the standard curve of the reference solution. The removal percentage R (%) and adsorption capacity Qt (mg/g) of GQDs@ZIF-8 composites for toluene and ethyl acetate can be calculated using the following formulas:
R = ( C 0 C t ) / C 0 100 %
Q t = ( C 0 C t ) V / m
where C0 is the initial concentration of the adsorbate solution (mg/L), Ct is the concentration of the adsorbate solution at time t (mg/L), V is the volume of adsorbate solution (L) and m is the dosing mass of the adsorbent material (g).

3. Results and Discussion

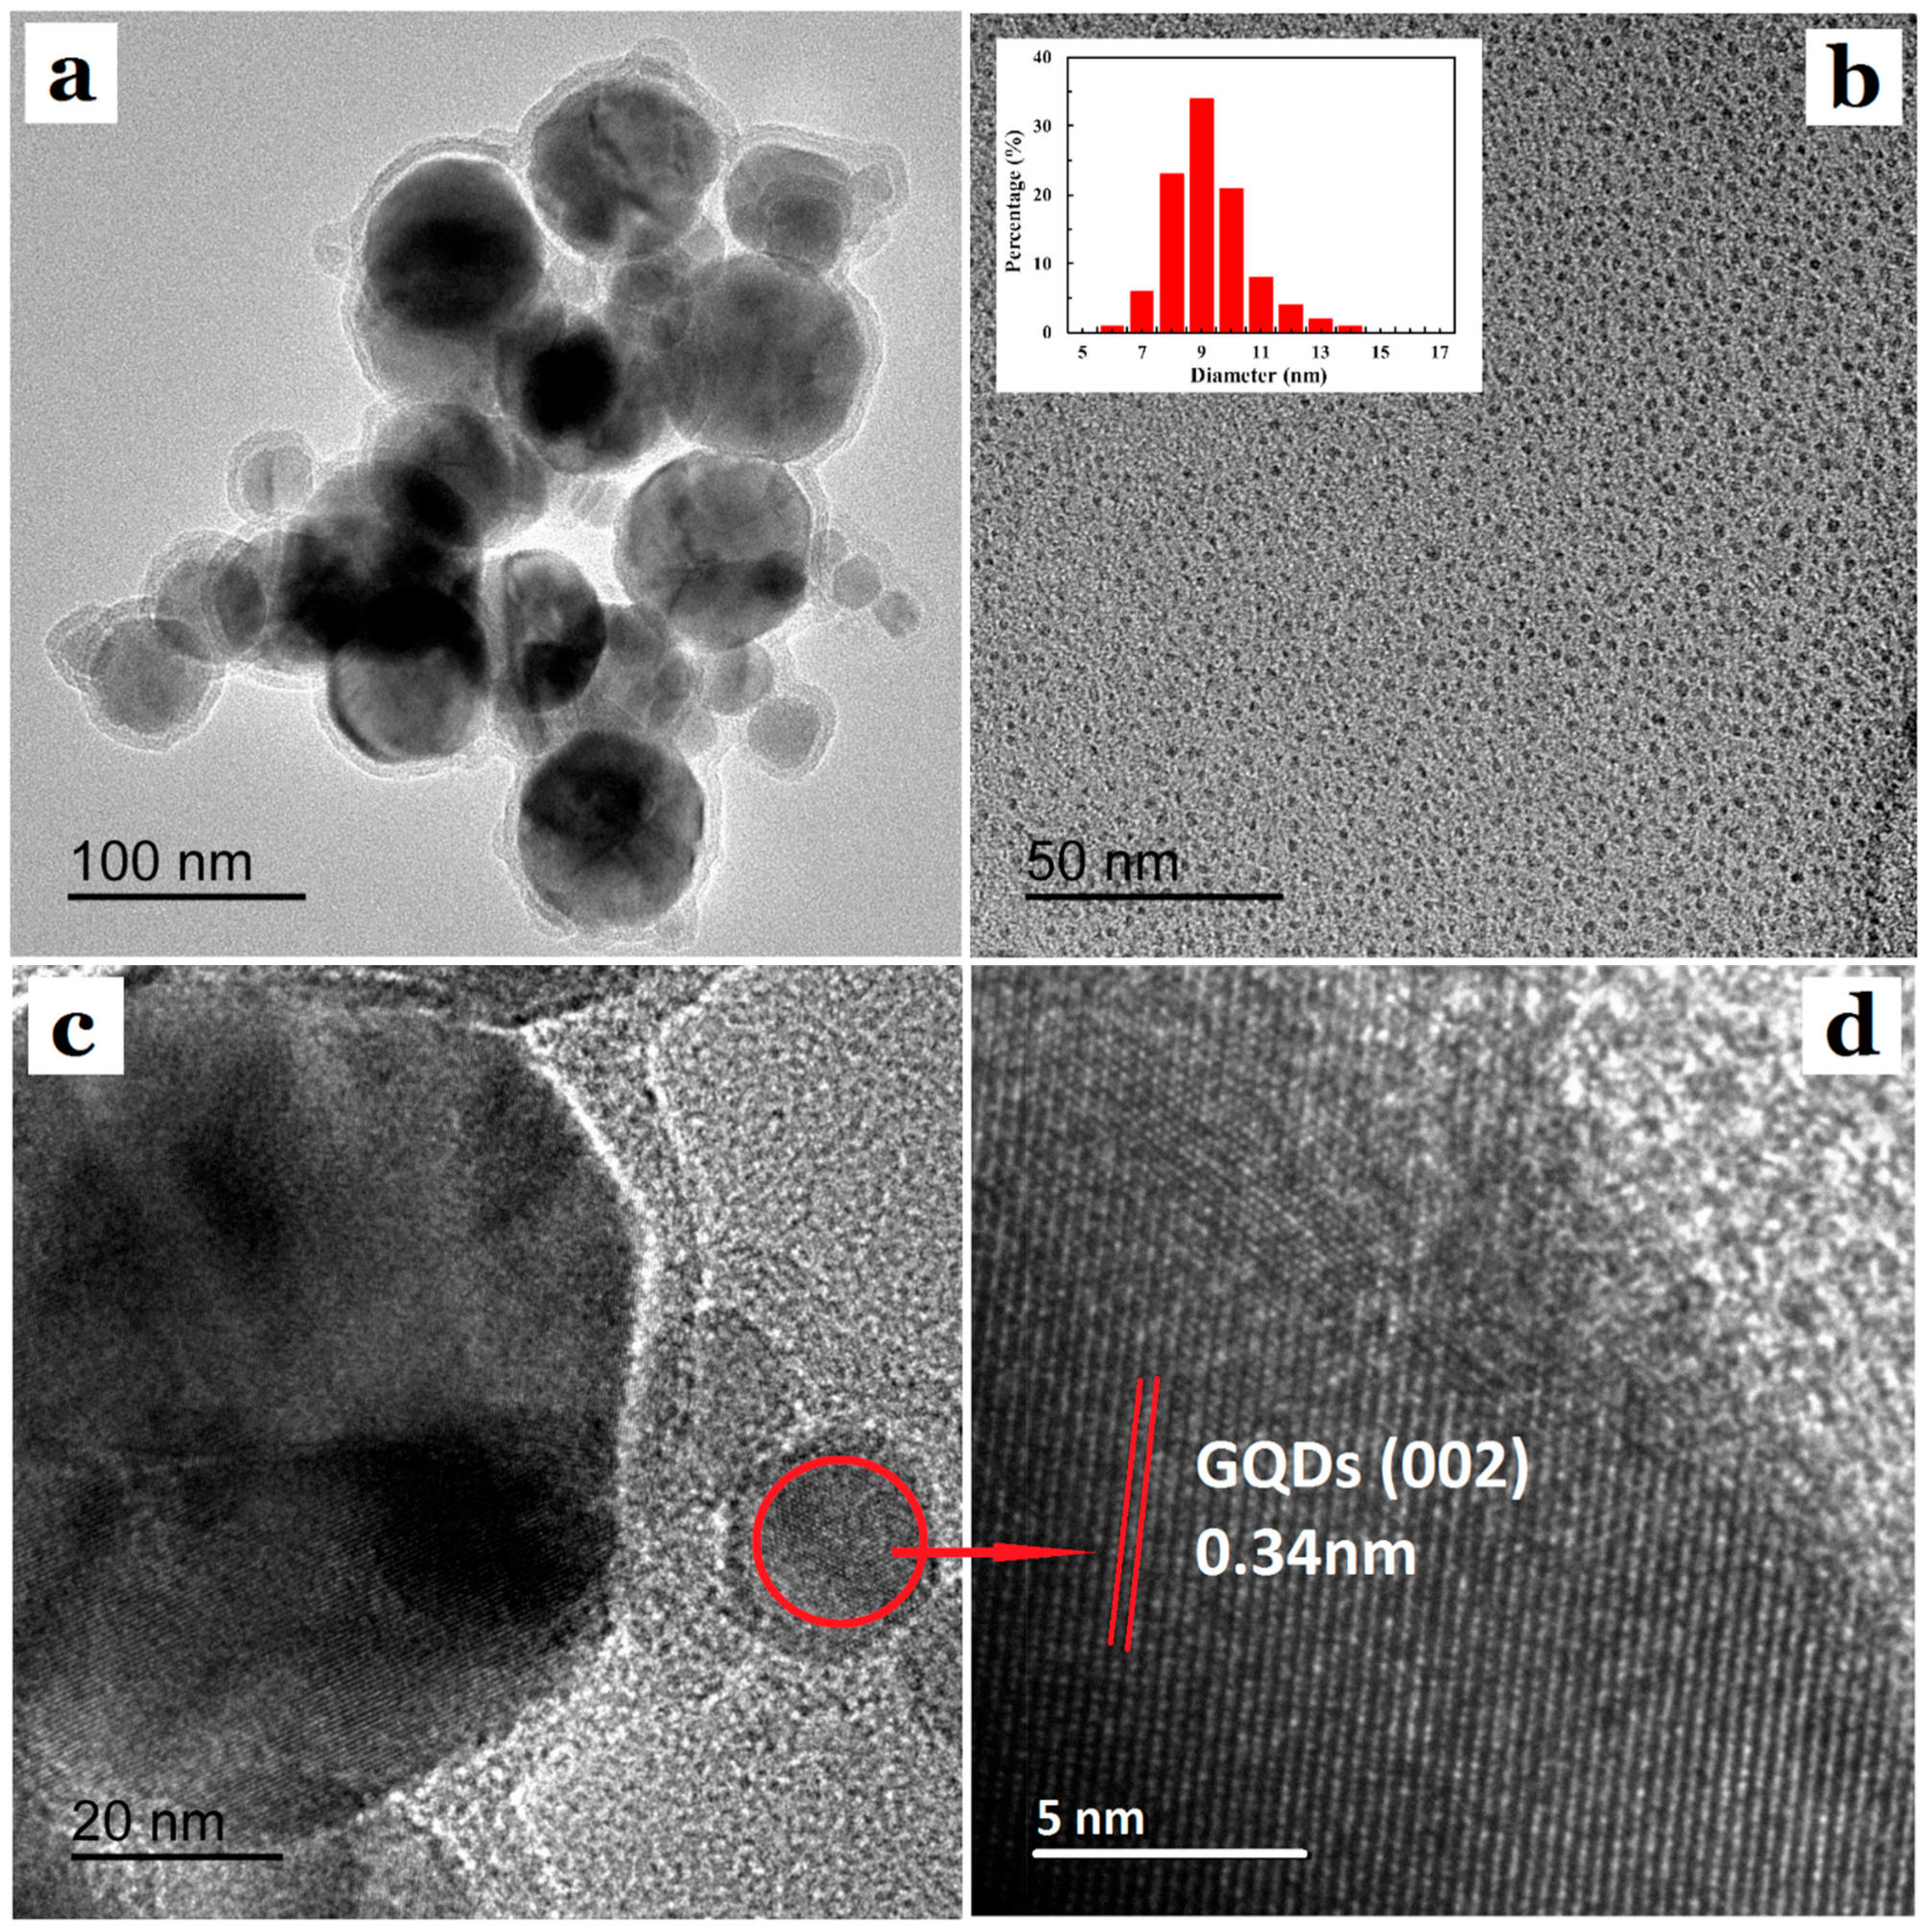
3.1. Morphology Analysis of GQDs@ZIF-8 Composites

The morphology and microstructure images of GQDs@ZIF-8 composites are shown in Figure 2. From the TEM images of GQDs@ZIF-8 shown in Figure 2a, it can be seen that the composite presents a regular structure with a uniform distribution and tight connection. Figure 2b shows the TEM image of the GQDs, in which the insert picture is the particle size distribution diagram of the GQDs, revealing that the GQD particles are evenly distributed without obvious agglomeration. From the insert picture, it can be seen that the particle size distribution range of the GQDs is 5–15 nm. Figure 2c shows the HRTEM image of GQDs@ZIF-8, which reveals that GQDs@ZIF-8 exhibits an obvious core-shell structure, indicating that GQDs are successfully assembled on the surface of ZIF-8. The average particle size of the composite is approximately 90 nm. Figure 2d presents the HRTEM image of a signal GQD. It can be observed that the lattice stripe spacing of a single GQD is 0.34 nm, which corresponds to the (002) crystal plane of graphite. The morphology and microstructure analysis results prove the successful synthesis of GQDs@ZIF-8 composites. This core-shell structure of composites can provide enormous specific surface area and remarkably increase the active adsorption sites and, hence, improve the VOC adsorption capacity of the GQDs@ZIF-8 composite significantly.

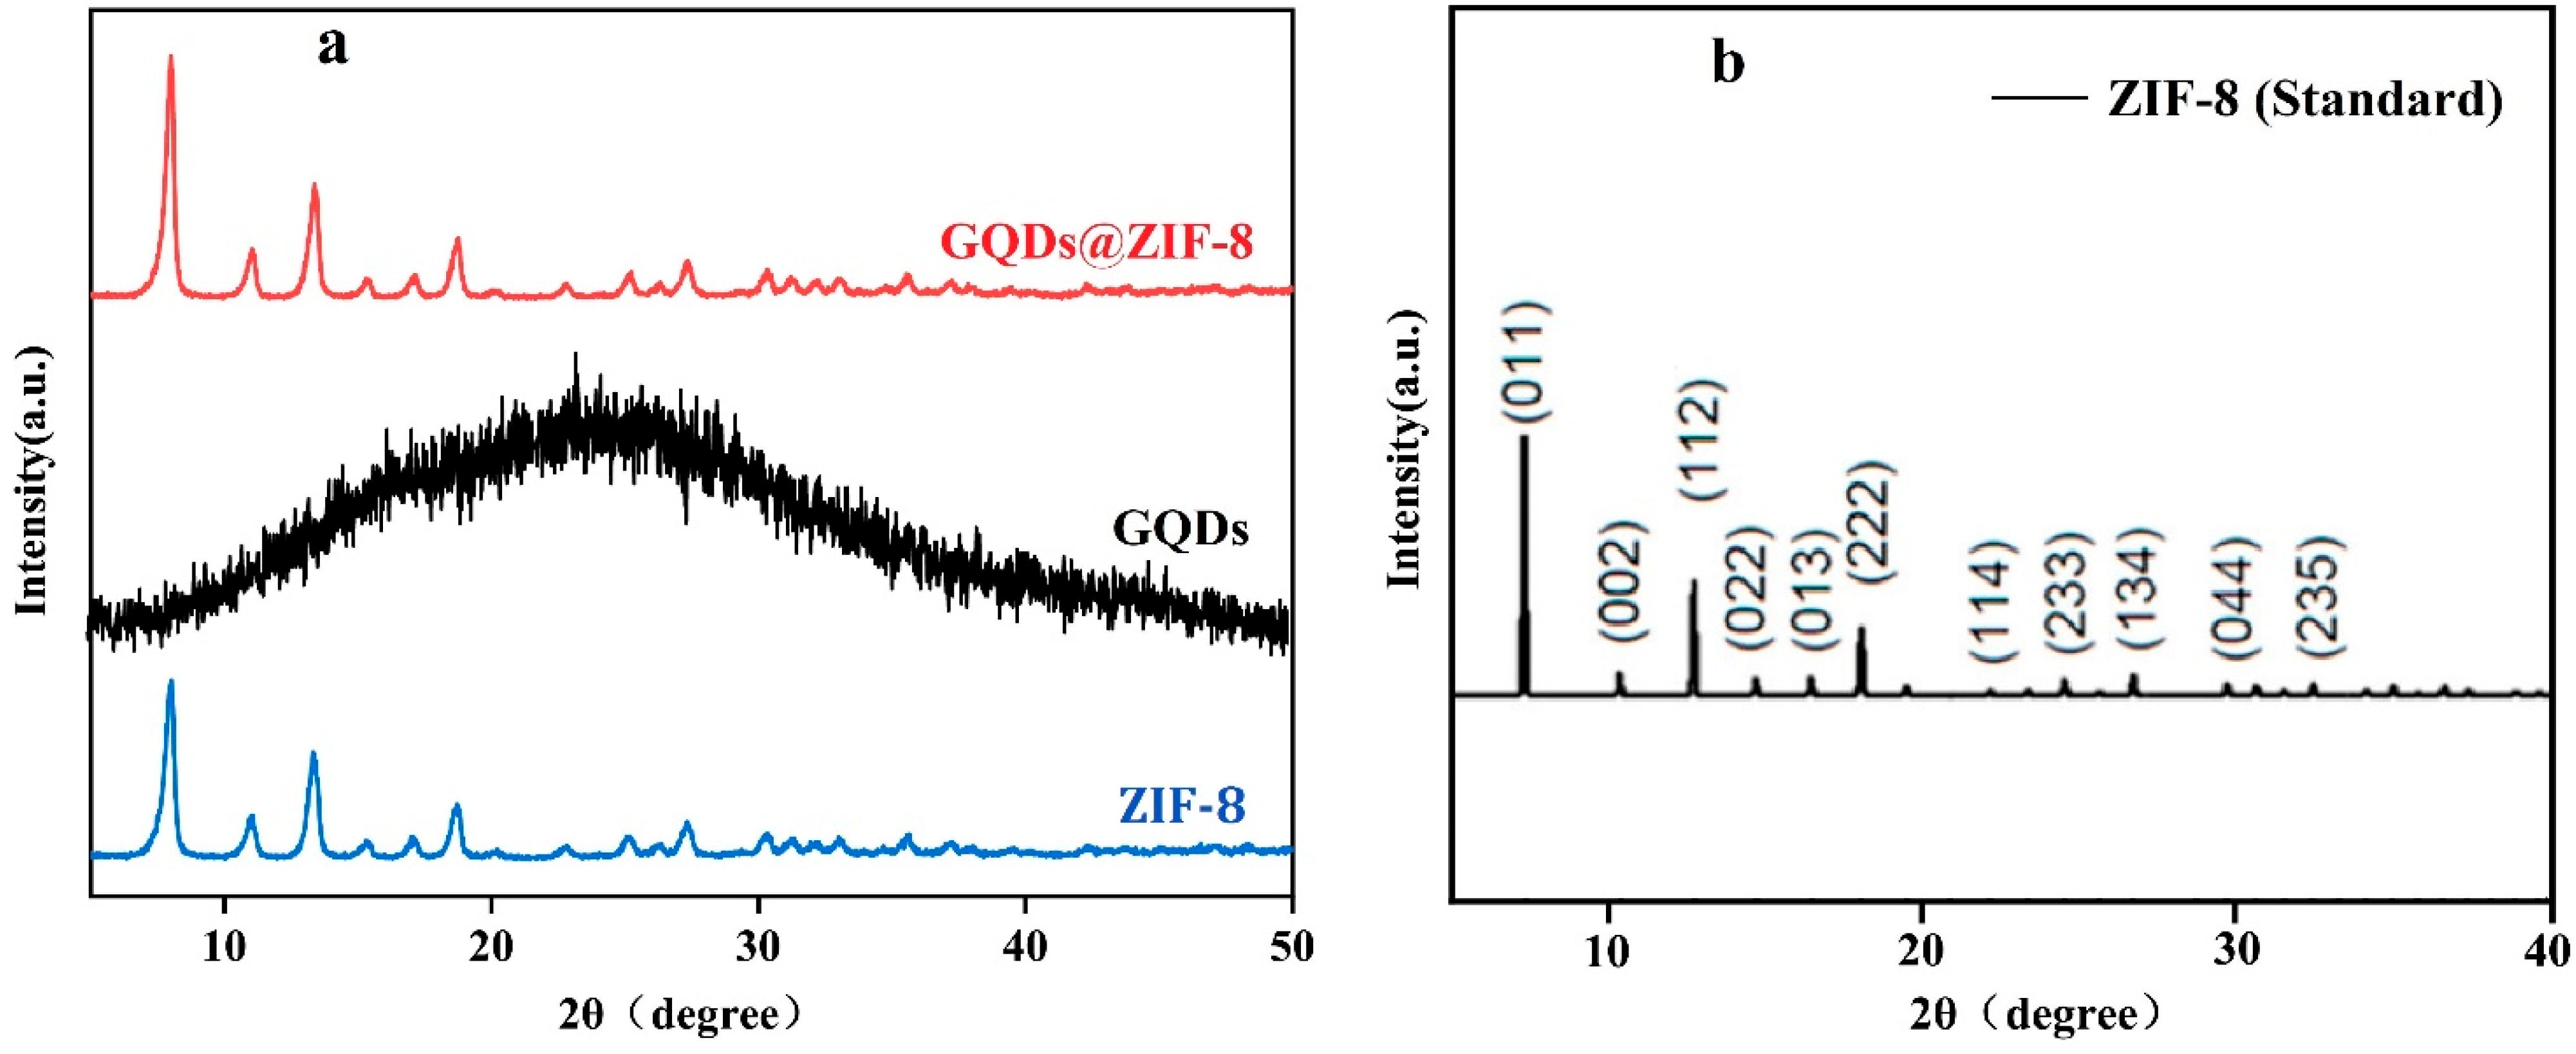
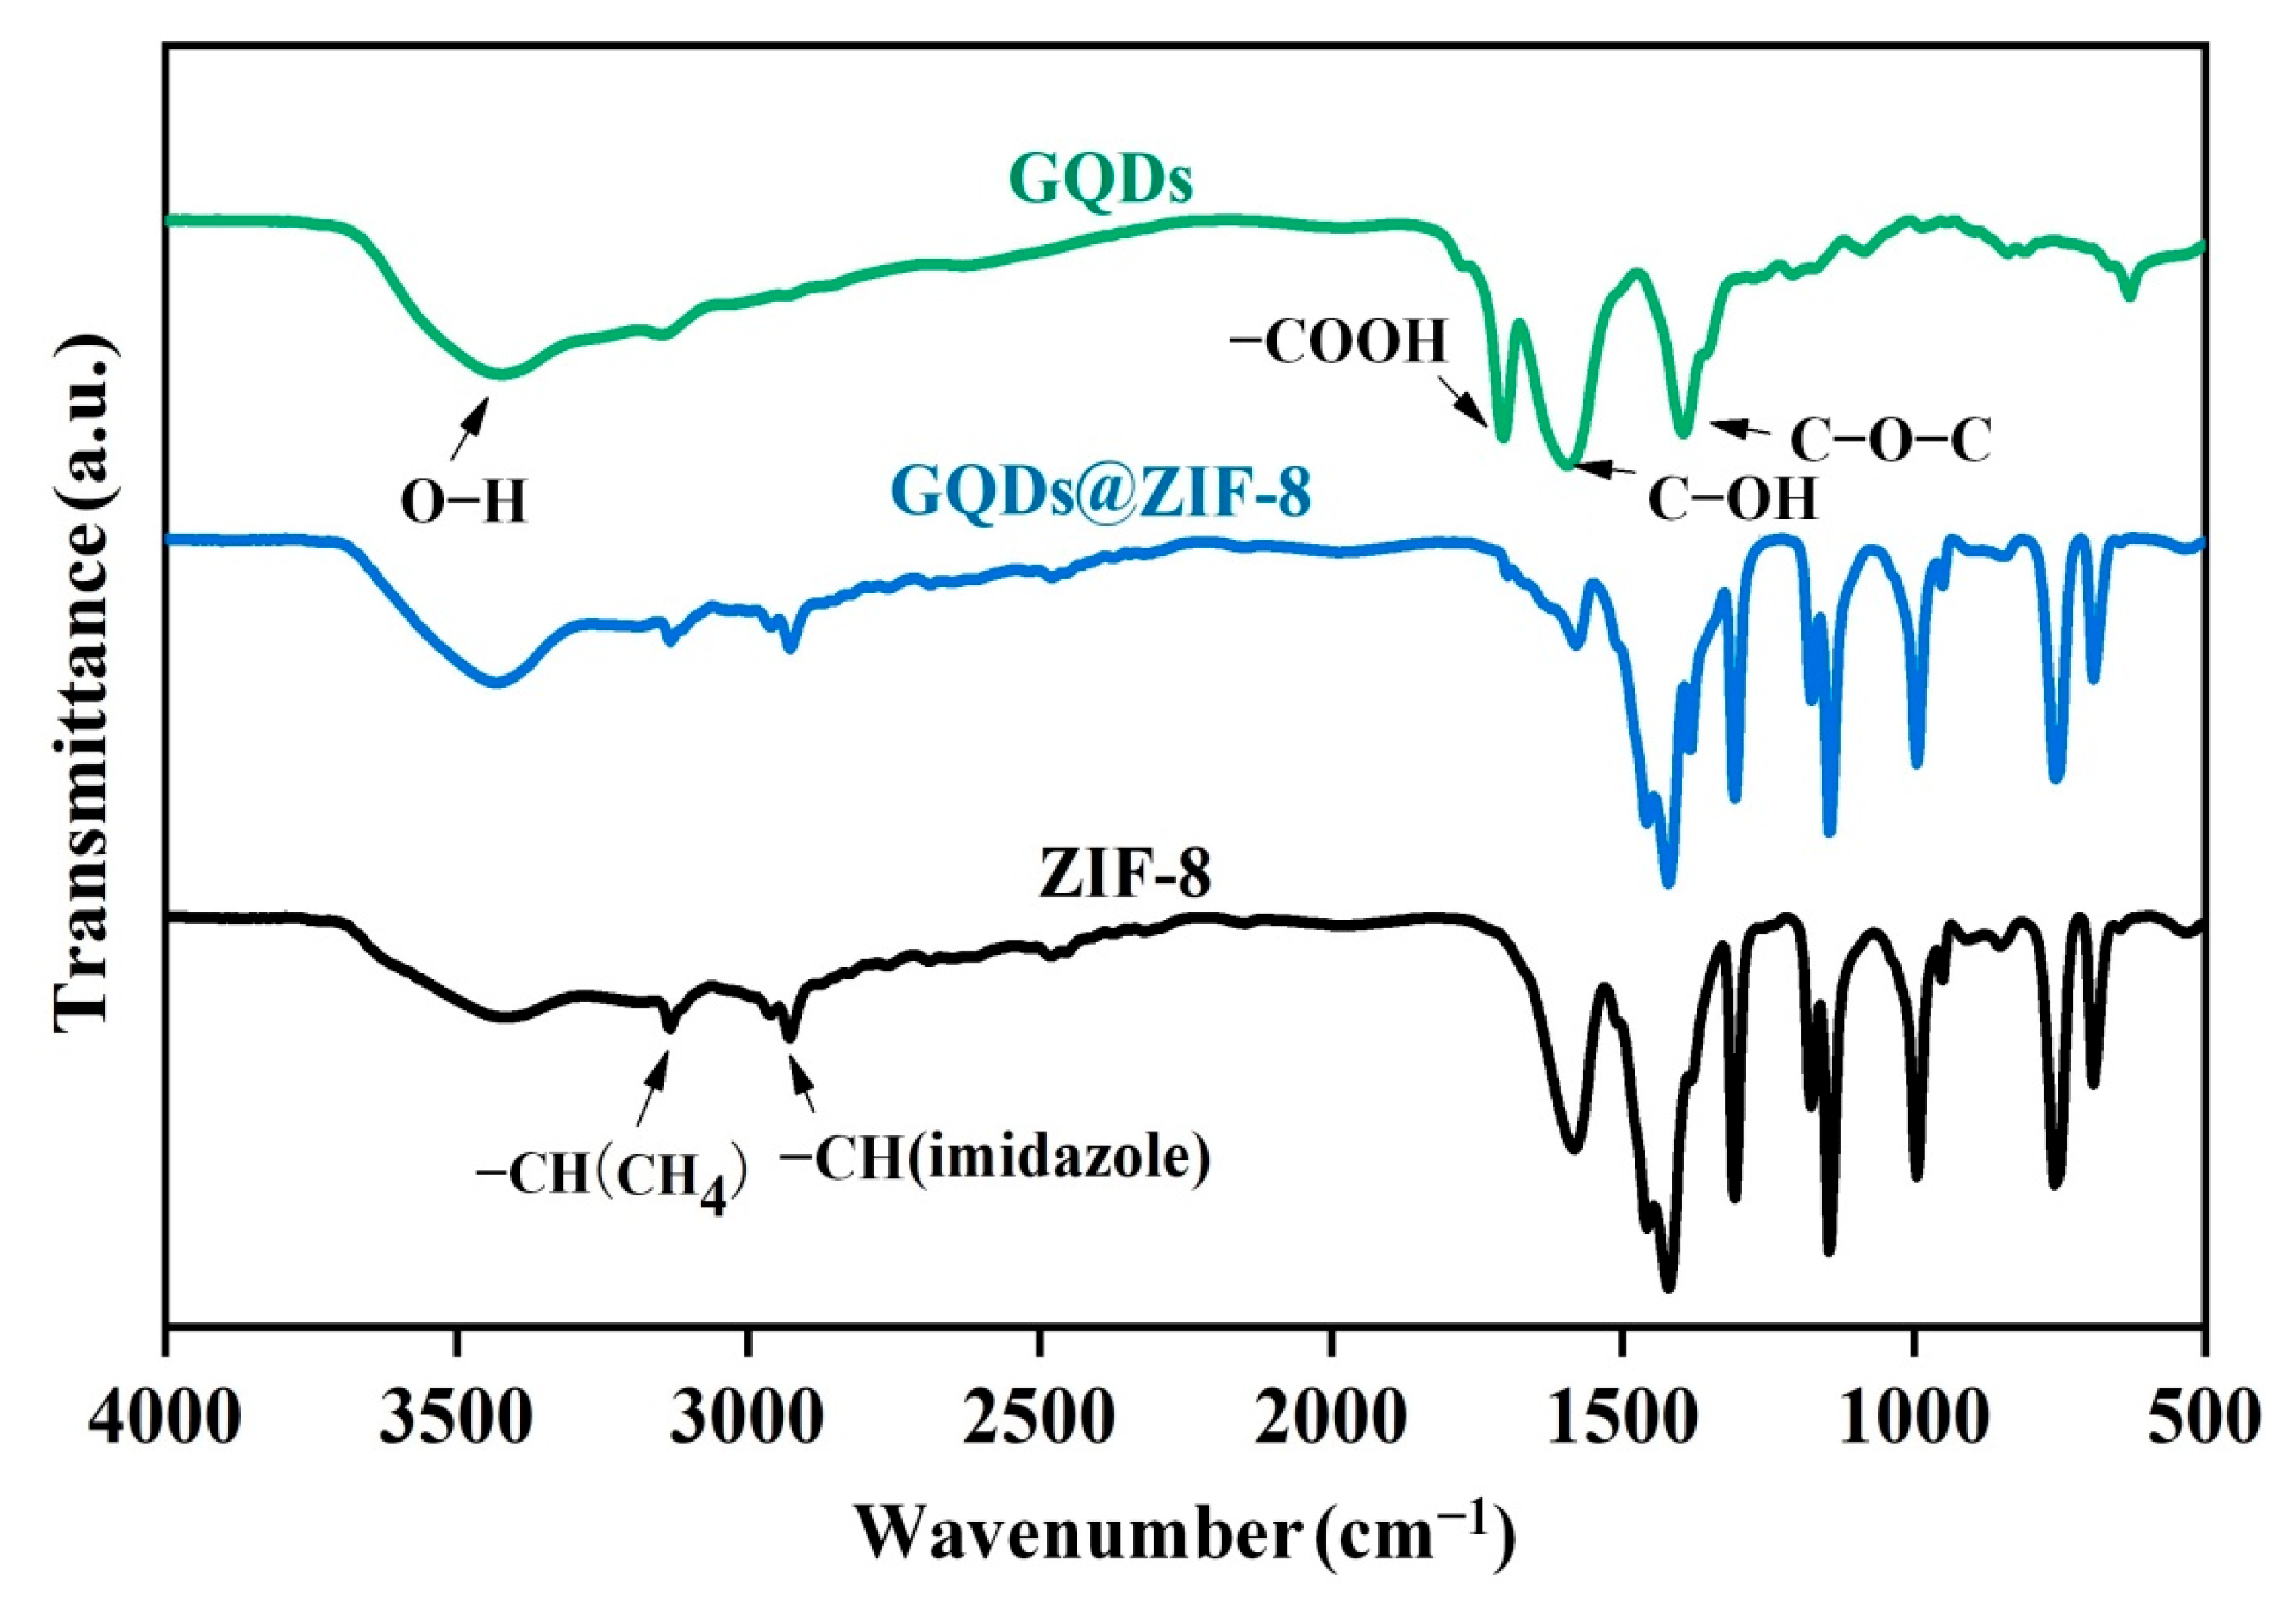
3.2. Crystalline Structure and Chemical Bond Analysis of GQDs@ZIF-8 Composites

Figure 3 exhibits the measured XRD pattern of the composites and the standard XRD pattern of ZIF-8. The XRD pattern of GQDs@ZIF-8 is similar to that of pure ZIF-8, and the diffraction peaks of ZIF-8 and GQDs@ZIF-8 are consistent with the standard peaks of ZIF-8 (Figure 3b) [34]. The 2θ values of the strong diffraction peaks are 7.3°, 10.3°, 12.7°, 14.7°, 16.4°, 18°, 24.6° and 26.7°, which correspond to the (011), (002), (112), (022), (013), (222), (233) and (134) planes of ZIF-8, respectively. In addition, the diffraction peak shape of GQDs@ZIF-8 changes due to the introduction of GQDs, and the pattern of the composite does not show the characteristic peak (25°) of the GQDs, which is due to the high dispersion and low content of GQDs in the composites. A similar phenomenon was also reported by another study on graphene oxide/ZIF-8 composites [35].
The results of FT-IR spectroscopy in Figure 4 also confirm the interaction between ZIF-8 and GQDs in the GQDs@ZIF-8 composites. It is obvious that the infrared spectrum of GQDs@ZIF-8 is similar to that of ZIF-8. Most absorption bands of ZIF-8 and GQDs@ZIF-8 are related to the vibration of the imidazole unit. For example, the absorption peak at 1575 cm−1 is attributed to the stretching vibration of the C=N bond, the absorption peak in the range of 1350−1500 cm−1 is related to the stretching vibration of the imidazole ring and the strong absorption peaks at 1145 cm−1 and 994 cm−1 are attributed to the stretching vibration of the C−N bond in the imidazolyl group [36]. The infrared spectra of ZIF-8@GQD also reveal that it contains not only the absorption peaks of ZIF-8, but also the characteristic peaks from the GQDs, such as the stretching vibration of the C=O bond at 1728 cm−1 and the stretching deformation vibration of the C–OH bond at 1620 cm−1 [37]. These results confirm that GQDs are decorated on the structure of ZIF-8.

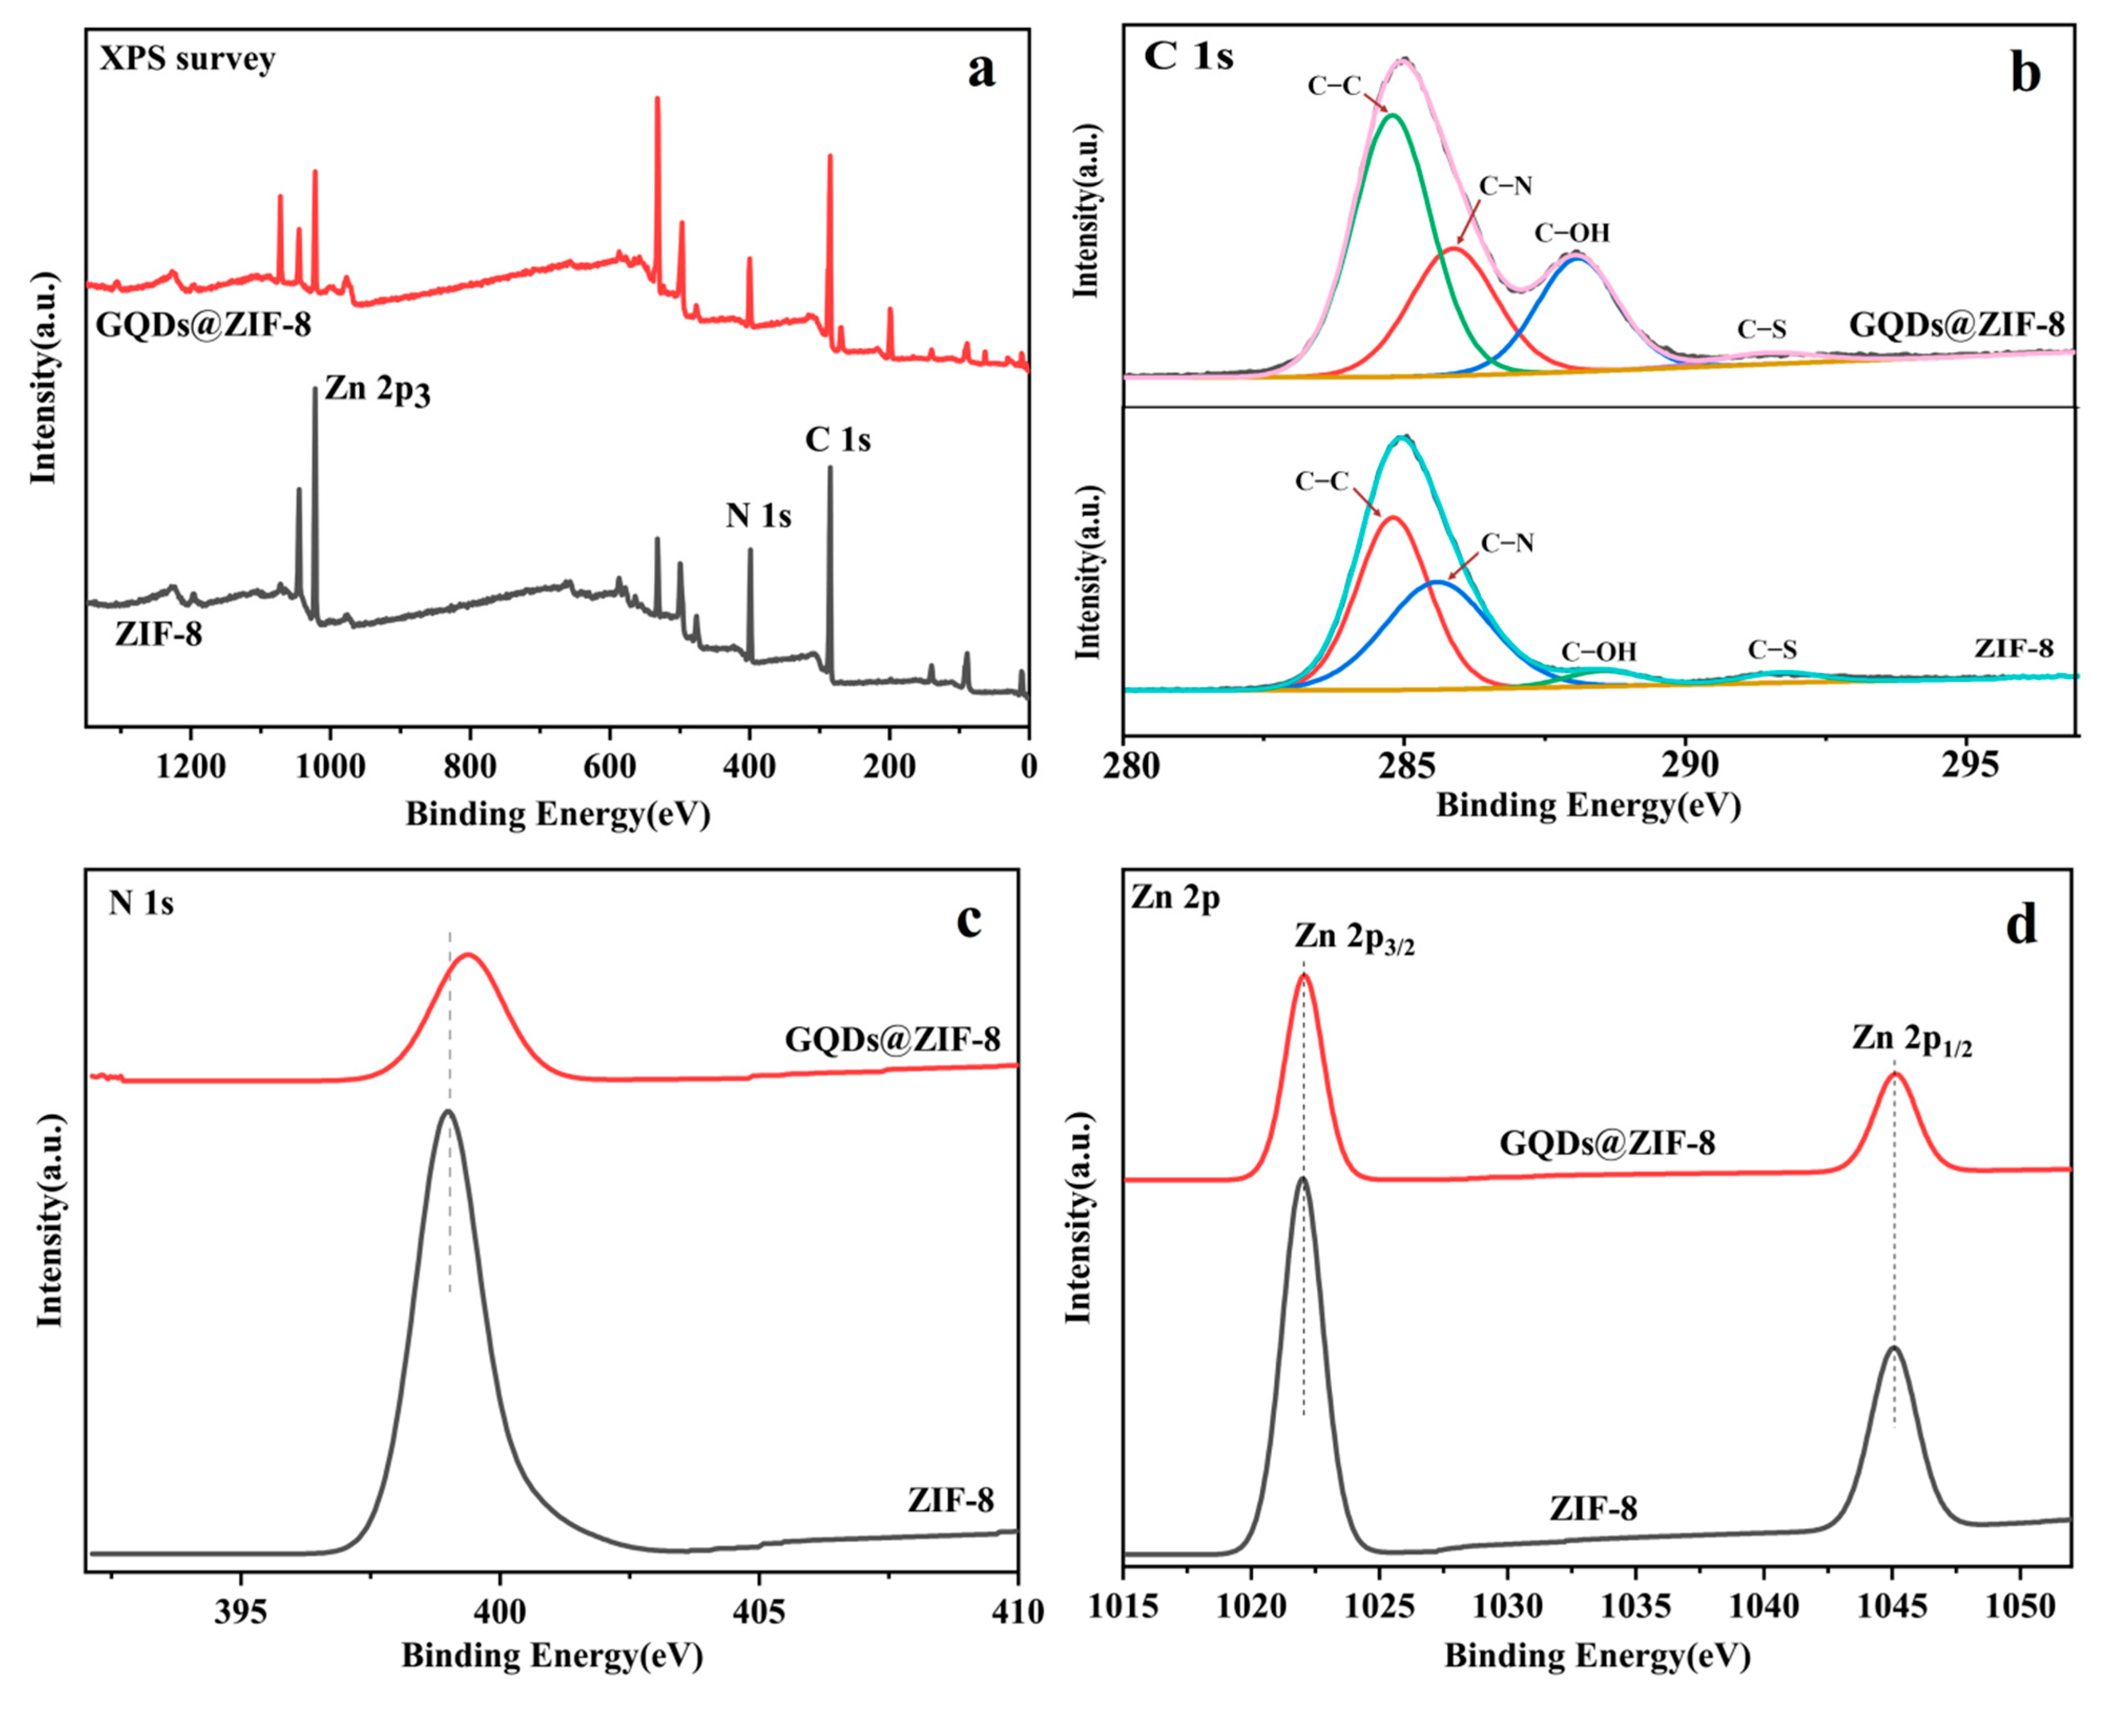
3.3. Chemical Components Analysis of GQDs@ZIF-8 Composites

XPS analysis was performed to determine the elemental composition of the GQDs@ZIF-8 composites and the chemical states of specific elements, as shown in Figure 5. The full spectrum scans of ZIF-8 and GQDs@ZIF-8 are shown in Figure 5a, revealing that the characteristic absorption peaks of Zn 2p3, N 1s and C 1s appear at 1022.08 eV, 399.08 eV and 285.08 eV, respectively. The characteristic peaks demonstrate the presence of the elements necessary for the formation of GQDs@ZIF-8 [38]. The high-resolution C 1s spectrum in Figure 5b shows four different types of characteristic peaks of C–C, C–N, C–O and C–S, which correspond to 284.8 eV, 285.59 eV, 288.53 eV and 291.72 eV, respectively. In particular, due to the addition of GQDs, the C–S characteristic peaks representing GQDs appear in the spectrum of the GQDs@ZIF-8 composites. Figure 5c shows the symmetrical peak of N 1s at 399.8 eV corresponding to 2-methylimidazole [39,40]. Figure 5d reveals that the Zn 2p spectrum has two strong peaks at 1022 eV and 1045.07 eV, corresponding to 2p3/2 and 2p1/2, respectively [41]. When GQDs are loaded on the surface of ZIF-8, the position of the peak corresponding to Zn 2p shifts to the low binding energy region by 0.25 eV. This phenomenon indicates that, due to the modification of GQDs, the Zn oxidation degree is reduced, resulting in an increase in the electron density on Zn, which reveals that Zn is involved in the interaction of the two components [42]. XPS analysis confirmed the connection of the GQDs to ZIF-8.

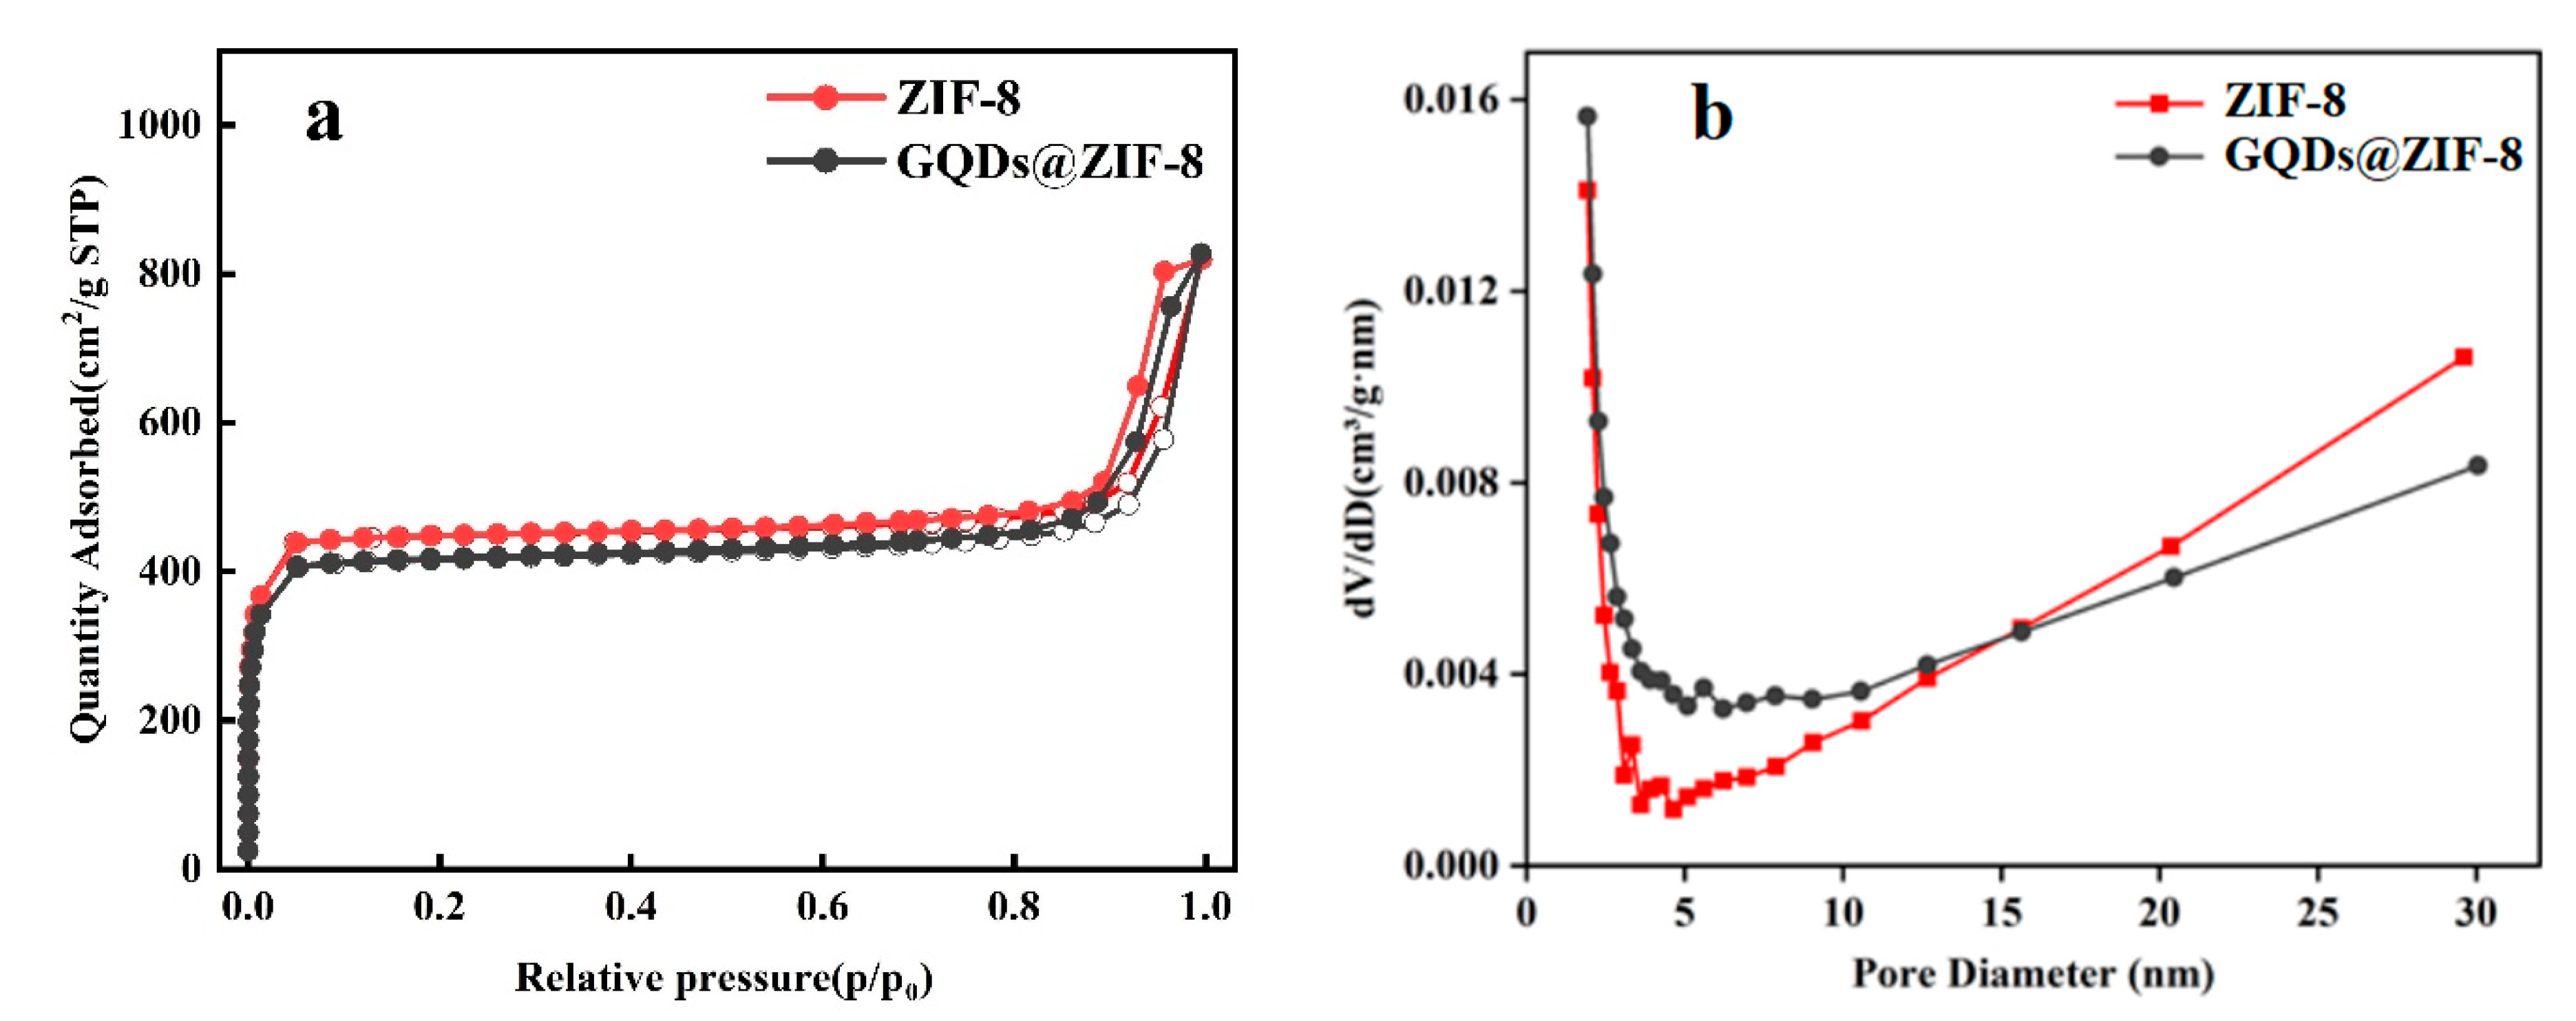
3.4. Specific Surface Area and Pore Structure Analysis of GQDs@ZIF-8 Composites

The N2 adsorption-desorption isotherms and pore size distribution of the composites are shown in Figure 6. The ZIF-8 and GQDs@ZIF-8 samples showed isotherm curves of type I, with a significant upward process at relatively low pressures, indicating that micropores are the dominant structure in both ZIF-8 and GQDs@ZIF-8 composites. Meanwhile, the isotherm curve shows a slight secondary rise at higher pressure (when P/P0 = 0.9), indicating the existence of mesopores in the structure of the samples. The calculated specific surface area and pore structure parameters of ZIF-8 and GQDs@ZIF-8 are shown in Table 1. The specific surface area and average pore diameter of ZIF-8 are 1368.74 m2/g and 3.7 nm, respectively. After the addition of GQDs, the specific surface area of the GQDs@ZIF-8 composites decreases slightly to 1312.05 m2/g, with an average pore diameter of 3.9 nm, which reveals that the addition of GQDs can regulate the structure of GQDs@ZIF-8 composites. On the one hand, the increase in GQDs relatively reduces the number of pores per unit mass of the composite; on the other hand, GQDs attached to the surface of ZIF-8 can block the micropores of the composite. However, the pore size of the composites is close to that of ZIF-8, and it can be concluded that GQDs have been successfully introduced into the ZIF-8 structure, which is mutually confirmed by the above characterizations.

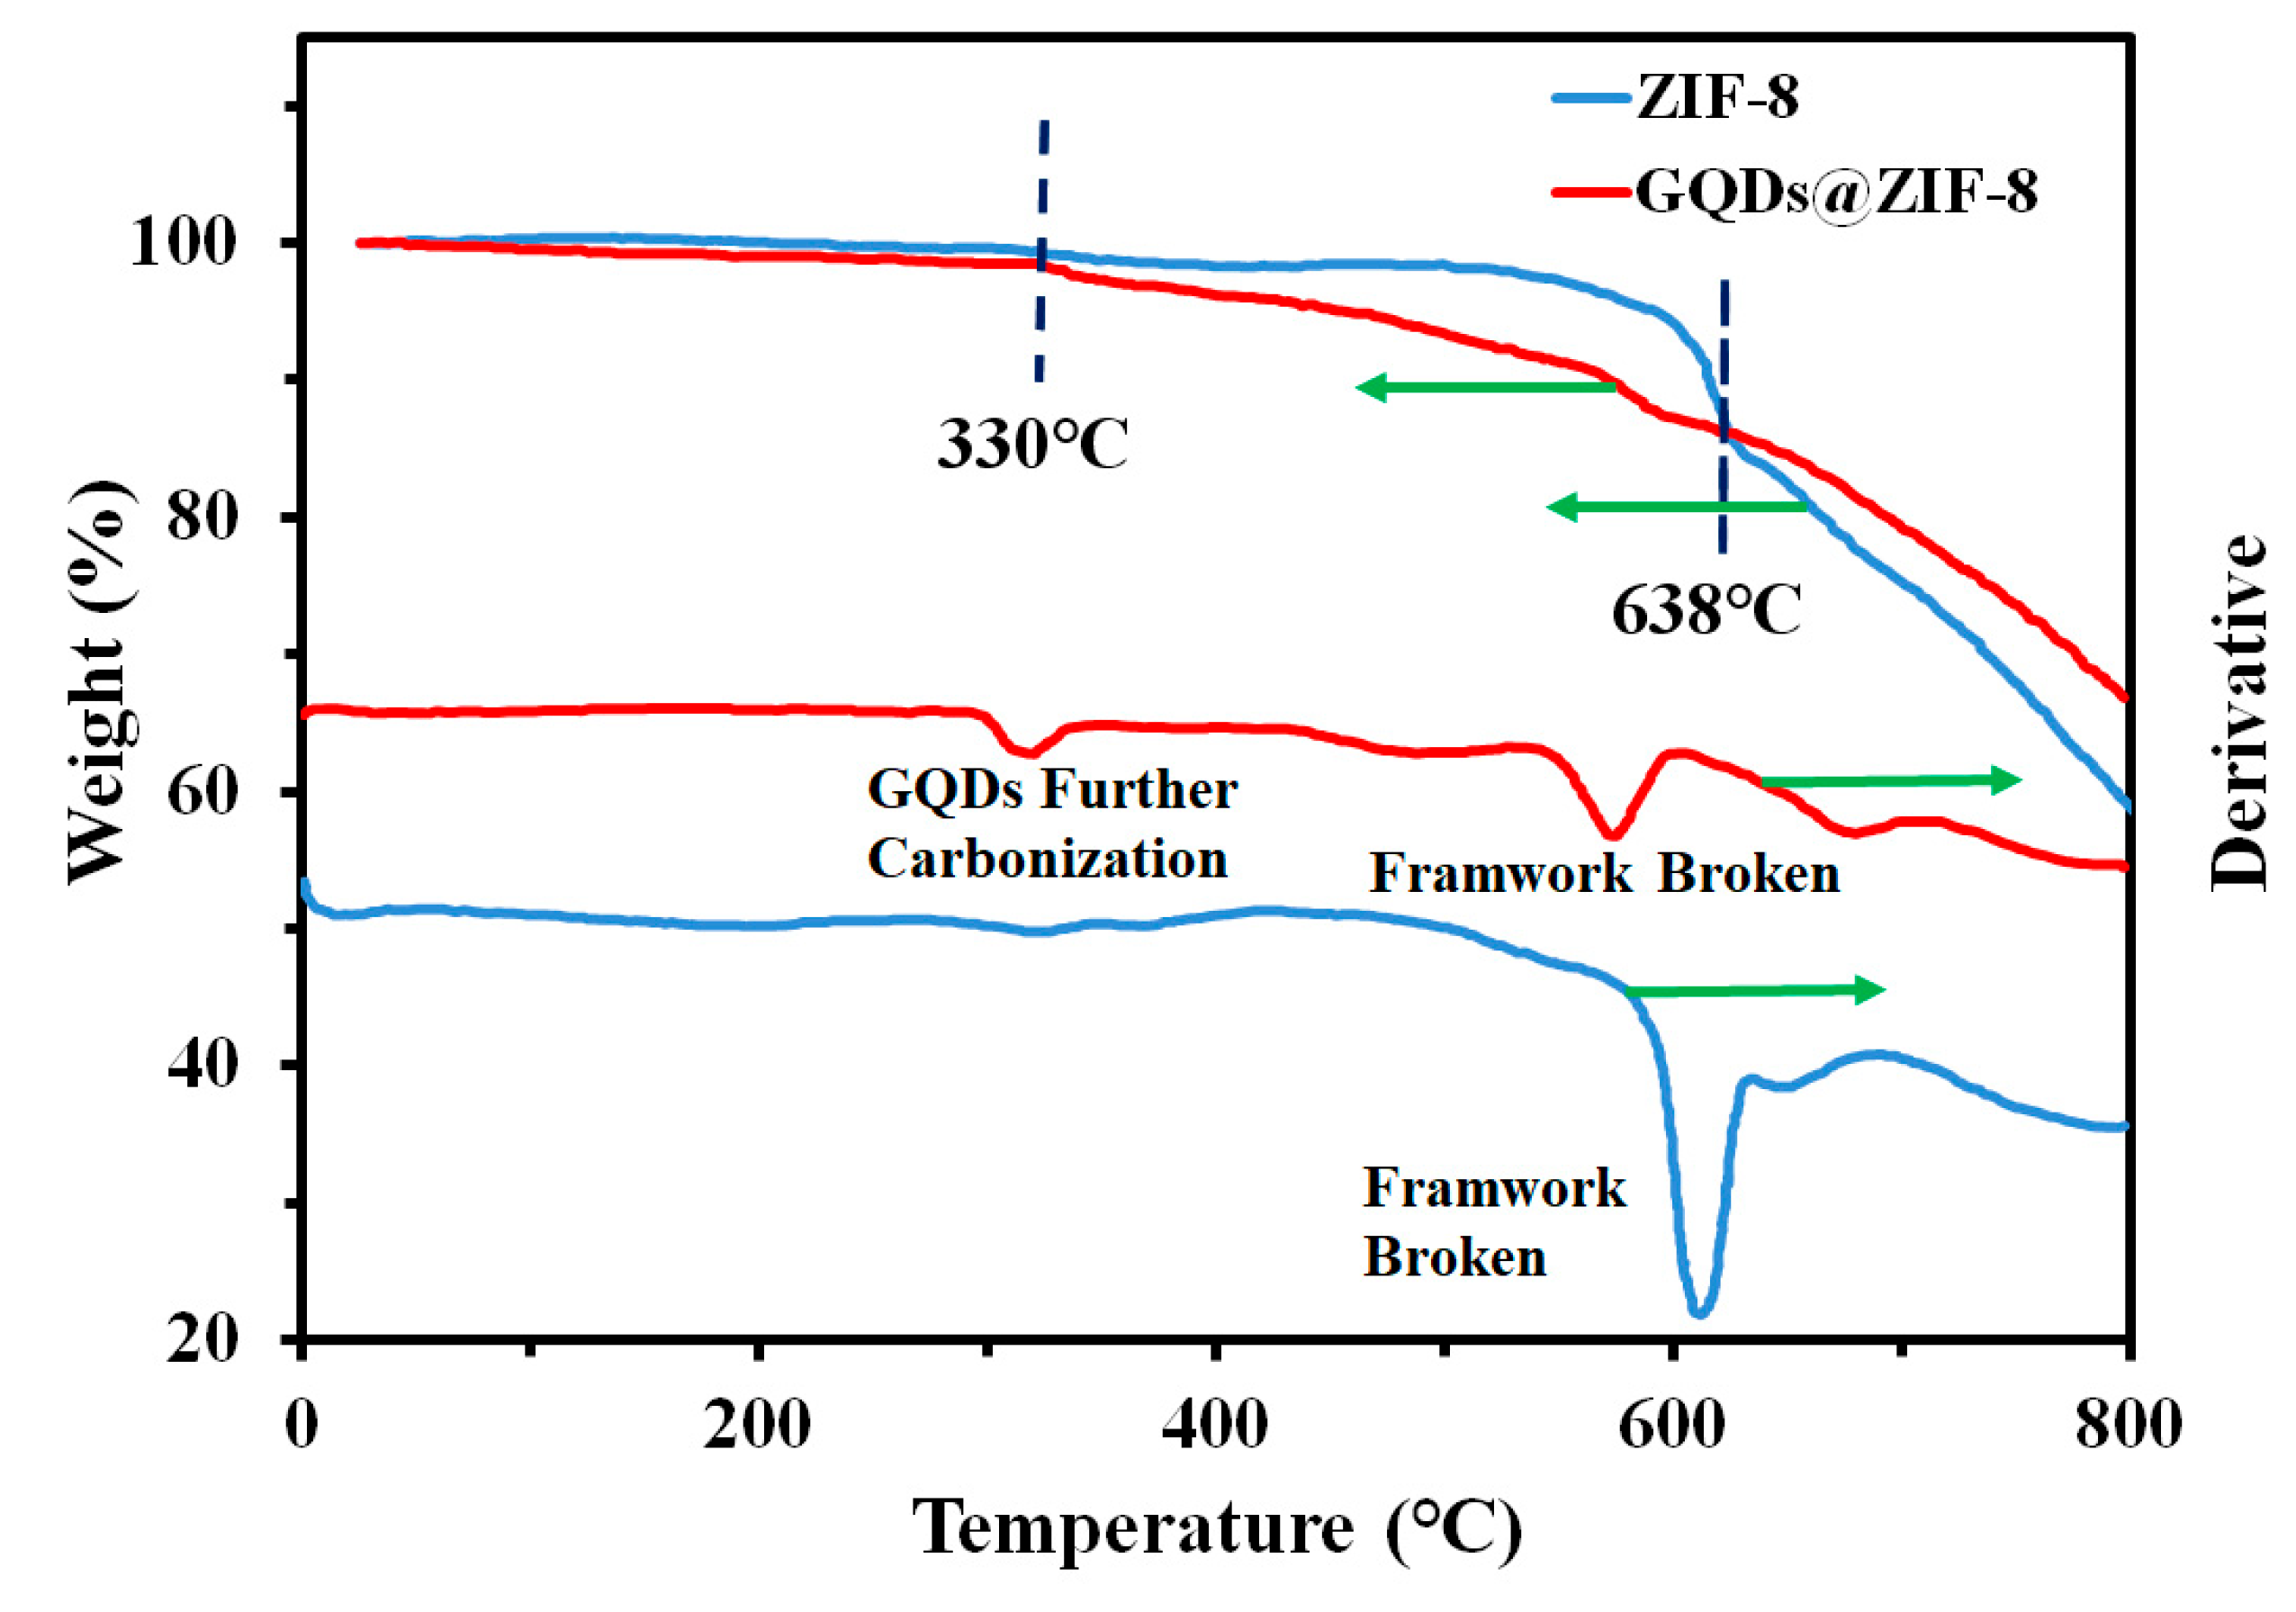
3.5. Thermal Stability Analysis of GQDs@ZIF-8 Composites

The thermal stability of ZIF-8 and GQDs@ZIF-8 composites was tested by a TG analyzer to investigate the addition effect of GQDs. As shown in Figure 7, both samples showed high thermal stability. Before 330 °C, the samples only had slight weight loss, which is due to the evaporation of water molecules or the removal of other residual guest molecules. In sharp contrast, the weight loss rates of the two samples increased rapidly when the temperature reached approximately 600 °C, indicating that the skeleton structure of the samples was damaged and began to decompose. It is worth noting that the weight loss of GQDs@ZIF-8 is larger than that of ZIF-8 before 638 °C, whereas it is smaller than that of pure ZIF-8 after 638 °C. This is due to the further carbonization of ZIF-8 surface-loaded GQDs before 638 °C, resulting in a larger weight loss of the composite as a whole compared to pure ZIF-8, which is also reflected in Figure 7. After 638 °C, larger graphene sheets are generated from further carbonization of GQDs, covering the surface of ZIF-8 and protecting ZIF-8 from thermal decomposition. Thus, the residual weight of the composites is greater than that of pure ZIF-8. The above results reveal that GQDs improve the thermal stability of ZIF-8, which can expand the adsorption application of GQDs@ZIF-8 composites at a higher temperature.

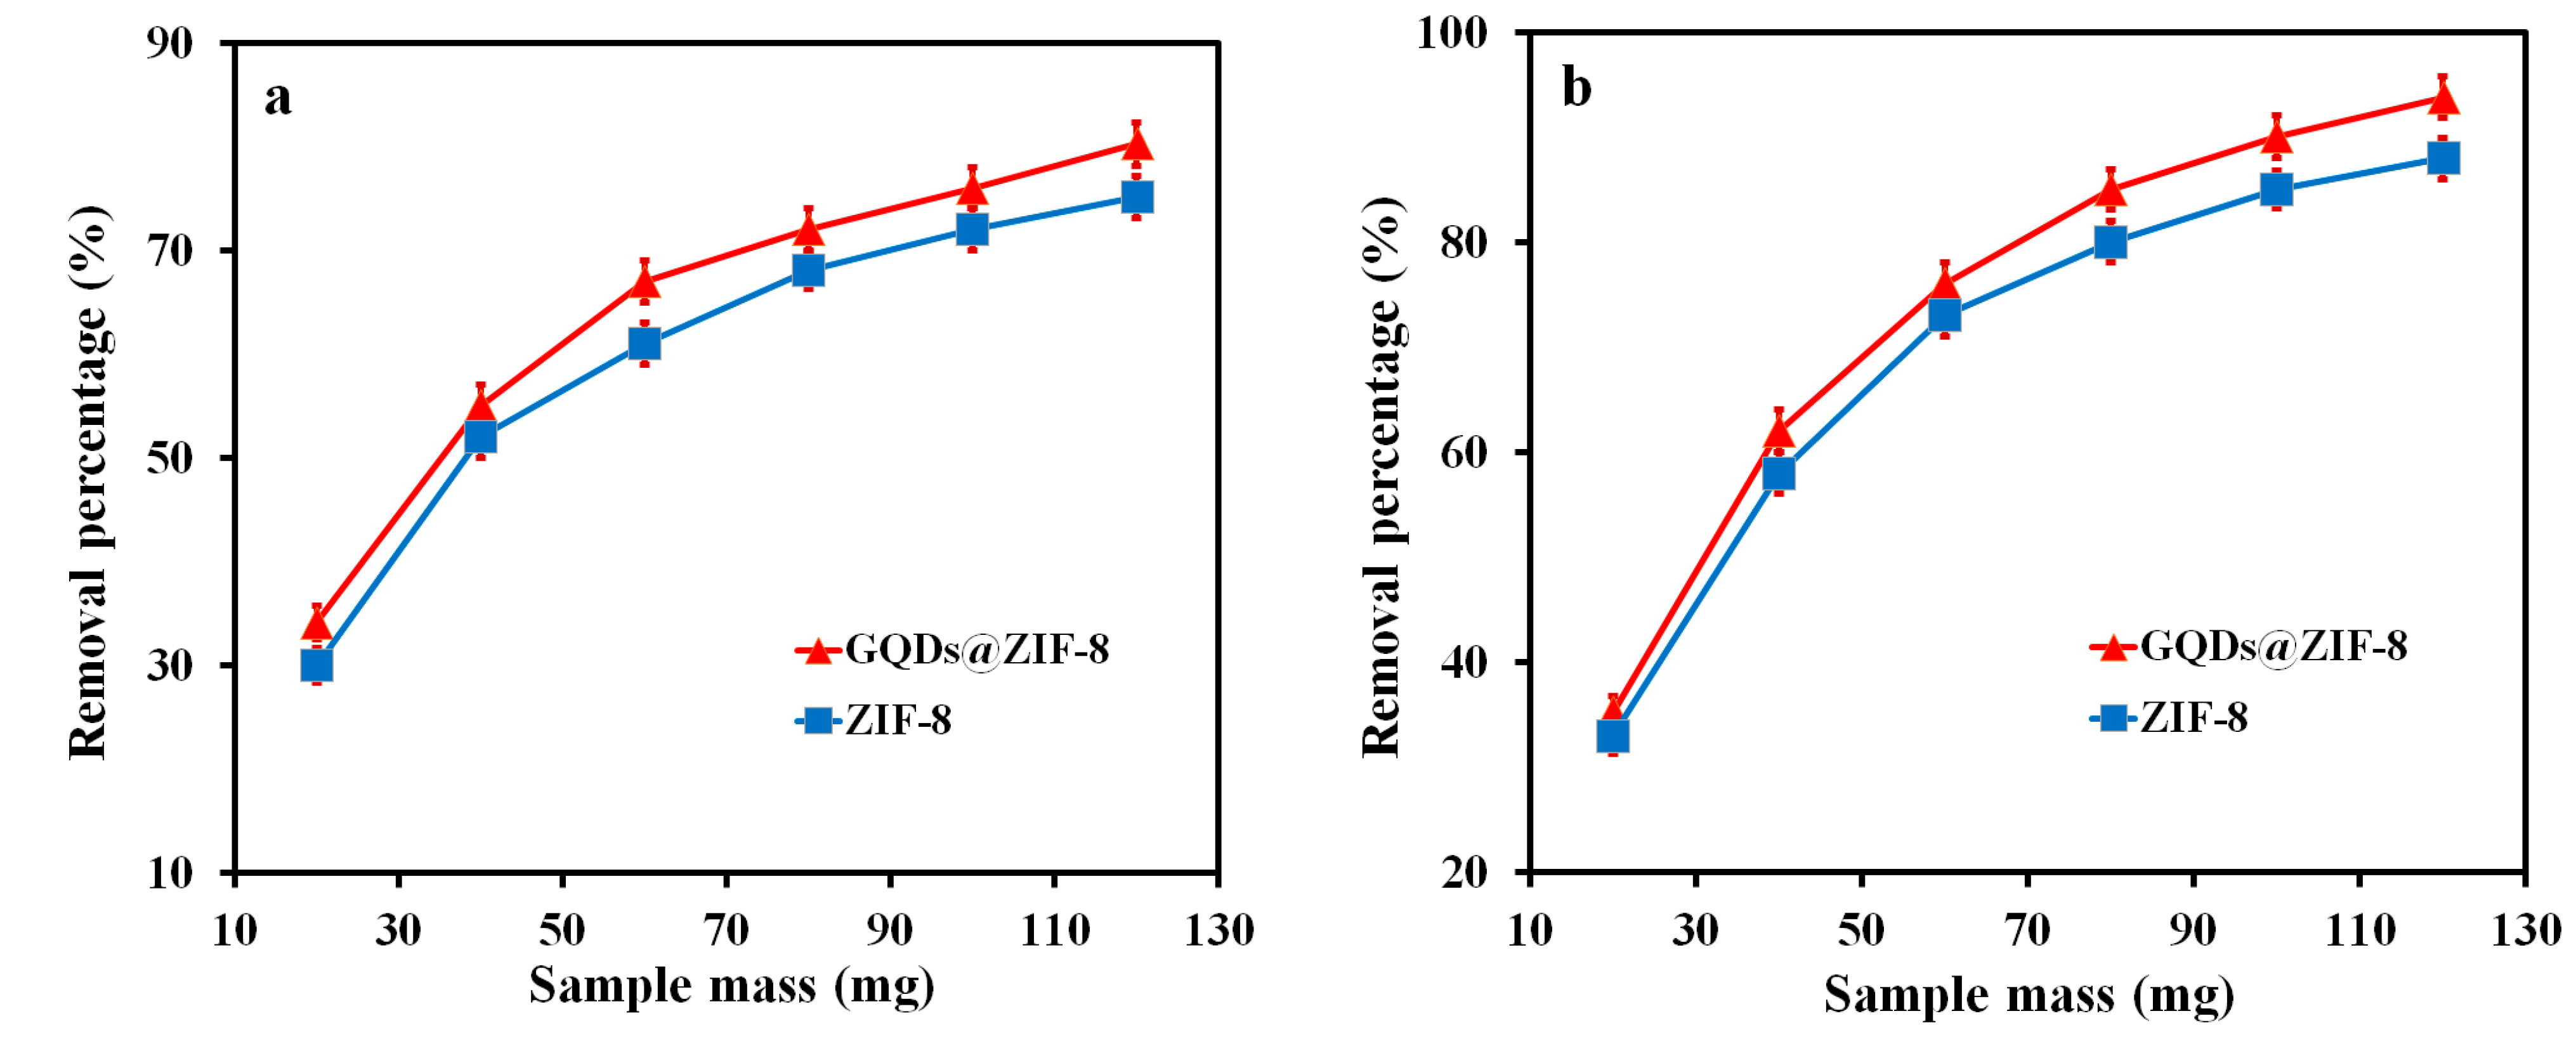
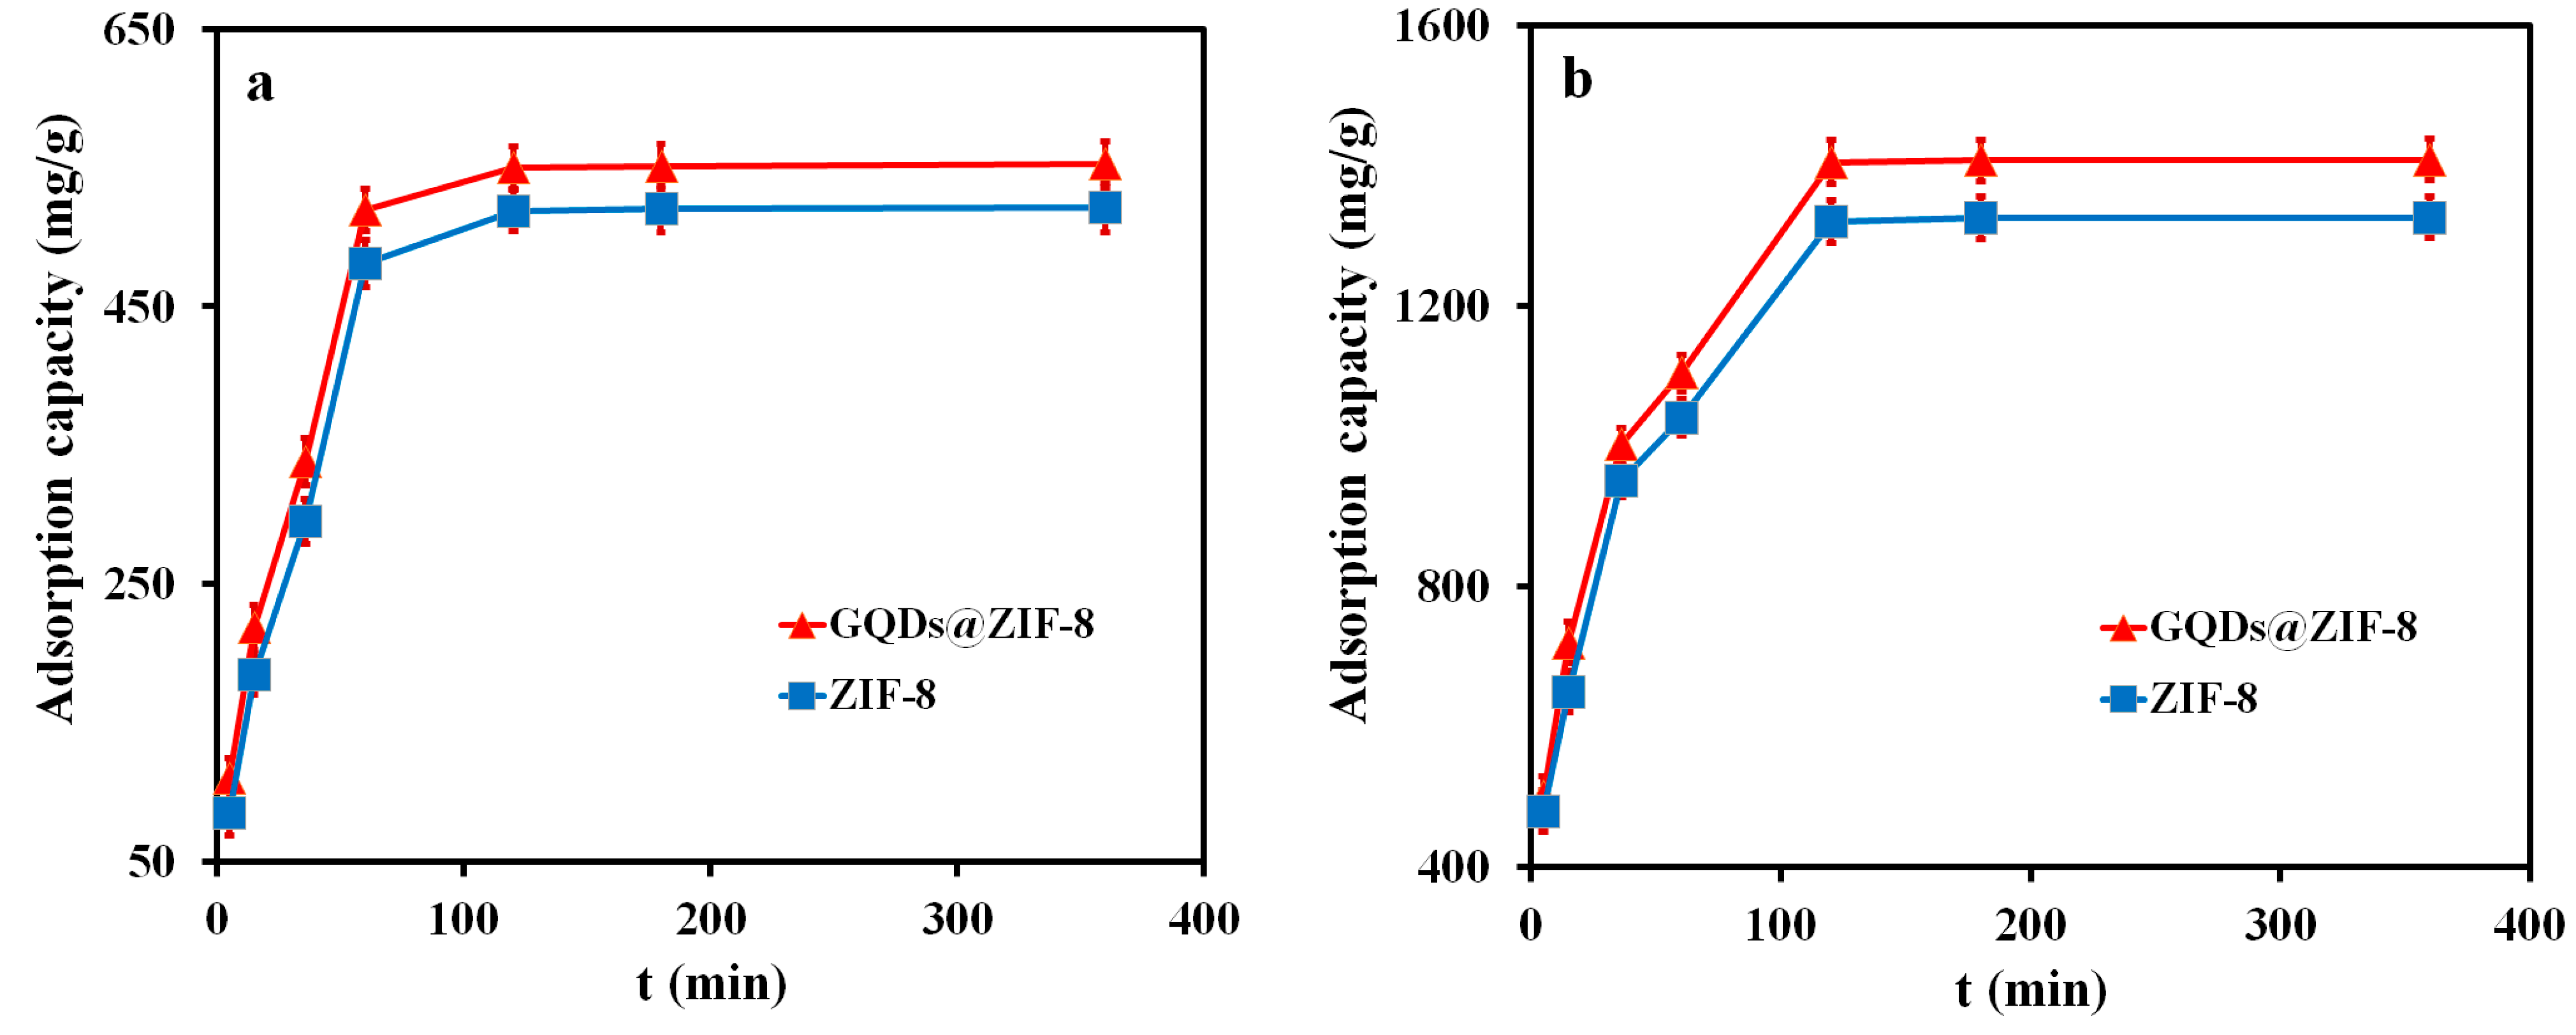
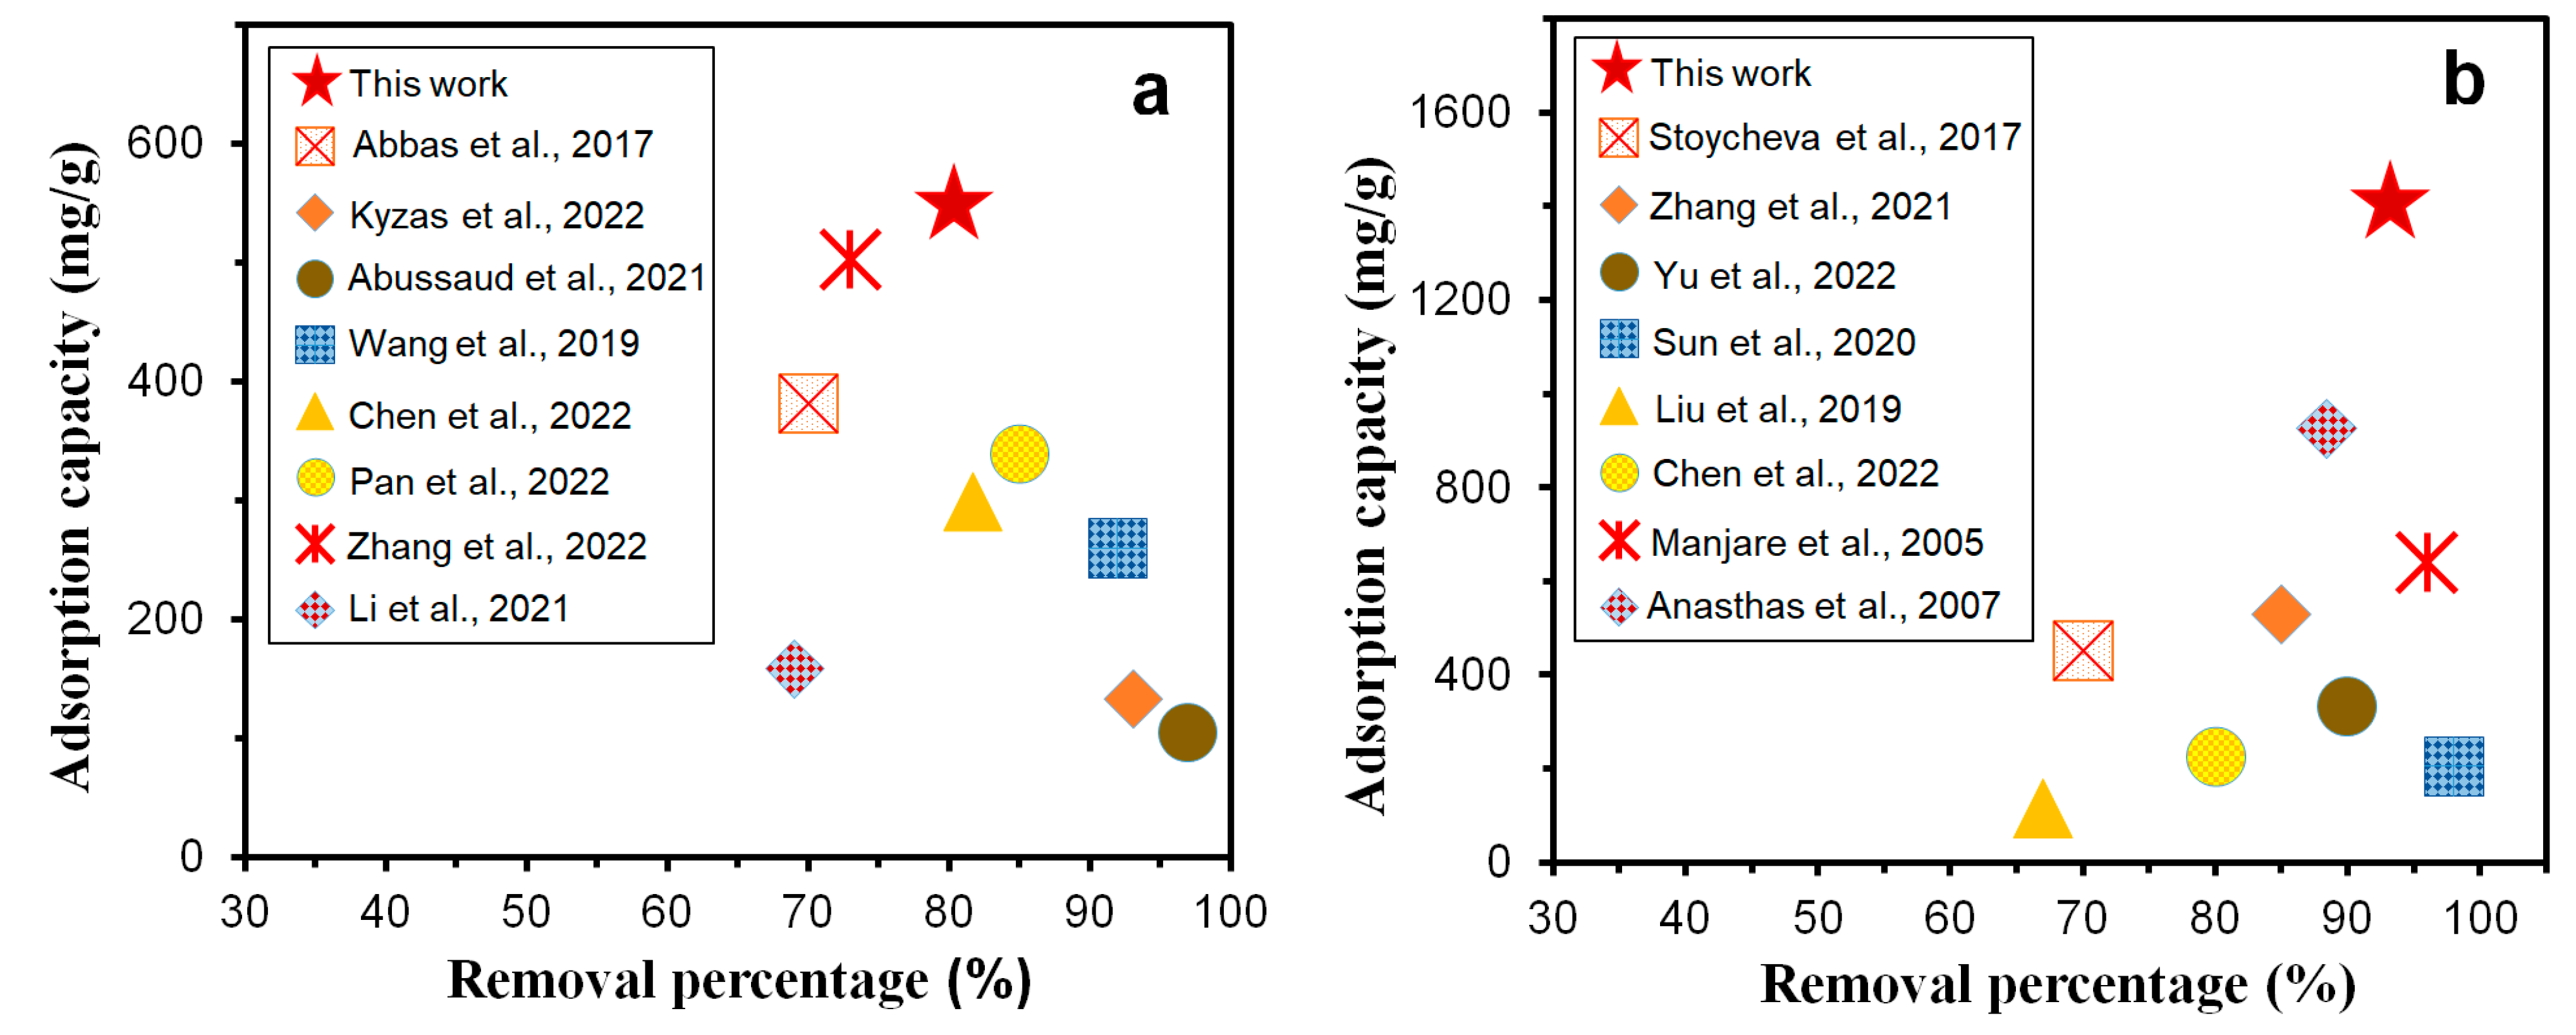
3.6. Adsorption Performance of GQDs@ZIF-8 Composites for Toluene and Ethyl Acetate

Toluene and ethyl acetate solutions were prepared with concentrations of 400 mg/L and 800 mg/L, respectively, to test the adsorption performance of ZIF-8 and GQDs@ZIF-8 composites. A pH value of 7, adsorption time of 180 min and sample mass of 20, 40, 60, 80, 100 and 120 mg, respectively, were applied. It is worth noting that the GQD content of 5% was adopted to prepare GQDs@ZIF-8 composites, with the optimal adsorption effect. (Figure S1 in Supplementary Materials). Then, the effects of the adsorbent mass on the removal percentage of ZIF-8 and GQDs@ZIF-8 were investigated, as shown in Figure 8. With the continuous increase in the adsorbent mass, the removal percentages of toluene and ethyl acetate are significantly improved and finally tend to be stable and reach equilibrium. ZIF-8 and GQDs@ZIF-8 show strong adsorption ability for toluene and ethyl acetate in the early stage of adsorption. When the mass of GQDs@ZIF-8 composites increases from 20 mg to 120 mg, the removal percentage for toluene increases from 34.13% to 80.25%, while the removal percentage for ethyl acetate increases from 35.21% to 93.78%. Figure 8 clearly shows that the addition of GQDs obviously improves the removal percentage of ZIF-8, which increases from 75.13% to 80.25% when adsorbing toluene and from 87.94% to 93.78% when adsorbing ethyl acetate. In general, the removal percentage of porous materials for VOCs mainly depends on the specific surface area of the material. Although the specific surface area test results in Figure 6 show that the addition of GQDs slightly reduces the specific surface area of ZIF-8, GQDs@ZIF-8 exhibits a higher removal percentage for both adsorbates. This special adsorption phenomenon reveals the synergistic effect between GQDs and ZIF-8. The hydroxyl groups on the surface of GQDs and the imidazole groups in ZIF-8 can combine to form hydrogen bonds, resulting in the formation of new pore channels which increase the adsorption capacity of the composites for the adsorbate. In addition, GQDs with a large number of functional groups on the surface also provide active sites for toluene and ethyl acetate molecules, which are favorable for binding with adsorbate molecules. At the same time, since both GQDs and toluene molecules have benzene ring structures, the π–π bond interaction between them can also promote the adsorption of toluene [43].
The influence of the pH value on the removal percentage of ZIF-8 and GQDs@ZIF-8 is shown in Figure 9. In this measurement, the sample mass of 100 mg, toluene concentration of 400 mg/L, ethyl acetate concentration of 800 mg/L, adsorption time of 180 min and pH value of 3, 5, 7, 9 and 11, respectively, were applied. It is obvious that both samples have a special response to the pH value of the toluene and ethyl acetate solution. Both acidic and basic conditions enhance the removal percentages of toluene and ethyl acetate, which is mainly due to the protonation and deprotonation of active sites at the edge of GQDs. As a kind of nanomaterial with a conjugated structure, GQDs contain abundant dissociable groups such as amino groups, carboxyl groups and hydroxyl groups on the surface, and the degree of dissociation directly depends on the pH value of the solution. The hydroxyl groups and imidazole groups in ZIF-8 can combine to form hydrogen bonds, which lead to the formation of new pore channels, thereby increasing the adsorption ability of the composites. In addition, the abundant functional groups on the surface also provide numerous active sites, which are favorable for binding with adsorbate molecules.
To investigate the influence of the contact time on the adsorption property of ZIF-8 and GQDs@ZIF-8 composites, the adsorption capacities of the adsorbent samples at different adsorption times (5, 15, 30, 60, 120, 180 and 360 min, respectively) were recorded and are shown in Figure 10. In this measurement, the sample mass of 100 mg, toluene concentration of 400 mg/L, ethyl acetate concentration of 800 mg/L and pH value of 7 were applied. It can be seen that, within 60 min of contact time, both the adsorption speed and adsorption capacity of the samples to toluene and ethyl acetate increases rapidly. When the contact time is 60 min, the adsorption capacities of ZIF-8 and GQDs@ZIF-8 for toluene are 480.73 mg/g and 519.56 mg/g, respectively. Meanwhile, the adsorption capacities of ZIF-8 and GQDs@ZIF-8 for ethyl acetate are 1040.56 mg/g and 1104.63 mg/g, respectively. When the contact time is longer than 120 min, the adsorption capacity of ZIF-8 and GQDs@ZIF-8 reaches saturation and remains unchanged. The maximum adsorption capacities of GQDs@ZIF-8 composites for toluene and ethyl acetate are 552.31 mg/g and 1408.59 mg/g, respectively. Compared to ZIF-8, the maximum adsorption capacities for toluene and ethyl acetate are increased by 53.82 mg/g and 104.56 mg/g, respectively. In addition, the curve also reveals that, in the absence of other variables, the optimal adsorption times of ZIF-8 and GQDs@ZIF-8 for toluene and ethyl acetate are both 120 min.
To investigate the cyclic adsorption properties of the GQDs@ZIF-8 composites, five adsorption-desorption cycles were conducted, and the adsorption capacities after each cycle were measured, as shown in Figure 11. To carry out the desorption process, the samples that experienced adsorption were heated in a tube furnace to 150 °C for 1 h, with a N2 flow of 0.2 L/min as the protection gas, then the samples were taken out to obtain desorbed composites. The adsorption capacity of the GQDs@ZIF-8 composites for toluene in the initial cycle is 552.31 mg/g. After five cycles, the adsorption capacity is 497.35 mg/g, with a cycle stability (Cs = Qt/Q1) of 90.1%, while the adsorption capacity for ethyl acetate in the initial cycle is 1408.59 mg/g. After five cycles, the adsorption capacity is 1241.86 mg/g, with a cycle stability of 88.3%. The high cycle stability of the composites reveals the stable combination of GQDs and ZIF-8. The zeta potential analysis result also shows that GQDs and ZIF-8 have established a stable connection through strong electrostatic attraction effect (Table S1 in Supplementary Materials), which is consistent with this result. During the adsorption-desorption cycle, the nano-micro hierarchical porous structure of the composites makes it easier to adsorb and desorb dye molecules. In the first two cycles, the loss rate of the cycle stability is slightly higher, and then tends to be stable. This is because the desorption process was a heat treatment, which weakens the link between GQDs and ZIF-8 and reduces the cycle stability of the composites. However, even after five rounds of adsorption-desorption cycles, the adsorption capacity of the composites is around 90% of the initial level. Thus, the prepared GQDs@ZIF-8 composites have both excellent adsorption capacity and high cycle stability.
The adsorption capacity and adsorption rate of previous adsorbents for toluene and ethyl acetate are shown in Figure 12 [44,45,46,47,48,49,50,51,52,53,54,55,56,57,58,59]. Compared with other adsorbents, the GQDs@ZIF-8 composites exhibit excellent performance both in adsorption capacity and in removal percentage due to their unique nano-micro hierarchical pore structures generated from the optimized matching of GQDs and ZIF-8. These structures not only possess a high specific surface area, but also maintain high cycle stability, as shown in Figure 11, which make the GQDs@ZIF-8 composite an ideal candidate for the highly efficient removal of VOCs.

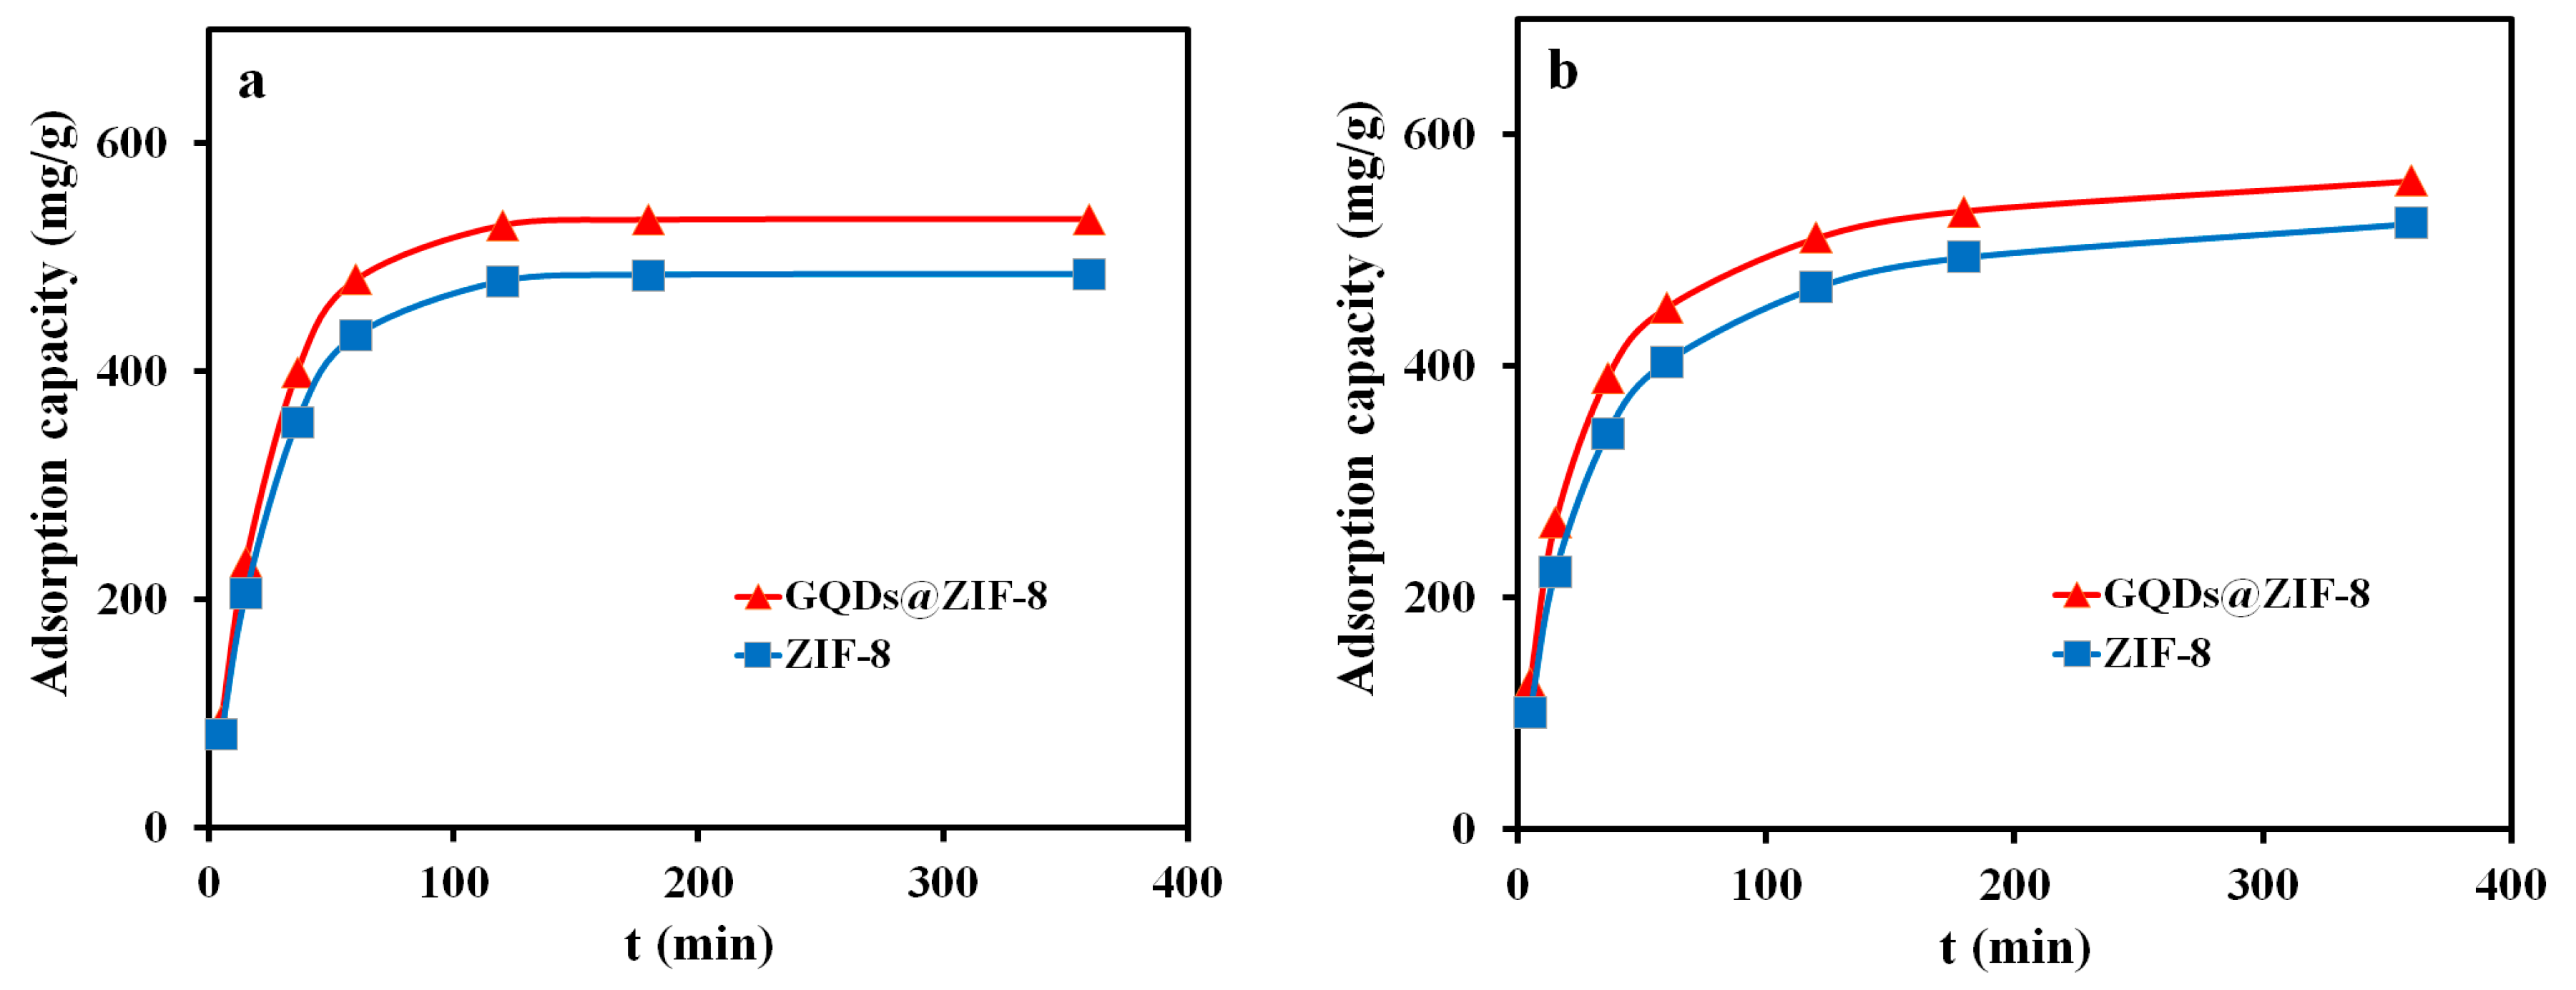
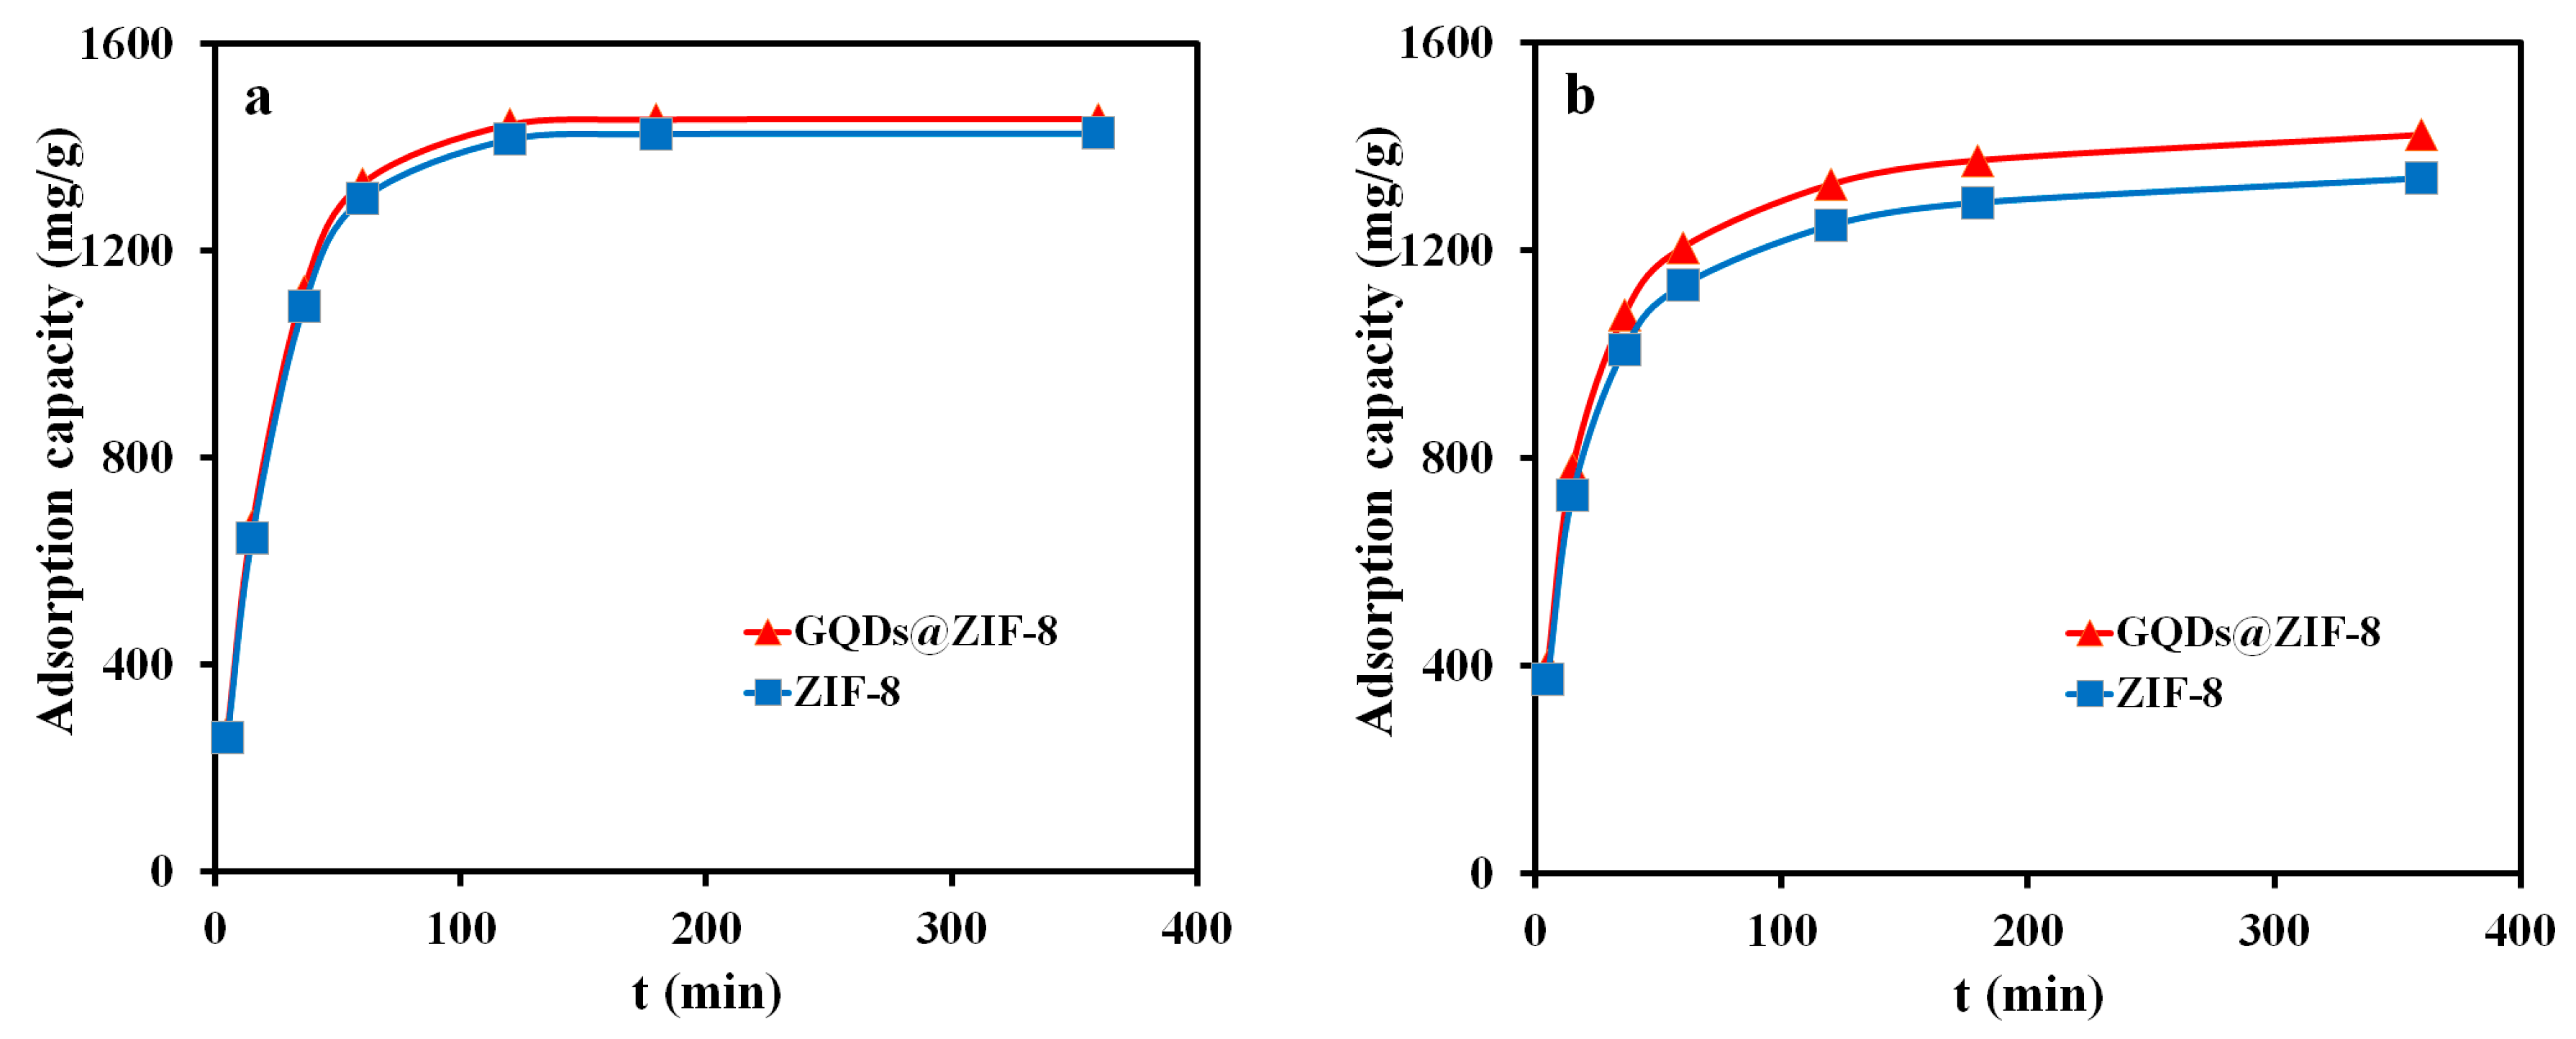
3.7. Adsorption Kinetics Study of GQDs@ZIF-8 Composites

In order to further study the adsorption process of GQDs@ZIF-8 composites on VOC simulants (toluene solution and ethyl acetate solution), pseudo-first-order (PFO) kinetic models and pseudo-second-order (PSO) kinetic models were adopted to fit the experimental data according to the adsorption capacity of ZIF-8 and GQDs@ZIF-8 at different adsorption times. The PFO kinetic model and PSO kinetic model can be described by the following formulas [60,61,62]:
ln Q e Q t = ln Q e k 1 t
t Q t = 1 k 2 Q e 2 + t Q e
where Qe is the equilibrium adsorption capacity (mg/g), Qt is the adsorption capacity at time t (mg/g), k1 is the PFO kinetic constant (min−1) and k2 is the PSO kinetic constant (g/(mg/min)).
In addition, chi-square error (χ2) analysis [62] was adopted to evaluate the fitting quality by investigating the calculated results and experimental results, which can be described by the following equation:
χ 2 = i = 1 n ( Q e , exp Q e , c a l ) 2 Q e , c a l i
where Qe,exp and Qe,cal represent the experimental and calculated values of the equilibrium adsorption capacity, respectively.
Based on the experimental results in Figure 10, the PFO model and PSO model of ZIF-8 and GQDs@ZIF-8 adsorption to toluene and ethyl acetate were fitted and are shown in Figure 13 and Figure 14. The corresponding kinetic parameters were calculated according to the fitting results, as shown in Table 2 and Table 3. In addition, the corresponding experimental conditions were as follows: the sample mass was 100 mg, the toluene concentration was 400 mg/L, the ethyl acetate concentration was 800 mg/L, the pH value was 7 and adsorption times were 5, 15, 30, 60, 120, 180 and 360 min, respectively.
Compared with the experimental results, the PFO and PSO model fitting results displayed good consistency with the experimental data, and the kinetic simulation also provided the theoretical adsorption capacity (Qe,c). After comparison, it was found that the experimental adsorption capacity of the GQDs@ZIF-8 composites is very close to the calculated adsorption capacity. The experimental adsorption capacity for toluene is 552.31 mg/g, while the PFO and PSO model calculation results are 533.57 mg/g and 588.23 mg/g, and the χ2 values are 0.66 and 2.19, respectively. In addition, when used for the adsorption of ethyl acetate, the experimental adsorption capacity of GQDs@ZIF-8 composites is 1408.59 mg/g, with PFO and PSO model calculation results of 1453.93 mg/g and 1474.31 mg/g and χ2 values of 1.41 and 2.93, respectively. Thus, based on the values of χ2 and R2 listed in Table 2 and Table 3, the adsorption processes of the GQDs@ZIF-8 composites are more consistent with the PFO model. The fitting results show that the adsorption process of the composites to the adsorbate molecules is mainly a physical adsorption process, including electrostatic adsorption generated by the surface functional groups and channel-filling adsorption generated by the nano-micro hierarchical porous structures in the GQDs@ZIF-8 composites.

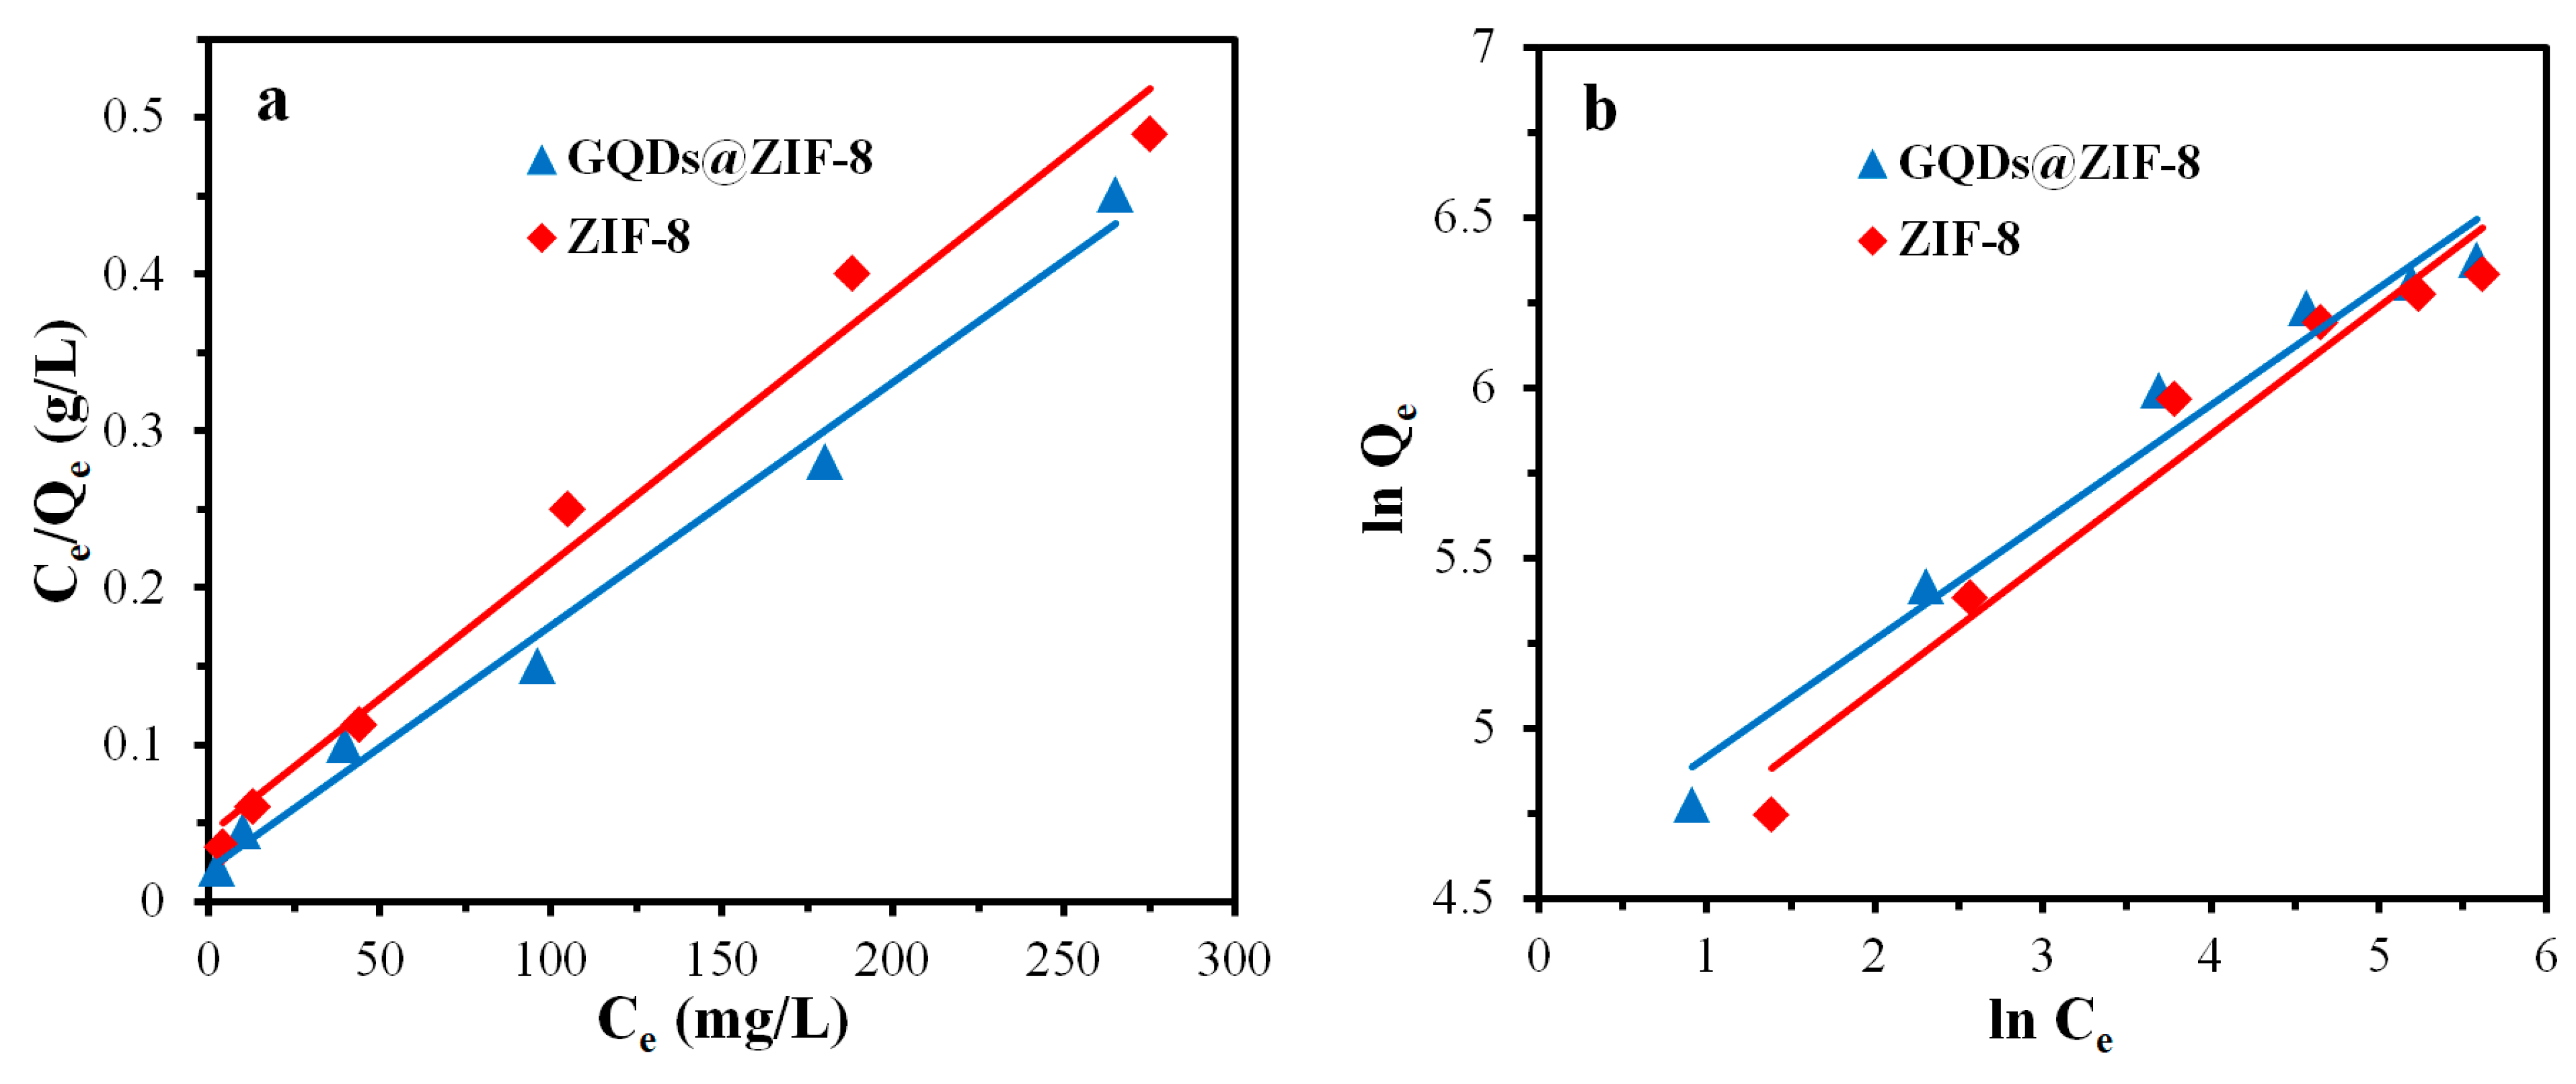
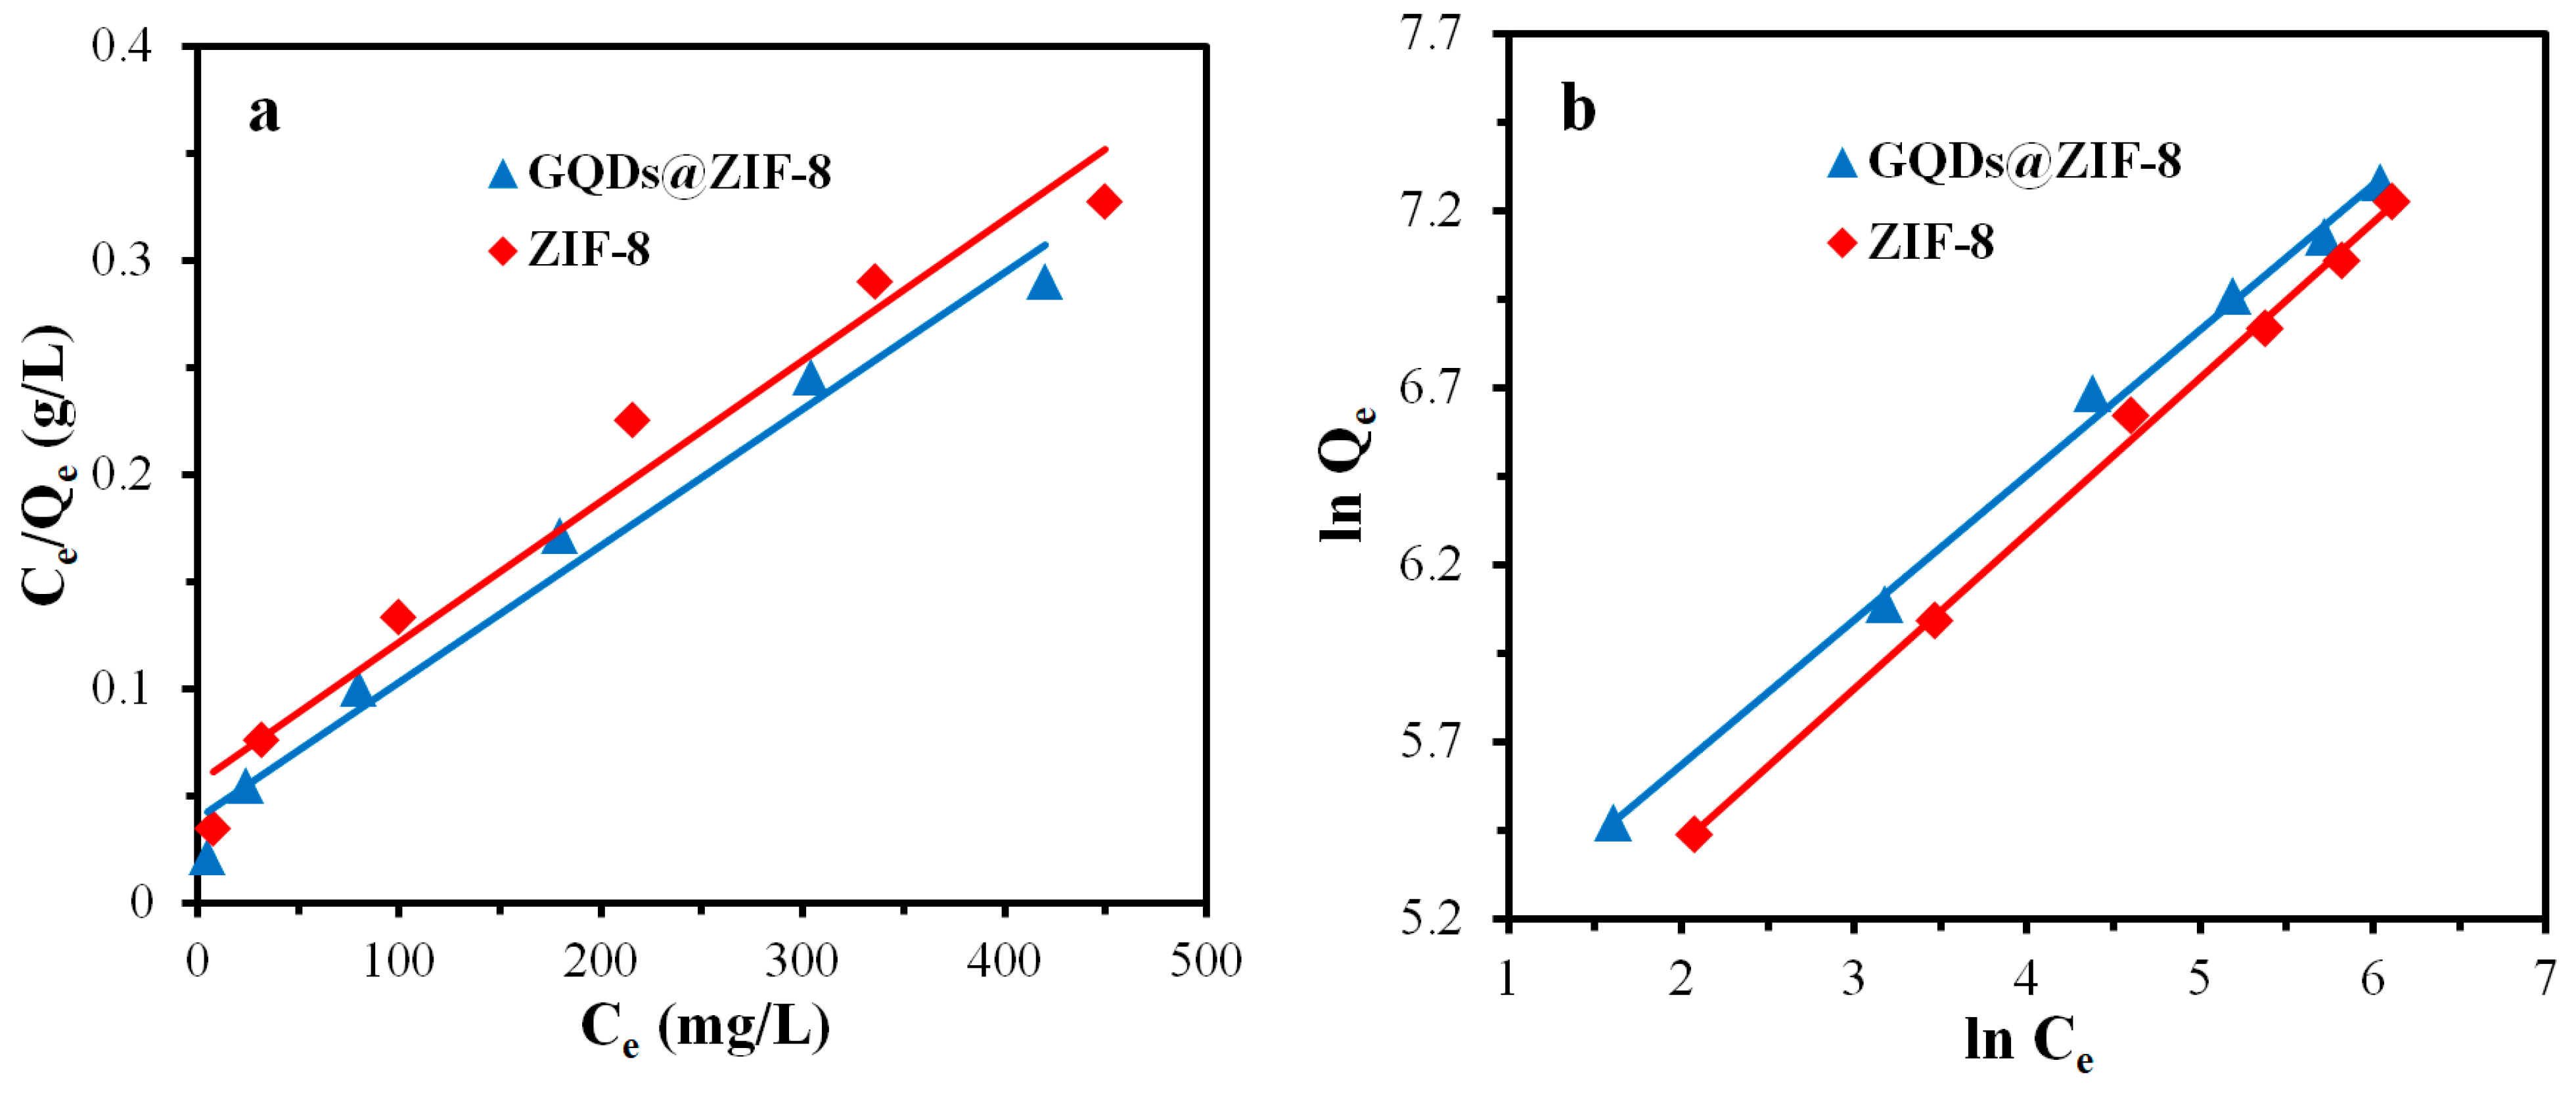
3.8. Adsorption Isotherm Study of GQDs@ZIF-8 Composites

The Langmuir isotherm model and Freundlich isotherm model, which can be described by Equations (6) and (7), respectively [60,61,62], were used to investigate the adsorption isotherm processes.
C e Q e = 1 k L Q m + C e Q m
ln Q e = ln k F + 1 n ln C e
where Ce is the equilibrium concentration of the adsorbate solution (mg/L), Qe is the equilibrium adsorption capacity (mg/g), Qm is the maximum adsorption capacity (mg/g), kL is the Langmuir constant (L/mg), kF is the Freundlich constant and 1/n is the coefficient.
ZIF-8 and GQDs@ZIF-8 composites with a mass of 50 mg were immersed in toluene solutions with different concentrations of 50, 100, 200, 300, 400 and 500 mg/L to obtain the adsorption capacity of toluene. The composites with the same weight were immersed in ethyl acetate solutions with different concentrations of 100, 200, 400, 600, 800 and 1000 mg/L to obtain the adsorption capacity of ethyl acetate. After that, the fitting plots based on the Langmuir model and Freundlich model were drawn, as shown in Figure 15 and Figure 16, with the calculated equilibrium constants listed in Table 4 and Table 5, respectively. It can be seen from the fitting results that the theoretical maximum adsorption capacities of the composite for toluene and ethyl acetate are 628.93 mg/g and 1567.39 mg/g, respectively, while the experimental maximum adsorption capacities are 552.31 mg/g and 1408.59 mg/g, respectively, indicating that the experimental adsorption capacities of the composites are lower than the theoretical value. This comparison result reveals that the adsorption performance of the composite still has the potential to be further improved. Meanwhile, the fitting effect of the relevant linear coefficients of the Freundlich isotherm model is better, revealing that the adsorption of toluene and ethyl acetate molecules by the composite belongs to multi-molecular-layer adsorption, and the value of 1/n between 0.35 and 0.45 indicates that the adsorption process is relatively easy to realize.

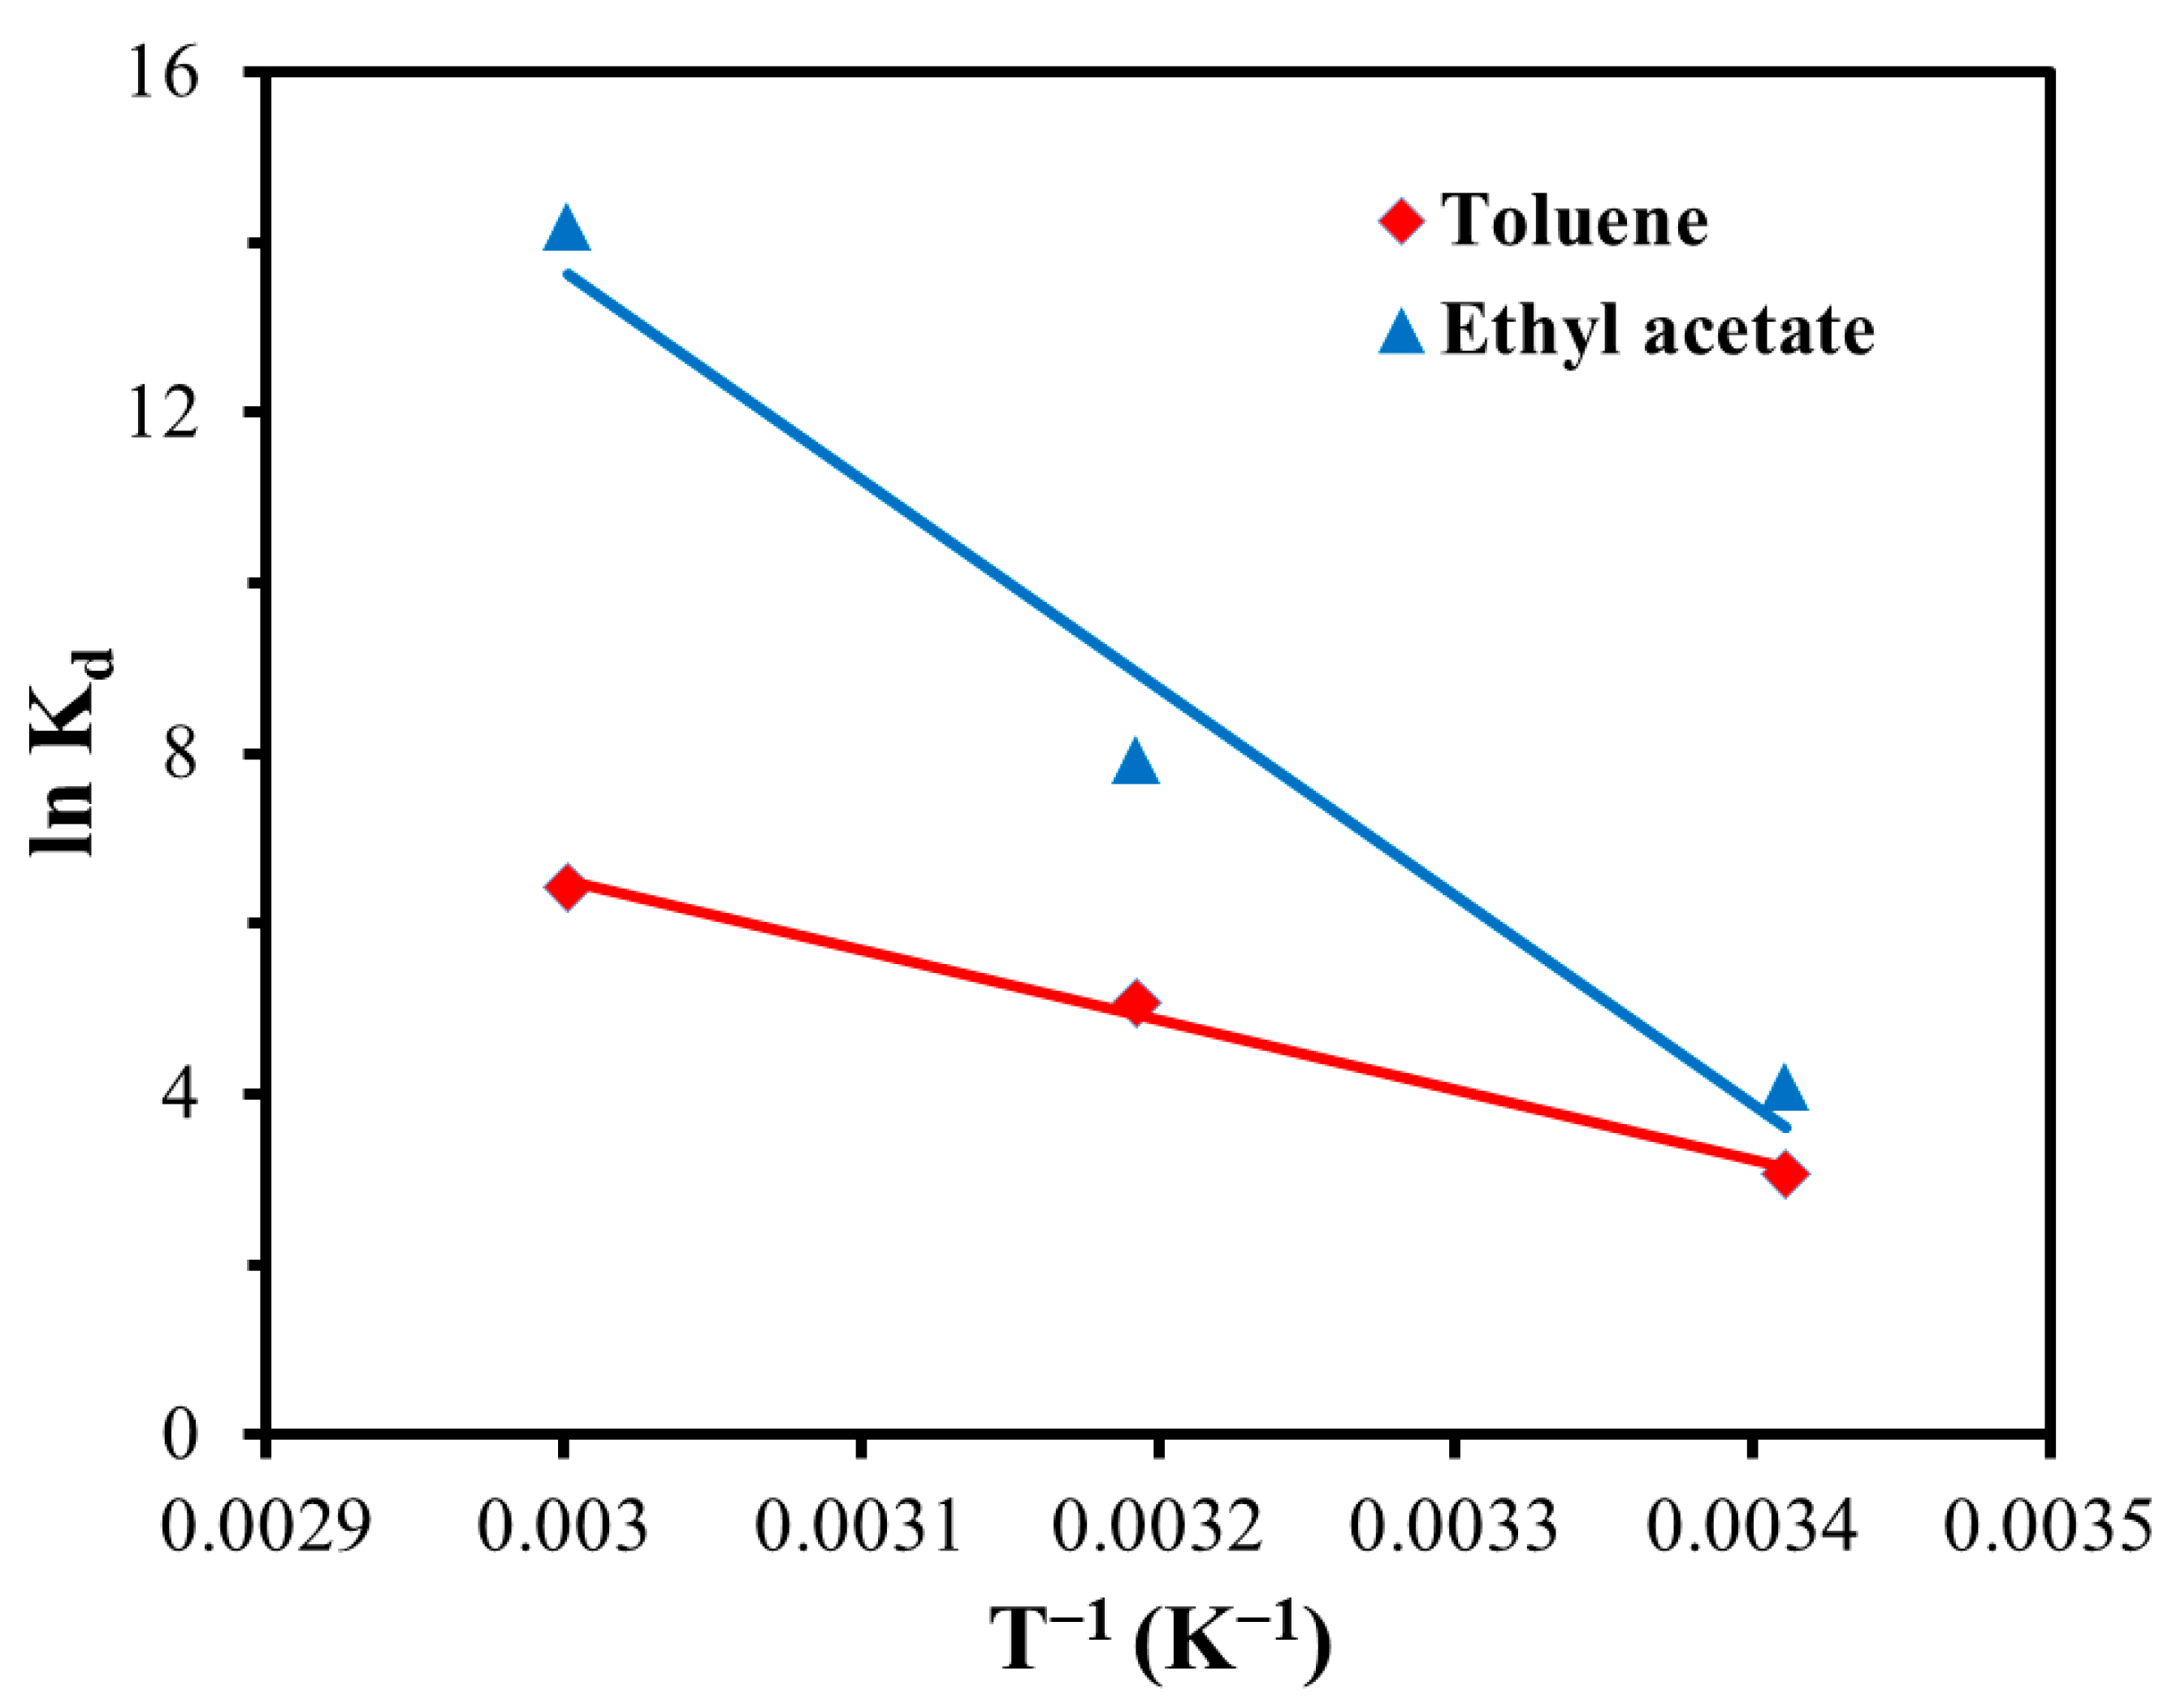
3.9. Adsorption Thermodynamic Study of GQDs@ZIF-8 Composites

To carry out the adsorption thermodynamics study of the GQDs@ZIF-8 composites, the following equations [60,61] were adopted to investigate the thermodynamic parameters of the adsorption process:
Δ G = R T ln K d
ln K d = Δ S R Δ H R T
K d = Q e / C e
where ΔG is the standard Gibbs free energy change (J/mol) in the adsorption process, ΔH is the standard enthalpy change (J/mol) in the adsorption process, ΔS is the standard entropy change (J/(mol·K)) in the adsorption process, R is the molar constant of gas, Kd is the adsorption equilibrium constant and T is the absolute temperature (K).
The adsorption tests were conducted at different temperatures of 20, 40 and 60 °C. GQDs@ZIF-8 composites with a mass of 50 mg were immersed in toluene solution with a concentration 400 mg/L and ethyl acetate solution with a concentration of 800 mg/L. After the measurement of adsorption properties at different temperatures, the thermodynamic fitting results for toluene and ethyl acetate adsorption processes were as shown in Figure 17, with the corresponding calculated thermodynamic parameters listed in Table 6 and Table 7. According to the results, all the values of ΔG < 0, which indicates that the adsorption process is spontaneous. The ΔH values of toluene and ethyl acetate adsorption processes are 32.65 KJ/mol and 58.45 KJ/mol, respectively, revealing that the adsorption processes are endothermic. In addition, the ΔS values of toluene and ethyl acetate adsorption processes are 132.23 J/(mol·K) and 223.98 J/(mol·K), respectively, revealing that the adsorption processes of the composites are at the entropy increase stage, accompanying the increase in the disorder degree both on the surface and inside the GQDs@ZIF-8 composites during the adsorption process.
Based on the above investigation of GQDs@ZIF-8 composites, the possible adsorption mechanism of the composite is illustrated in Figure 18. The adsorption mechanism of the GQD/ZIF-8 composite for toluene and ethyl acetate mainly includes mesoporous channel filling, coordination bonding, hydrogen bonding and π–π interaction mechanisms [43,63]. The channel-filling mechanism fundamentally affects the adsorption performance of the composites. At the initial stage, the adsorbate molecules first diffuse rapidly on the outer surface of the GQDs@ZIF-8 composites, which is mainly achieved through physical adsorption, including macroporous adsorption and electrostatic adsorption on the surface of the composite. A large number of functional groups on the surfaces of GQDs and ZIF-8 can provide abundant active adsorption sites for toluene and ethyl acetate molecules. In the second stage, the adsorbate molecules gradually diffuse into the micropores of the composite and then are adsorbed and deposited in the inner wall of the micropores [64,65]. This stage is controlled by the diffusion rate, and the adsorption speed decreases gradually. In addition, the π–π bond interaction mechanism between the GQDs and toluene molecules can further enhance the adsorption effect of the GQDs@ZIF-8 composites.

4. Conclusions

In this work, GQDs and ZIF-8 were synthesized by the direct pyrolysis method and liquid-phase synthesis method, respectively. Then, a novel GQDs@ZIF-8 composite was obtained by introducing GQDs into the ZIF-8 structure using a solution co-deposition method. The prepared GQDs@ZIF-8 composites were further characterized by TEM, XRD, XPS, FT-IR, TG and N2 adsorption measurements to investigate the morphology, crystal structure, element composition and thermal stability of the composites. The results revealed that GQDs were uniformly decorated on the surface of ZIF-8 nanoparticles, effectively restraining agglomeration and improving the thermal stability of ZIF-8. The composites exhibit a large specific area of 1312.05 m2/g which provides abundant active sites by the synergistic effect between GQDs and ZIF-8. The influences of the adsorbent mass, contact time and pH value on the adsorption property of the composites were systematically investigated. When toluene and ethyl acetate were chosen as the target pollutants, the maximum adsorption capacity of GQDs@ZIF-8 composites reached 552.31 mg/g and 1408.59 mg/g, respectively, and the maximum removal percentages reached 80.25% and 93.78%, respectively. The kinetics and isotherm study revealed that the adsorption processes are in accordance with the pseudo-first-order kinetic model and the Freundlich isotherm model. The thermodynamic results indicated that the adsorption process of the GQDs@ZIF-8 composites is a spontaneous, endothermic and entropy increase process. To sum up, since the application of GQDs, ZIF-8 and their composites in the field of VOC adsorption has been explored, they have been widely used in the adsorption of various organic solvents, such as dichloromethane, acetone, toluene and ethyl acetate, etc. However, their adsorption properties need to be further improved to meet application requirements. This study further combined GQDs and ZIF-8, taking full advantage of the synergistic effect of microstructures, and obtained GQDs@ZIF-8 composites with excellent adsorption performance, which not only explored the application of GQDs@ZIF-8 composites in the adsorption field, but also provides a new method for the highly efficiency removal of VOCs.

Supplementary Materials

The following supporting information can be downloaded at: https://www.mdpi.com/article/10.3390/nano12224008/s1, Figure S1: Effect of GQD content on the removal percentage of toluene and ethyl acetate; Table S1: ZETA potentials of GQDs, ZIF-8 and the GQDs@ZIF-8 composite.

Author Contributions

Conceptualization, H.L. and Y.C.; Funding acquisition, H.L. and Y.C.; Investigation, J.Z. (Jiajia Zhu) and D.H.; Methodology, J.L., T.L. and J.Z. (Jia Zhu); Supervision, H.L. and Y.C.; Validation, J.L., J.Z. (Jia Zhu) and W.D.; Writing—original draft, H.L. and Y.C.; Writing—review and editing, H.L. and Y.C. All authors have read and agreed to the published version of the manuscript.

Funding

This research was funded by the National Natural Science Foundation of China (51872235), the Key Industrial Chain Project of Shaanxi Province (2018ZDCXL-GY-08-08, 2020ZDLGY11-04), the Fundamental Research Funds for the Central Universities (3102021TS0405) and the Key Research and Development Plan of Shaanxi Province (2020GXLH-Z-031).

Data Availability Statement

Not applicable.

Acknowledgments

The authors would like to thank the Shaanxi Engineering Laboratory for Graphene New Carbon Materials and Applications.

Conflicts of Interest

The authors declare no conflict of interest.

References

  1. Li, Q.Q.; Su, G.J.; Li, C.Q.; Liu, P.F.; Zhao, X.X.; Zhang, C.L.; Sun, X.; Mu, Y.J.; Wu, M.G.; Wang, Q.L.; et al. An investigation into the role of VOCs in SOA and ozone production in Beijing, China. Sci. Total. Environ. 2020, 720, 137536. [Google Scholar] [CrossRef] [PubMed]
  2. Kim, Y.M.; Harrad, S.; Harrison, R.M. Concentrations and sources of VOCs in urban domestic and public microenvironments. Environ. Sci. Technol. 2016, 35, 997–1004. [Google Scholar] [CrossRef] [PubMed]
  3. Zhao, Y.F.; Zhang, M.X.; Yang, C.; Xiang, R.Y.; Yang, X.D.; Cui, L.Z. Performance evaluation and prediction of activated carbon for VOCs via experiments and LFER methods. J. Ind. Eng. Chem. 2022, 116, 385–392. [Google Scholar] [CrossRef]
  4. Shen, X.Q.; Du, X.S.; Yang, D.F.; Ran, J.Y.; Yang, Z.Q.; Chen, Y.R. Influence of physical structures and chemical modification on VOCs adsorption characteristics of molecular sieves. J. Environ. Chem. Eng. 2021, 9, 106729. [Google Scholar] [CrossRef]
  5. Mashabi, R.A.; Khan, Z.A.; Elwakeel, K.Z. Chitosan- or glycidyl methacrylate-based adsorbents for the removal of dyes from aqueous solutions: A review. Mater. Adv. 2022, 3, 5645–5671. [Google Scholar] [CrossRef]
  6. Deng, H.; Pan, T.T.; Zhang, Y.; Wang, L.; Wu, Q.M.; Ma, J.Z.; Shan, W.P.; He, H. Adsorptive removal of toluene and dichloromethane from humid exhaust on MFI, BEA and FAU zeolites: An experimental and theoretical study. Chem. Eng. J. 2020, 394, 124986. [Google Scholar] [CrossRef]
  7. Chen, D.S.; LI, Y.T.; Zhong, X.M.; Zeng, H.M.; Chen, Z.H.; Tang, Z.J.; Cen, C.P. Preparation of novel MOF with multipolar pore and adsorption properties of VOCs. IOP Conf. Ser. Earth Environ. Sci. 2019, 300, 032008. [Google Scholar] [CrossRef]
  8. Wang, H.; Bai, J.Q.; Yin, Y.; Wang, S.F. Experimental and numerical study of SO2 removal from a CO2/SO2 gas mixture in a Cu-BTC metal organic framework. J. Mol. Graph. Model. 2020, 96, 107533. [Google Scholar] [CrossRef]
  9. Jun, B.M.; Al-Hamadani, Y.A.J.; Son, A.; Park, C.M.; Jang, M.; Jang, A.; Kim, N.C.; Yoon, Y. Applications of metal-organic framework based membranes in water purification: A review. Separ. Purif. Technol. 2020, 247, 116947. [Google Scholar] [CrossRef]
  10. Zhou, L.; Zhou, P.; Zhang, Y.L.; Liu, B.Y.; Gao, P.; Guo, S.J. 3D star-like atypical hybrid MOF derived single-atom catalyst boosts oxygen reduction catalysis. J. Energy Chem. 2021, 55, 355–360. [Google Scholar] [CrossRef]
  11. Ahmad, N.; Samavati, A.; Nordin, N.A.H.M.; Jaafar, J.; Ismail, A.F.; Malek, N.A.N.N. Enhanced performance and antibacterial properties of amine-functionalized ZIF-8-decorated GO for ultrafiltration membrane. Separ. Purif. Technol. 2020, 239, 116554. [Google Scholar] [CrossRef]
  12. Meng, X.; Duan, C.; Zhang, Y.L.; Lu, W.L.; Wang, W.L.; Ni, Y.H. Corncob-supported AgNPs@ ZIF-8 nanohybrids as multifunction biosorbents for wastewater remediation: Robust adsorption, catalysis and antibacterial activity. Compos. Sci. Technol. 2020, 200, 108384. [Google Scholar] [CrossRef]
  13. Beni, F.A.; Gholami, A.; Ayati, A.; Shahrak, M.N.; Sillanpaa, M. UV-switchable phosphotungstic acid sandwiched between ZIF-8 and Au nanoparticles to improve simultaneous adsorption and UV light photocatalysis toward tetracycline degradation. Microporous Mesoporous Mater. 2020, 303, 110275. [Google Scholar] [CrossRef]
  14. Li, S.Q.; Zhang, X.D.; Huang, Y.M. Zeolitic imidazolate framework-8 derived nanoporous carbon as an effective and recyclable adsorbent for removal of ciprofloxacin antibiotics from water. J. Hazard. Mater. 2017, 321, 711–719. [Google Scholar] [CrossRef]
  15. Zhou, Y.; Zhou, L.; Zhang, X.H.; Chen, Y.L. Preparation of zeolitic imidazolate framework-8/graphene oxide composites with enhanced VOCs adsorption capacity. Microporous Mesoporous Mater. 2016, 225, 488–493. [Google Scholar] [CrossRef]
  16. Qiu, J.T.; Xu, X.; Liu, B.G.; Guo, Y.; Wang, H.J.; Yu, L.Y.; Jiang, Y.W.; Huang, C.S.; Fan, B.F.; Zeng, Z.; et al. Size-controllable synthesis of zif-8 and derived nitrogen-rich porous carbon for CO2 and vocs adsorption. Chemistryselect. 2022, 7, e202203273. [Google Scholar] [CrossRef]
  17. Meng, X.M.; Yang, L.; Jiang, W.J.; Yao, L. Adsorption of acetone and toluene by N-functionalized porous carbon derived from ZIF-8. J. Ind. Eng. Chem. 2022, 111, 137–146. [Google Scholar] [CrossRef]
  18. Song, Y.C.; Wang, N.; Yang, L.Y.; Wang, Y.G.; Yu, D.; Ouyang, X.K. Facile fabrication of ZIF-8/calcium alginate microparticles for highly efficient adsorption of Pb(Ⅱ) from Aqueous solutions. Ind. Eng. Chem. Res. 2019, 58, 6394–6401. [Google Scholar] [CrossRef]
  19. Wang, C.L.; Yang, R.Q.; Wang, H.F. Synthesis of ZIF-8/fly ash composite for adsorption of Cu2+, Zn2+ and Ni2+ from aqueous solutions. Materials 2020, 13, 214. [Google Scholar] [CrossRef] [Green Version]
  20. Huang, H.D.; Liao, L.; Xu, X.; Zou, M.J.; Liu, F.; Li, N. The electron-transfer based interaction between transition metal ions and photoluminescent graphene quantum dots (GQDs): A platform for metal ion sensing. Talanta 2013, 117, 152–157. [Google Scholar] [CrossRef]
  21. Liu, R.L.; Wu, D.Q.; Feng, X.L.; Mullen, K. Bottom-up fabrication of photoluminescent graphene quantum dots with uniform morphology. J. Am. Chem. Soc. 2011, 133, 15221–15223. [Google Scholar] [CrossRef] [PubMed]
  22. Shi, J.Y.; Lyu, J.; Tian, F.; Yang, M. A fluorescence turn-on biosensor based on graphene quantum dots (GQDs) and molybdenum disulfide (MoS2) nanosheets for epithelial cell adhesion molecule (EpCAM) detection. Biosens. Bioelectron. 2016, 93, 182–188. [Google Scholar] [CrossRef] [PubMed]
  23. Sangam, S.; Gupta, A.; Shakeel, A.; Bhattacharya, R.; Sharma, A.K.; Suhag, D.; Chakrabarti, S.; Garg, S.K.; Chattopadhyay, S.; Basu, B.; et al. Sustainable synthesis of single crystalline sulphur-doped graphene quantum dots for bioimaging and beyond. Green. Chem. 2018, 20, 4245–4259. [Google Scholar] [CrossRef]
  24. Zhang, Z.P.; Zhang, J.; Chen, N.; Qu, L.T. Graphene quantum dots: An emerging material for energy-related applications and beyond. Energy Environ. Sci. 2012, 5, 8869–8890. [Google Scholar] [CrossRef]
  25. Zhou, X.J.; Zhang, Y.; Wang, C.; Wu, X.C.; Yang, Y.Q.; Zheng, B.; Wu, H.X.; Guo, S.W.; Zhang, J.Y. Photo-Fenton reaction of graphene oxide: A new strategy to prepare graphene quantum dots for DNA cleavage. ACS Nano 2012, 6, 6592–6599. [Google Scholar] [CrossRef] [PubMed]
  26. Wang, L.; Zhu, S.J.; Wang, H.Y.; Qu, S.N.; Zhang, Y.L.; Zhang, J.H.; Chen, Q.D.; Xu, H.L.; Han, W.; Yang, B.; et al. Common origin of green luminescence in carbon nanodots and graphene quantum dots. ACS Nano 2014, 8, 2541–2547. [Google Scholar] [CrossRef]
  27. Mahmoud, M.E.; Fekry, N.A.; El-Latif, M.M.A. Nanocomposites of nanosilica-immobilized-nanopolyaniline and crosslinked nanopolyaniline for removal of heavy metals. Chem. Eng. J. 2016, 304, 679–691. [Google Scholar] [CrossRef]
  28. Manna, S.; Bhattacharya, S.; Sengupta, S.; Das, P. Synthesis of graphene oxide dots coated biomatrices and its application for the removal of multiple pollutants present in wastewater. J. Clean. Prod. 2018, 203, 83–88. [Google Scholar] [CrossRef]
  29. Nagaraj, A.; Munusamy, M.A.; Al-Arfaj, A.A.; Rajan, M. Functional ionic liquid- capped graphene quantum dots for chromium removal from chromium contaminated water. J. Chem. Eng. Data 2018, 64, 651–667. [Google Scholar] [CrossRef]
  30. Shao, S.F.; Wang, W.; Zhou, K.; Jiang, F.; Wu, H.Y.; Koehn, R. GQDs-TiO2 heterojunction based thin films for volatile organic compounds sensor with excellent performance at room temperature. Mater. Lett. 2017, 186, 193–197. [Google Scholar] [CrossRef]
  31. Alivand, M.S.; Tehrani, N.H.M.H.; Askarieh, M.; Ghasemy, E.; Esrafili, M.D.; Ahmadi, R.; Anisi, H.; Tavakoli, O.; Rashidi, A. Defect engineering-induced porosity in graphene quantum dots embedded metal-organic frameworks for enhanced benzene and toluene adsorption. J. Hazard. Mater. 2021, 416, 125973. [Google Scholar] [CrossRef]
  32. Chowdhury, A.D.; Doong, R. Highly sensitive and selective detection of nanomolar ferric ions using dopamine functionalized graphene quantum dots. ACS Appl. Mater. Inter. 2016, 8, 21002–21010. [Google Scholar] [CrossRef]
  33. Zhang, D.; Xiang, Q. Simple and efficient size-controllable engineering of zeolitic imidazolate framework (ZIF-8) and M-ZIF-8 by changing addition order. Mater. Lett. 2021, 289, 129418. [Google Scholar] [CrossRef]
  34. Saliba, D.; Ammar, M.; Rammal, M.; Al-Ghoul, M.; Hmadeh, M. Crystal growth of ZIF-8, ZIF-67, and their mixed-metal derivatives. J. Am. Chem. Soc. 2018, 140, 1812–1823. [Google Scholar] [CrossRef]
  35. Ahmad, N.; Nordin, N.A.; Jaafar, J.; Ismail, A.F.; Ramli, M.K. Significant improvement in antibacterial property of ZIF-8 decorated graphene oxide by post-synthetic modification process. J. Environ. Chem. Eng. 2021, 9, 105887. [Google Scholar] [CrossRef]
  36. Chen, K.W.; Wang, P.; Gu, A.T.; Miensah, E.D.; Gong, C.H.; Mao, P.; Jiao, Y.; Chen, K.; Liu, Y.; Yang, Y. Core-shell Bi2S3 nanorods loaded ZIF-8 nanocomposites for efficient and reversible capture of radioactive iodine. Microporous Mesoporous Mater. 2022, 339, 111983. [Google Scholar] [CrossRef]
  37. Hassanpouraghdam, Y.; Pooresmaeil, M.; Namazi, H. In-vitro evaluation of the 5-fluorouracil loaded GQDs@Bio-MOF capped with starch biopolymer for improved colon-specific delivery. Int. J. Biol. Macromol. 2022, 221, 256–267. [Google Scholar] [CrossRef]
  38. Wei, X.Y.; Wang, Y.W.; Huang, Y.; Fan, C.M. Composite ZIF-8 with CQDs for boosting visible-light-driven photocatalytic removal of NO. J. Alloys Compd. 2019, 802, 467–476. [Google Scholar] [CrossRef]
  39. Jayaramulu, K.; Datta, K.K.R.; Rosler, C.; Petr, M.; Otyepka, M.; Zboril, R.; Fischer, R.A. Biomimetic superhydrophobic/superoleophilic highly fluorinated graphene oxide and ZIF-8 composites for oil-water separation. Angew. Chem. Int. Edit. 2016, 55, 1178–1182. [Google Scholar] [CrossRef]
  40. Ono, H.; Ikarashi, T.; Miura, Y.; Hasegawa, E.; Ando, K.; Kitano, T. Bonding configurations of nitrogen absorption peak at 960 cm(-1) in silicon oxynitride films. Appl. Phys. Lett. 1999, 74, 203–205. [Google Scholar] [CrossRef]
  41. Li, P.Z.; Aranishi, K.; Xu, Q. ZIF-8 immobilized nickel nanoparticles: Highly effective catalysts for hydrogen generation from hydrolysis of ammonia borane. Chem. Commun. 2012, 48, 3173–3175. [Google Scholar] [CrossRef] [PubMed]
  42. Jian, M.P.; Liu, B.; Zhang, G.S.; Liu, R.P.; Zhang, X.W. Adsorptive removal of arsenic from aqueous solution by zeolitic imidazolate framework-8 (ZIF-8) nanoparticles. Colloid Surfaces A Physicochem. Eng. Asp. 2015, 465, 67–76. [Google Scholar] [CrossRef]
  43. Bhadra, B.N.; Song, J.Y.; Lee, S.K.; Hwang, Y.K.; Jhung, S.H. Adsorptive removal of aromatic hydrocarbons from water over metal azolate framework-6-derived carbons. J. Hazard. Mater. 2018, 344, 1069–1077. [Google Scholar] [CrossRef] [PubMed]
  44. Abbas, A.; Abussaud, B.A.; Ihsanullah; Al-Baghli, N.A.H.; Redhwi, H.H. Adsorption of toluene and paraxylene from aqueous solution using pure and iron oxide impregnated carbon nanotubes: Kinetics and isotherms study. Bioinorg. Chem. Appl. 2017, 2017, 2853925. [Google Scholar] [CrossRef] [PubMed] [Green Version]
  45. Kyzas, G.Z.; McKay, G.; Al-Musawi, T.J.; Salehi, S.; Balarak, D. Removal of benzene and toluene from synthetic wastewater by adsorption onto magnetic zeolitic imidazole framework nanocomposites. Nanomaterials 2022, 12, 3049. [Google Scholar] [CrossRef]
  46. Abussaud, B.A. Synthesis, Characterization and application of carbon nanotubes decorated with zinc oxide nanoparticles for removal of benzene, toluene and p-xylene from aqueous solution. Sustainability 2021, 13, 11716. [Google Scholar] [CrossRef]
  47. Wang, Y.L.; Li, Z.H.; Tang, C.; Ren, H.X.; Zhang, Q.; Xue, M.; Xiong, J.; Wang, D.B.; Yu, Q.; He, Z.Y.; et al. Few-layered mesoporous graphene for high-performance toluene adsorption and regeneration. Environ. Sci.-Nano 2019, 6, 3113–3122. [Google Scholar] [CrossRef]
  48. Chen, Y.X.; Fan, C.M.; Li, X.L.; Ren, J.M.; Zhang, G.Z.; Xie, H.M.; Liu, B.Y.; Zhou, G.L. Preparation of carbon black-based porous carbon adsorbents and study of toluene adsorption properties. J. Chem. Technol. Biot. 2022. [Google Scholar] [CrossRef]
  49. Pan, T.T.; Wang, Y.Q.; Liu, F.; Liu, C.S.; Li, W.X. Stable Metal-Organic Frameworks based mixed tetramethylammonium hydroxide for toluene adsorption. J. Solid State Chem. 2022, 306, 122732. [Google Scholar] [CrossRef]
  50. Zhang, J.J.; Shao, J.A.; Zhang, X.; Rao, G.; Li, G.Y.; Yang, H.P.; Zhang, S.H.; Chen, H.P. Facile synthesis of Cu-BTC@biochar with controlled morphology for effective toluene adsorption at medium–high temperature. Chem. Eng. J. 2022, 452, 139003. [Google Scholar] [CrossRef]
  51. Li, W.X.; Wang, W.L.; Sun, J.; Ma, X.L.; Dong, Y.L. Hydrophobic modification of UiO-66 by naphthyl ligand substitution for efficient toluene adsorption in a humid environment. Microporous Mesoporous Mater. 2021, 326, 111357. [Google Scholar] [CrossRef]
  52. Stoycheva, I.G.; Tsyntsarski, B.G.; Petrova, B.N.; Kumanek, B.; Budinova, T.K.; Petrov, N.V. Adsorption of Ethyl Acetate from Water by Nanoporous Carbon Prepared from Waste Materials. Water Air Soil Poll. 2017, 227, 452. [Google Scholar] [CrossRef]
  53. Zhang, M.Y.; Sui, H.; Yang, H.W.; Li, X.G.; He, L.; Liu, J.J. Adsorption-desorption behaviors of methanol and ethyl acetate on silica gel: Modeling and experimental tests. Ind. Eng. Chem. Res. 2021, 60, 1829–1838. [Google Scholar] [CrossRef]
  54. Yu, S.Y.; Wang, X.Y.; Liu, F.; Xiao, K.K.; Kang, C.L. Adsorption of acetone, ethyl acetate and toluene by beta zeolite/diatomite composites: Preparation, characterization and adsorbability. Environ. Sci. Pollut. Res. 2022, 29, 80646–80656. [Google Scholar] [CrossRef]
  55. Sun, L.; Yuan, D.; Liu, R.R.; Wan, S.G.; Lu, X.J. Coadsorption of gaseous xylene, ethyl acetate and water onto porous biomass carbon foam pellets derived from liquefied Vallisneria natans waste. J. Chem. Technol. Biot. 2020, 95, 1348–1360. [Google Scholar] [CrossRef]
  56. Liu, Y.T.; Tian, T. Fabrication of diatomite/silicalite-1 composites and their property for vocs adsorption. Materials 2019, 12, 551. [Google Scholar] [CrossRef] [Green Version]
  57. Chen, H.; Mu, X.Y.; Ma, J.; Yao, M.Q.; Liu, F. Performance evaluation of functionalized ordered mesoporous silica for VOCs adsorption by molecular dynamics simulation. Arab. J. Chem. 2022, 15, 104192. [Google Scholar] [CrossRef]
  58. Manjare, S.; Ghoshal, A. Studies on dynamic adsorption behaviour of ethyl acetate from air on 5a and 13x molecular sieves. Can. J. Chem. Eng. 2005, 83, 232–241. [Google Scholar] [CrossRef]
  59. Anasthas, H.; Gaikar, V. Removal of acetic acid impurities from ethyl acetate by adsorption on ion exchange resins. Sep. Sci. Technol. 2007, 36, 2623–2646. [Google Scholar] [CrossRef]
  60. Omer, A.S.; Naeem, G.; Abd-Elhamid, A.; Farahat, O.; ElBardan, A.; Soliman, H.; Nayl, A. Adsorption of crystal violet and methylene blue dyes using a cellulose-based adsorbent from sugercane bagasse: Characterization, kinetic and isotherm studies. J. Mater. Res. Technol. 2022, 19, 3241–3254. [Google Scholar] [CrossRef]
  61. Neolaka, Y.; Lawa, Y.; Naat, J.; Riwu, A.; Iqbal, M.; Darmokoesoemo, H.; Kusuma, H.S. The adsorption of Cr(VI) from water samples using graphene oxide-magnetic (GO-Fe3O4) synthesized from natural cellulose-based graphite (kusambi wood or Schleichera oleosa): Study of kinetics, isotherms and thermodynamics. J. Mater. Res. Technol. 2020, 9, 6544–6556. [Google Scholar] [CrossRef]
  62. Elgarahy, A.M.; Al-Mur, B.A.; Akhdhar, A.; El-Sadik, H.A.; El-Liethy, M.A.; Elwakeel, K.Z.; Salama, A.M. Biosorption kinetics of cerium(III) and cobalt(II) from liquid wastes using individual bacterial species isolated from low-level liquid radioactive wastes. Environ. Sci. Pollut. Res. 2022, 23241. [Google Scholar] [CrossRef] [PubMed]
  63. Shafiei, M.; Alivand, M.S.; Rashidi, A.; Samimi, A.; Mohebbi-Kalhori, D. Synthesis and adsorption performance of a modified micro-mesoporous MIL-101(Cr) for VOCs removal at ambient conditions. Chem. Eng. J. 2018, 341, 164–174. [Google Scholar] [CrossRef]
  64. Saini, V.K.; Pires, J. Development of metal organic fromwork-199 immobilized zeolite foam for adsorption of common indoor VOCs. J. Environ. Sci. 2017, 55, 321–330. [Google Scholar] [CrossRef]
  65. Vellingiri, K.; Kumar, P.; Deep, A.; Kim, K.H. Metal-organic frameworks for the adsorption of gaseous toluene under ambient temperature and pressure. Chem. Eng. J. 2017, 307, 1116–1126. [Google Scholar] [CrossRef]
Figure 1. Standard working curves of toluene (a) and ethyl acetate solution (b). (The blue squares represent testing results, and the red lines represent fitting results).
Nanomaterials 12 04008 g001
Figure 2. Morphology and microstructure images of GQDs@ZIF-8 composites. (a) TEM image of GQDs@ZIF-8, (b) TEM image of GQDs with diameter distribution graph, (c) HRTEM image of GQDs@ZIF-8, (d) HRTEM image of a signal GQD.
Nanomaterials 12 04008 g002
Figure 3. XRD patterns of GQDs, ZIF-8 and the GQDs@ZIF-8 composites. (a) Measurement results, (b) standard XRD pattern of ZIF-8. Adapted with permission from reference [34]. Copyright 2018, American Chemical Society.
Nanomaterials 12 04008 g003
Figure 4. FT-IR spectra of GQDs, ZIF-8 and the GQDs@ZIF-8 composites.
Nanomaterials 12 04008 g004
Figure 5. XPS survey spectra of ZIF-8 and GQDs@ZIF-8 composites (a), C 1s spectra with the colorful curves representing the characteristic peaks of C–C, C–N, C–O and C–S, respectively (b), N 1s spectra (c), Zn 2p spectra (d).
Nanomaterials 12 04008 g005
Figure 6. N2 adsorption–desorption isotherms with the hollow dots corresponding to adsorption process and the solid dots corresponding to desorption process (a), and pore size distribution (b) of ZIF-8 and GQDs@ZIF-8 composites.
Nanomaterials 12 04008 g006
Figure 7. TG and DTG curves of ZIF-8 and GQDs@ZIF-8 composites, with the green arrows indicating the vertical coordinates corresponding to different curves.
Nanomaterials 12 04008 g007
Figure 8. Effect of adsorbent mass on the removal percentage of toluene (a) and ethyl acetate (b).
Nanomaterials 12 04008 g008
Figure 9. Effect of pH value on removal percentage of toluene (a) and ethyl acetate (b).
Nanomaterials 12 04008 g009
Figure 10. Effect of contact time on the adsorption properties of toluene (a) and ethyl acetate (b).
Nanomaterials 12 04008 g010
Figure 11. The adsorption–desorption cycle stability of the GQDs@ZIF-8 composite for toluene (a), and ethyl acetate (b).
Nanomaterials 12 04008 g011
Figure 12. Comparison between previous works and this work on the adsorption properties of GQDs@ZIF-8 composites for toluene (a) [44,45,46,47,48,49,50,51] and ethyl acetate (b) [52,53,54,55,56,57,58,59].
Nanomaterials 12 04008 g012
Figure 13. PFO (a), PSO (b) fitting curves of ZIF-8 and GQDs@ZIF-8 for toluene adsorption.
Nanomaterials 12 04008 g013
Figure 14. PFO (a), PSO (b) fitting curves of ZIF-8 and GQDs@ZIF-8 for ethyl acetate adsorption.
Nanomaterials 12 04008 g014
Figure 15. Langmuir model (a), Freundlich model (b) fitting curves of ZIF-8 and GQDs@ZIF-8 for toluene adsorption.
Nanomaterials 12 04008 g015
Figure 16. Langmuir model (a), Freundlich model (b) fitting curves of ZIF-8 and GQDs@ZIF-8 for ethyl acetate adsorption.
Nanomaterials 12 04008 g016
Figure 17. Thermodynamic fitting for the adsorption process of GQDs@ZIF-8 composites.
Nanomaterials 12 04008 g017
Figure 18. Adsorption mechanism illustration of the GQDs@ZIF-8 composites.
Nanomaterials 12 04008 g018
Table 1. Specific surface area and pore structure parameters of ZIF-8 and GQDs@ZIF-8.
SampleSBET (m2/g)Smic (m2/g)Vtot (cm3/g)Vmic (cm3/g)D (nm)
ZIF-81368.741298.831.2670.2963.7
GQDs@ZIF-81312.051228.811.2800.6073.9
Note: SBET is the specific surface area, Smic is the micropore surface area, Vtot is the total pore volume, Vmic is the micropore volume, D is the average diameter of the pores.
Table 2. Adsorption kinetic parameters of ZIF-8 and GQDs@ZIF-8 for toluene adsorption.
AdsorbateExperimental Adsorption Capacity
Qe,exp (mg/g)
Pseudo-First-Order
Kinetic Equation
Pseudo-Second-Order
Kinetic Equation
k1 (min−1)Qe,cal (mg/g)R2χ2k2 (g/(mg·min))Qe,cal (mg/g)R2χ2
ZIF-8521.020.036485.460.992.600.000079564.970.943.42
GQDs@ZIF-8552.310.038533.570.980.660.000093588.230.952.19
Table 3. Adsorption kinetic parameters of ZIF-8 and GQDs@ZIF-8 for ethyl acetate adsorption.
AdsorbateExperimental Adsorption Capacity
Qe,exp (mg/g)
Pseudo-First-Order
Kinetic Equation
Pseudo-Second-Order
Kinetic Equation
k1 (min−1)Qe,cal (mg/g)R2χ2k2 (g/(mg·min))Qe,cal (mg/g)R2χ2
ZIF-81326.170.0401388.880.992.830.0000531425.530.946.93
GQDs@ZIF-81408.590.0411453.930.991.410.0000511474.310.972.93
Table 4. Calculated equilibrium constants of the isotherm model for toluene adsorption.
AdsorbentLangmuirFreundlich
Qm (mg/g)KL (L/mg)R2KF (L/mg)1/nR2
ZIF-8588.230.0470.9578.340.380.98
GQDs@ZIF-8628.930.0570.9496.570.350.98
Table 5. Calculated equilibrium constants of the isotherm model for ethyl acetate adsorption.
AdsorbentLangmuirFreundlich
Qm (mg/g)KL (L/mg)R2KF (L/mg)1/nR2
ZIF-81428.570.0120.9593.160.440.99
GQDs@ZIF-81567.390.0160.96123.660.410.99
Table 6. Calculated thermodynamic parameters for toluene adsorption.
T (K)Thermodynamic Parameters
ΔG (KJ/mol)ΔH (KJ/mol)ΔS (J/(mol·K))
293.15−6.0932.65132.23
313.15−8.74
333.15−11.38
Table 7. Calculated thermodynamic parameters for ethyl acetate adsorption.
T (K)Thermodynamic Parameters
ΔG (KJ/mol)ΔH (KJ/mol)ΔS (J/(mol·K))
293.15−7.1858.45223.98
313.15−11.66
333.15−16.14
Publisher’s Note: MDPI stays neutral with regard to jurisdictional claims in published maps and institutional affiliations.

